")
Back to Journals » Clinical Optometry » Volume 15
Visual Functions, Seatbelt Usage, Speed, and Alcohol Consumption Standards for Driving and Their Impact on Road Traffic Accidents
Authors Almatar H , Alamri S, Alduhayan R , Alabdulkader B , Albdah B, Stalin A, Alsomaie B, Almazroa A
Received 23 May 2023
Accepted for publication 16 September 2023
Published 4 October 2023 Volume 2023:15 Pages 225—246
DOI https://doi.org/10.2147/OPTO.S422635
Checked for plagiarism Yes
Review by Single anonymous peer review
Peer reviewer comments 4
Editor who approved publication: Mr Simon Berry
Hessa Almatar,1,2 Suhailah Alamri,1,2 Reema Alduhayan,1,2 Balsam Alabdulkader,3 Bayan Albdah,2,4 Amritha Stalin,5 Barrak Alsomaie,1,2 Ahmed Almazroa1,2
1Department of Imaging Research, King Abdullah International Medical Research Center, Riyadh, 11481, Saudi Arabia; 2King Saud bin Abdulaziz University for Health Sciences, Riyadh, 14611, Saudi Arabia; 3Department of Optometry and Vision Sciences, College of Applied Medical Sciences, King Saud University, Riyadh, 12372, Saudi Arabia; 4Department of Biostatistics and Bioinformatics, King Abdullah International Medical Research center, Riyadh, 11481, Saudi Arabia; 5School of Optometry and Vision Science, University of Waterloo, Waterloo, ON, N2L 3G1, Canada
Correspondence: Ahmed Almazroa, Department of Imaging Research King Abdullah International Medical Research Center, Riyadh, 11481, Saudi Arabia, Tel +9 661 1429 4324, Email [email protected]
Purpose: The incidence of road traffic accidents (RTAs) is dramatically increasing worldwide. Consequently, driving and licensing authorities have instituted strict rules and regulations, such as vision standards, restrictions on drunk driving, seat belt usage, and speeding, for driving safety. This study aimed to summarize the global visual standards for driving license issuing and renewal and investigate the effect of driving safety laws on RTA-related death rates in different countries.
Methods: The study gathered data on visual standards for driving licenses from reliable sources and extracted enforcement scores (drunk driving, seat belt usage, and speeding) and RTA-related death rates from the World Health Organization status report on road safety. The Wilcoxon test explored the association between visual standards and RTA-related death rates, while the Kruskal–Wallis test analyzed the relationship between visual functions and death rates, as well as driving safety enforcement scores and RTA-related death rates.
Results: The analysis was conducted on 71 countries and 50 states within the United States out of the 193 countries listed by the United Nations. It was found that 116 countries and states required a minimum VA range of 6/6– 6/18, while 91 countries and states mandated a similar range for one-eyed drivers. VF testing for driving licenses was necessary in 77 countries and states. No significant association was observed between VA or VF testing and RTA-related death rates. However, countries that conducted more visual function tests demonstrated lower rates of RTA-related fatalities. Furthermore, RTA-related death rates were significantly associated with speeding, drunk driving, and seat belt laws.
Conclusion: Implementing clear policies regarding vision requirements, maintaining strict rules, and promoting law enforcement on speeding, drunk driving, and seat belt usage are crucial for improving road safety. These measures should be prioritized by driving and licensing authorities worldwide to mitigate the escalating incidence of RTAs.
Keywords: traffic collisions, traffic death, vehicle accident, vision standards for driving, vision requirements for driving, driving safety laws
Introduction
Road traffic accidents (RTAs) result in the deaths of 1.3 million individuals worldwide annually.1 Notably, 90% of all road traffic deaths occur in middle-income countries.1 In addition to the deaths, RTAs cause non-fatal injuries in 78 million individuals annually.2 According to the World Health Organization (WHO), road traffic death rates (deaths per 100000 individuals) are estimated at 12.5, 5, and 3 individuals per 100000 in the United States (US), Canada, and the United Kingdom, respectively.3 Furthermore, RTAs may significantly increase the economic and social costs globally.2 RTA-related death or injuries affect individuals and their families, friends, colleagues, and society.4 In the USA, the expenditure for non-fatal RTA-related medical costs was over 31 billion dollars in 2000.5 Road safety places an emphasis on multiple factor.6–8 Factors such as road infrastructure; vehicle characteristics, including aged vehicles; and environmental factors, such as rainfall and extreme cold have a significant impact on road safety and the frequency of RTA fatalities, particularly in low-income countries.6–8 However, human factors, such as drug use, drunk driving, seat belt usage, speeding, and mobile phone usage, have the highest impact on RTA-related deaths.9
WHO released a global status report on road safety that summarizes the current state of driving standards and regulations and the number of RTA-related deaths globally to achieve the goal of driving safety.3 Furthermore, previous efforts investigated the role of human factors on driving safety. Between 2000 and 2013, young drivers were responsible for 84,756 RTA-related fatalities, and 23,757 of these fatalities were due to alcohol consumption.10 The probability of drunk drivers causing a fatal collision is 17.8 times higher than that of non-drunk drivers.11 The probability of fatal or severe RTA-related injuries is higher for drivers not using seat belts.12,13 Moreover, Høye concluded that unbelted drivers have a 8.3 times higher likelihood of being involved in fatal RTAs and a 5.2 times higher risk of sustaining serious injuries than belted drivers.14 Consequently, driving and licensing authorities have instituted strict rules and regulations for maintaining driving safety.
Driving skills are essential and differ over time;15 therefore, a licensing renewal cycle is required in many countries. In the US, the process varies in each state and according to age; for example, the licensing renewal cycle in Arizona is every 12 years for the general population and 5 years for individuals aged ≥65. However, in Australia, it takes from 1–5 years, depending on the license fee that the driver pays.16 Furthermore, once the driver reaches the age of 70 years in the UK, the driving license must be renewed every 3 years.17
Visual acuity (VA) plays an essential role in driving;18 therefore, the process of issuing and renewing a driving license should include a comprehensive assessment of visual functions. Visual awareness of cars and reading the road signs relies heavily on VA. However, the VA test does not provide sufficient information regarding the other visual functions required for driving, such as peripheral vision. Poor visual function results in decreased awareness of objects in the peripheral vision.19 For example, a driver with decreased visual function may not be able to visualize a pedestrian crossing the street while taking a turn. Color vision is another important visual function for driving.20 Drivers with color vision problems experience difficulty in identifying traffic signals and reflectors from other automobiles and bikes.21 Similarly, three-dimensional viewing (depth of perception) is necessary for assessing distances. The distance from the car in front and the distance from the pedestrian lane cannot be accurately assessed without good visual depth perception.22 Additionally, visibility reduces while driving in low-light conditions (at night).23 Older drivers are more affected by this issue; consequently, they are more predisposed to RTAs24 due to aging-related changes in their neurological and optical systems Thus, contrast sensitivity testing is important to provide a better prediction of visual recognition abilities in real-world situations.25
Several studies have contributed to a better understanding of the association between poor vision and an increased risk of RTA. Researchers have investigated the association between RTAs and various visual functions. A recent study conducted by Piyasena et al26 examined the current evidence to assess VFs and their association with traffic safety in low- and middle-income countries. They found a positive correlation between vision impairment and the incidence of traffic accidents. Owsley et al27 investigated the visual risk factors for the incidence of RTAs in patients with cataract. The study determined that patients with cataract were eight times more likely to be involved in RTAs as they show severe contrast sensitivity deterioration. Similarly, Szlyk et al28 examined the association between visual function and driving skills in 25 patients with glaucoma and 29 normal-sighted controls using an interactive driving simulator. Although no significant difference was observed between the driving skills of the patients with glaucoma and control participants, the former group exhibited poorer contrast sensitivity, which correlated with poor driving skills.
Research on driving has expanded over the years and taken multiple approaches, all with the goal of improving driving safety. However, to our knowledge, a global review of minimum vision requirements for obtaining a driving license and the effect of driving safety laws on drunk driving, seat belt usage, speeding, and visual functions on RTA-related death rates in different countries has not been undertaken. Thus, this study aimed to summarize the global vision standards for issuing driving licenses and investigate the impact of driving regulations and vision functions on RTAs to aid policymakers in developing and updating driving regulations and guidelines for issuing and renewing driving licenses to improve road safety.
Methods
Eligibility Criteria
Sourcing the information was challenging as all governments did not publish precise information regarding driving vision standards on their official websites. Therefore, countries with unavailable or inaccessible visual assessment information were excluded. Only the countries with vision requirements available in English were included.
Information Sources
All countries were specified and retrieved from the United Nations (UN) list of recognized countries through the UN website. The data regarding the vision standard for driving of each country was extracted from various reliable sources, such as governmental websites, published articles, publicly issued reports, and for-profit and non-profit scientific organizations. RTA-related data were obtained from the websites of the transport agencies of the country and the data banks of organizations. The effectiveness of enforcing road safety laws regarding speed limits, drunk driving, and seat belt usage, which were the only car-related factors and were scored from 0–10, were retrieved from the most recent WHO global status report on road safety.3
Search Strategy
Literature review was performed for the period between 2019 and 2021. A Google search was performed using the names of the countries placed after the following keywords: “driving vision standards”, “driver license vision standards”, “driver license requirements”, “RTAs death rate”, “RTAs fatality rate”, “road crashes deaths”, and “road safety laws”.
Countries and Data Selection
The data selection process is illustrated in Figure 1.
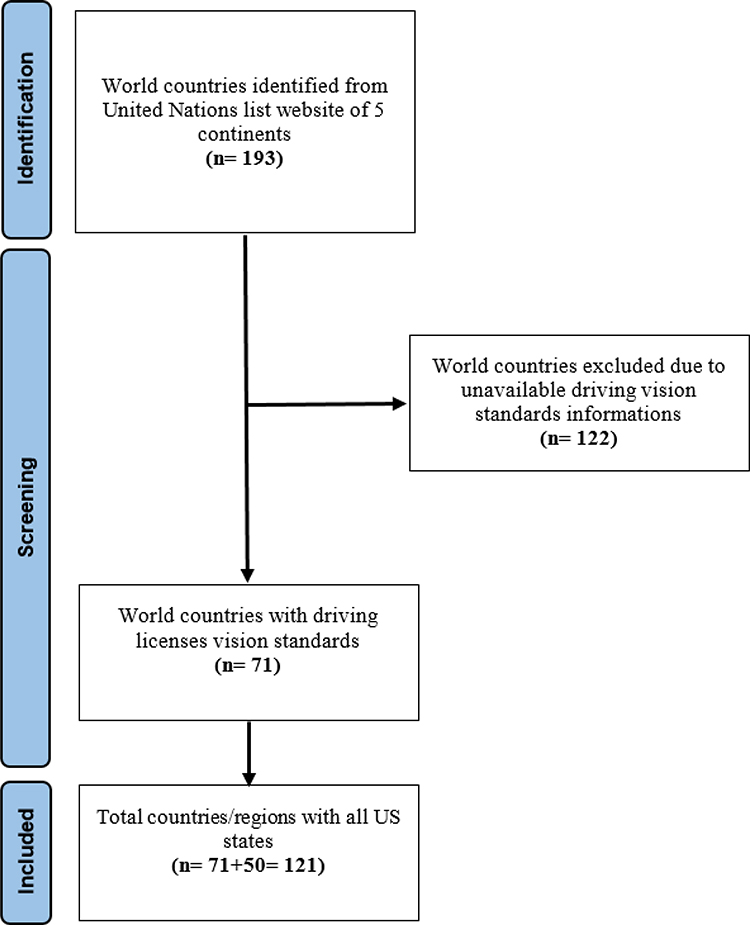 |
Figure 1 Data selection process meeting the eligibility criteria. Notes: PRISMA figure adapted from Page MJ, McKenzie JE, Bossuyt PM, Boutron I, Hoffmann TC, Mulrow CD, et al. The PRISMA 2020 statement: an updated guideline for reporting systematic reviews. BMJ. 2021;372:n71. Creative Commons.29 |
Quality Assessment
The review concerned the driving visual requirements issued by the countries listed by the UN. The required information was extracted from various resources such as governmental websites and data organizations (each is referenced in the Tables). The RTA-related death rates of each country were determined using the WHO global status report on road safety.3 Hence, the details were insufficient to assess the risk of bias and were categorized as (insufficient data), as suggested by the Cochrane Handbook.30
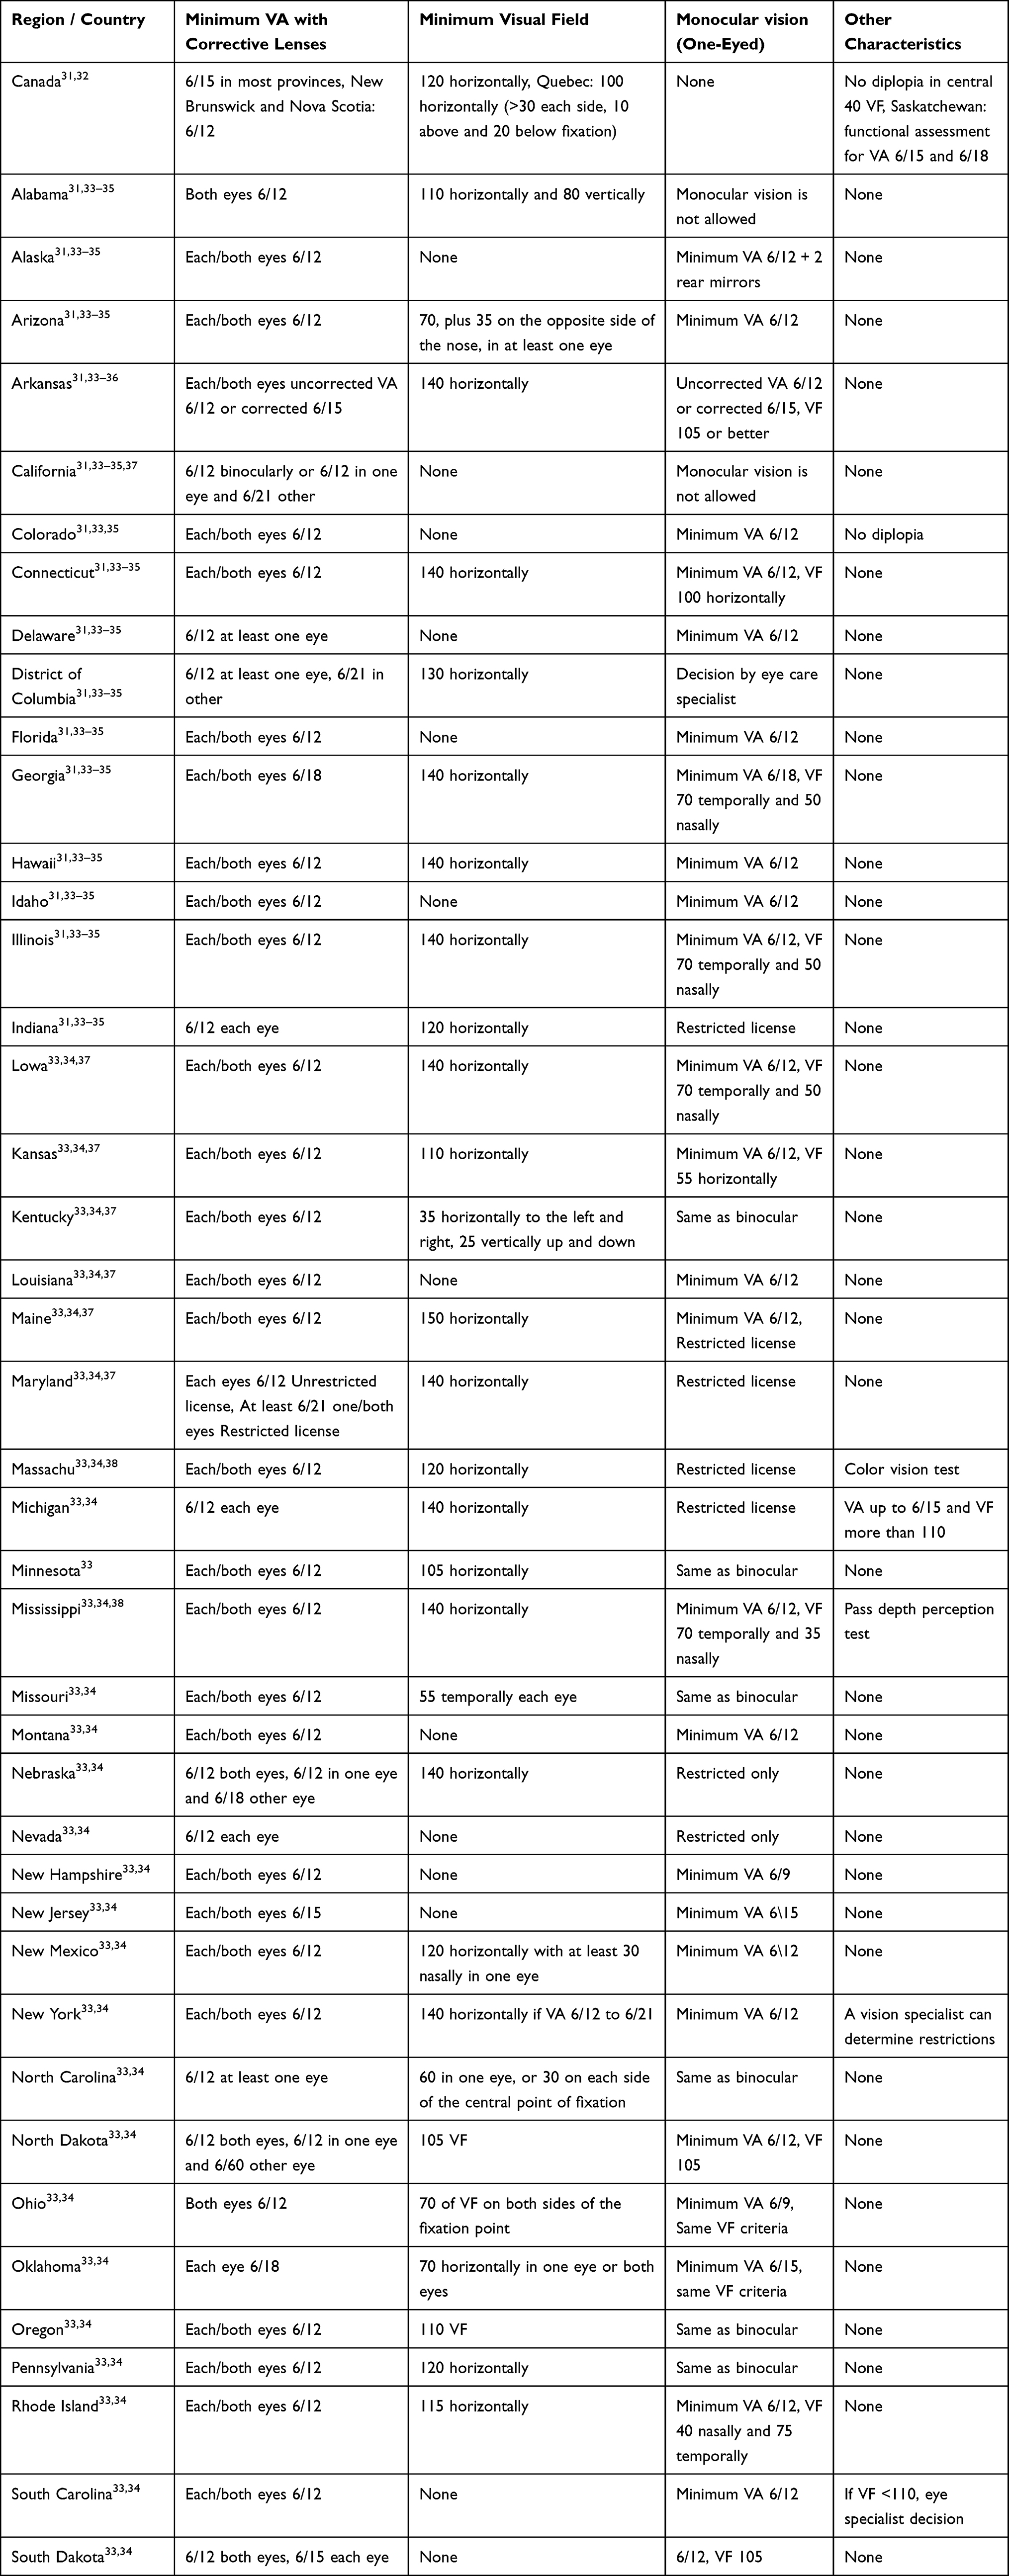 |
Table 1 Visual Standards for Driving in the Americas |
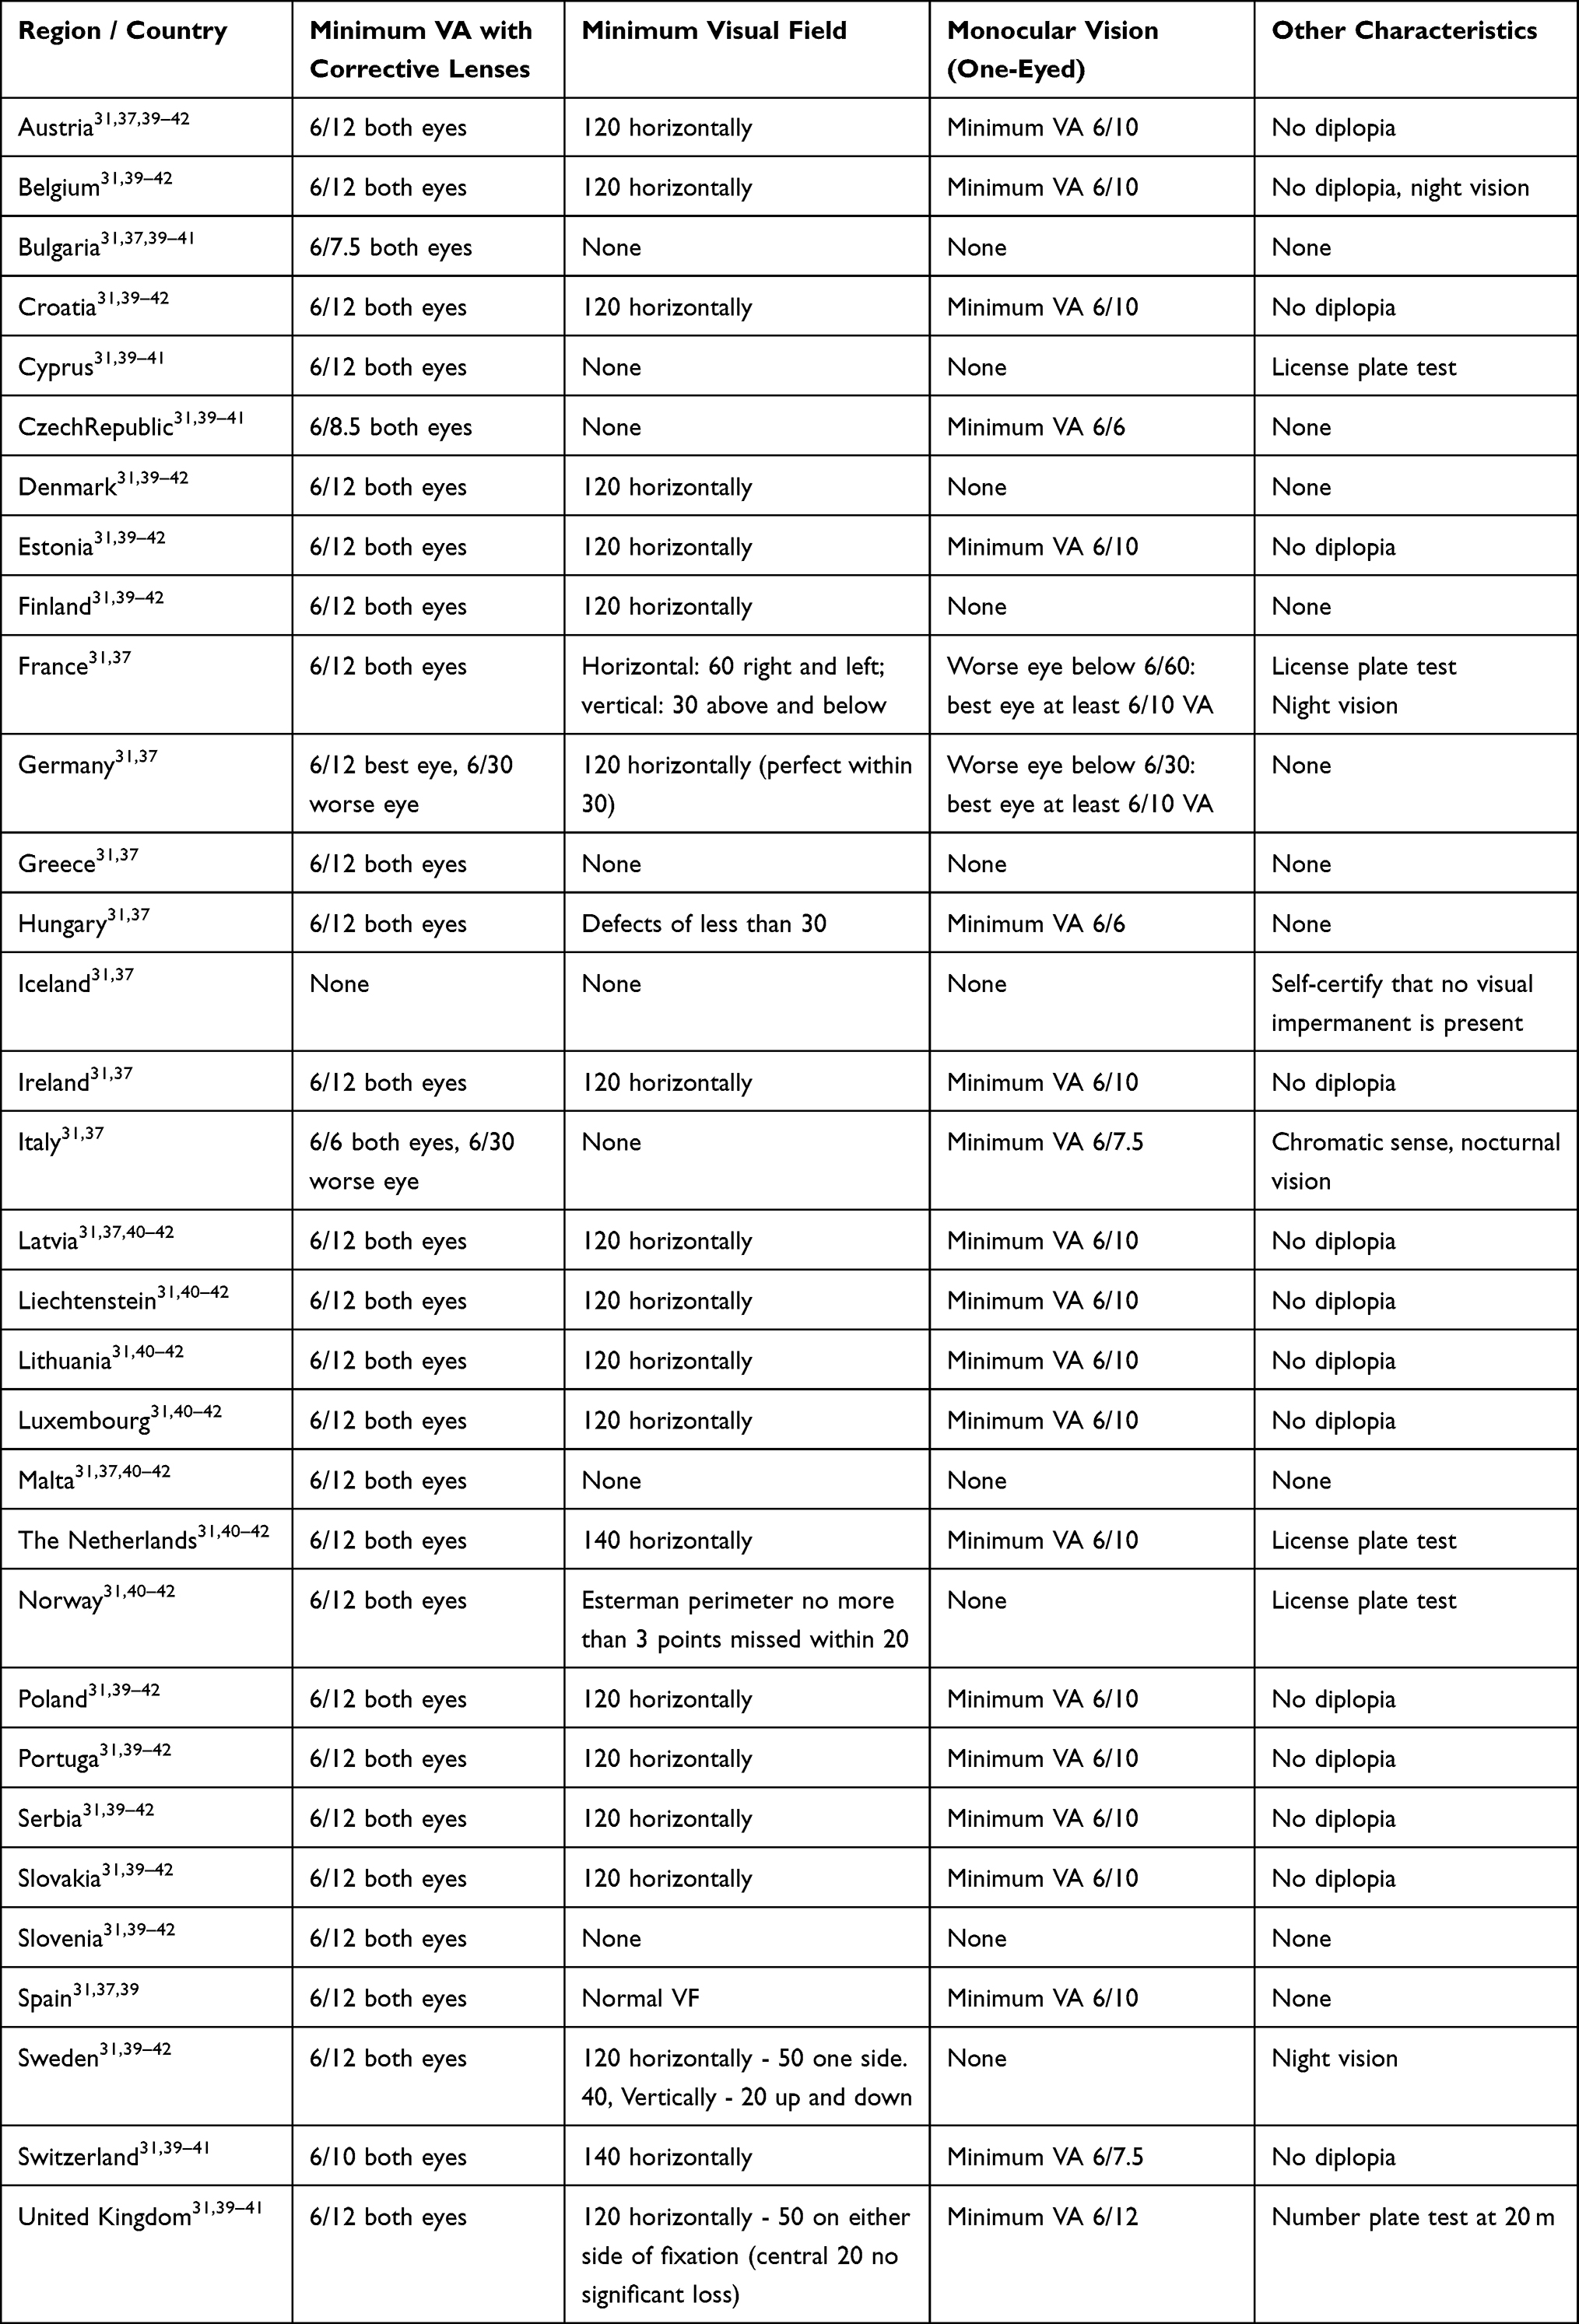 |
Table 2 Visual Standards for Driving in Europe |
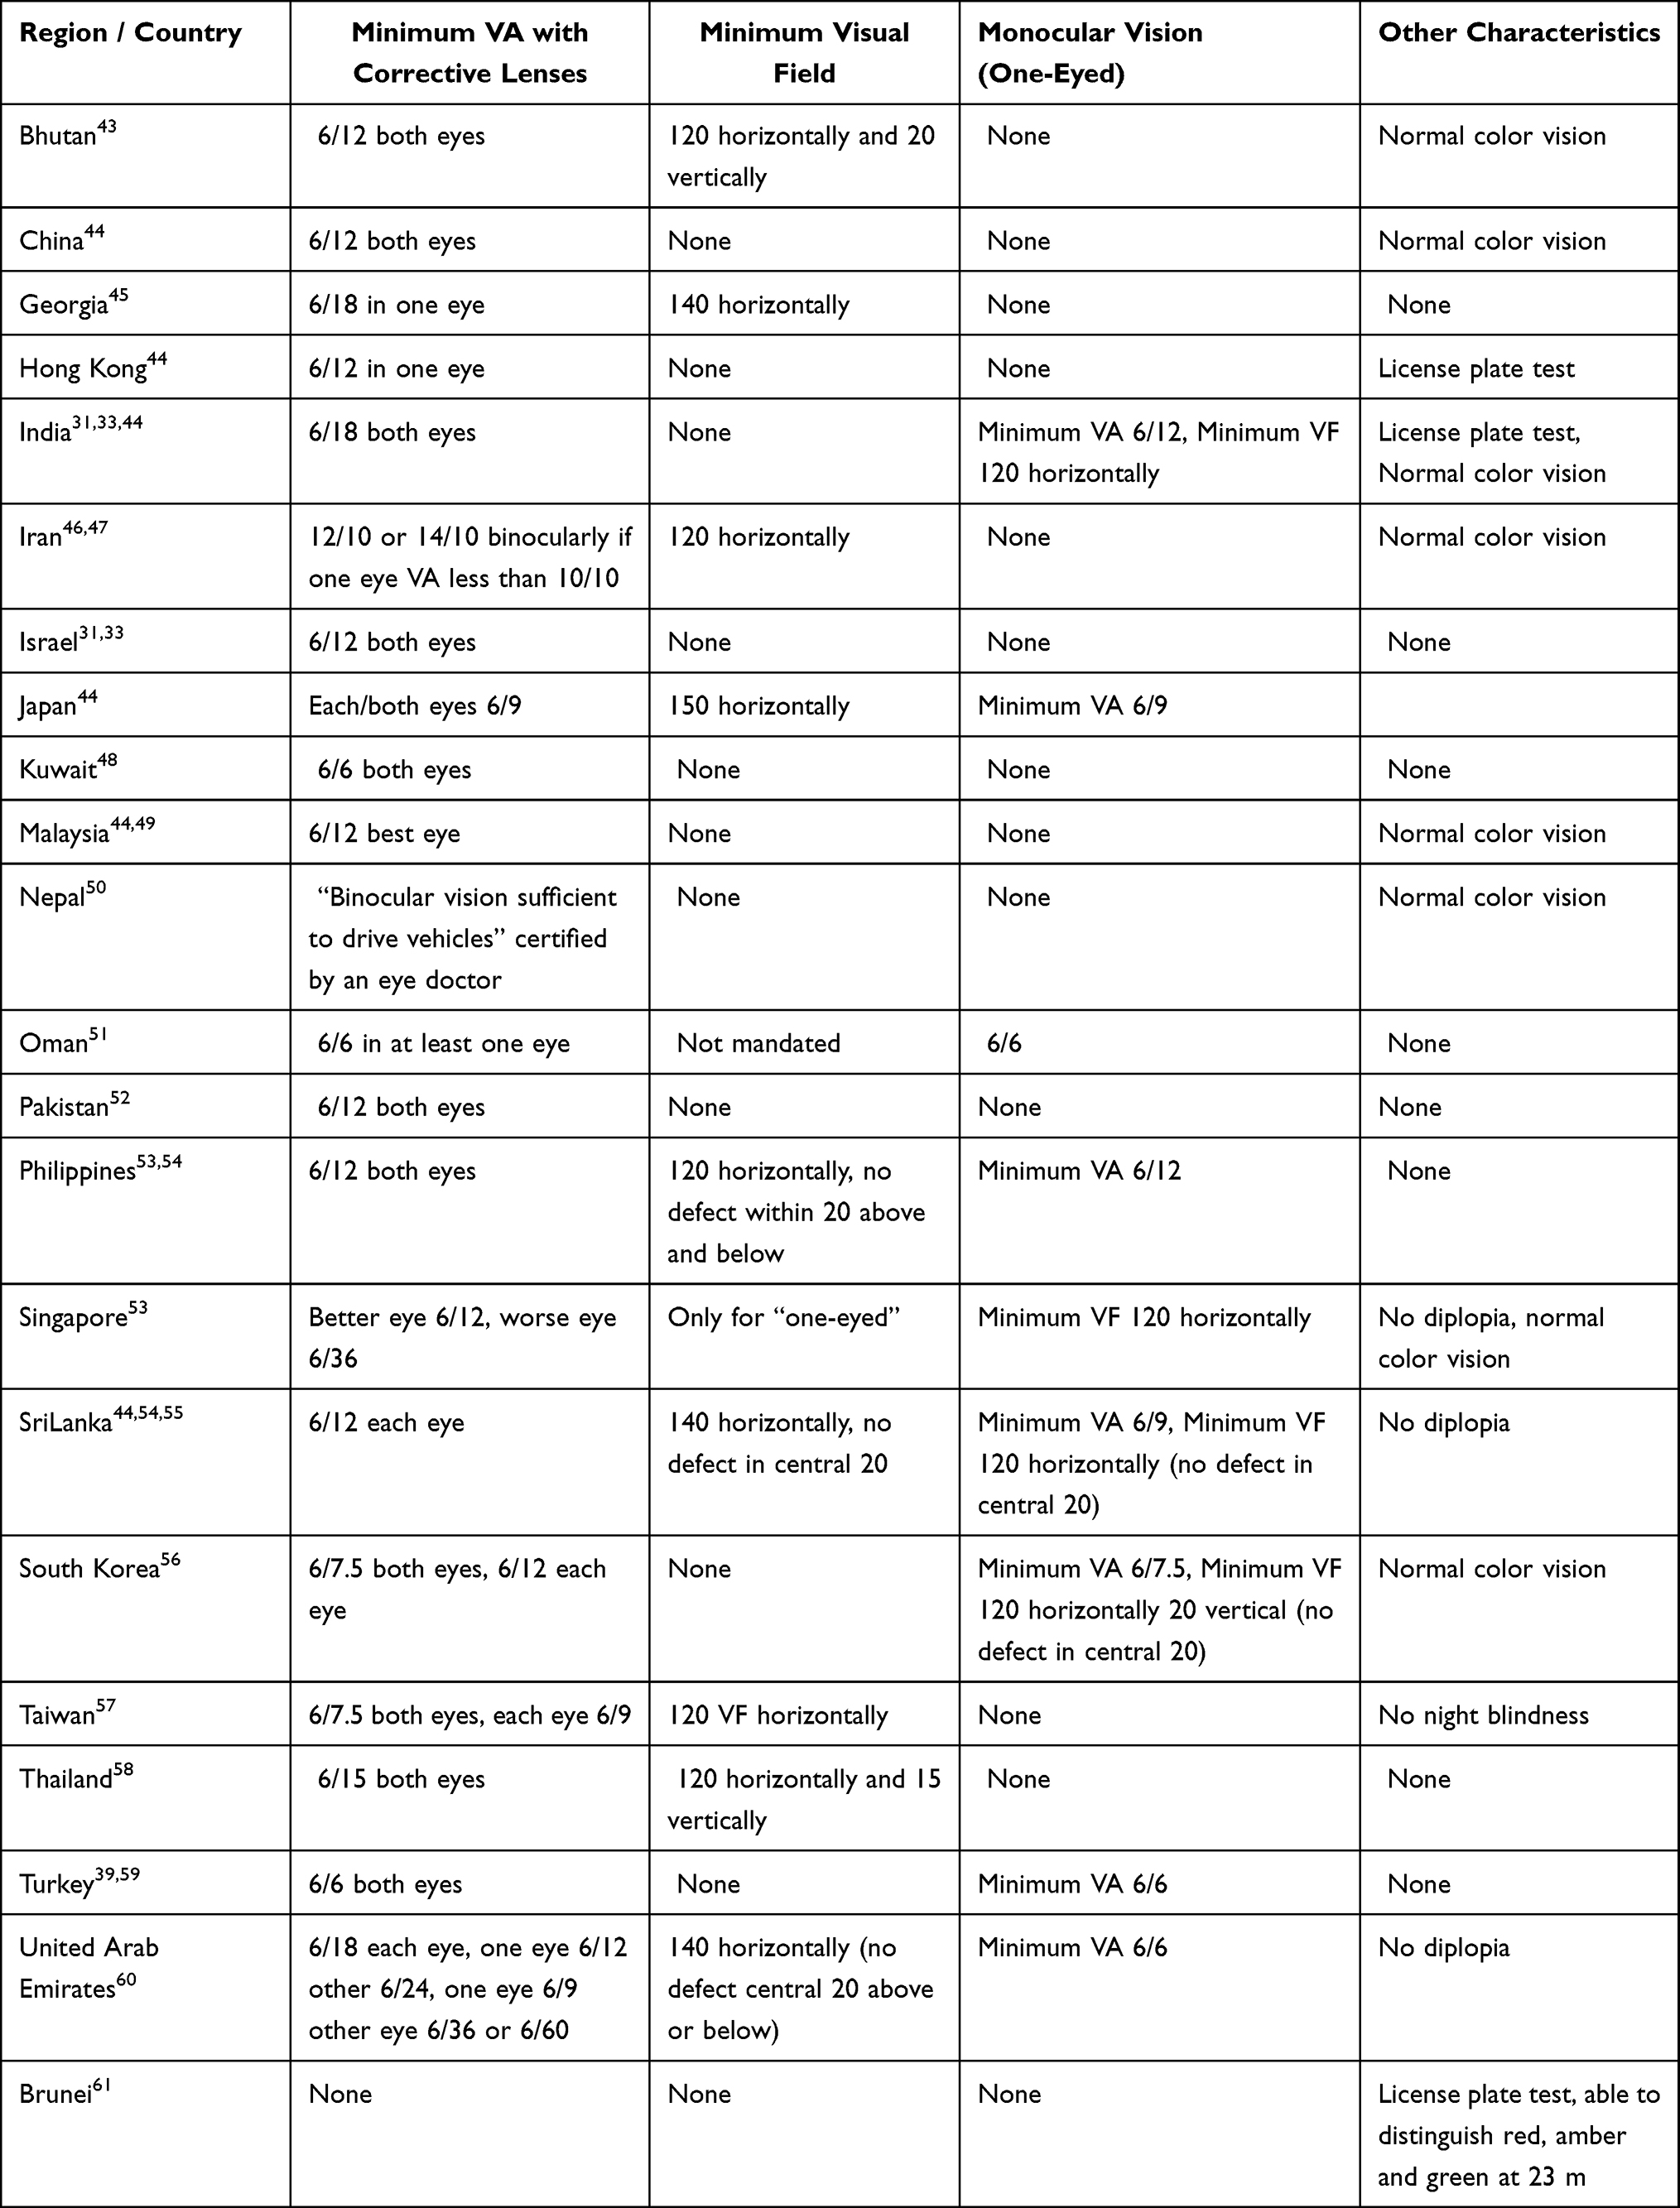 |
Table 3 Visual Standards for Driving in Asia |
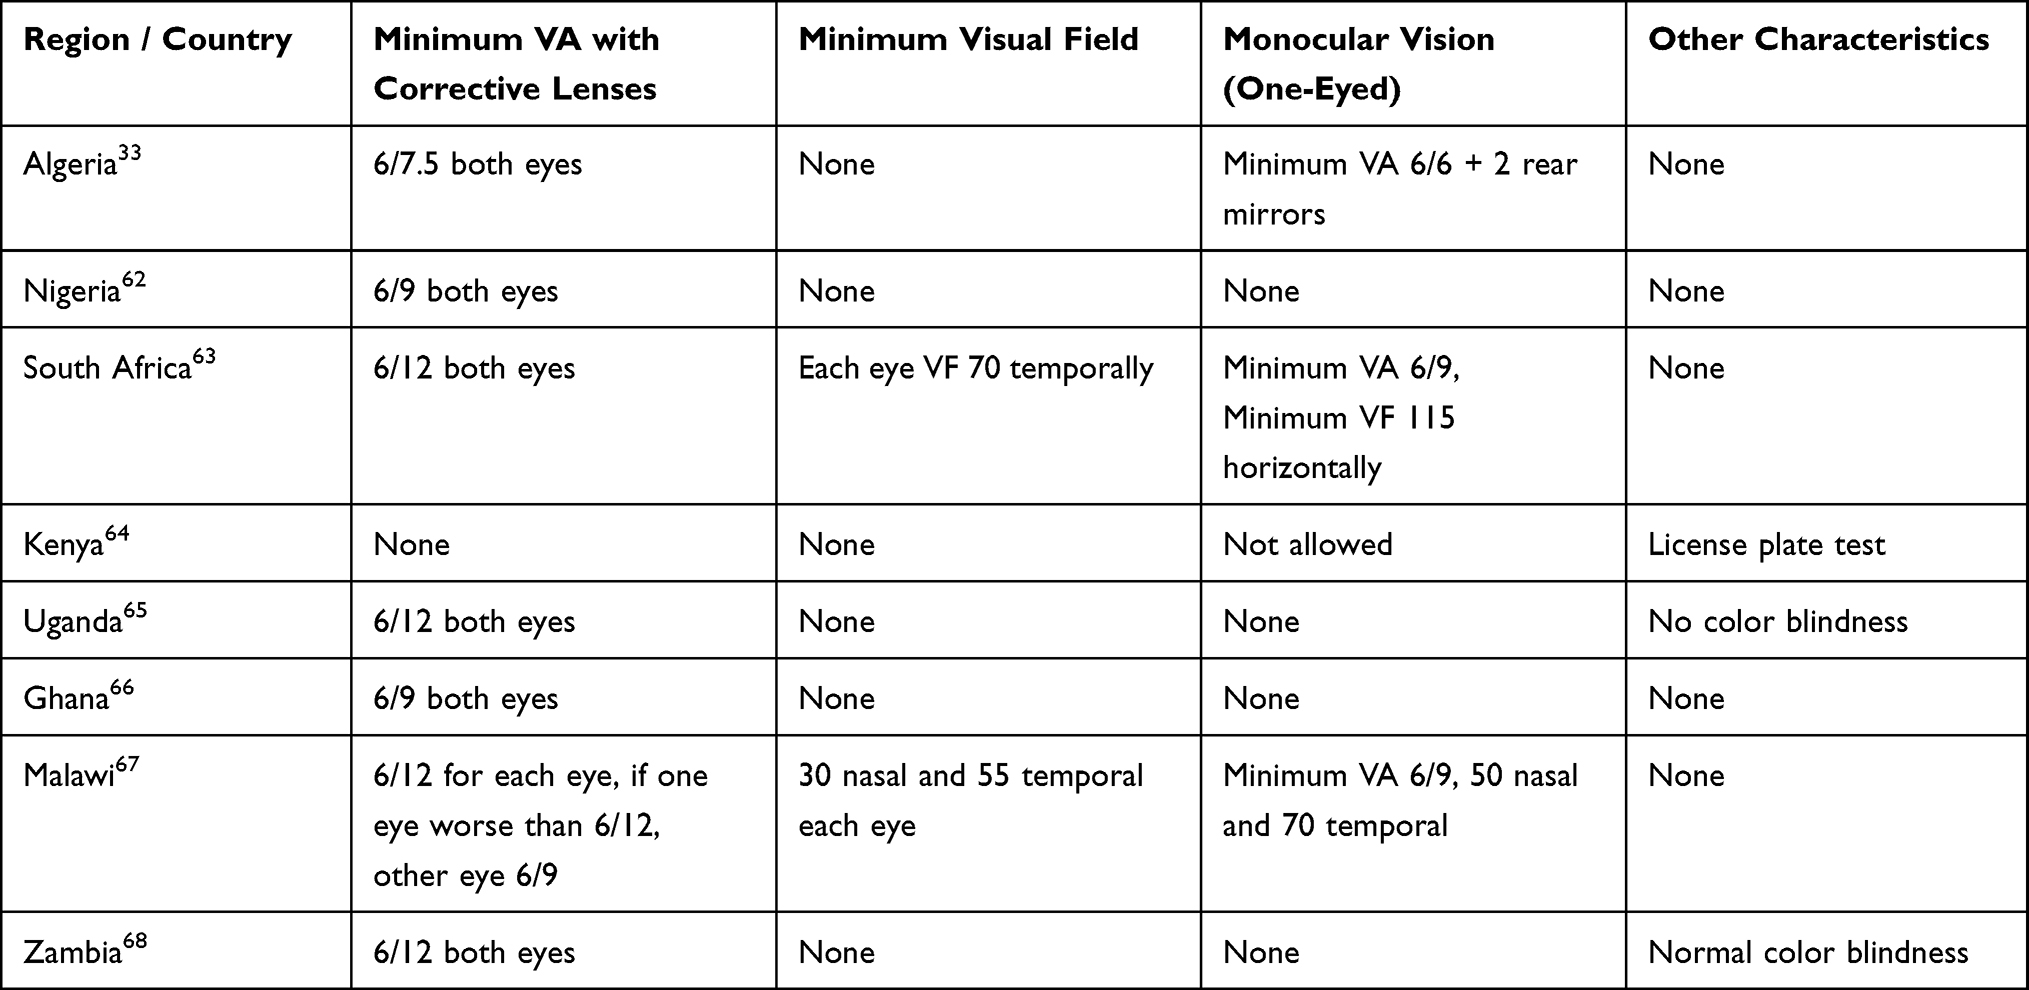 |
Table 4 Vision Standards for Driving in Africa |
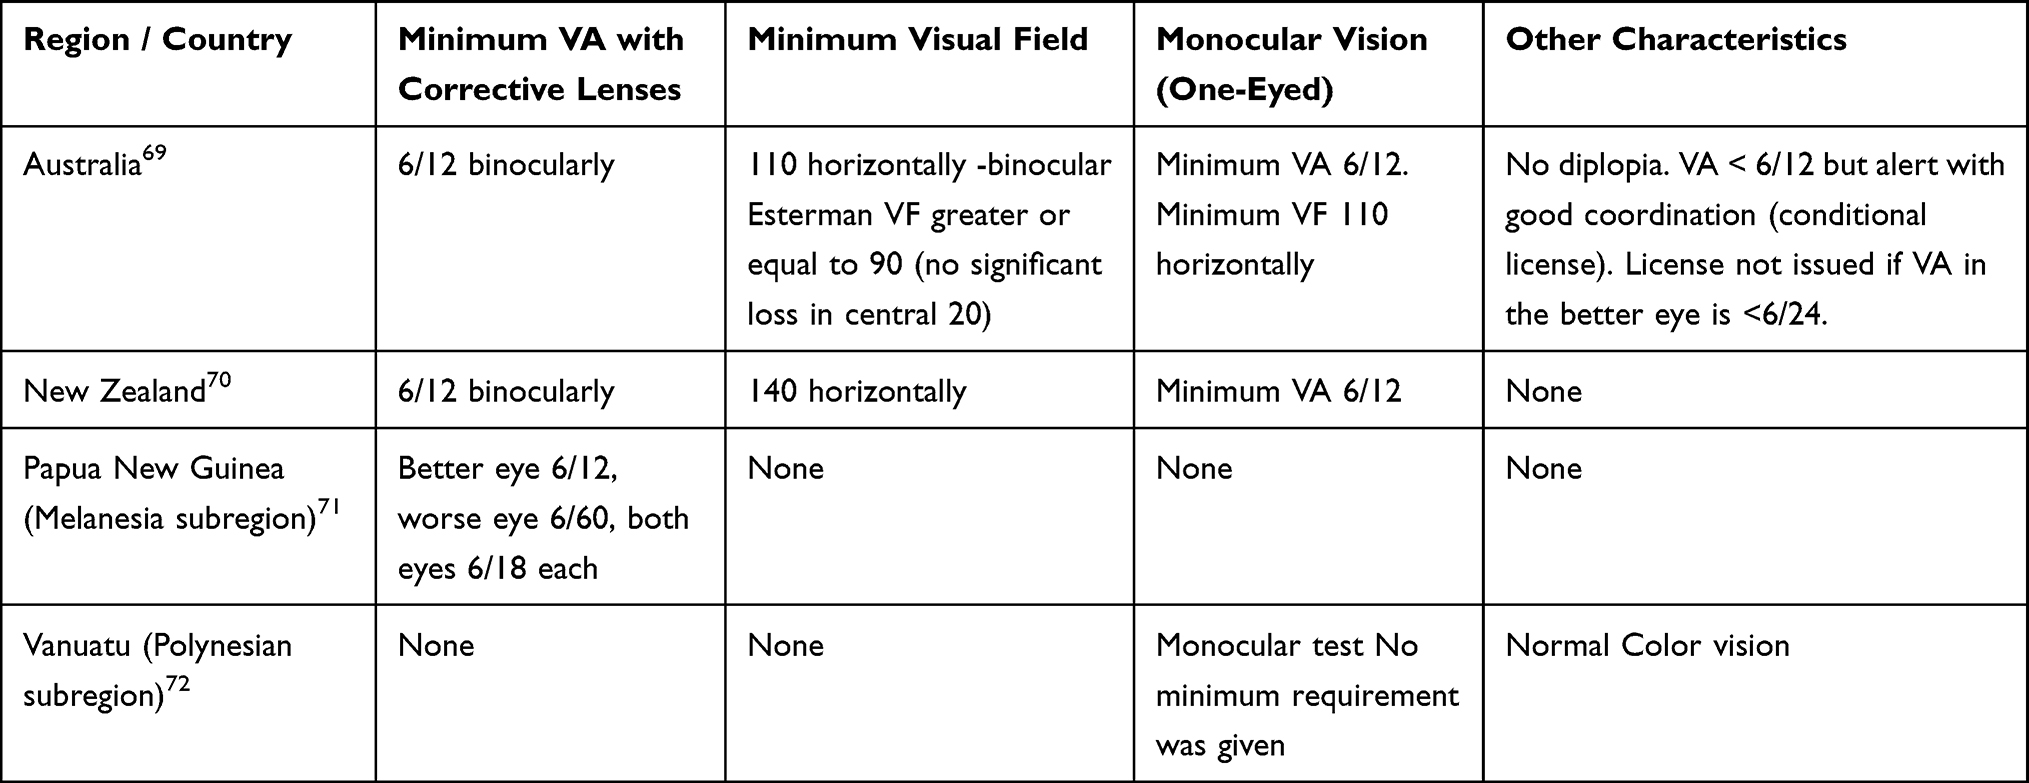 |
Table 5 Vision Standards for Oceania Geographic Region |
Data Extraction
Four optometrists extracted the data. Visual function data were summarized as descriptive tables categorized regionally, including the most common visual functions necessary for safe driving measured in each country, including VA (the VA data were converted from LogMAR, decimal, and Snellen fraction in feet to Snellen fraction in meters), VF, and monocular vision allowance. Other visual characteristics, such as color vision, diplopia, and adaptation to lighting condition, were listed as other characteristics. These abilities were assessed to determine whether a driver is likely to operate a vehicle safely.73 RTA data were obtained in terms of RTA fatality rates. The reporting of RTAs showed a significant discrepancy between countries, with each report focusing on a different area of concern (ranging from minor to fatal accidents).
Low-income nations tended to underreport RTA rates. However, the number of road users and car accidents significantly reduced in 2020–2021 due to the legislative limitations implemented because of the COVID-19 pandemic. Therefore, the RTA-related death rates in 2019 were recorded. The effectiveness of enforcing road safety laws regarding speed limits, drunk driving, and seat belt usage was determined from the most recent WHO global status report on road safety.3 The WHO has set a road safety scale ranging from 0 to 10, where 0 represents poor effectiveness and 10 represents excellent effectiveness. For example, a score of 10 for speed limits indicates that the country’s efforts, laws, and regulations on speed limits are sufficient to preserve road safety or are aligned with best practices.
Data Analysis
Statistical analyses were performed using SAS software (version 9.4, SAS Institute, Cary, NC, US). Data are presented as the median and interquartile range (IQR) for continuous variables and frequencies with percentages for categorical variables. Each US state was considered a separate country in the analysis.
The visual function data (VA, VF, and monocular vision allowance) were divided into two groups: Yes (required testing) and No (do not require testing), to study the association between the RTA-related death rates of each country and the driving visual standards. The differences between the two groups were assessed using Wilcoxon two-sample test. After grouping the relevant findings for vision standards and categorizing them into four groups, 0–1, 2, 3, 4, and ≥5 tests, the association between the total number of vision tests for each country and RTA-related death rate was evaluated using Kruskal–Wallis. The associations of driving safety laws enforcement scores for drunk driving, seat belt usage, and speeding with RTA-related death rate were further analyzed using the Kruskal–Wallis test after classifying the data for driving safety laws scores into three groups: 0–3, 4–6 and 7–10. A P-value of <0.05 was considered statistically significant.
Results
The retrieved data were: 1) illustrated as the worldwide driving visual function standards in five continents, and 2) analyzed to determine the association between RTA-related death rates and vision function requirements (VA, VF, monocular vision allowance, driving exposures, and the enforcement of road safety laws).
Driving Visual Function Standards
A total of 121 countries and US states were included in the analysis. Driving vision standards were identified for 71 (36.7%) of the 193 countries on the UN countries list. Data for five (7%) North, Central, and South American countries were extracted, including all 50 US states. Data for 32 (45.1%) countries in Europe, nine (12.6%) in Africa, 21 (29.6%) in Asia, and four (5.63%) in the Oceania geographic region were extracted.
The Americas
The required information was obtained from the US and Canada (North America) and Columbia, Mexico, and Venezuela (South America). However, 30 of the countries recognized by the UN in North, Central, and South America were excluded due to the unavailability of vision standard information.
Table 1 lists the vision standards for North and South American countries. The minimum VA required in Canadian provinces and US states were 6/12, except in Georgia, New Jersey, Oklahoma, and Wisconsin, where a range of 6/15–6/30 is sufficient. However, Mexico has a VA requirement with a minimum value of 6/7.5 binocularly; nevertheless, it does not require a VF test. Approximately 30% of states in the US do not require VF testing, whereas other states specify the VF required in each direction with respect to the central fixation point. The minimum VF required for drivers in most states in the US varies from 110 to 140 horizontally. Most Canadian provinces require drivers to have a horizontal VF of 120, whereas Quebec requires a horizontal VF of 100. Canada and Mexico have no specific criteria for drivers with monocular vision.
Most states in the US follow the binocular VA and VF criteria for drivers with monocular vision; however, individuals with monocular vision are not permitted to drive in Alabama and California. Some states employ additional tests, such as depth perception (Mississippi), diplopia screening (Colorado), and a test to assess the ability of the drivers to distinguish between the colors red, amber, and green (Massachusetts).
Europe
Vision requirements for driving in 32 of the 43 countries in Europe recognized by the UN were included. Table 2 lists the minimum European Union (EU) standards. According to the EU requirements, drivers must have a corrected or uncorrected binocular VA of ≥ 6/12 and a binocular VF of ≥ 120. Drivers should not have diplopia, and those with monocular vision must have a corrected or uncorrected VA of ≥ 6/10. However, exceptions can be made based on medical opinion and positive practical test results.
Although many European countries follow these guidelines, a few (eg, the UK, Netherlands, Cyprus, and France) use a number plate test to assess VA. In the number plate test, the applicant must be able to read the registration plate of a vehicle 20 m ahead. Most European countries have a minimum corrective VA criterion of 6/12 binocularly, and a few countries, such as Bulgaria (6/7.5) and the Czech Republic (6/8.5), are stricter. Similar variations in the minimum VF requirement also exist among European countries. Most member countries require a minimum horizontal VF of 120, a few require 140, whereas others require a confrontation VF exam. Countries such as Slovenia, Malta, Greece, and Iceland do not have VF requirements. Applicants can meet vision requirements via self-certification in Iceland. Night vision is required to meet the minimum vision standards in France and Sweden. In most European countries, the driving license is revoked if the driver is no longer able to meet the criteria. However, exemptions may be provided based on medical opinion.
Asia
Forty-seven Asian countries were listed in the UN country list; however, the minimum vision standards were available for 22 countries only. Table 3 lists the visual standards for driving in Asia. Most Asian countries for which information was available followed a minimum VA standard similar to that in Europe and the US, which is 6/12. However, variations exist within the specific rules related to this standard. Some Asian countries require binocular VA (eg, Bhutan and Israel), whereas others specify the minimum VA requirements for each eye separately (eg, United Arab Emirates and Taiwan). Some countries have stricter VA criteria (eg, Turkey, Oman, and Kuwait), whereas others countries are more lenient (eg, Georgia and India). Similar to the UK, some Asian countries also use the number plate test (eg, Hong Kong and India). Iran defined the minimum VA standard in terms of the total VA, which is the total sum of the VA of both eyes (lines read using the right eye added to lines read using the left eye). A certificate from an eye doctor stating that the applicant’s binocular vision is sufficient to drive vehicles is considered sufficient in Nepal.
The minimum VF requirements among Asian countries also vary considerably, with a range of 120 to 150 horizontally, and very few countries have guidelines or vision requirements for drivers with monocular vision.
Africa
Limited information was available regarding the minimum legal vision standards for African countries. Only eight of the 54 African countries recognized by the UN listed their vision standards for driving (Table 4). A minimum VA of ≥6/12 with correction lenses is required in South Africa, Uganda, Malawi, and Zambia. Other countries have stricter criteria (Algeria, Nigeria, and Ghana). Kenya uses the ability to read the registration plate of a vehicle from 23 and 25 meters away as their VA criteria. A minimum VF is considered a requirement in only two countries, whereas a minimum VF for monocular vision is required in four.
Oceania Geographic Region
Four of the 14 countries in Oceania recognized by the UN were included and are listed in Table 5. Australia and New Zealand published their complete legal vision minimum standards on their official websites. Papua New Guinea and Vanuatu require only a minimum VA with correction and a color vision test, respectively.
Association Between Driving Visual Standards, Enforcement of Road Safety Laws, and RTA-Related Death Rates
Driving Visual Standards and Road Traffic Accidents
Table 6 presents the associations between each country’s RTA-related death rate and the driving standard visual measures in terms of the total number of visual tests, VA, VF, and monocular vision criteria. Among the 121 countries included in the analysis, 16 (13.22%) did not require a test (only self-certification that one is not visually impaired) or only required one test for issuing driving license application; 29 (23.97%) countries permit a person to drive after passing two tests; three tests were required by 48 (39.67%) countries, and four or more tests are a requirement in 28 (23.14%) countries. The median (IQR) for the RTA-related death rate per 100,000 of the population for countries that do not require visual tests or require passing only one test to obtain a driving license was 13.05 (11.70) and 5.95 (3.55), respectively, for stricter countries with four or more visual tests. Kruskal–Wallis sample test revealed that the median RTA-related death rate differed significantly between the countries that required none or one, two, three and four or more visual functions tests (p < 0.05). Thus, more visual restrictions and tests for acquiring adriving license reduces RTA-related death rates, thereby resulting in safer driving (Figure 2).
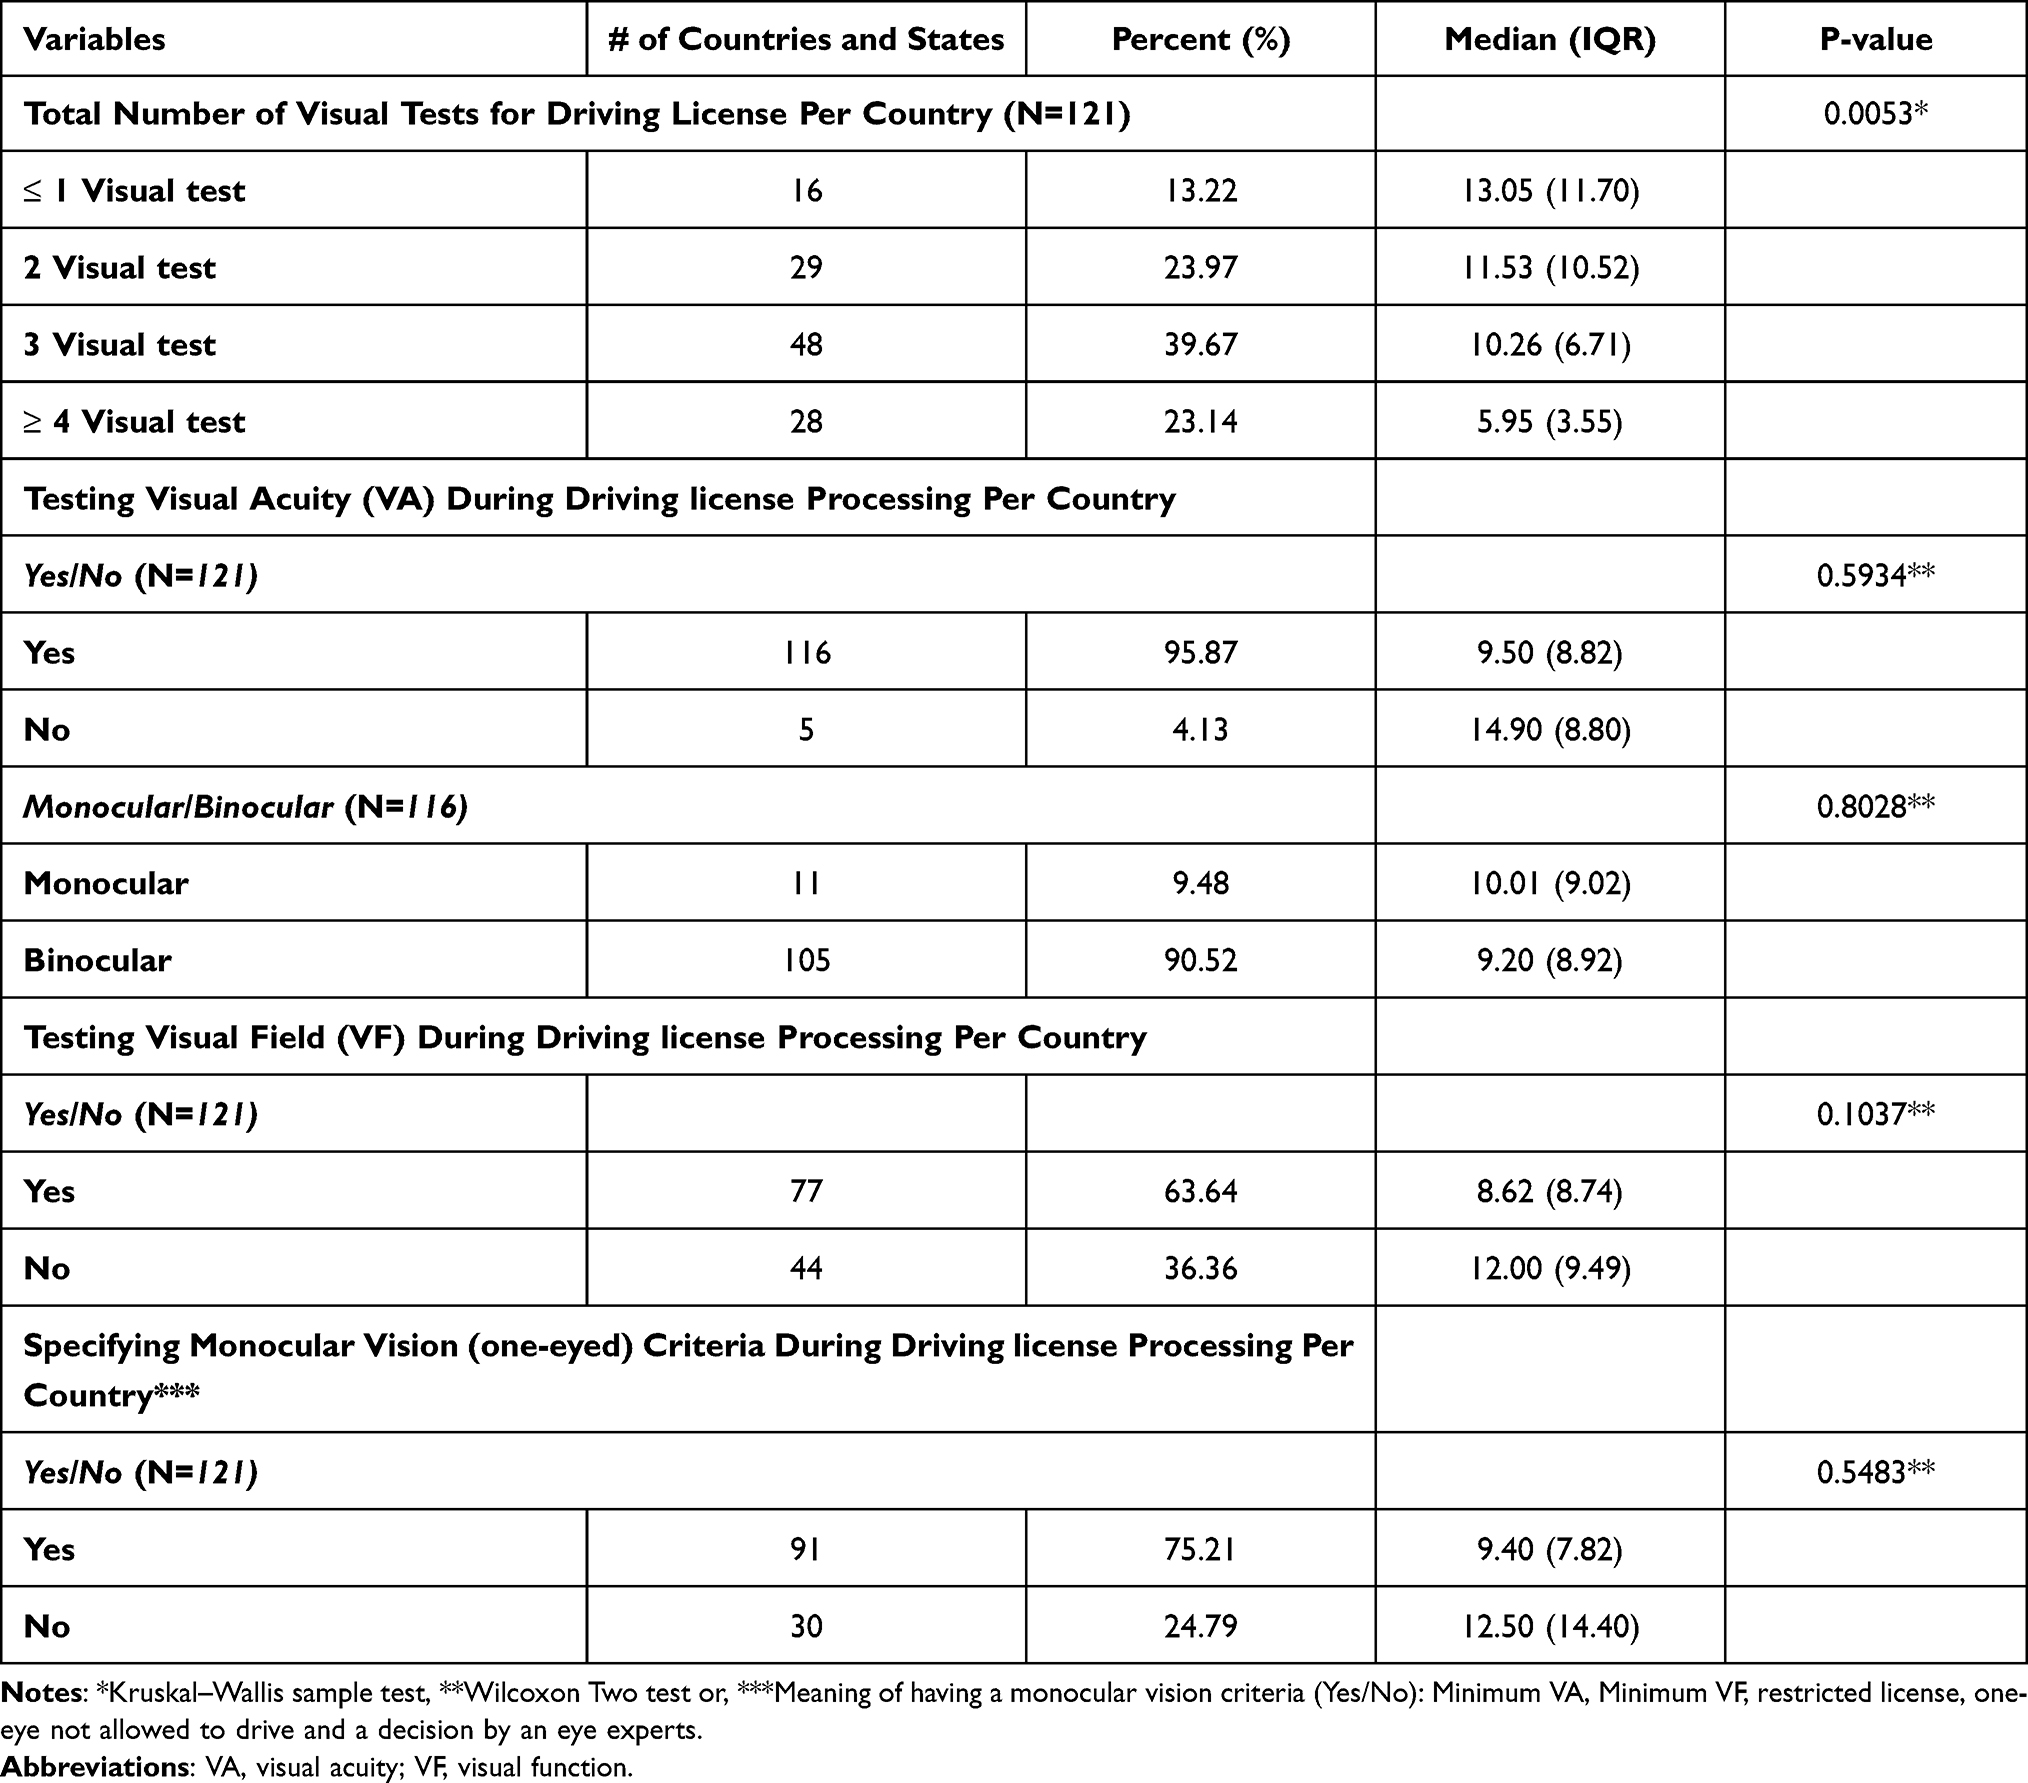 |
Table 6 Descriptive Characteristics and the Association of RTAs Death Rate with Visual Function Variables |
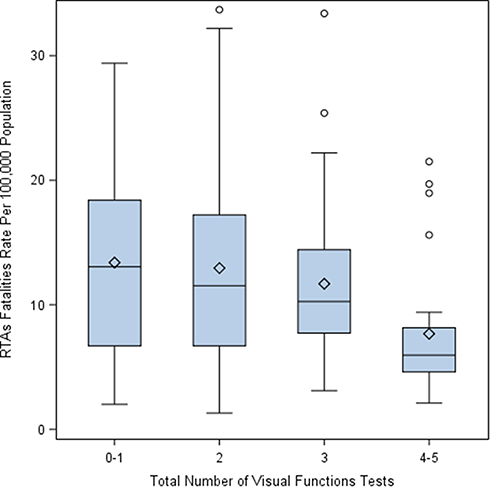 |
Figure 2 Distribution of RTA-related death rate per 100,000 population by the total number of visual function tests for driving license (1: one test, 2: two test, etc). Abbreviation: RTA, road traffic accident. |
Figure 3 lists each country (classified and colored by continent/region) according to the RTA-related death rates and the total number of visual function tests required.
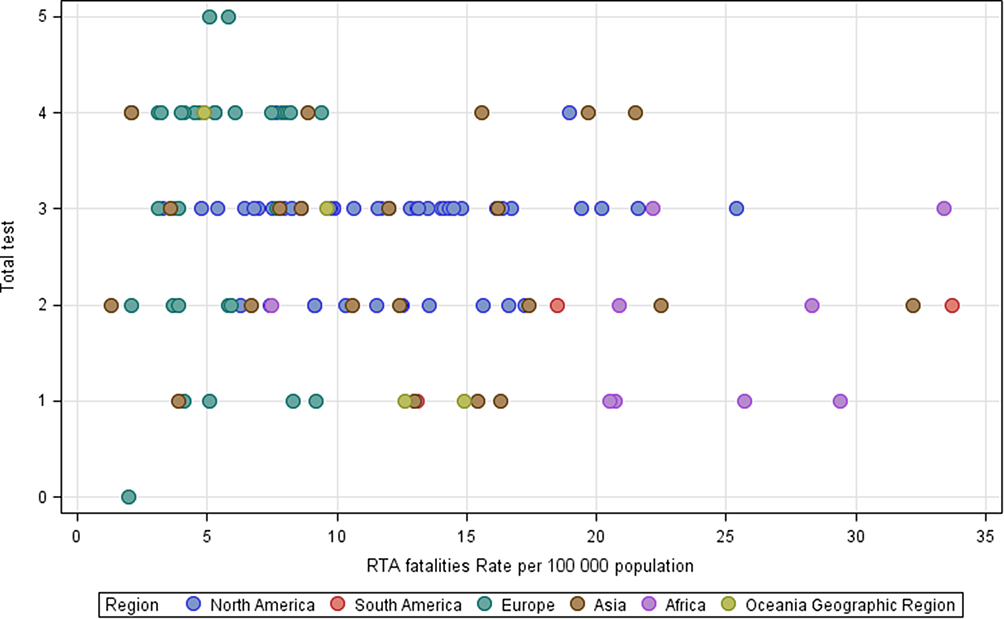 |
Figure 3 Countries listed by RTA-related death rate and the total number of visual function tests. Abbreviation: RTA, road traffic accident. |
Among the 121 countries included, the majority (116, 95.87%) issue driving licenses to drivers who pass VA tests, while five (4.13%) countries administer additional examinations, as shown in Table 6. The VA test was assessed binocularly in 105 countries and monocularly in 11. However, the median RTA-related death rate (IQR) when VA testing was performed was 9.50 (8.82). Wilcoxon two-sample test revealed that VA had no significant effect on RTA-related death rates (p > 0.05), even when tested monocularly, with a median (IQR) RTA-related death rate of 10.01 (9.02) and 9.20 (8.92) for VA testing binocularly (p > 0.05). Figure 4A shows the RTA death rate among the countries that consider VA testing and countries that do not, and Figure 4B shows the countries that tested VA monocularly or binocularly.
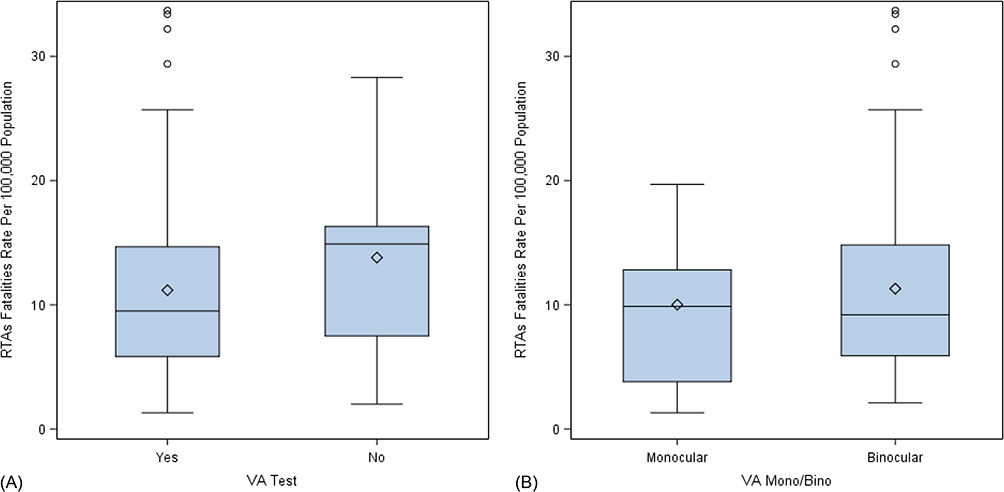 |
Figure 4 Distribution of RTA-related death rate per 100,000 population according to VA. testing. (A) Countries that consider VA testing (Yes) and countries that do not consider VA testing (No). (B) The countries tested VA monocular or binocular. Abbreviation: RTA, road traffic accident. |
As shown in Table 7, the minimum VA with corrective lenses required to acquire a driving license varied among the countries, ranging from 6/6–6/18 (6/6 for four countries, 6/7.5 for five, 6/8.5 for one, 6/9 for three, 6/10 for one, 6/12 for 92 countries, 6/15 for three, and 6/18 for six). A VA value of 6/12 was the most common minimum vision requirement to drive (80%). Drivers must have their field of vision assessed in 77 (63.64%) countries. In contrast, 28 (23.53%) countries do not require VF testing. The median (IQR) RTA-related death rate for countries that did and did not conduct the VF test was 8.62 (8.74) and 12.00 (9.49), respectively. No statistically significant association was observed between RTA-related death rates and VF testing during the licensing process (p = 0.1037). Figure 5 shows the RTA-related death rate among the countries that require VF testing and those that do not.
 |
Table 7 Descriptive Characteristics for Minimum Required VA with Corrective Lenses for Driving License Among Countries |
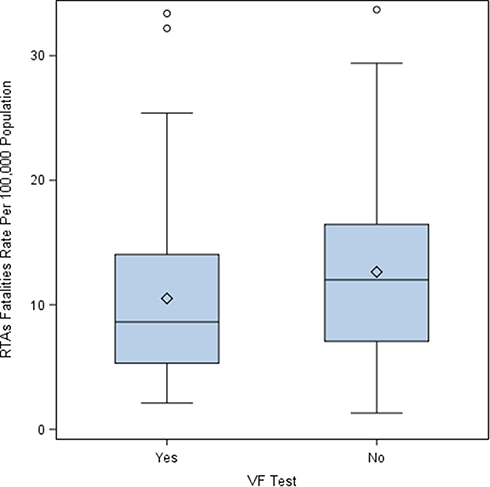 |
Figure 5 Distribution of RTA-related death rate per 100,000 population according to VF testing (Yes: participants underwent VF testing, No: participants did not undergo VF testing). Abbreviation: RTA, road traffic accident. |
Ninety-one countries specified visual requirements for one-eye individuals to drive, with a media (IQR) RTA-related death rate of 9.40 (7.82), whereas 30 countries did not, with RTA-related death rate of 2.50 (14.90). No significant association was observed between RTA-related death rates and the monocular vision allowance criteria for driving (p = 0.5483). Figure 6 shows the distribution of RTA-related death rates according to the countries that had criteria for one-eyed drivers and the countries that did not, as illustrated in Table 6.
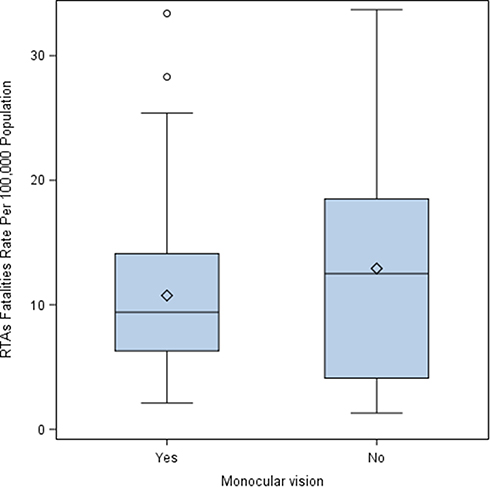 |
Figure 6 Distribution of RTA-related death rate per 100,000 population according to the monocular vision criteria (Yes: participants met the monocular vision criteria, No: participants did not meet the monocular vision criteria). Abbreviation: RTA, road traffic accident. |
The minimum VA with corrective lenses for one-eyed individuals to acquire a driving license was 6/12 in most countries. However, variations were observed between countries in terms of the minimum VA, ranging from 6/6–6/18 (Table 8).
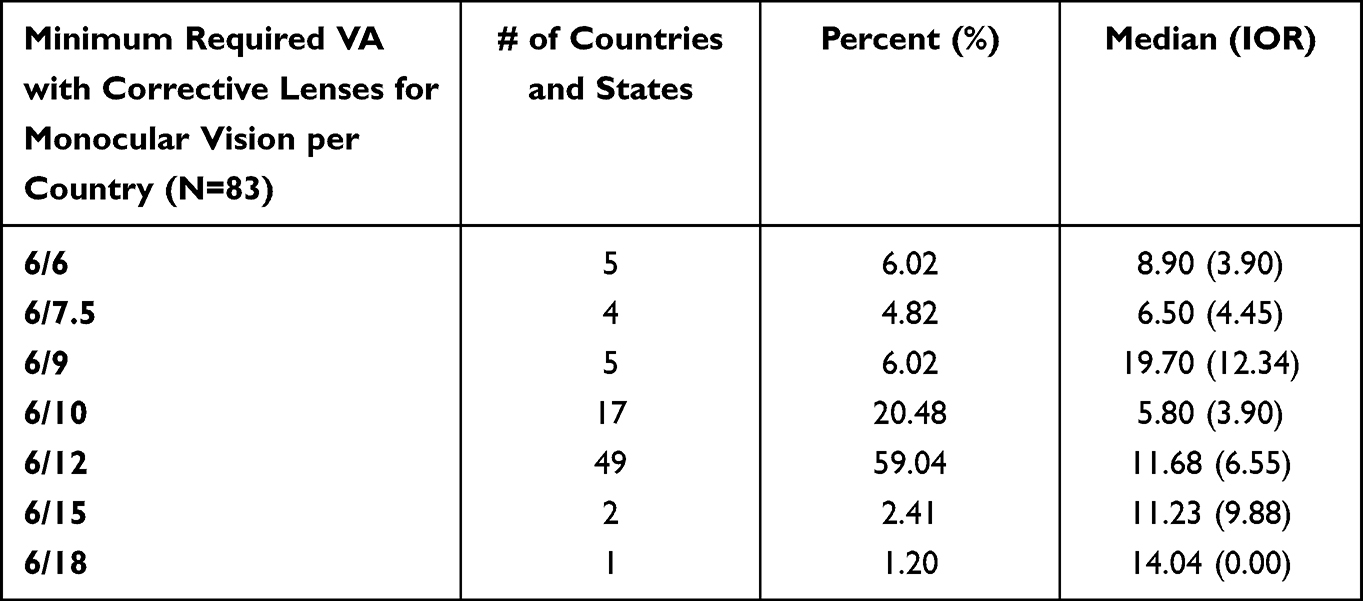 |
Table 8 Descriptive Characteristics for Minimum Required VA with Corrective Lenses for Driving License Among Countries for One-Eyed |
Driving Exposures and Enforcement of Road Safety Laws
Three driving safety laws were considered in the current analysis and are listed in Table 9. Among the 121 countries/regions included in the analysis, the enforcement scores of 58, 60, and 59 countries (see point 4 on search strategy and data collection in the Methods section) for speeding, drunk driving, and seat-belt laws were identified, respectively. Approximately half of the countries met the criteria for excellent effectiveness (score of 7–10) in all three laws. Twenty-two countries have average enforcement scores (score of 4–6) for speeding laws, 24 countries for drunk-driving legislation, and 20 countries for seat-belt usage. However, four, two, and five countries poorly (score of 0–3) addressed the risks of speeding, drunk driving, and seat belt usage, respectively. With regards to speeding laws, the median (IQR) RTA-related death rate was 15.50 (4.10) for poor enforcement, 12.70 (16.30) for average enforcement, and 5.55 (5.00) for excellent enforcement. With regards to drunk driving laws, the median (IQR) RTA-related death rate was 20.30 (10.80) for poor enforcement, 14.20 (15.70) for average enforcement, and 6.00 (5.50) for excellent enforcement. Furthermore, for seat belt laws, the RTA-related death rate was 16.20 (10.10) for poor enforcement, 12.50 (15.70) for average enforcement, and 5.85 (5.00) for excellent enforcement. As expected, all these laws had a significant impact on the RTA-related death rates, with p-values of 0.0025, 0.0060, and 0.0006 for speed limits, drunk driving, and seat belt laws, respectively. Figures 7A–C show the association of RTA-related death rates with the enforcement scores (best [7–10], moderate [4–6], and poor [0–3] enforcement) for speeding, drunk driving, and seat belt laws, respectively.
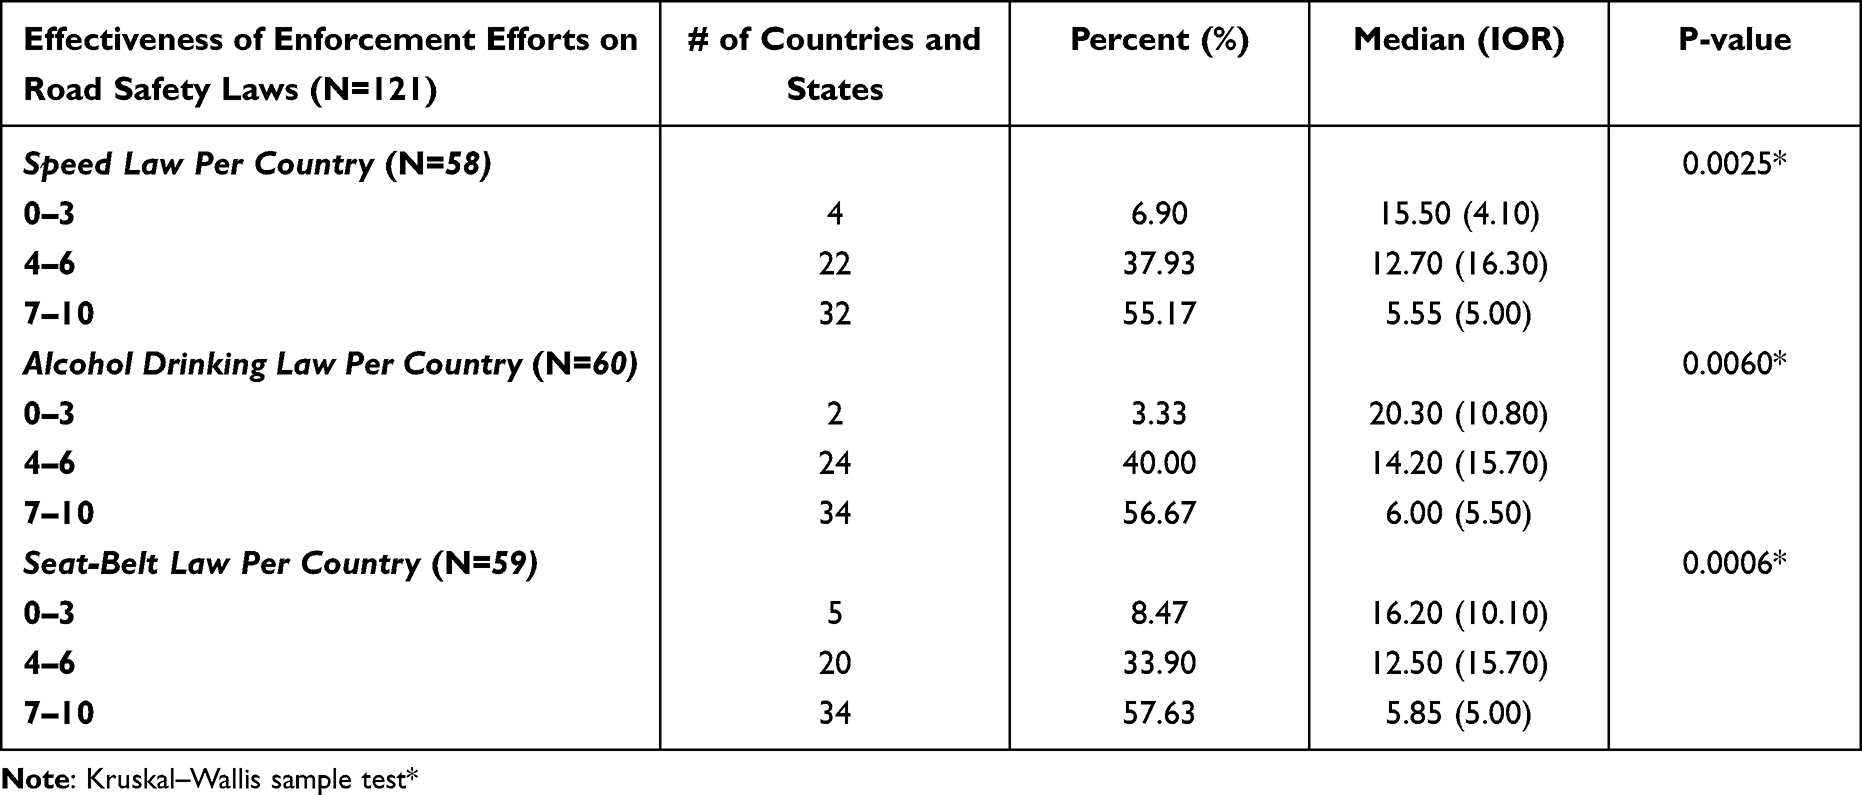 |
Table 9 Descriptive Characteristics and the Association of RTAs Death Rate with Driving Safety Laws |
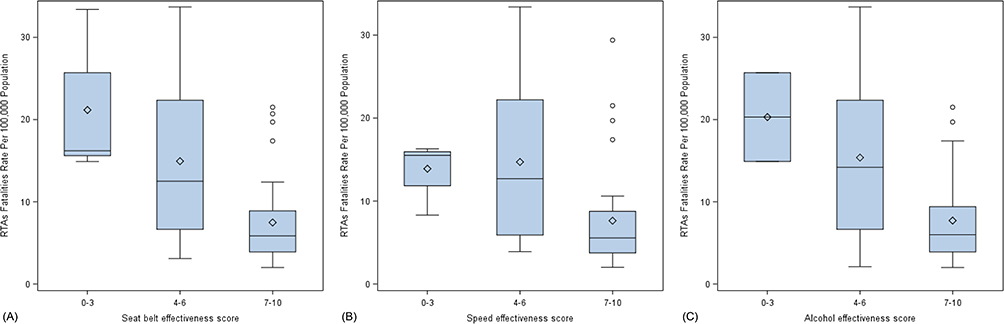 |
Figure 7 Distribution of RTA-related death rate per 100,000 population according to the road safety enforcements scores. (A) Seatbelt legalization, (B) speed, (C) alcohol drunk driving. Abbreviation: RTA, road traffic accident. |
Discussion
Many countries have strict regulations and visual function assessment methodologies for driving-license applications to maintain road safety. In contrast, others may be permissive or do not follow specific guidelines. It is unclear which country’s requirements should be followed due to being the most efficient in maintaining driver safety. This study aimed to summarize the global visual standards for driving and investigate the effect of driving safety laws on drunk driving, seat belt usage, speeding, and the visual standards on RTA-related death rates in different countries. The aim of this paper was to aid in the process of developing and updating driving regulations and guidelines for issuing and renewing driving licenses to improve road safety.
Having fewer visual requirements for obtaining a driving license significantly increased the risk of RTA-related deaths according to our findings. Developed countries have strict road laws for speeding; drunk driving; and the use of helmets, seat belts, and child seats to maintain road safety.3 The lower RTA-related death rates in these countries may be attributed to these laws. However, according to a study by Piyasena et al26 low-income countries need better adherence to driving license regulations in terms of visual requirements. Similarly, the findings of the present study showed that most countries with higher RTA-related death rates have fewer visual function tests and were mainly African.
The results for VA revealed no substantial association between VA testing and the incidence of deadly RTAs. A review by Owsley and McGwin,18 concluded that VA has a weak association with safe driving. Similarly, a more recent review by Thorslund and Strand74 reported that many other studies had similar findings, and none of them reported a strong association between VA and road safety. They hypothesized that VA was tested under optimal conditions rarely observed in traffic. However, the lack of association between VA and RTA-related death rates in the present study could be attributed to the data, which were based on publicly available information from different countries. Therefore, a comparison was performed between the groups with high variability, resulting in insufficient statistical power (Table 6).
According to the findings of the present study, VF was not directly correlated with RTA fatalities. This result is consistent with the findings of previous studies.75,76 However, Johnson and Keltner,77 suggested that drivers with binocularly impaired VF are at a greater risk of being involved in RTAs than those without impairment. Furthermore, McGwin et al,78 who studied VF defects in patients with glaucoma, reported that individuals with moderate or severe VF impairment are more likely to be involved in car accidents. Rubin et al79 also suggested that VF loss was a significant predictor of road accident involvement. According to the literature, the useful field of vision testing is the best test for predicting driving performance.74 This discrepancy may be attributed to the differences in methodological factors and variations in VF assessment. Therefore, direct comparisons may not be possible. Compensatory eye and head movements by visually impaired drivers could also be a contributing factor.1 However, poor VF results in decreased awareness of objects in the peripheral vision.19 For example, a driver with decreased visual field needs to be made aware of a pedestrian crossing the street while taking a turn. Furthermore, an optimal field of vision is required for street lane positioning, especially in curves.80 Hence, VF testing is an important measure to maintain driving safety.
Specifying the criterion for one-eyed individuals was unrelated to RTA-related death rates according to the results of this study. Moreover, countries that defined visual requirements for one-eyed drivers in terms of minimum VA, VF, or both exhibited no differences from countries that did not. Evidence on the association between monocular vision and the incidence of accidents is limited and far from conclusive. However, it is important to recognize the importance of defining criteria for one-eyed individuals; their limited field of vision and lack of depth perception is well-known, making it difficult for them to judge distance.81 These results indicated that binocular visual function assessments are required to ensure traffic safety.
The present study showed that countries with more visual function tests have lower RTA-related death rates. Kuwait48 and Nigeria62 require only one test, the VA test, for issuing and renewing a driving license; these countries have high RTA-related death rates (17.6 and 21.4 respectively3). In contrast, VA and VF are tested in Georgia;31,33–35 however, the RTA-related death rate was higher in Georgia than that in countries that require more vision tests, such as France.31,37 Vision testing should be more comprehensive and must provide more information regarding other visual functions required for driving. Conducting other tests, such as color vision tests, could be even more important for specific drivers with higher responsibilities, such as bus and heavy truck drivers. Color vision problems were reported as risk factors for the incidence of RTAs.20 However, color vision testing is not included in the testing protocol of many countries, such as Spain,31,37,39 Taiwan,57 Mexico,33,34 Alaska31,33–35 and California.76–79,81 Moreover, the ability to perform regular activities, such as reading signs or being aware of pedestrians crossing the road, is not the same in all conditions.25 Therefore, it is important to include a contrast sensitivity test to evaluate vision in different contrast conditions.
As indicated by the findings of the present study, other confounding factors, such as speed limits, drunk driving, and seat belt use, maintain road safety and significantly affect the RTA-related death rates. This effect has been observed in numerous studies,12,82–84 where the RTA-related death rate was less when a country had vigorous enforcement and laws on speed limits, drunk driving, and seat belt usage. An earlier study conducted by Abbas et al13 examined the association between seatbelt usage and the frequency of road traffic fatalities and found a strong significant negative correlation (p < 0.00001) between seat belt usage and the incidence of RTA-related fatalities with a linear regression (R) of 0.77. According to the Centers for Disease Control and Prevention,85 drivers not using seat belts are more likely to be thrown from their vehicle, thereby greatly increasing their risk of death and severe injury. This explains the findings of the present study on why countries with strict legislation and punishments for seat belt usage are more likely to have a lower rate of RTA-related fatalities.
Moreover, strong enforcement of laws pertaining to drunk drivers lowers the rate of RTA-related deaths.10,11,84 The legal limit for blood alcohol concentration (percent of alcohol in an individual bloodstream) for driving is 0.08% in the majority of the states in the USA.86 Fell and Voas87 concluded that lowering the blood alcohol concentration from the legal limit of 0.08% to 0.05% is associated with reduced RTA-related rates.
Speeding is another contributory factor to RTA-related fatalities and significantly affects the death rate. The narrative review by Esmaeilnejad-Ganj et al82 reviewed the risk factors for RTA-related mortality and illustrated how high speed is a crucial risk factor. The WHO Managing Speed Report provides critical details on the impact of speeding on fatal crashes, where an increase of 1 km/h in average vehicle speed causes increase the likelihood of fatal crashes by 45%.88 Each country has its own speed limit laws, depending on the street and vehicle types.89,90 Many countries have imposed automated systems to detect speeding with strict penalties.91 Other countries ticket occupants of the vehicle for not wearing seat belts.92 Some countries have also considered legal sanctions for driving under the influence of alcohol.93 However, poor enforcement and the absence of laws that address these risks remain an issue in some countries. Promoting law enforcement and implementing safety standards for drivers while maintaining strict driving license vision requirements will improve road safety.
Limitations and Future Research
The present study has some limitations. Only vision requirements available in English were included. Furthermore, only limited confounding factors related to driving safety were investigated in the present study. Moreover, the data was collected for the period between 2019 and 2021. The included countries may have changed or modified their vision standards during or after the study period.
Future research should investigate whether data are available online in other languages or whether phone calls, emails, or other means would be required to determine the existing vision requirements for drivers, if any, in the countries that were excluded from the present study. Collecting more thorough information on minor accidents, overall rate of RTAs, and other driving confounding factors, such as the use of drugs and mobile phones, to identify additional variables influencing RTAs. Further clinical studies must be conducted to understand the importance of each visual test alone in reducing RTAs.
Conclusions
This study aimed to compile a global list of the standard tests for driving licenses and investigate the impact of driving regulations and vision functions on RTA-related death rates. Many countries lack vision requirements for issuing driving licenses and, equally importantly, they lack revocation/suspension policies. Most countries offer a license if a particular set of criteria is met, with many considering VA tests as a benchmark. A minimum VA of 6/12 is required among many countries and could be used as the standard. A minimum VF is the second most common requirement in terms of visual function tests, especially in the US. Other visual examinations, such as color vision testing and diplopia screening, are considered part of the requirements in various countries but are rarely employed.
The association was statistically significant for the total number of visual function tests and RTA-related death rate. Countries with more visual function tests and licensing standards had lower rates of RTA-related fatalities. Each visual screening test alone is weakly linked to driver safety in terms of RTA-related death rate. Vision testing should be more comprehensive and include additional visual function tests. Improving the efficacy of visual function assessment requires a more realistic approach, which could be achieved by performing more than simple VA testing and providing clear policies regarding vision requirements and vision measurements for the application, renewal, suspension, and revocation of driving licenses.
Data Sharing Statement
All the data are available on the cited references.
Author Contributions
All authors made substantial contributions to conception and design, acquisition of data, or analysis and interpretation of data; took part in drafting the article or revising it critically for important intellectual content; agreed to submit to the current journal; gave final approval of the version to be published; and agree to be accountable for all aspects of the work.
Funding
The research was performed as part of the employment of the authors, King Abdullah international research center and King Saud University.
Disclosure
The authors have no potential conflicts of interest to disclose.
References
1. Bhalla K, Shotten M, Cohen A, et al. Transport for health: the global burden of disease from motorized road transport; 2014. Available from: http://documents1.worldbank.org/curated/en/984261468327002120/pdf/863040IHME0T4H0ORLD0BANK0compressed.pdf.
2. Jacobs G, Aeron-Thomas A, Astrop A Estimating global road fatalities; 2000. Available from: https://citeseerx.ist.psu.edu/viewdoc/download?doi=10.1.1.174.5207&rep=rep1&type=pdf.
3. Shim H. Global status report on road safety; 2018. Available from: https://www.who.int/publications/i/item/9789241565684.
4. Blincoe LJ. The economic impact of motor vehicle crashes, 2000. United States: National Highway Traffic Safety Administration; 2002. Available from: https://rosap.ntl.bts.gov/view/dot/15504.
5. Mock CN C, Gloyd S, Adjei S, Acheampong F, Gish O. Economic consequences of injury and resulting family coping strategies in Ghana. Accid Anal Prev. 2003;35(1):81–90. doi:10.1016/S0001-4575(01)00092-6
6. Akloweg Y, Hayshi Y, Kato H. The effect of used cars on African road traffic accidents: a case study of Addis Ababa, Ethiopia. Int J Urban Sci. 2011;15(1):61–69. doi:10.1080/12265934.2011.580153
7. Hunde BM, Aged ZD. Statistical analysis of road traffic car accident in Dire Dawa Administrative City, Eastern Ethiopia. Sci J Appl Math Stat. 2015;3:250–256. doi:10.11648/j.sjams.20150306.14
8. Afolabi OJ, Gbadamosi KT. Road traffic crashes in Nigeria: causes and consequences. Transp Logist Int J. 2017;17(42):1069–2406.
9. Green M, Senders J. Human error in road accidents. Visual Expert. 2004;2004:1.
10. Hadland SE, Xuan Z, Sarda V, et al. Alcohol policies and alcohol-related motor vehicle crash fatalities among young people in the US. Pediatrics. 2017;139(3):e20163037. doi:10.1542/peds.2016-3037
11. Martin JL, Gadegbeku B, Wu D, Viallon V, Laumon B. Cannabis, alcohol and fatal road accidents. PLoS One. 2017;12(11):e0187320.
12. Febres JD, García-Herrero S, Herrera S, Gutiérrez JM, López-García JR, Mariscal MA. Influence of seat-belt use on the severity of injury in traffic accidents. Eur Transp Res Rev. 2020;12(1):1–2. doi:10.1186/s12544-020-0401-5
13. Abbas AK, Hefny AF, Abu-Zidan FM. Seatbelts and road traffic collision injuries. World J Emerg Surg. 2011;6(1):18. doi:10.1186/1749-7922-6-18
14. Høye A. How would increasing seat belt use affect the number of killed or seriously injured light vehicle occupants? Accid Anal Prev. 2016;88:175–186. doi:10.1016/j.aap.2015.12.022
15. Anstey KJ, Wood J, Lord S, Walker JG. Cognitive, sensory and physical factors enabling driving safety in older adults. Clin Psychol Rev. 2005;25(1):45–65. doi:10.1016/j.cpr.2004.07.008
16. Renew my driver’s licence (standard). Available from: https://www.transport.wa.gov.au/licensing/renew-my-drivers-licence-standard.asp.
17. Renew your driving licence if you’re 70 or over. Available from: https://www.gov.uk/renew-driving-licence-at-70.
18. Owsley C, McGwin G. Vision and driving. Vision Res. 2010;50(23):2348–61. doi:10.1016/j.visres.2010.05.021
19. Owsley C, McGwin G. Vision impairment and driving. Surv Ophthalmol. 1999;43(6):535–550. doi:10.1016/S0039-6257(99)00035-1
20. Cole BL, Maddocks JD. Defective colour vision is a risk factor in driving. In:
21. Elliott DB. Clinical procedures in primary eye care. Elsevier Health Sciences. 2013;2013:1.
22. Saladin JJ. Stereopsis from a performance perspective. Optom Vis Sci. 2005;82(3):186–205. doi:10.1097/01.OPX.0000156320.71949.9D
23. Johnson CA, Casson EJ. Effects of luminance, contrast, and blur on visual acuity. Optom Vis Sci. 1995;72(12):864–869. doi:10.1097/00006324-199512000-00004
24. Mortimer RG, Fell JC. Older drivers: their night fatal crash involvement and risk. Accid Anal Prev. 1989;21(3):273–282. doi:10.1016/0001-4575(89)90018-3
25. Wood JM, Owens DA. Standard measures of visual acuity do not predict drivers’ recognition performance under day or night conditions. Optom Vis Sci. 2005;82(8):698–705. doi:10.1097/01.opx.0000175562.27101.51
26. Piyasena P, Olvera-Herrera VO, Chan VF, et al. Vision impairment and traffic safety outcomes in low-income and middle-income countries: a systematic review and meta-analysis. Lancet Glob Health. 2021;9(10):e1411–e1422. doi:10.1016/S2214-109X(21)00303-X
27. Owsley C, Stalvey BT, Wells J, Sloane ME, McGwin G. Visual risk factors for crash involvement in older drivers with cataract. Arch Ophthalmol. 2001;119(6):881–887. doi:10.1001/archopht.119.6.881
28. Szlyk JP, Taglia DP, Paliga J, Edward DP, Wilensky JT. Driving performance in patients with mild to moderate glaucomatous clinical vision changes. JRehabil Res Dev. 2002;39(4):467–482.
29. Page, MJ, McKenzie, JE, Bossuyt, PM, Boutron, I, Hoffmann, TC, Mulrow, CD, et al. 2021;372:n71. doi:10.1136/bmj.n71. The PRISMA 2020 statement: an updated guideline for reporting systematic reviews. BMJ.
30. Higgins JPT, Green S. Cochrane Handbook for Systematic Reviews of Interventions. Wiley Online Library; 2019.
31. Marsden J, Craig S. Driving and vision. Int J Ophthalmic Pract. 2011;2(5):216–222. doi:10.12968/ijop.2011.2.5.216
32. Yazdan-Ashoori P, Ten Hove M. Vision and driving: Canada. J Neuroophthalmol. 2010;30(2):177–185. doi:10.1097/WNO.0b013e3181dfa982
33. Colenbrander A, De Laey JJ. Vision requirements for driving safety with emphasis on individual assessment. Sao Paulo: International Council of Ophthalmology; 2006. http://www.icoph.org/downloads/visionfordriving.pdf.
34. Blindness P. State vision screening and standards for license to drive. Available from: https://lowvision.preventblindness.org/2003/06/06/state-vision-screening-and-standards-for-license-to-drive/.
35. Wang C, Kosinski CJ, Schwartzberg JG, Shanklin AV. American Medical Association. Physician’s guide to assessing and counseling older drivers; 2003. Available from: https://rosap.ntl.bts.gov/view/dot/39100.
36. Intermodal M. Department of Finance and Deregulation; 2012. Available from: https://www.arkleg.state.ar.us/Bills/Document?type=pdf&source=Fiscal.Impacts&bill=HB1476-DFA1&ddBienniumSession=2015%2F2015R.
37. Bron AM, Viswanathan AC, Thelen U, et al. International vision requirements for driver licensing and disability pensions: using a milestone approach in characterization of progressive eye disease. Clin Ophthalmol. 2010;4:1361–1369. doi:10.2147/OPTH.S15359
38. Steinkuller PG. Legal vision requirements for drivers in the United States. Virtual Mentor. 2010;12(12):938–940. doi:10.1001/virtualmentor.2010.12.12.hlaw1-1012
39. Visual standerds for driving in Europe. European council of optometry and optics. Available from: https://www.ecoo.info/wp-content/uploads/2017/01/Visual-Standards-for-Driving-in-Europe-Consensus-Paper-January-2017.pdf.
40. Getting a driving licence in the EU. Availablr from: https://europa.eu/youreurope/citizens/vehicles/driving-licence/get-driving-licence/index_en.htm#anchor3.
41. Siren A, Haustein S. Driving licences and medical screening in old age: review of literature and European licensing policies. J Transp Heal. 2015;2(1):68–78. doi:10.1016/j.jth.2014.09.003
42. Bro T, Lindblom B. Strain out a gnat and swallow a camel?–vision and driving in the Nordic countries. Acta Ophthalmol. 2018;96(6):623–630. doi:10.1111/aos.13741
43. Ministry of health Bhutan. Medical Screening for Driving Licensing. Available from: https://www.moh.gov.bt/wp-content/uploads/ftps/certificate-and-medical-screening-form/Form.B-Medical.screening.for.driving.purpose.pdf.
44. Yan MK, Kumar H, Kerr N, et al. Transnational review of visual standards for driving: how Australia compares with the rest of the world. Clin Exp Ophthalmol. 2019;47(7):847–863. doi:10.1111/ceo.13572
45. Patnaik JL, Pecen PE, Hanson K, et al. Driving and visual acuity in patients with age-related macular degeneration. Ophthalmol Retina. 2019;3(4):336–342. doi:10.1016/j.oret.2018.11.004
46. Ghasemi M, Hoseini Yazdi SH, Heravian J, Jafarzadehpur E, Rezaee M. Comparison of visual status of Iranian military and commercial drivers. Iran Red Crescent Med J. 2015;17(4):e19751. doi:10.5812/ircmj.17(4)2015.19751
47. Sharifi A, Sharifi H, Karamouzian M, Daneshtalab E, Daneshtalab A. Visual fitness of public vehicle drivers in Southeast of Iran. Int J Prev Med. 2013;4(6):705–709.
48. Al-Matawah JA. An Investigation of Driver Attitudes Towards Road Safety in Kuwait (Unpublished Doctoral Dissertation). England: University of Southampton; 2008.
49. Haliza A, Md Muziman Syah M, Norliza M. Visual problems of new Malaysian drivers. Malays Fam Physician. 2010;5(2):95–98.
50. Medical Report Detail. Nepal license all in one. Available from: https://www.nepallicense.com/medical-reports.
51. Al Busaidi A. Are our legal visual requirements for driving adequate? Oman J Ophthalmol. 2021;14(1):1–2.
52. Aarrij F, Hussain A, Hussain S, Shakoor A. Assessment of visual functions in night drivers. Ophthalmol Pakistan. 2018;8(02):21–24.
53. College of Ophthalmologists Academy of Medicine S. College statement regarding fitness to drive of visually impaired patients. Available from: https://www.works.go.ug/wp-content/uploads/2016/08/Driving-Tests-and-Special-Provisions-for-PSV-Drivers-Regulations-2012.pdf.
54. Jayasekara TI, Gunawardena SA. The assessment of medical fitness to drive in Sri Lanka: current status, gaps and recommendations. J Coll Community Physicians Sri Lanka. 2018;24(1):43–48. doi:10.4038/jccpsl.v24i1.8139
55. College Ophthalmologists in Srilanka. Vision standards for Driving license in Sri Lanka. Available from: https://cosl.lk/pdf/vision-standards-for-driving-license-in-sri-lanka-revised-version-19-01-2018.pdf.
56. Minist Gov Legis South Korea. Driver’s License Exam Procedure. Available from: https://m.easylaw.go.kr/MOM/SubCsmOvRetrieve.laf?langCd=700101&csmSeq=851&ccfNo=2&cciNo=2&cnpClsNo=1.
57. Driving license test - service contents. Kaohsiung City Motor Vehicles Office. Available from: https://khcmv.thb.gov.tw/en/page?node=ccabacd8-987a-439b-916a-7de2c37c6f09.
58. Vision for safety. Safe driver education. Available from: https://safedrivereducation.com/en/articles.php?n_id=15.
59. Stephenson RW. Visual standards for driving. Br Med J. 1964;2(5405):385. doi:10.1136/bmj.2.5405.385-a
60. Roads & Transport Authority. Dubai Driver’s medical standard; 2012. Available from: https://www.rta.ae/wpsv5/links/Medical_Standard_Dubai.pdf.
61. Ministry of communications and land transport department. Safe and smart driving in Brunei Darussalam. Available from: http://www.jpd.gov.bn/SiteAssets/SitePages/Land.Transport.Department/Adverts/Safe.and.Smart.Driving.In.Brunei.Darussalam/Safe.and.Smart.Driving.in.Brunei.Darussalam.pdf.
62. Adeoti CO, Ubah JN, Isawumi MA, Ashaye AO, Oluwatimilehin IO, Raji RA. Visual standards in commercial driving. Niger Postgrad Med J. 2007;14(3):199–203. doi:10.4103/1117-1936.177550
63. Ocul Assoc South Africa. Regulation 102 (Replacing Regulation 241). Available from: http://www.oasa.org.za/Regulation102.php.
64. National Transport and Safety Authority Act (NTSA). Driving Licenses. Available from: https://ntsa.ecitizen.go.ke/index.php?id=8.
65. Statutory instruments. Minist work transp. Available from: https://www.works.go.ug/wp-content/uploads/2016/08/Driving-Tests-and-Special-Provisions-for-PSV-Drivers-Regulations-2012.pdf.
66. Ovenseri-Ogomo G, Adofo M. Poor vision, refractive errors and barriers to treatment among commercial vehicle drivers in the cape coast municipality. Afr Health Sci. 2011;11(1):97–102.
67. Road Traffic act. Agreement of sections chapter 69:01. Malawi legal information institute. Available from: https://malawilii.org/mw/consolidated_legislation/6901.
68. Medical certificate form. Zambia Road Transport and Safety Agency. Available from: https://www.rtsa.org.zm/wp-content/uploads/2020/04/Medical-Certificate-Form-.pdf.
69. Austroads Drivers Veh. Assessing Fitness to Drive. Available from: https://austroads.com.au/publications/assessing-fitness-to-drive/ap-g56/vision-and-eye-disorders/general-assessment-and-managemenz_pc12zg/progressive-eye-conditions.
70. A guide for health practitioners. Medical Aspects of Fitness to Drive. New Zealand Transport Agency. Available from: https://www.nzta.govt.nz/assets/resources/medical-aspects/Medical-aspects-of-fitness-to-drive-a-guide-for-health-practitioners.pdf.
71. Motor Traffic Regulation 1967. Chapter 243. Papua New Guinea Consolidated Legislation. Available from: http://www.paclii.org/pg/legis/consol_act/mtr1967244.
72. Prescribed Medical Certificate. Vanuatu Police Force. Available from: https://police.gov.vu/downloads/forms/file/19-prescribed-medical-certificate.
73. Groeger JA. Understanding Driving: Applying Cognitive Psychology to a Complex Everyday Task. Hove: Psychology Press; 2001.
74. Thorslund B, Strand N. Vision measurability and its impact on safe driving: a literature review. Scand J Optom Vis Sci. 2016;9(1):1–9. doi:10.5384/SJOVS.vol9i1p1
75. Burg A. The relationship between vision test scores and driving record; general findings; 1967.
76. Decina LE, Staplin L. Retrospective evaluation of alternative vision screening criteria for older and younger drivers. Accid Anal Prev. 1993;25(3):267–275. doi:10.1016/0001-4575(93)90021-N
77. Johnson CA, Keltner JL. Incidence of visual field loss in 20,000 eyes and its relationship to driving performance. Arch Ophthalmol. 1983;101(3):371–375. doi:10.1001/archopht.1983.01040010371002
78. McGwin G, Xie A, Mays A, et al. Visual field defects and the risk of motor vehicle collisions among patients with glaucoma. Invest Ophthalmol Vis Sci. 2005;46(12):4437–4441. doi:10.1167/iovs.05-0750
79. Rubin GS, Ng ES, Bandeen-Roche K, Keyl PM, Freeman EE, West SK. A prospective, population-based study of the role of visual impairment in motor vehicle crashes among older drivers: the SEE study. Invest Ophthalmol Vis Sci. 2007;48(4):1483–1491. doi:10.1167/iovs.06-0474
80. Lockhart J, Boyle LN, Wilkinson M. Driving with Visual Field Loss: An Exploratory Simulation Study. United States: National Highway Traffic Safety Administration; 2009.
81. Blake R, Sloane M, Fox R. Further developments in binocular summation. Percept Psychophys. 1981;30(3):266–276. doi:10.3758/BF03214282
82. SEsmaeilnejad-Ganji SM, Karimi Nasab MH. Risk factors for fatal traffic accidents: a narrative review. Int J Med Investig. 2019;8(1):1–9.
83. Touahmia M. Identification of risk factors influencing road traffic accidents. Eng Technol Appl Sci Res. 2018;8(1):2417–2421. doi:10.48084/etasr.1615
84. Papalimperi AH, Athanaselis SA, Mina AD, Papoutsis II, Spiliopoulou CA, Papadodima SA. Incidence of fatalities of road traffic accidents associated with alcohol consumption and the use of psychoactive drugs: a 7-year survey (2011-2017). Exp Ther Med. 2019;18(3):2299–2306. doi:10.3892/etm.2019.7787
85. Centers for Disease Control and Prevention. Policy Impact: seat Belts. Available from: https://www.cdc.gov/transportationsafety/seatbeltbrief/index.html.
86. Centers for Disease Control and Prevention. Impaired Driving: get the Fact. Available from: https://www.cdc.gov/transportationsafety/impaired_driving/impaired-drv_factsheet.html?CDC_AA_refVal=https%3A%2F%2Fwww.cdc.gov%2Fmotorvehiclesafety%2Fimpaired_driving%2Fimpaired-drv_factsheet.html.
87. Fell J, Voas R. The effectiveness of reducing illegal blood alcohol concentration (BAC) limits for driving: evidence for lowering the limit to. 05 BAC in Canada. J Safety Res. 2006;37(3):233–243. doi:10.1016/j.jsr.2005.07.006
88. World Health Organization. Managing Speed. Available from: https://www.who.int/publications/i/item/managing-speed.
89. UK GOV. National speed limits. Available from: https://www.gov.uk/speed-limits.
90. Speed Limits Law. Insurance Institute for Highway Safety. Available from: https://www.iihs.org/topics/speed/speed-limit-laws.
91. Center of Disease Control and Prevention (CDC). Automated speed-camera enforcement. Available from: https://www.cdc.gov/motorvehiclesafety/calculator/factsheet/speed.html.
92. GOV UK. Seat belts: the law. Available from: https://www.gov.uk/seat-belts-law%0D.
93. National Conference of State Legislatures. Drunken Driving. Available from: https://www.ncsl.org/research/transportation/drunken-driving.aspx.
 © 2023 The Author(s). This work is published and licensed by Dove Medical Press Limited. The full terms of this license are available at https://www.dovepress.com/terms.php and incorporate the Creative Commons Attribution - Non Commercial (unported, v3.0) License.
By accessing the work you hereby accept the Terms. Non-commercial uses of the work are permitted without any further permission from Dove Medical Press Limited, provided the work is properly attributed. For permission for commercial use of this work, please see paragraphs 4.2 and 5 of our Terms.
© 2023 The Author(s). This work is published and licensed by Dove Medical Press Limited. The full terms of this license are available at https://www.dovepress.com/terms.php and incorporate the Creative Commons Attribution - Non Commercial (unported, v3.0) License.
By accessing the work you hereby accept the Terms. Non-commercial uses of the work are permitted without any further permission from Dove Medical Press Limited, provided the work is properly attributed. For permission for commercial use of this work, please see paragraphs 4.2 and 5 of our Terms.