")
Back to Journals » Clinical Optometry » Volume 15
Vision Quality of Life with Time Survey: Normative Data and Repeatability
Authors Dungan ME, Scheiman M, Yaramothu C
Received 30 January 2023
Accepted for publication 12 June 2023
Published 12 September 2023 Volume 2023:15 Pages 205—212
DOI https://doi.org/10.2147/OPTO.S406407
Checked for plagiarism Yes
Review by Single anonymous peer review
Peer reviewer comments 3
Editor who approved publication: Mr Simon Berry
Michaela E Dungan,1 Mitchell Scheiman,2 Chang Yaramothu1,3
1School of Applied Engineering and Technology, New Jersey Institute of Technology, Newark, NJ, USA; 2Pennsylvania College of Optometry, Salus University, Philadelphia, PA, USA; 3Department of Biomedical Engineering, New Jersey Institute of Technology, Newark, NJ, USA
Correspondence: Chang Yaramothu, School of Applied Engineering and Technology, New Jersey Institute of Technology, University Heights, Newark, NJ, 07102, USA, Tel +1 973642-4844, Email [email protected]
Purpose: To develop a novel Vision Quality of Life (QoL) survey that emphasizes the amount of time a visual activity can be performed before symptoms occur.
Methods: The Vision Quality of Life with Time (VisQuaL-T) survey was developed with 10 daily activities and a list of common visual symptoms. Participants were recruited from a university campus. Participants were not excluded based on binocular impairments to obtain a normative dataset. Participants were instructed to denote when they first experience symptoms within certain time ranges. If participants did not engage in one of the 10 activities, they were instructed to denote “N/A”. A composite score (range 0– 3) was determined by only accounting for the questions that were answered.
Results: The normative data cohort had a sample size of 376 participants and the repeatability cohort had 54 participants. The normative, test, and retest datasets had a mean composite score of 2.47± 0.54, 2.69± 0.42, and 2.67± 0.49 and 95% confidence interval of 2.38– 2.71, 2.58– 2.81, 2.54– 2.80, respectively. There was good reliability and high correlation between the test and retest timepoints with an ICC of 0.825 and a Pearson correlation coefficient of 0.839 in the repeatability cohort. The normative data cohort showed good internal consistency with a Cronbach’s alpha value of 0.803. Test and retest timepoints showed no statistical significance among the individual questions (p > 0.1).
Conclusion: A lower bound score of 2.4 can potentially be used to differentiate visually normal and symptomatic participants. Statistical analysis showed the survey is repeatable and reliable. Using time as a metric for assessing symptomology could be a useful method for identifying patients with QoL issues and for assessing effectiveness of binocular vision, accommodative, and eye movement treatments.
Keywords: quality of life, timed survey, endurance, visual symptoms, patient-reported outcome measure
Introduction
Surveys/questionnaires are widely used in clinical settings for diagnostic and monitoring purposes when clinical measures are unavailable or to supplement information derived from clinical measures. The two general categories of surveys are symptom surveys and quality of life (QoL) surveys. Symptom surveys are widely used in clinical settings to assess and track a patient’s subjective perception of their symptoms.1 QoL or patient reported outcome measures (PROMs) are used to measure the impact of health disorders on quality of life and to assess changes in quality of life after treatment.2–4 Length, question development, and response delivery range depend on the type of population the survey is directed towards.5 PROMs and symptom surveys have long been used and have advantages/disadvantages when it relates to surveillance and reporting illnesses. Whether the survey instrument is online or on paper, symptom surveys are meant to supplement clinical expertise and can provide insight into the population being examined. PROMs have the advantage of being able to record patient’s perspective which may not always be evident in clinical vision tests.
All surveys are inherently subjective because a respondent assigns their own scaled value to their perceived experience which may lead to inconsistencies, especially when rating the severity of a symptom.2,6 In addition, there is an issue of bias in health questionnaires with ambiguous metrics.5,7 The common characteristics of these instruments are questions related to symptomology and a paired item scale that can be completed in an at-home or clinic setting. Respondents denote the level of their symptomology to the scaled response, which yields a summed value after completion.2 The most common scale used is the Likert Scale, a popularized psychometric often used for symptom surveys.8 A scale of numbers (ex. from 1 to 10 points) can ask a respondent to correlate their symptoms to the increasing number.8 After a respondent completes the survey, their scores are totaled and calculated to determine a composite score. It may be difficult for a patient to differentiate, for example, a 4 from a 6, and that perception could vary from day-to-day leading to variable results. The benefits of these existing instruments are that they can be brief and easy to use/understand by respondents.9 Some surveys, such as the Computer Vision Syndrome questionnaire (CVS-Q),10 attempt to resolve this issue by take into account the intensity of the symptom; however, the subjective nature of symptom frequency is still present.
The traditional surveys have two issues that impact their effectiveness. First, since these surveys inquire about symptom severity, the timing aspect of the symptom (how long before the symptom occurs) is often overlooked. By only asking for the severity of a symptom, the surveys neglect to consider that some symptoms only develop after performing an activity after a certain duration. Secondly, a vast majority of the surveys compute the score by aggregating the number of symptoms or the score of symptoms, even for questions that are not applicable to a respondent. This leads to an artificial increase or decrease in symptomology. An example of a survey that has these issues is the Convergence Insufficiency Symptom Survey (CISS),6,11 an instrument currently used in conjunction with clinical values to reach a diagnosis of symptomatic convergence insufficiency. An ideal survey should be able to be customized for individual participants, in addition, the survey should also examine the quality of the life issues caused by the symptoms.12,13 Studies have demonstrated that PROMs that allow a dynamic selection of the best items for each subject and allow items to be added, and removed over time increase measurement precision, increase statistical power and require fewer items to attain the desired level of accuracy, and require smaller sample sizes in clinical trials.14–16
This study involves the development of a novel survey, the Vision Quality of Life with Time (VisQuaL-T, pronounced Vis-Quality), that addresses these two issues and targets populations with oculomotor disorders such as accommodative dysfunction, binocular vision dysfunctions, and eye movement disorders. The goal of this study is to develop a survey that asks a patient to quantify when symptoms arise based on time. In addition, respondents are not forced to answer questions that are not applicable to them and they can add visual activities that are important in their lives if the default activities are not relatable to them.
Materials and Methods
Survey Development and Elements
Traditional quality of life surveys, both specifically related and not related to vision, typically ask users to rate their symptoms or symptom provocation on a five-point or ten-point Likert-Scale.4,5,9 Instead of asking about the severity of symptoms, this study was designed to create a survey which would estimate the duration of time a person can participate in the activity without being symptomatic. A focus group of six vision scientists and optometrists were asked to collectively identify a set of common visual or vision-related symptoms. The key symptoms identified were headache, dizziness, eye strain, double vision, floating words, blurry vision, inability to pay attention, and easily distracted. The focus group, additionally, helped identify 10 daily activities that have the potential to elicit visual symptoms in an average person across various age groups. In addition to these 10 standard questions, there is an option to add up to three activities that are specific to the respondent at the end of the survey. Participants who do not engage in at least 6 of the suggested 10 activities are asked to fill in the optional activities until the minimum number of activities is at least 6. These three optional activities can be any activity that is important in their daily life.
This instrument involves rating the emergence of symptoms related to visual activity within four different time ranges. The time range options are: 0–15 minutes, 15–30 minutes, 30–45 minutes, and greater than 60 minutes. A fifth option of not applicable (N/A) is also listed next to the time options so the participant can indicate that an activity does not apply to them. Each of the time rating options are given a different linear weight; where 0–15 minutes is a score of 0, each option increasing the score by one, and greater than 60 minutes being a score of 3. The Total Score is computed by summing the score for each of the activities. The Composite Score is determined by dividing the Total Score by number of questions answered (ten minus number of n/a responses). This method ensures that an activity, not applicable to a participant, will not skew their Composite Score, which will always be between 0 and 3. A sample form of the survey with instructions is included in Appendix 1 and can be found online at https://research.njit.edu/sqrl/visqualt. To evaluate the survey, the same methodology of Total Score and Composite Score is also utilized when calculating the average score for each individual question. For each participant’s response to individual questions, a numeric weight from 0 to 3 is assigned from “0–15 minutes” to “greater than 60 minutes” options. All of the weights are summed and divided by the number of participants that did not chose N/A as a response.


Participant Selection
Two separate cohorts were recruited for evaluating the survey instrument. The first “normative” cohort of 376 participants were recruited between 2018 and 2019 from the general campus of New Jersey Institute of Technology (NJIT) in Newark, New Jersey, USA. The second “repeatability” or “test-retest” cohort consisted of 54 participants recruited in the Summer of 2020 from the athletic teams of NJIT.
This study was approved by the New Jersey Institute of Technology’s Institutional Review Board in accordance with the Declaration of Helsinki. Informed consent from the participant was given before participation in the study. If a participant was younger than the age of 18, a parent or guardian gave consent for participation in the study, in addition to the participant’s assent.
Data Collection
Data from the normative cohort were obtained by researchers approaching students, staff, and guests on the NJIT campus and asking if they would be willing to participate in a short study. The only exclusion criteria were a self-reporting of no prior history of traumatic brain injuries (TBI), neurodegenerative disorders, or partial/full blindness. Upon signing informed consent/assent, participants were presented with an Android tablet that contained the survey instructions and the survey. The instruction from the survey was read out loud to the participants and the participants were instructed to select the options for each question that best applied to them. Upon completion, the data were stored for offline analysis.
The repeatability study was conducted virtually because of the COVID-19 pandemic and Stay at Home Orders. Participants from a different study halted due to the pandemic were contacted via email to participate in this study. They were instructed to fill out the survey twice, at least 10 days apart. The participants self-populated the survey on a webform after a researcher explained how to fill out the VisQuaL-T survey via email. These participants previously completed the survey in-person earlier that year (January 2020), so they had familiarity with the survey instrument. All participants confirmed that they had no current diagnosis of concussion or traumatic brain injury.
Statistics
Several statistical tests were used to evaluate the performance, reliability, and repeatability of the VisQuaL-T instrument using IBM SPSS Statistics 27. Descriptive statistics such as mean, minimum, maximum, confidence intervals, and standard deviation were calculated for the composite scores and mean scores for each question in both cohorts. A paired t-test with an alpha of 0.05 was used for assessing the repeatability of the composite score. Parametric tests were chosen over non-parametric tests because the intended large sample size for this study would satisfy the central limits theorem.17 To assess the instrument’s reliability between test and retest, the intercorrelation coefficient (ICC)18 and Cronbach’s alpha was calculated. An ICC reliability value is considered poor below 0.5, moderate between 0.5 and 0.75, good between 0.75 and 0.9, and excellent above 0.9. The Cronbach’s alpha aided in determining the internal consistency of the questions/survey activities. A Cronbach coefficient above 0.7 was considered as a high value. An independent t-test was used to assess sex differences in the normative data. Cohen’s d was used to calculate effect size; a Cohen variable above 0.8 is said to have a large effect size, whereas a value above 0.5 is said to have medium effect size.
Results
The normative cohort had a sample size of 376 participants with a mean age of 20.4 ± 3.4 years old (47% male, age range 11–34 years old). Approximately 11% of the participants (n = 42) were younger than 18 years, whereas the remaining 334 were 18 years or older. The mean composite score was 2.47 ± 0.54 with a median of 2.70 and a 95% confidence interval of 2.38–2.71. The maximum score was 3 and minimum was 0. Utilizing the lower boundary of the 95% confidence interval, 255 participants (68%) had a composite score greater than or equal to 2.4, while the remaining 121 participants (32%) had a composite score lower than 2.4.
The repeatability cohort had a sample size of 54 participants with a mean age of 20.2 ± 1.6 years old (57% male, age range 18–22 years old). The mean time between test/retest timepoints was 14.2 ± 5.25 days. One participant had 50 days between test and retest and was omitted from the average previously reported. The mean composite score for the first and second time point was 2.69 ± 0.42 (median 2.88) and 2.67 ± 0.49 (median 2.89), respectively. The 95% confidence interval was 2.58–2.81 for timepoint 1 (test) and 2.54–2.80 for timepoint 2 (retest). Both timepoints had a maximum composite score of 3 with a minimum of 1.10 and 0.9 for test and retest, respectively. A paired t-test revealed no statistical differences in the composite score between the two timepoints in the repeatability cohort. The descriptive statistics from both cohorts are displayed in Table 1 and the frequency distribution from the normative cohort is shown in Figure 1. No differences between sex were observed in the normative or repeatability cohort (p > 0.5).
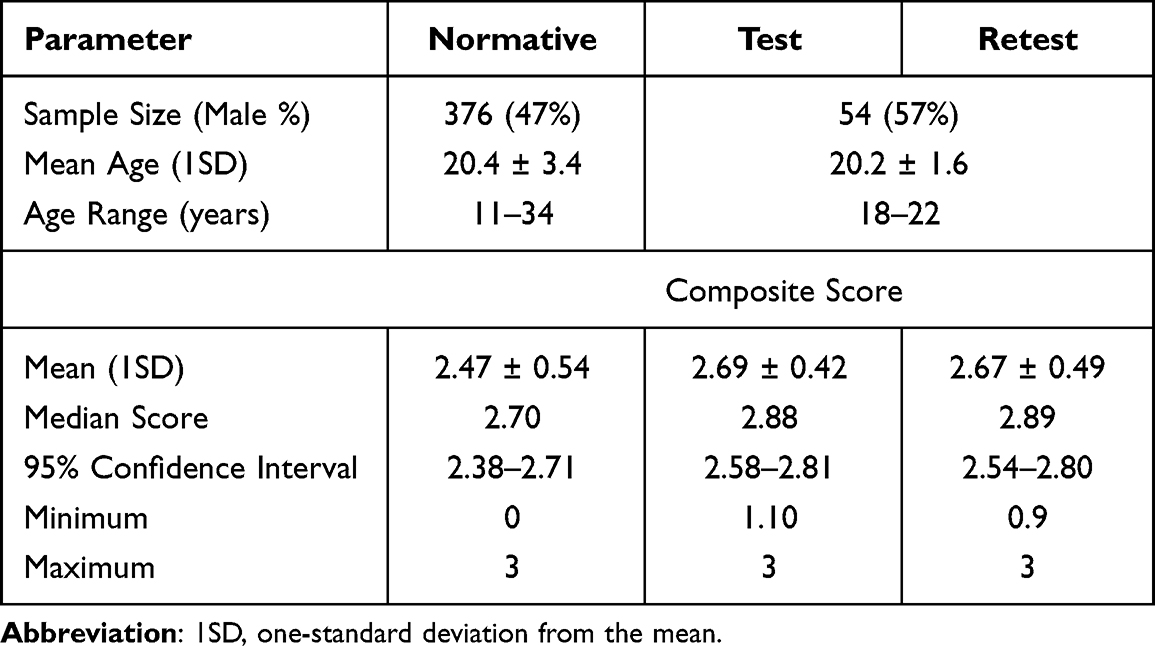 |
Table 1 A Summary of Descriptive Statistics of All Cohorts is Shown in Order Below |
 |
Figure 1 Normative cohort’s Composite score distribution as a frequency. |
There was good reliability and high correlation between the test and retest timepoints with an ICC of 0.825 and a Pearson correlation coefficient of 0.839. The scatterplot in Figure 2 depicts the reliability of the survey instrument for the repeatability cohort. On the x-axis is the mean test (timepoint 1) composite score, and the mean retest (timepoint 2) composite score is on the y-axis.
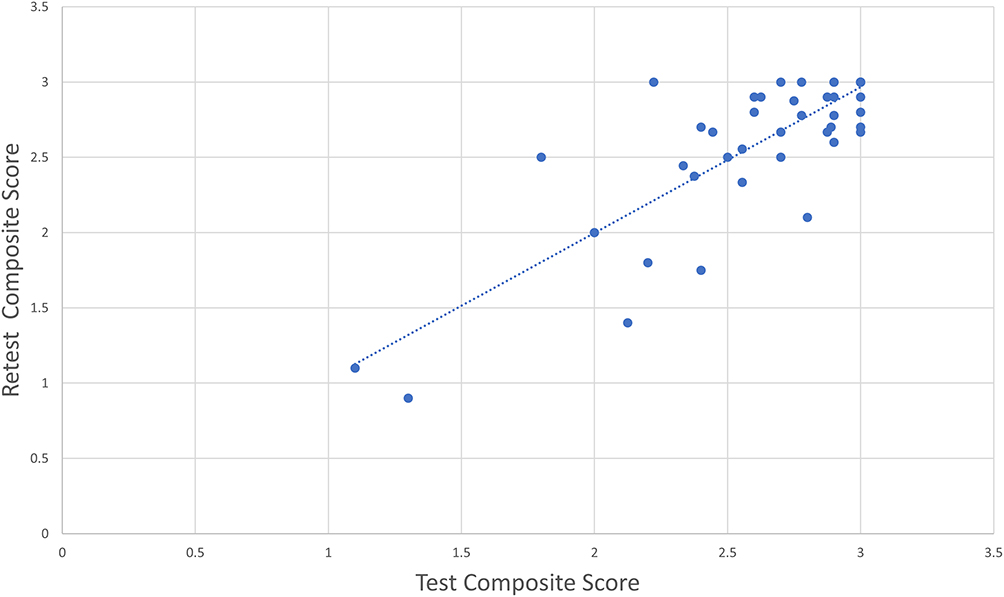 |
Figure 2 Scatterplot of test composite score and retest composite score with a linear fit of data. |
The VisQuaL-T questions also showed a good internal consistency in the normative cohorts with a Cronbach’s alpha value of 0.803. Figure 3 depicts the group level means of the Composite Score with standard deviation for each individual question from the VisQuaL-T survey. The normative cohort averages are shown in gray while the test and retest averages are shown in blue and orange, respectively. A paired t-test between the test and retest timepoints showed no statistical significance among the questions (p > 0.1). Question 4 has a large effect size with Cohen’s d > 0.8. Questions 1, 2, and 5–10 had a medium effect size of Cohen’s d > 0.5. An independent t-test between the responses to the individual questions from normative cohort and first timepoint (test) of the repetitive cohort also revealed no statistical significance (p > 0.05). The ICC values for each individual question between the test and re-test timepoints ranged from poor to good. Quantified through an ICC, Questions 1 (0.75), 3 (0.75), 5 (0.59), and 8 (0.76) all showed moderate reliability, and the rest of the questions had poor reliability (0.23 to 0.47).
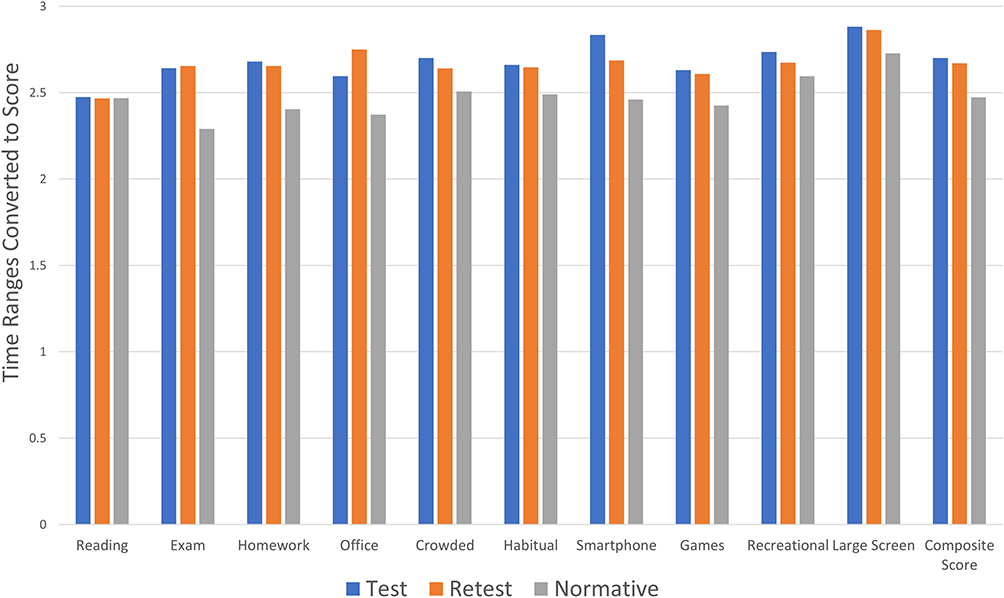 |
Figure 3 Mean response score for individual question and the mean composite score for all cohorts. The bar plots are listed in the order the questions were presented with question related to reading being question 1 and question related to utilization of larger screens being question 10. |
No participant in either cohort chose more than four not applicable (N/A) options for the individual questions. Since at least 6 questions were answered with a timed response, the optional questions were not utilized by any participant.
Discussion
This study was conducted to design a QoL measure that focuses on the timeframe an individual can participate in visual activities before the onset of symptoms. The results show the potential for VisQuaL-T to be a robust survey instrument for assessing the visual quality of life due to its repeatability and reliability. In its design (through the default activities and ability to add optional activities), the survey instrument was intended to be used on a wide range of ages, occupations, background, and symptomology. The availability of optional questions allows for the survey instrument to be personalized for each participant. This normative study was completed on healthy, non-head injury, adolescents and young adults. The data from the repeatability cohort confirmed the normative values for a general population. A threshold score of 2.4, shown as the lower boundary of the 95% confidence interval, can potentially be utilized by researchers and clinicians to differentiate those with normal and abnormal visual quality of life. These scores and threshold can also be used to compare other age or demographic cohorts. In the normative cohort, 32% of the participants had a composite score lower than 2.4. Prior studies have shown that 28–32% of the general population has some form of binocular dysfunction.19–22 Further studies will need to be conducted to validate the 2.4 threshold or establish a new threshold for various dysfunctions. The right skewed normative distribution can be rationalized by the fact that the vast majority of the population does not exhibit any visual symptoms. The survey is designed in a manner where no or few symptoms would result in a high score.
The normative and test–retest group showed similar mean composite scores, even though both cohorts had a different set of participants. In the test–retest cohort, the participants have similar composite scores when the survey was taken at different timepoints. These aspects of the study suggest the instrument’s repeatability. The utilization of time as a quantifying metric may be a better method compared to the utilization of a Likert-scale. Prior studies have shown that visual endurance is an important component of binocular visual health, and that time can serve as a key differentiator between normal and dysfunctional individuals.23–25 Although the composite score showed good reliability, when examining the individual activities/questions, only 4 out of the 10 showed good reliability. This difference could either be attributed to the lingering subjective nature of the survey or a change in activities from one week to another for the participant. The VisQuaL-T attempts to minimize the subjective nature of the survey; however, it is yet not possible to completely eliminate the subjectivity.
Among both cohorts, the activities/questions regarding reading for pleasure (question 1) and playing video games (question 8) did not always apply to all participants, as seen by the larger number of not applicable (N/A) option selected for these two questions compared to the others. This, however, does not warrant a change to any question or the need to add additional questions as each participant was able to complete the instrument without using any optional questions. Each participant found at least six other questions that were applicable to their daily life.
Oculomotor deficiency also occurs in about 75% of concussion patients.26–29 It is also one of the most persistent impairments that preclude an individual from recovery.30 A survey instrument like VisQuaL-T can be utilized to assess the visual state of a person after an injury and use it as an additional qualifying tool. This simple instrument can also be utilized by clinicians to track the progress of recovery and change therapeutic regiments if necessary. Additionally, the results of the VisQuaL-T, the composite score, when translated into something comprehensible like time before symptom provocation can be more meaningful for a patient and make it easier for them to view their recovery progress or the lack thereof.9
Future studies should include adult and geriatric populations to ensure that the normative Composite Scores and threshold established in this study population are universal. One limitation of this study is the limited population age range of adolescents and young adults. The prevalence of visual symptoms and time to symptom provocation may be different for various age ranges. Additionally, although the NJIT campus is known for its diversity, any university campus has the chance to be homogenous with many other characteristics, leading to another limitation. A wider general population should be studied in the future to validate the scores and threshold seen in this study. Studies on concussed and binocularly dysfunctional cohorts should also be performed to examine the ability of the VisQuaL-T instrument to identify concussed individuals and see if the progress of recovery can be tracked as that was out of the scope of this normative and repeatability study. Finally, this survey instrument can be utilized on cohorts with various binocular dysfunctions to see if it can be used as a screening tool for dysfunctions like convergence insufficiency.
Conclusion
The VisQuaL-T survey was designed to improve upon existing symptom surveys by incorporating the element of endurance and providing an opportunity to personalize the survey. VisQuaL-T is intended to be applicable to a wide range of populations and to identify visual symptoms and effects on visual quality of life. This instrument has the potential to be an effective early screening tool so patients can be directed to proper care where trained clinicals can further examine the responses and identify the causes of a patient’s discomfort and/or isolate the precise symptomology through a comprehensive examination. This study establishes normative values and demonstrates the repeatability of the instrument. Further studies need to be conducted to determine the ability of the instrument to differentiate patients with visual impairment from those with normal visual function.
Acknowledgments
This research was supported by NJIT Startup Funds provided to C. Yaramothu.
The authors thank Joel Rajah, Linda Tawdros, Yasemin Botas, and Fatima Masadeh of the New Jersey Institute of Technology’s Biomedical Engineering Department for their assistance in recruiting participants and collecting data.
Disclosure
The authors have no interest or relationship, financial or otherwise, that might be perceived as influencing the authors’ objectivity which can be considered a potential source of conflict of interest.
References
1. Baron S, Hales T, Hurrell J. Evaluation of symptom surveys for occupational musculoskeletal disorders. Am J Ind Med. 1996;29(6):609–617. doi:10.1002/(SICI)1097-0274(199606)29:6<609::AID-AJIM5>3.0.CO;2-E
2. Burckhardt CS, Anderson KL. The Quality of Life Scale (QOLS): reliability, validity, and utilization. Health Qual Life Outcomes. 2003;1(1):1–7. doi:10.1186/1477-7525-1-1
3. Kumaran SE, Khadka J, Baker R, Pesudovs K. Patient-reported outcome measures in amblyopia and strabismus: a systematic review. In: Clinical and Experimental Optometry. Vol. 101. Taylor & Francis; 2018:460–484.
4. Braithwaite T, Calvert M, Gray A, Pesudovs K, Denniston A. The use of patient-reported outcome research in modern ophthalmology: impact on clinical trials and routine clinical practice. Patient Relat Outcome Meas. 2019;10:9–24. doi:10.2147/PROM.S162802
5. Choi BCK, Pak AWP. A catalog of biases in questionnaires. Prev Chronic Dis. 2005;2(1):25.
6. Borsting E, Rouse MW, Mitchell GL, et al. Validity and reliability of the revised convergence insufficiency symptom survey in children aged 9 to 18 years. Optom Vis Sci. 2003;80(12):832–838. doi:10.1097/00006324-200312000-00014
7. Aday LA. Designing and Conducting Health Surveys: A Comprehensive Guide.
8. Joshi A, Kale S, Chandel S, Pal DK. Likert scale: explored and explained. Curr J Appl Sci Technol. 2015;7(4):396–403.
9. Suhr C, Shust M, Prasad R, Wilcox D, Chronister C. Recognizing TBI-related vision disorders. Rev Optomet. 2015;152:56–62.
10. Seguí MDM, Cabrero-García J, Crespo A, Verdú J, Ronda E. A reliable and valid questionnaire was developed to measure computer vision syndrome at the workplace. J Clin Epidemiol. 2015;68(6):662–673. doi:10.1016/j.jclinepi.2015.01.015
11. Rouse MW, Borsting EJ, Mitchell GL, et al. Validity and reliability of the revised convergence insufficiency symptom survey in adults. Ophthal Physiol Opt. 2004;24(5):384–390. doi:10.1111/j.1475-1313.2004.00202.x
12. Carswell A, McColl MA, Baptiste S, Law M, Polatajko H, Pollock N. The Canadian Occupational Performance Measure: a research and clinical literature review. In: Canadian Journal of Occupational Therapy. Vol. 71. Los Angeles, CA: SAGE PublicationsSage CA; 2004:210–222.
13. Law M, Baptiste S, Mccoll M, Opzoomer A, Polatajko H, Pollock N. The Canadian Occupational Performance Measure: an outcome measure for occupational therapy. Can J Occup Ther. 1990;57(2):82–87. doi:10.1177/000841749005700207
14. Fries JF, Cella D, Rose M, Krishnan E, Bruce B. Progress in assessing physical function in arthritis: PROMIS short forms and computerized adaptive testing. J Rheumatol. 2009;36(9):2061–2066. doi:10.3899/jrheum.090358
15. Fries JF, Krishnan E, Bruce B. Items, Instruments, Crosswalks, and PROMIS. J Rheumatol. 2009;36(6):1093–1095. doi:10.3899/jrheum.090320
16. Fries J, Rose M, Krishnan E. The PROMIS of better outcome assessment: responsiveness, floor and ceiling effects, and internet administration. J Rheumatol. 2011;38(8):1759–1764. doi:10.3899/jrheum.110402
17. Kwak SG, Kim JH. Central limit theorem: the cornerstone of modern statistics. Korean J Anesthesiol. 2017;70(2):144. doi:10.4097/kjae.2017.70.2.144
18. Thirunavukarasu AJ, Mullinger D, Rufus-Toye RM, Farrell S, Allen LE. Clinical validation of a novel web-application for remote assessment of distance visual acuity. Eye. 2021;36(10):2057–2061. doi:10.1038/s41433-021-01760-2
19. Tan QQ, Lewis JS, Lan CJ, et al. Preoperative binocular vision characteristics in the age-related cataract population. BMC Ophthalmol. 2022;22(1):1–9. doi:10.1186/s12886-022-02418-7
20. Franco S, Moreira A, Fernandes A, Baptista A. Accommodative and binocular vision dysfunctions in a Portuguese clinical population. J Optom. 2021;15:271–277.
21. Jang JU, Park IJ. Prevalence of general binocular dysfunctions among rural schoolchildren in South Korea. Taiwan J Ophthalmol. 2015;5(4):177. doi:10.1016/j.tjo.2015.07.005
22. Porcar E, Martinez-Palomera A. Prevalence of general binocular dysfunctions in a population of university students. Optom Vis Sci. 1997;74(2):111–113. doi:10.1097/00006324-199702000-00023
23. Yaramothu C, Greenspan LD, Scheiman MM, Alvarez TL. Vergence endurance test: a pilot study for a concussion biomarker. J Neurotrauma. 2019;36:2200–2212. doi:10.1089/neu.2018.6075
24. Yaramothu C, Santos EM, Alvarez TL. Effects of visual distractors on vergence eye movements. J Vis. 2018;18(6):1–17. doi:10.1167/18.6.2
25. Yaramothu C, Morris CJ, D’Antonio-Bertagnolli JV, Alvarez TL. OculoMotor Assessment Tool (OMAT) test procedure and normative data. Vis Sci. 2021;98(6):636–643. doi:10.1097/OPX.0000000000001698
26. Master CL, Scheiman M, Gallaway M, et al. Vision diagnoses are common after concussion in adolescents. Clin Pediatr. 2016;55(3):260–267. doi:10.1177/0009922815594367
27. Goodrich GL, Martinsen GL, Flyg HM, et al. Development of a mild traumatic brain injury-specific vision screening protocol: a Delphi study. J Rehabil Res Dev. 2013;50(6):757–768. doi:10.1682/JRRD.2012.10.0184
28. Craton N, Ali H, Lenoski S, Craton N, Ali H, Lenoski S. COACH CV: the seven clinical phenotypes of concussion. Brain Sci. 2017;7(12):119. doi:10.3390/brainsci7090119
29. Scheiman M, Grady MF, Jenewein E. Frequency of oculomotor vision disorders in adolescents 11 to 17 years of age with concussion, 4 to 12 weeks post injury. Vision Res. 2021;183:73–80. doi:10.1016/j.visres.2020.09.011
30. Gallaway M, Scheiman M, Mitchell GL. Vision therapy for post-concussion vision disorders. Optom Vis Sci. 2017;94(1):68–73. doi:10.1097/OPX.0000000000000935
 © 2023 The Author(s). This work is published and licensed by Dove Medical Press Limited. The full terms of this license are available at https://www.dovepress.com/terms.php and incorporate the Creative Commons Attribution - Non Commercial (unported, v3.0) License.
By accessing the work you hereby accept the Terms. Non-commercial uses of the work are permitted without any further permission from Dove Medical Press Limited, provided the work is properly attributed. For permission for commercial use of this work, please see paragraphs 4.2 and 5 of our Terms.
© 2023 The Author(s). This work is published and licensed by Dove Medical Press Limited. The full terms of this license are available at https://www.dovepress.com/terms.php and incorporate the Creative Commons Attribution - Non Commercial (unported, v3.0) License.
By accessing the work you hereby accept the Terms. Non-commercial uses of the work are permitted without any further permission from Dove Medical Press Limited, provided the work is properly attributed. For permission for commercial use of this work, please see paragraphs 4.2 and 5 of our Terms.