")
Back to Journals » Patient Related Outcome Measures » Volume 15
Usage and Health Outcomes of Home Hemodialysis vs Center Hemodialysis in Racial/Ethnic Minority Groups in the United States a Quantitative Research in 2016–2019 USRDS Using Aday-Anderson Framework and Multiple Regression Models
Authors Zhu Y
Received 28 April 2023
Accepted for publication 15 December 2023
Published 9 January 2024 Volume 2024:15 Pages 1—16
DOI https://doi.org/10.2147/PROM.S416279
Checked for plagiarism Yes
Review by Single anonymous peer review
Peer reviewer comments 2
Editor who approved publication: Professor Lynne Nemeth
Ying Zhu
Department of Health Policy and Management, School of Public Health, University of Maryland, College Park, MD, USA
Correspondence: Ying Zhu, Department of Health Policy and Management, University of Maryland School of Public Health, 3310D School of Public Health (Bldg #255), 4200 Valley Drive, College Park, MD, 20742-2611, USA, Email [email protected]
Introduction: Home hemodialysis (HHD) offers patients with end-stage kidney disease (ESKD) greater flexibility and advantages of health outcomes over center hemodialysis (CHD). This study aims to investigate the differences between home and center hemodialysis with a focus on racial/ethnic minorities.
Methods: The US Renal Disease System (USRDS) 2019 patient core data containing mortality and hospitalization which are cumulative since 2010 were merged with 2016– 2019 Medicare clinical claims. To assess demographic and medical factors adjusted utilization and mortality of HHD vs CHD within every racial/ethnic cohort, logistic regression was used, and negative binomial regression was conducted to analyze the number of hospitalizations.
Results: Evaluating 548,453 (97.48%) CHD patients and 14,202 (2.52%) HHD patients with Whites 47%, Blacks 32%, Hispanics 15%, Asians 4%, and other minorities 2%, the outcomes from adjusted regressions showed that: 1) minorities were significantly less likely to use HHD than Whites (Blacks: OR, 0.568, 95% CI, 0.546– 0.592; Hispanics: OR, 0.510, 95% CI, 0.477– 0.544; Asians: OR, 0.689, 95% CI, 0.619– 0.766; Others: OR, 0.453, 95% CI, 0.390– 0.525; p < 0.001); 2) most minority patients were younger and had fewer comorbidities than Whites, and all minority groups displayed significantly lower mortality and hospitalization incidences than the White group with adjustment on multiple covariates; 3) in the overall and main racial/ethnic cohorts, HHD showed a significantly lower risk of death than CHD after confounding for major risk factors (overall cohort: OR, 0.686, 95% CI, 0.641– 0.734; White: OR, 0.670, 95% CI, 0.612– 0.734; Blacks: OR, 0.717, 95% CI, 0.644– 0.799; Hispanics: OR, 0.715, 95% CI, 0.575– 0.889; Others: OR, 0.473, 95% CI, 0.265– 0.844).
Conclusion: There are substantial racial/ethnic variations in home hemodialysis use and health outcomes in the United States.
Keywords: home hemodialysis, racial/ethnic differences, end-stage renal disease, health service use, risk of death
Background
Unlike other chronic diseases, chronic kidney disease (CKD) is a major non-communicable condition that rapidly progresses into chronic morbidity and mortality among patients.1 The stages of CKD are typically classified based on the estimated Glomerular Filtration Rate (eGFR) and the presence of albuminuria (a detailed definition of the five stages of CKD is listed in the Glossary). All racial and ethnic groups in the United States are seeing an increase in chronic diseases, such as CKD.2 In fact, one-third of American adults are at risk of suffering from CKD.3 One of the reasons behind this trend is that obesity, diabetes, hypertension, metabolic syndrome, and other renal dysfunction or cardiovascular risk factors have increased, particularly in ethnic and racial minorities.2 The racial/ethnic differences that exist among patients more likely to develop a chronic disease in the US are well documented. For example, in the US Black individuals suffer from CKD 1.5 to 2 times as frequently as white patients.4 They also have an increased prevalence of various risk factors, such as high blood pressure and diabetes mellitus, for chronic kidney failure (CKF).1 In the United States, the disease disproportionately affects racial and ethnic minorities. Black Americans are four times and Hispanic are 1.3 times more likely to suffer kidney failure, which is the end stage of chronic kidney disease and called end-stage kidney disease (ESKD), than white patients. In 2018, there was a 3.4-fold increase in the adjusted prevalence of ESKD in black Americans compared to white Americans.5
Essentially, dialysis care serves as a vital therapeutic intervention for individuals facing end-stage kidney disease (ESKD) when kidney transplantation is not a feasible or immediate option, and this can be performed in a clinic or at home. Dialysis can be classified in two main types: hemodialysis (HD) and peritoneal dialysis (PD). In HD, blood is moved from the body and out of the body via a machine and tubes and at the same time is cleaned using a dialysis fluid in a filter known as a dialyzer.6,7 In PD, dialysate, a solution used in dialysis that helps eliminate waste and surplus fluid from the blood, is usually injected into the abdomen using normal saline, either by hand or by a machine termed a PD cycler, to filter the blood via permeable exchange with blood vessels in the peritoneum.6,7 Both HD and PD are the medical treatment that filters blood by a mechanism similar to the kidney’s function and makes it possible for patients with CKF to continue living with ESKD for many years or decades.7 Long-term adequate dialysis can effectively control hypertension and reduce other chronic complications.8–11
A well-accepted metric to quantify hemodialysis is “Kt/Vurea”, which refers to the competency of removing the amount of a toxic substance-urea in a patient’s blood through dialysis and it is generally adopted to assess dialysis adequacy or efficacy. Urea is a chemical compound that plays a crucial role in the excretory system of mammals, including humans. It is a waste product formed in the liver as a result of protein metabolism. The liver processes proteins, breaking them down into amino acids, and the nitrogen-containing part of amino acids is converted into urea. Urea is then transported through the bloodstream to the kidneys, where it is filtered out of the blood and excreted in the urine.12 Dialysis urea clearance K and treatment time t make up the numerator of this equation, and urea distribution volume V serves as the denominator.7 Urea is a good surrogate marker of accumulated body toxins because it is a small, water-soluble molecule.7 Urea nitrogen includes nitrogen-containing compounds other than protein in plasma, which is filtered through the glomerulus and excreted from the body. Further, urea comes from the breakdown and degradation of various amino acids.7 Its concentration is based on protein intake. When renal insufficiency is decompensated, urea nitrogen will increase. Therefore, Kt/Vurea is clinically used as an index to judge glomerular filtration function and dialysis adequacy. Because of its abundance in renal failure and urea’s good dialyzability, it can implicate the status of other pathogenic solutes in the blood.13,14 Adequate dialysis is crucial for removing waste products from the blood in patients with kidney failure who rely on dialysis treatments. A higher Kt/Vurea value generally indicates more effective clearance of urea and suggests better dialysis adequacy. This parameter is often monitored in clinical practice to optimize dialysis prescription and ensure that patients receive adequate treatment to manage their condition. It’s a well-established metric in the scientific literature related to nephrology and renal replacement therapy. By getting rid of toxins and superfluous fluid from the body, hemodialysis can maintain water and electrolyte homeostasis and, in the long run, it reduces a variety of morbidities and ultimately mortality.15 Hence, the more effective the hemodialysis as represented by a large value of Kt/V, the better the removal of excess body water and toxins from the blood, the fewer uremia symptoms and morbidities, the better the clinical outcome, quality of care, and quality of life of the HD individuals, and ultimately the less the ESKD mortality. A patient’s average Kt/V should be not less than 1.2 and can be raised either by prolonging time on dialysis or improving blood flow through the dialyzer.16
Conventionally, hemodialysis can be carried out three times a week in a hospital or a dialysis center, with each time lasting approximately four to five hours. Outpatient hemodialysis services are the mainstay for treating most of the ESKD patient population in the U.S.17 Since the early 1960s in the US and Britain, some patients have begun to perform hemodialysis at home. Home hemodialysis (HHD) is much more independent and flexible because it saves travel time and is not constrained by the dialysis center’s operating hours. Moreover, HHD allows for more treatment time each session, which could continue overnight, thus making the blood purification more complete.8–11
The subject of HHD has not been extensively studied in the United States.18 The overwhelming majority of the available research on dialysis area only compared the benefits of peritoneal dialysis with hospital center hemodialysis.18 Review of studies on HHD showed a lower hazard ratio for mortality and a survival benefit associated with home hemodialysis vs the conventional thrice-per-week hemodialysis.17,19,20 Limited data from international studies in Europe, North America, and Oceania with similar healthcare systems to the United States suggested that there was no distinction between HHD and CHD in terms of cardiovascular morbidity, which was the primary cause of death in the dialysis population, or in terms of all-cause hospitalization.6,9,19,21,22 However, due to the high risk of selection bias, some registry studies have weak supporting evidence; few were prospective randomized cohort or retrospective controlled trials.6,19,23 Additionally, the majority of these international studies used small sample sizes, only monitored patients for a brief period, and focused on the intermediate clinical outcomes instead of the long-term endpoint. Home hemodialysis also costs 7% less than center hemodialysis, a significant difference.6,19,20,23,24 Home hemodialysis also costs 7% less than center hemodialysis, a significant difference.21 These discoveries have led researchers to suppose that HHD is the best renal replacement therapy other than kidney transplantation.25,26
The majority of the ESKD population were receiving hemodialysis at hospitals or dialysis clinics, and very few individuals were being treated at home, despite a substantially lower relative risk of mortality than either hospital and clinic hemodialysis or peritoneal dialysis.27–30 Besides, data from national registries demonstrated that compared to White patients, people of color were much less likely to begin either PD or HHD treatment.31–33 This is not affected considerably when entirely controlled for demographic, clinical, and socioeconomic factors.34
The availability of dialysis and CKD data provided by the United States Renal Disease System offers the opportunity to provide new evidence for the US on the impact of delivery models using home-based hemodialysis practices on effective treatment among racial and ethnic minority populations with ESKD. The objective of this study is: 1) to examine racial and ethnic differences in the use of home vs center hemodialysis in this high-need population - specifically, to describe and compare the variations in healthcare used by people with home hemodialysis vs with center hemodialysis, with a focus on racial and ethnic disparities; 2) to look at dialysis-related health outcomes and how they differ by race/ethnicity among individuals with ESKD; and 3) to understand how home hemodialysis can improve care quality among racial and ethnic minorities. Using the national consolidated data, it was possible to test the research hypothesis that home hemodialysis was significantly less common among Americans with ESKD but could have a positive impact on health outcomes, particularly for racial and ethnic minorities.
Method
Data Sources: United States Renal Data System (USRDS)
This research created an individual-level data file that covered specific features and variables accumulated in inpatient core records, including deaths and hospitalizations, from 2010 to 2019, and merged with USRDS clinical claims from 2016 to 2019. The United States Renal Data System (USRDS), funded by the National Institute of Diabetes and Digestive and Kidney Diseases (NIDDK) in collaboration with the Centers for Medicare & Medicaid Services (CMS), the United Network for Organ Sharing (UNOS), and the ESKD networks, is a national database that gathers, evaluates, and disseminates datasets about CKD and ESKD in the U.S.35 This data contains demographic characteristics (age, sex, race/ethnicity), health care use (center hemodialysis visits and home hemodialysis use), health outcome and quality indicators (death, hospitalization, Kt/V), and spending (total per capita spending and total spending on dialysis services). All the Veterans Administration (VA) patients are not included in the USRDS database. The VA operates its own healthcare system separate from other public and private healthcare providers such as CMS. Differences in data collection methods, systems, and patient populations may make it challenging to integrate VA data seamlessly into national databases like the USRDS. Using the USRD system, a data set was created with the following parameters: individuals with ESKD diagnosis and HD treatment, indicators associated with dialysis outcome, and quality of care.
The Standard Analysis Files (SAFs), which were first launched by the USRDS Coordinating Center in 1994 and later improved to include ESKD clinical and claims data from CMS, were created to help address the demand for research data for a wide range of indicators among the ESKD population.35 Within SAFs, all data are assigned by the unique USRDS-specified patient identification number.35 One of the unique features of the USRDS is that it is structured around individual ESKD treatment events, rather than individual patients. An ESKD event is defined as the initiation of dialysis or kidney transplantation or the death of a patient with ESKD. This means that each observation in the USRDS represents a discrete treatment event, rather than a patient. Data from multiple data sources, such as CMS SAF claims, Facility Survey data, Patient Lists, Patient Events, Medical Evidence reports, and Death Notification data, is added to the USRDS ESKD database on a quarterly basis.35 Generally, each patient for the entire ESKD therapy period is associated with one Medical Evidence form; however, if a patient changes insurance because of modality changes, multiple forms may be filed to USRDS. Datasets from final act claims offered by Medicare beneficiaries are included in the CMS ESKD Standard Analytical Files (SAFs).35 The Treatment History Files in the USRDS Core SAF dataset keep track of each patient’s usage of various modalities in order.35 Every individual’s file record details their time receiving therapy with a certain modality, and whenever that modality changes, a new record is created for that patient.35 Given the structure of this database, there is a date associated with any claim lab value, making it possible to attribute any lab value with the type of dialysis at that point in time.
Conceptual Framework
The theoretical framework for this project is grounded upon the Aday-Andersen behavioral model of health service use. The Aday-Andersen behavioral model offers the most frequently used framework for conceptualizing the flow interactions among individual, medical, and environmental factors that influence people’s decisions on health service utilization and health outcomes.36 Within three domains of the Aday-Andersen behavioral model, environmental factors and medical factors are contextual components.37 The environmental factor mainly refers to the healthcare system, including political and economic external institutions as well as the health delivery system, whereas the medical factors indicate healthcare characteristics, including structure, staffing, and capacity factors.37 Based on this Aday-Andersen behavioral model, individual factors influencing health services use can be grouped into three distinct categories: predisposing, enabling, and need.36 These three categories contain various factors associated with healthcare utilization for consideration. Predisposing incorporates characteristics being inherent to the person, for example, these include demographic descriptions such as age, gender, race, etc. that affect a person to use the healthcare system in diverse ways. Enabling relates to access to care where the family’s residential region and insurance coverage may play a role in the manner health services are used. Likewise, the domain of need is as far as individual health status and comorbidities are concerned.36
According to the Aday-Andersen model, factors at both the patient and healthcare provider levels, such as the number of chronic diseases a patient has and a nephrologist’s lack of interest in prescribing home hemodialysis, may have an impact on the usage of home hemodialysis. The use of and barriers to home hemodialysis were examined about the effects of patient-level characteristics, healthcare providers, and other potential factors like racial/ethnic differences.
Sample
The overall cohort contained individuals continuously enrolled in hemodialysis for 12 months from 2016 to 2019, excluding those who are dually eligible. The estimated sample size of ESKD patients in the national USRDS annual report is nearly 790,000. Note that the unit is the hemodialysis episode, and some patients are counted more than once if they have more than one hemodialysis episode. A hemodialysis episode is defined as a period in which the patient is receiving hemodialysis with a given treatment modality. For example, if a patient is first receiving CHD and then switches to HHD, that patient has 2 hemodialysis episodes recorded in the data set. At the end of 2018 in the United States, there were more than 560,000 (roughly 70%) patients undergoing dialysis, which included hemodialysis and peritoneal dialysis and 230,000 (roughly 30%) patients experiencing a kidney transplant.5 Approximately 69,000 (12.5%) of patients receiving home treatment were on peritoneal dialysis rather than hemodialysis.5 Whereas nearly 60% of White ESKD individuals received CHD at the end of 2019, more than 70% of Black patients received CHD in the U.S.5
Measures
The original core patient data set, a cumulative data set on hospitalization starting from 2010, and the Medicare clinical claim data set of 2016, 2017, 2018, and 2019 from the USRDS were merged using SAS 9.4 software and then transferred to Stata data format (Table 1). The ESKD patients who were treated with HHD and CHD according to the dialysis treatment modality variable RXCAT of the 2016–2019 full-year consolidated file were contained in this research. Stata version 15.1 software was used to conduct subsequent statistical analysis.
Statistical Analyses
Home Hemodialysis Use
An exploratory analysis of differences in patients’ use of home hemodialysis vs center hemodialysis by race/ethnicity was conducted. This is a descriptive statistical analysis used to determine baseline differences and the usage of home hemodialysis vs center hemodialysis in various racial/ethnic populations in the USRDS. Comparisons of descriptive parameters such as means, medians, and frequencies between HHD and CHD and these racial/ethnic groups were made using Student’s t-test, one-way ANOVA, Wilcoxon rank-sum, Kruskal–Wallis, Chi-square, and further logistic regression to identify group differences with adjustment on multiple covariates.

The first dependent variable is whether the patient used home hemodialysis or center hemodialysis. This variable is dichotomous and was assigned a value of 1 if a patient received home hemodialysis and a value of 0 if a patient received center hemodialysis. The use of HHD in the renal replacement therapeutic field is peculiar; that is, the majority of ESKD patients use in-center hemodialysis. The major independent variable was race/ethnicity: White, Black, Hispanic, Asian, and others (values of 0, 1, 2, 3, and 4, respectively) based on variables of both RACE and HISPANIC of the final merged data set from USRDS. Other independent variables which were controlled for in this logistic regression model were age, gender, residential region, dialysis service years, and relevant comorbidities of hypertension, atherosclerotic heart disease, congestive heart failure, cerebrovascular disease, and relatively non-relevant chronic conditions such as cancer, chronic obstructive pulmonary disease, and drug dependence.
Health Outcomes (Mortality and Hospital Utilization)
The statistical analysis of patient assignment to HHD compared to in-center hemodialysis on health outcomes used logistic regression for mortality and negative binomial for hospital utilization with adjustments for age group, gender, race, region, dialysis service years, and various comorbidities to investigate the effect on mortality and hospitalization. The interaction term of treatment and age group was also included in these models since age was found to have an important impact on health outcomes. Additionally, these analyses also examined the associations of racial and ethnic groups with health outcomes by comparing minorities with Whites after confounding for variables that might explicate the association such as age, gender, dialysis service years, and other comorbidities.
Method 1): Logistic Regression Model
Logistic regression is the appropriate technique to analyze mortality (dead or alive) and hospitalization (any hospitalization or none) because the dependent variables are dichotomous (binary). It was used to describe data and to explain the relationship between mortality and hospitalization and the main independent variable treatment modality (adopting home or center hemodialysis) or other independent variables such as age, gender, race, region, dialysis service years, comorbidities, etc.


Method 2): Negative Binomial Model
Negative binomial regression is the suitable approach for the over-dispersion outcome variable (mean is much lower than variance) and was used to analyze the number of hospitalizations because the values of this dependent variable (the count of hospitalization) were nonnegative integers.

Results
A sample size of 562,655 individuals whose treatment measure of receiving either home hemodialysis or center hemodialysis was confirmed in the final data file merged from 2016 to 2019 clinical claims and accumulated patient core characteristics such as comorbidities, mortality, and hospitalization data since 2010. Of these, 14,202 patients (2.52%) were on home hemodialysis and the vast majority of 548,453 patients (97.48%) were on center hemodialysis.
Descriptive Analysis of the ESKD Population Who Received HHD and CHD
ESKD patient characteristics for receiving home hemodialysis or center hemodialysis were listed in Table 2. Within this population, people of 0–59, 60–69, 70–79, and 80+ were 23%, 23%, 28%, and 26%, respectively, and males and females occupied approximately 57% and 43%, respectively. Nearly 46.57% of the patients were Non-Hispanic Whites followed by Non-Hispanic Blacks (32.33%), Hispanics (14.60%), Asians (3.90%), and other races (2.59%). The mean age was found to be 70 years old (standard deviation = 14 years old, the percentage of people whose age 0–59, 60–69, 70–79, ≥80 is 23%, 23%, 28%, 26%) for CHD patients and 64 years old (standard deviation = 15 years old, the percentage for people whose age 0–59, 60–69, 70–79, ≥80 is 37%, 23%, 23%, 17%) for HHD patients, respectively, a statistically significant difference. There was no significant difference in dialysis duration years and Kt/V value between CHD and HHD groups. However, among the already rare total number of HHD patients, minorities made up an even smaller percentage and were significantly less likely to use HHD than Whites. Major comorbidities such as congestive heart failure, atherosclerotic heart disease, hypertension, cerebrovascular disease, and drug dependence were much more prevalent among CHD patients. Except for the high proportion of patients living in the southeast region (33.58%), the percentages of patients in the other regions were comparable: Northeast 16.26%, Midwest 19.83%, West 16.40%, Southwest 13.92%.
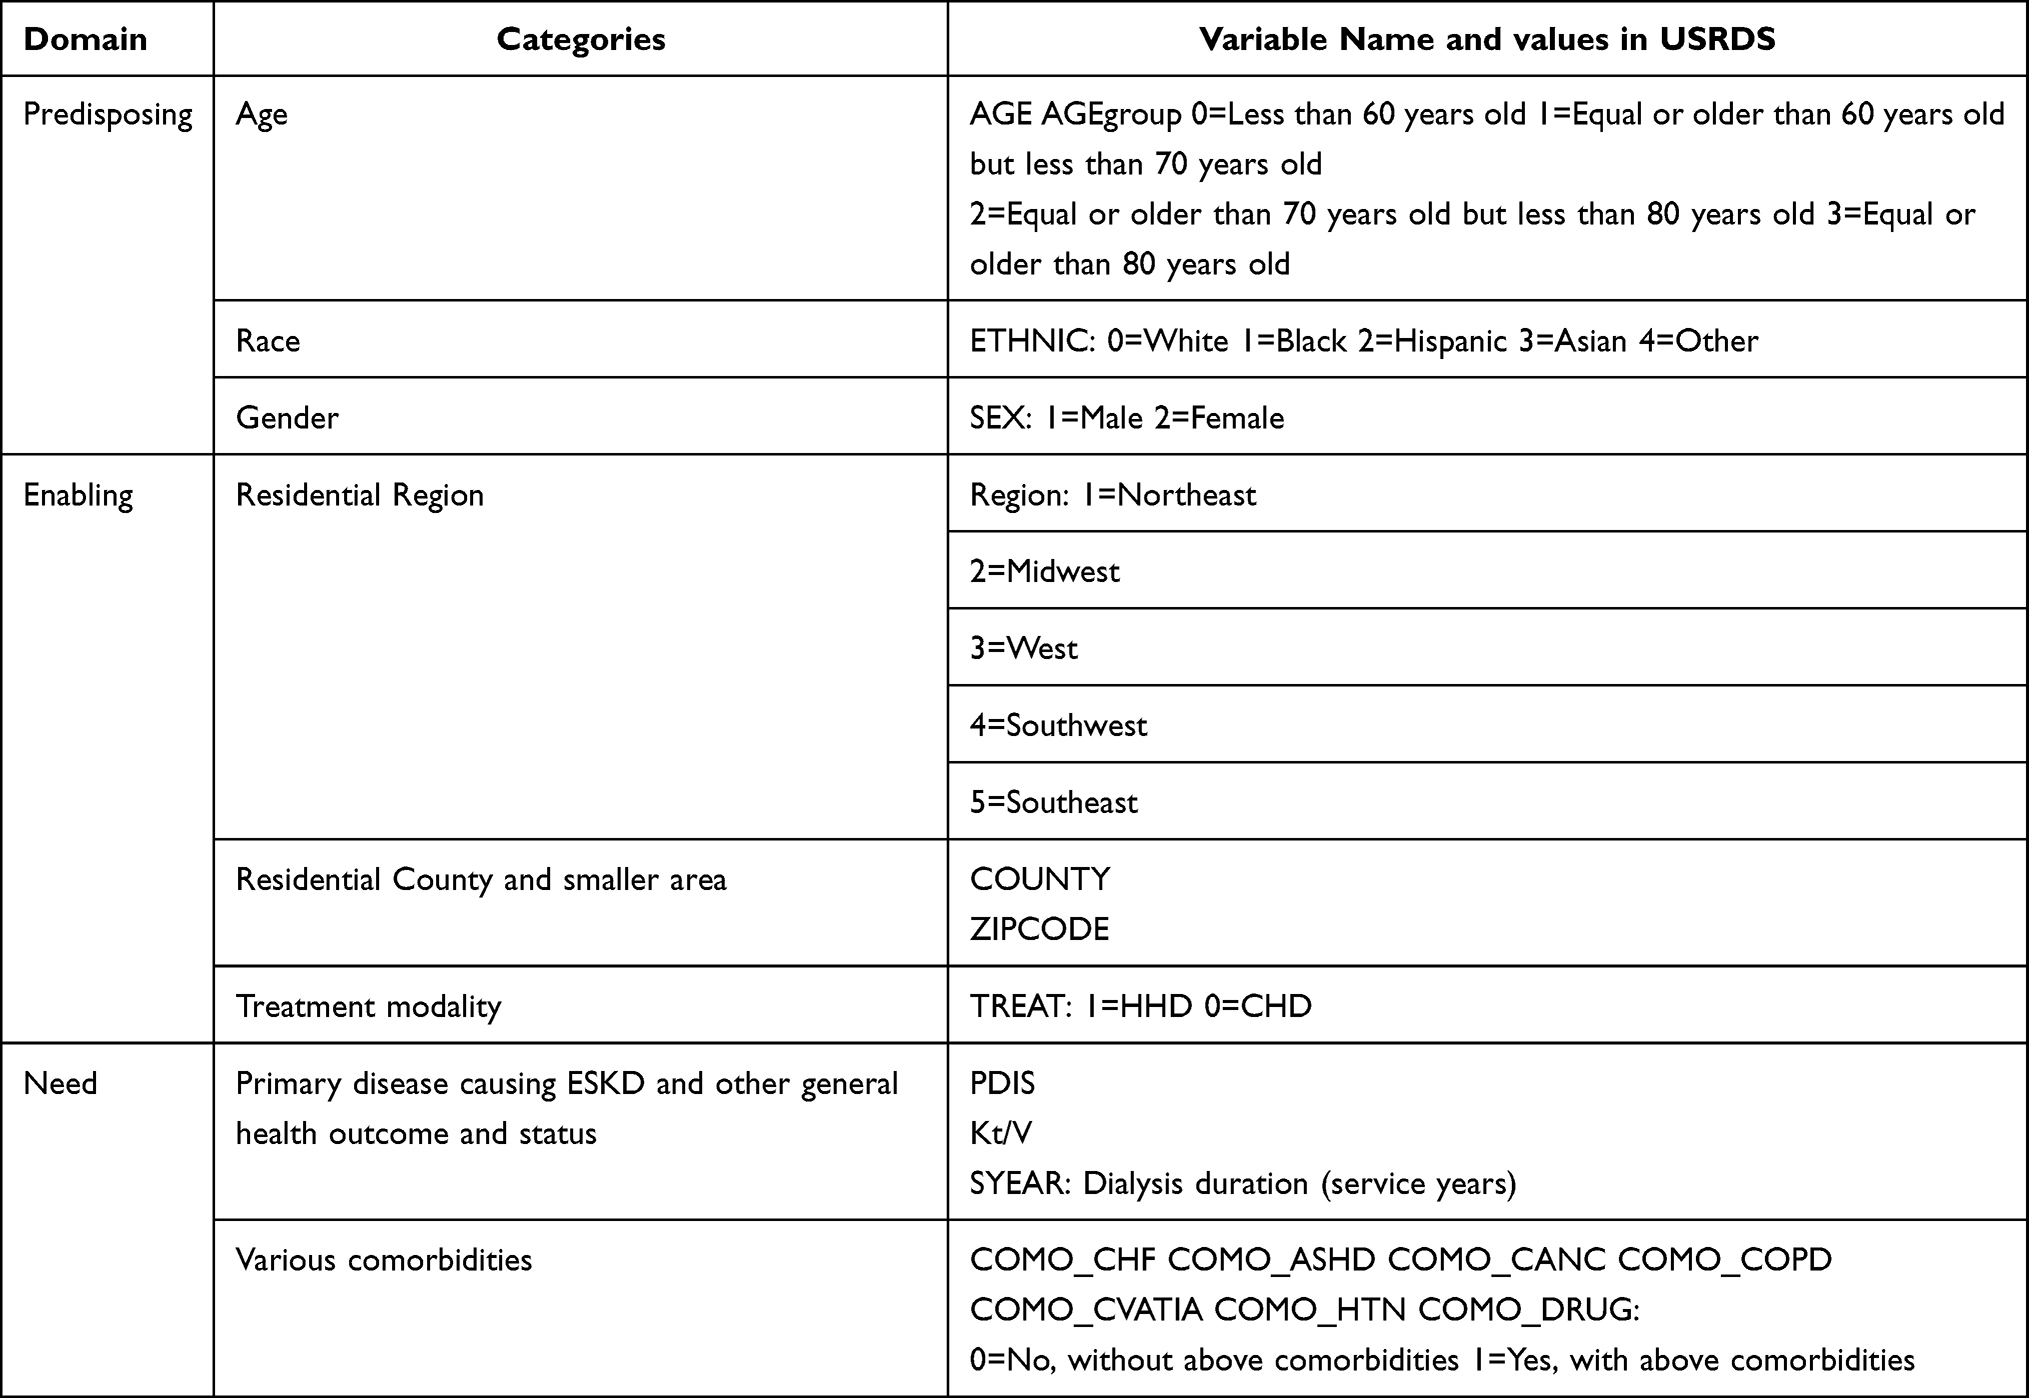 |
Table 1 Domains of Andersen Behavior Model and Their Corresponding Variables in USRDS |
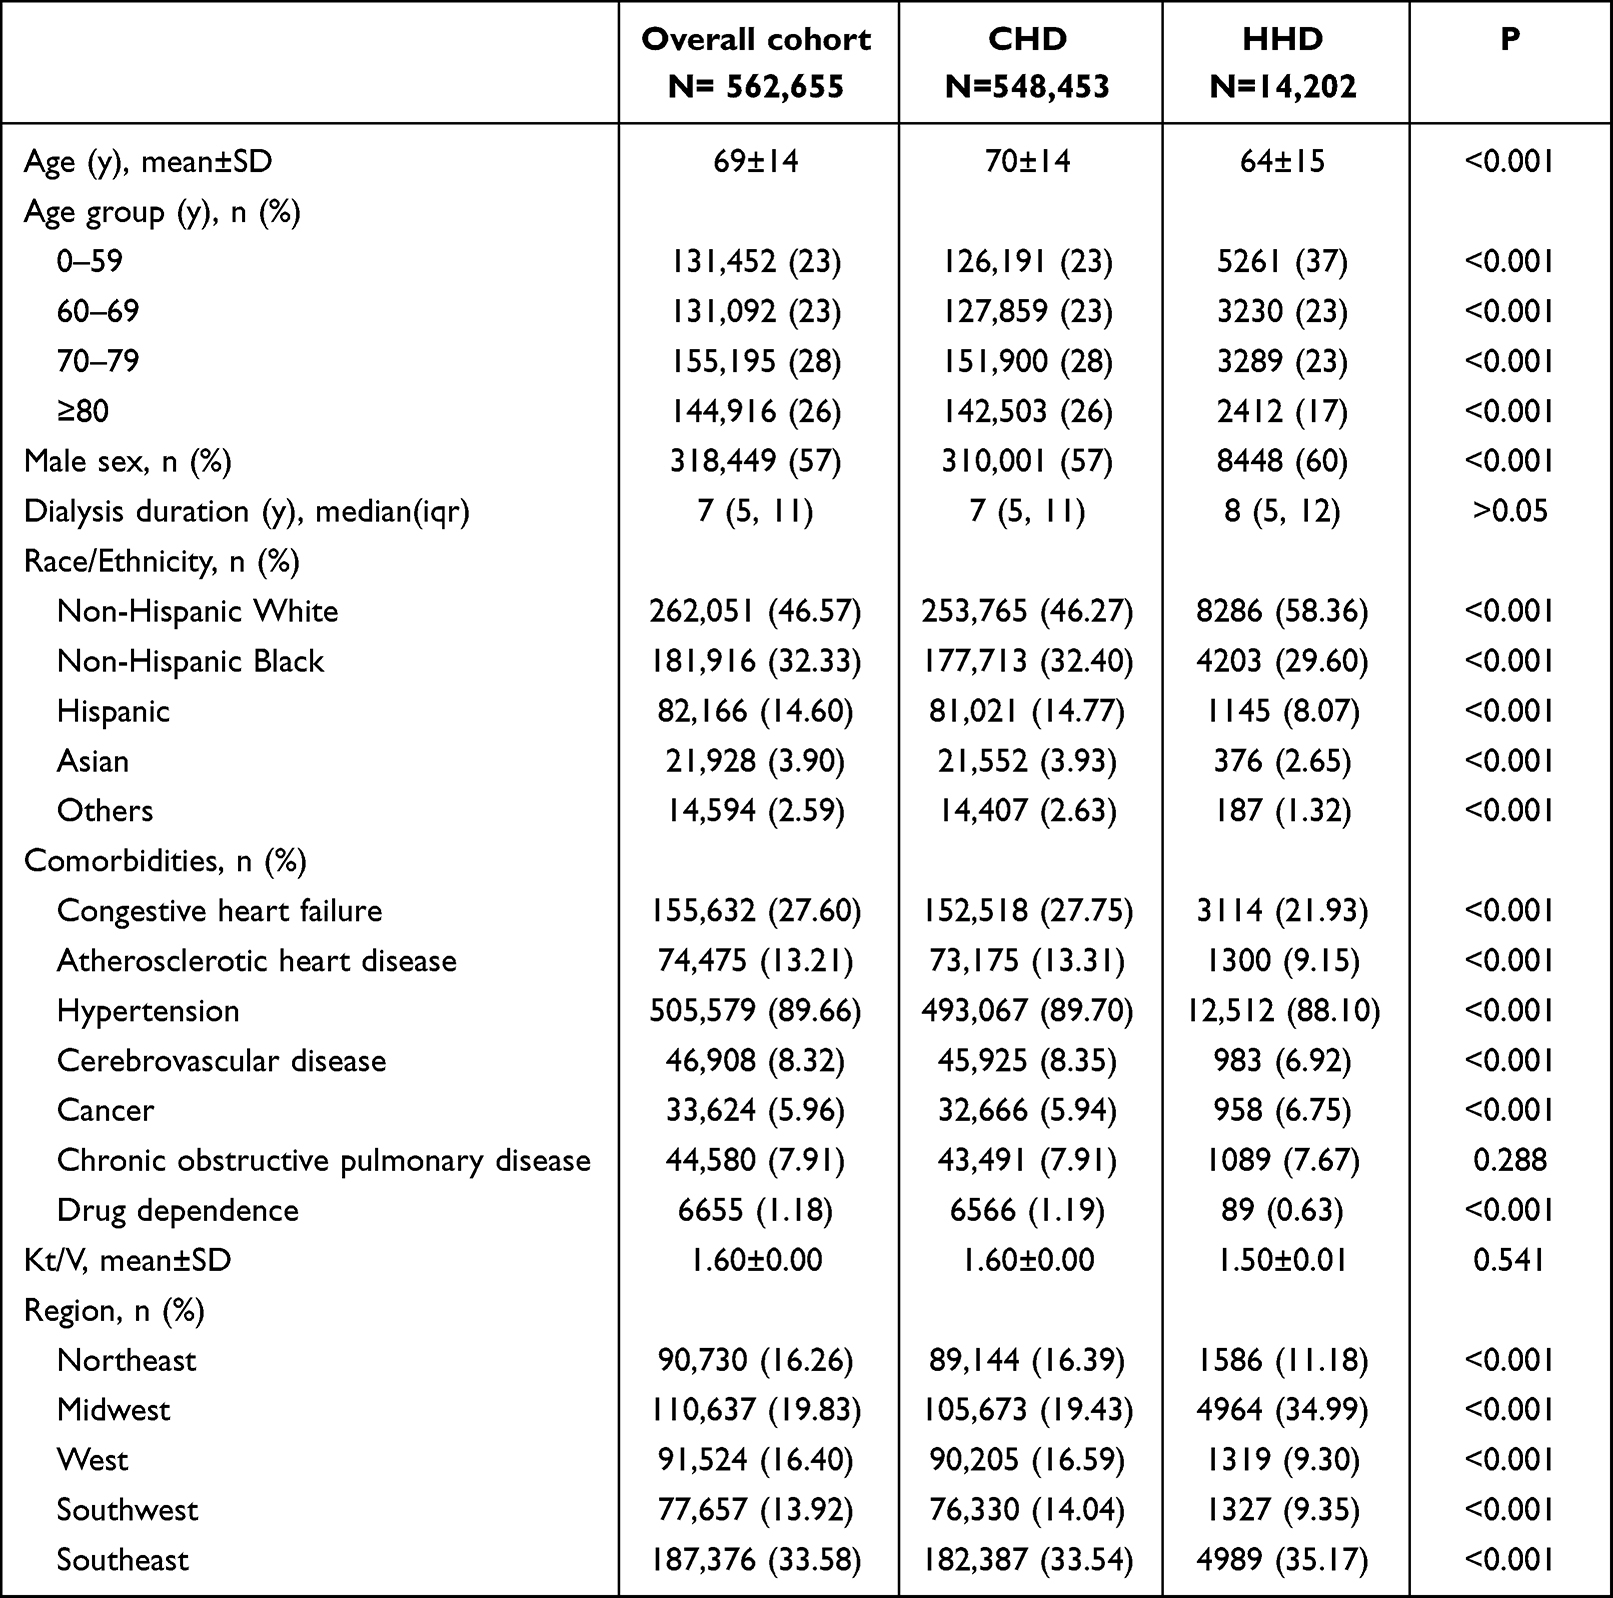 |
Table 2 Patient Demographics and Clinical Characteristics by CHD/HHD |
Table 3 showed the average age (standard deviation) and percentage of people who were 0–59, 60–69, 70–79, and ≥80 years old of each racial/ethnic group. Except for Asians, the average age of every minority group was significantly lower than that of Whites. It was also found that White patients had the highest percentage of various comorbidities, such as congestive heart failure, atherosclerotic heart disease, cerebrovascular disease, cancer, and chronic obstructive pulmonary disease. The percentages in HHD use of all racial/ethnic minority groups were appreciably lower than that of the White group.
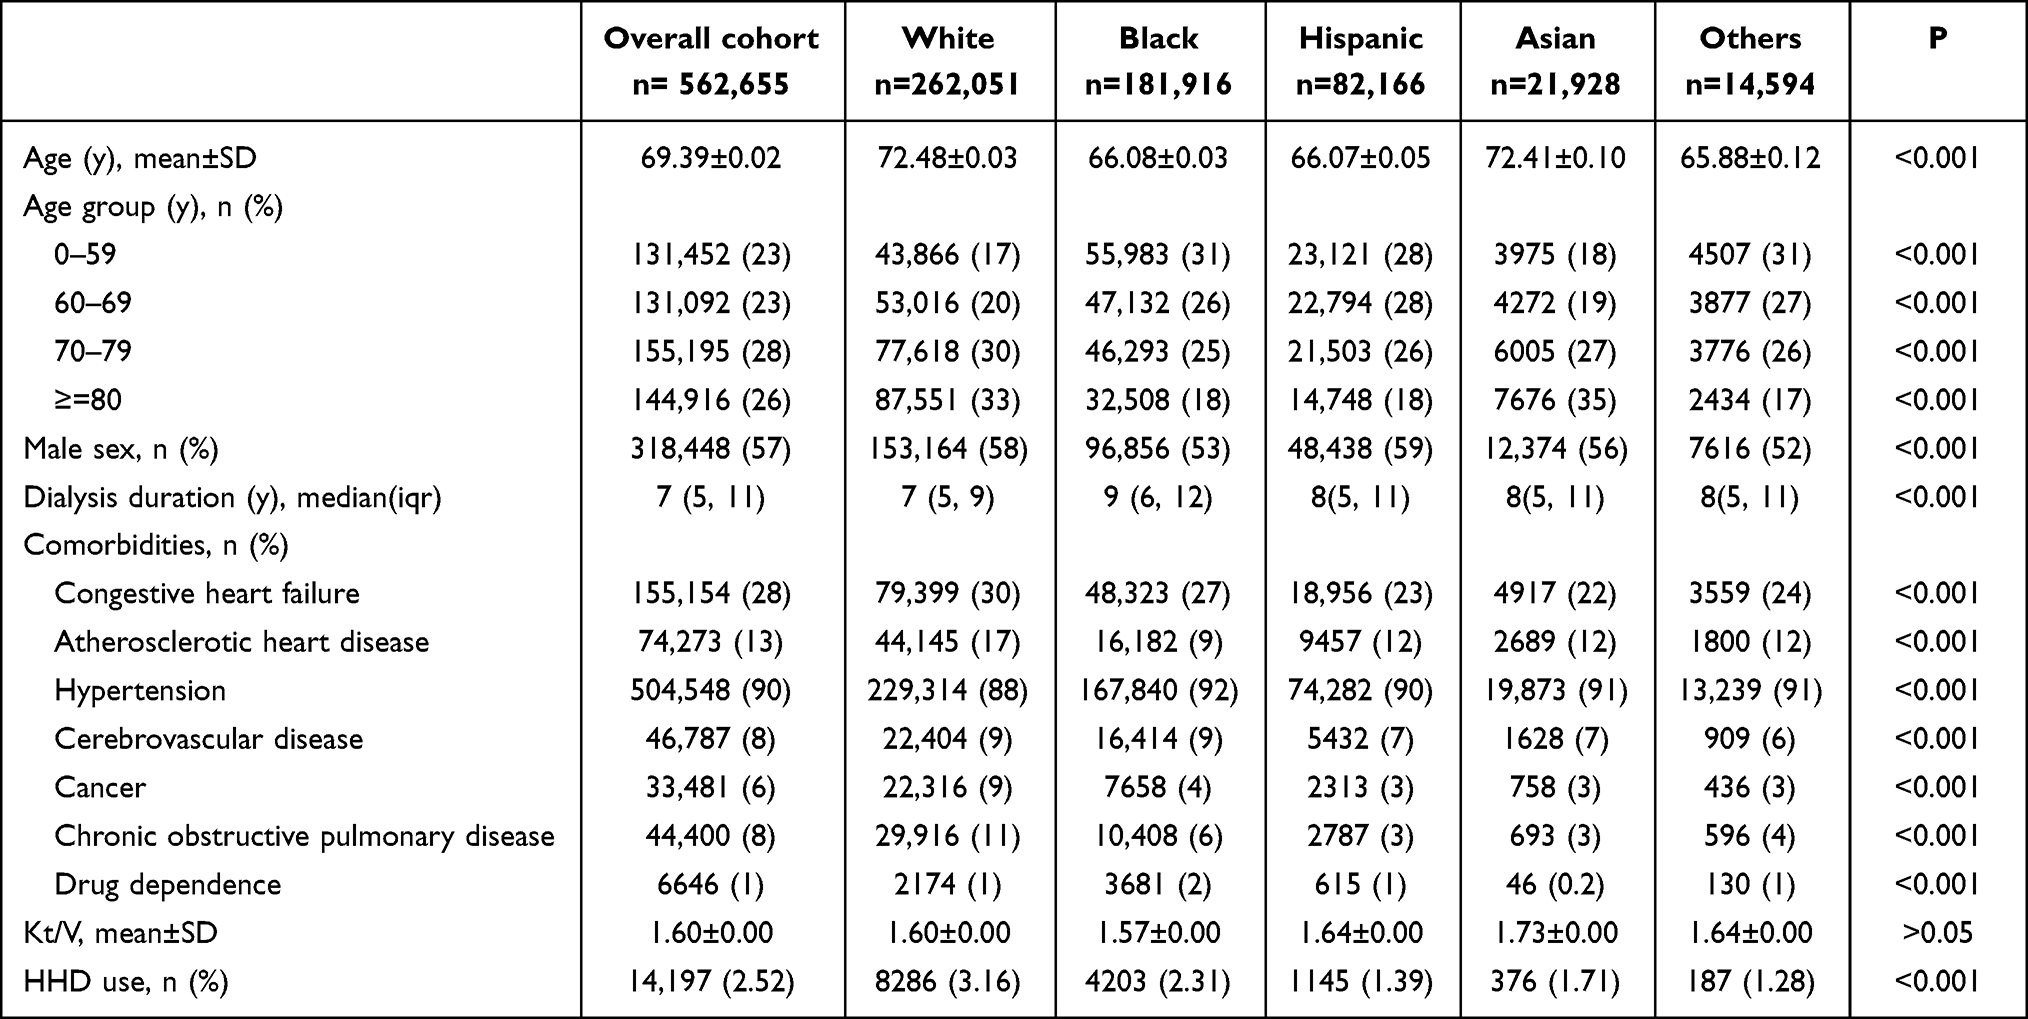 |
Table 3 Patient Demographics and Clinical Characteristics by Racial/Ethnic Groups |
Utilization of HHD vs CHD by Race/Ethnicity
The odds ratio (OR) and 95% confidence interval (95% CI) of the unadjusted model for predicting utilization of home hemodialysis vs center hemodialysis by race/ethnicity showed that minorities were significantly less likely to use HHD than White patients (Blacks: OR, 0.724, 95% CI, 0.698–0.752; Hispanics: OR, 0.433, 95% CI, 0.407–0.461; Asians: OR, 0.534, 95% CI, 0.481–0.593; Others: OR, 0.398, 95% CI, 0.344–0.460; p < 0.001). The adjusted logistic regression model included demographics such as age, sex, region, and year of hemodialysis service, and clinical factors such as various comorbid and chronic conditions. The adjusted model displayed similar ORs for each minority group compared with White Americans, but Black patients were even less likely to use HHD (Blacks: OR, 0.568, 95% CI, 0.546–0.592; Hispanics: OR, 0.510, 95% CI, 0.477–0.544; Asians: OR, 0.689, 95% CI, 0.619–0.766; Others: OR, 0.453, 95% CI, 0.390–0.525; p < 0.001). In this adjusted regression model, for each additional year of age, the odds of having HHD decreased by a factor of 0.976 compared to having CHD. Table 4 and Figure 1 illustrate unadjusted and adjusted odds ratios and 95% confidence intervals for HHD utilization (vs CHD) in minority groups (vs Whites).
 |
Table 4 Odds Ratios and 95% Confidence Intervals of Home Hemodialysis Utilization (vs Center Hemodialysis) in Minority Groups (vs Whites) (from Equation 1) |
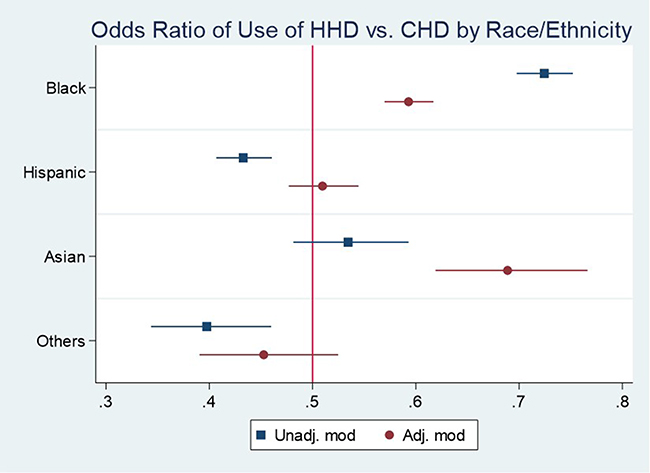 |
Figure 1 Unadjusted and adjusted odds ratios and 95% confidence intervals for home hemodialysis utilization (vs center hemodialysis) in minority groups (vs Whites). The adjusted model included demographics such as age, gender, region, dialysis service years, and medical factors such as various comorbidities and chronic conditions. |
Mortality of HHD vs CHD Patients by Race/Ethnicity
Risk factors for mortality in the overall cohort are contained in Table 5. The dialysis duration had a statistically significant risk impact on mortality: the data shows that for every one-year increase, the odds of death occurring are multiplied by 1.068. Additionally, the other factors were all categorical predictors. This can be interpreted as a significantly relative increase in the risk of death in people aged 60–69, 70–79, and older than 80 years old (as the age group moves into an older age range, the chance of death rises noticeably) compared to those age 0–59; in female compared to male; and in people with certain comorbidities like congestive heart failure, atherosclerotic heart disease, cerebrovascular disease, cancer, chronic obstructive pulmonary disease, and drug dependence compared to those without; Additionally, a relative decrease in the risk of death in treatment of HHD compared to CHD, in hypertensive ESKD patients, and each minority group compared to White patients. The odds ratios of the interaction term between HHD treatment and age group indicated how the effect of HHD treatment (vs CHD) on mortality changed for individuals in the age group 60–69, 70–79, and ≥80 years old compared to the reference group (age 0–59). The ORs meant that, for patients in all older age groups, the odds of death were significantly higher for those who received HHD treatment compared to those who received CHD treatment, after adjustment for other factors in the analysis. Figure 2 demonstrated these different adjusted ORs and 95% CIs for mortality in various minorities vs Whites.
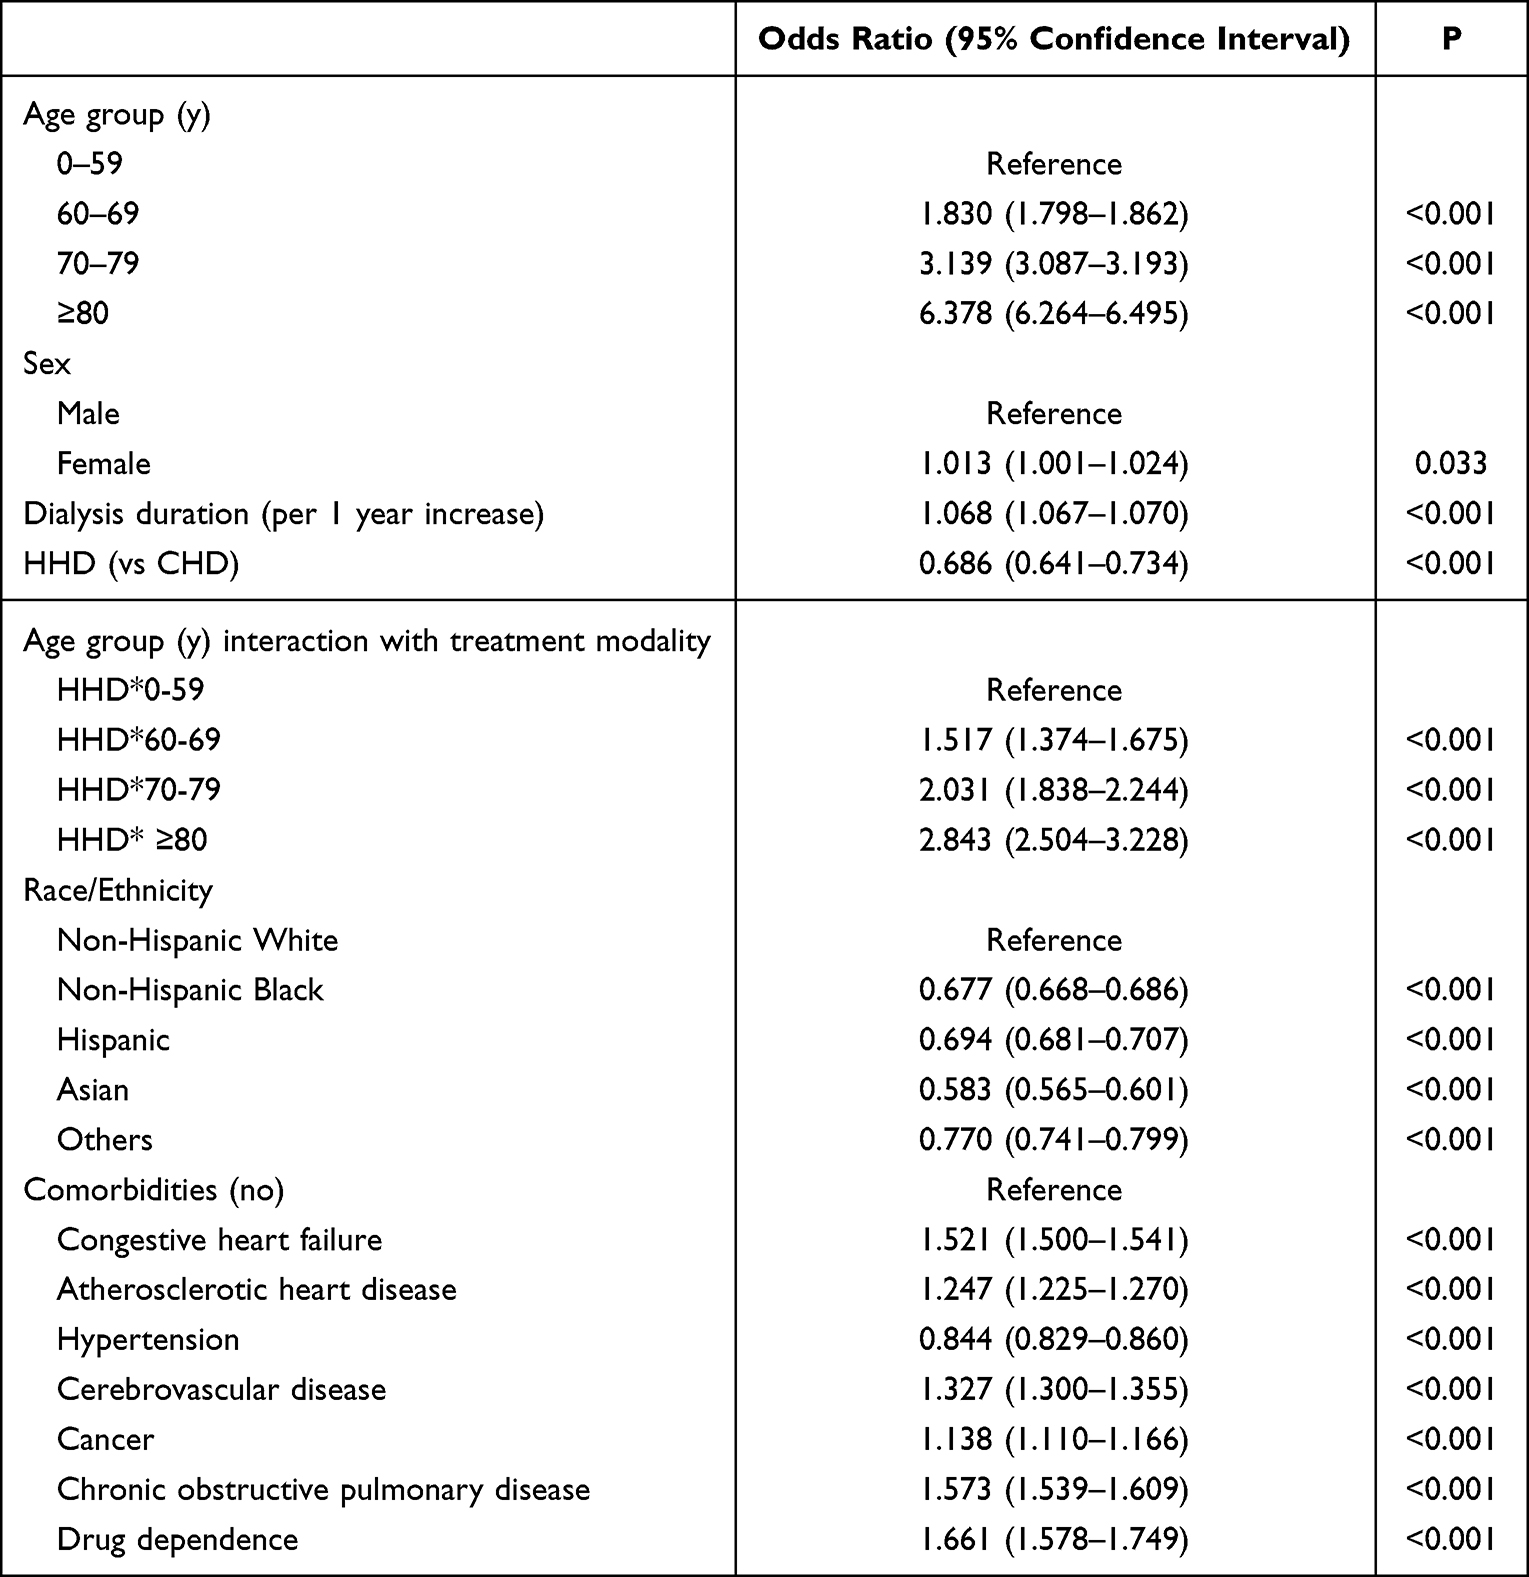 |
Table 5 Odds Ratios and 95% Confidence Intervals of Risk Factors for Mortality in the Overall Cohort (from Equation 2) |
 |
Figure 2 Adjusted odds ratios and 95% confidence intervals for mortality in minority groups (vs Whites). The adjusted model included demographics such as age group, race, gender, region, year of hemodialysis service, treatment (HHD or CHD), medical factors such as various comorbid and chronic conditions, and treatment and age group interaction. |
Table 6 revealed percentages of the overall ESKD population’s and each minority cohort’s mortality for HHD vs CHD. The odds ratios and 95% confidence intervals of the overall cohort indicated HHD patients were less likely to die compared to CHD patients after confounding for age group, gender, race, dialysis service years, region, comorbidities, etc., and including the interaction of treatment modality with age group (overall cohort: OR, 0.686, 95% CI, 0.641–0.734; p < 0.001). Except for Asians, within the rest ethnic cohorts, occurred same situation that HHD group had a lower risk of death compared to the CHD group (White: OR, 0.670, 95% CI, 0.612–0.734, p < 0.001; Blacks: OR, 0.717, 95% CI, 0.644–0.799, p < 0.001; Hispanics: OR, 0.715, 95% CI, 0.575–0.889, p < 0.01; Asians: OR, 0.624, 95% CI, 0.383–1.019, p > 0.05; Others: OR, 0.473, 95% CI, 0.265–0.844, p < 0.05).
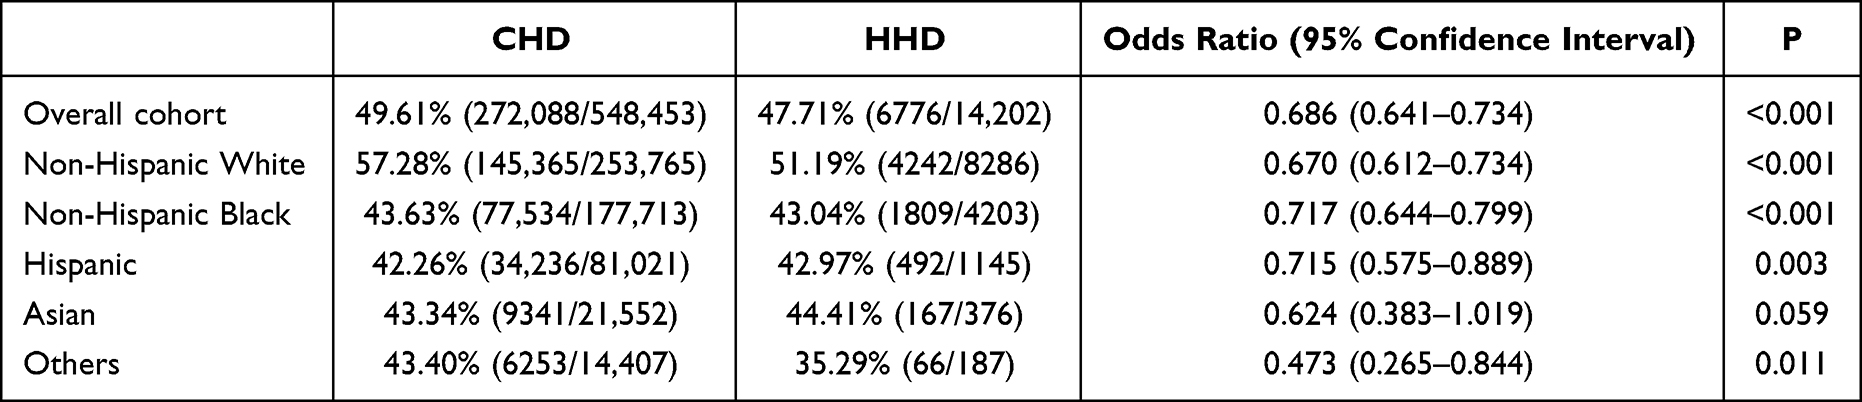 |
Table 6 Mortality of HHD vs CHD in Overall and Every Racial/Ethnic Cohort |
Hospitalization of HHD vs CHD Patients by Race/Ethnicity
Risk factors for hospitalization in the overall cohort were contained in Table 7. There’s no significant difference between HHD and CHD. Except for the categories of minority and hypertension, all the rest risk factors in the table had an effect on increased hospitalization, much like they did for mortality. In terms of interaction between treatment and age group, only in the 70–79 age group, where the odds of hospitalization occurring are 1.311 times statistically significantly higher for those receiving HHD treatment compared to CHD treatment, after controlling for other covariates, was there a significant difference. Figure 3 illustrates the logistic model’s adjusted ORs and 95% CIs for hospitalization in minority groups vs Whites.
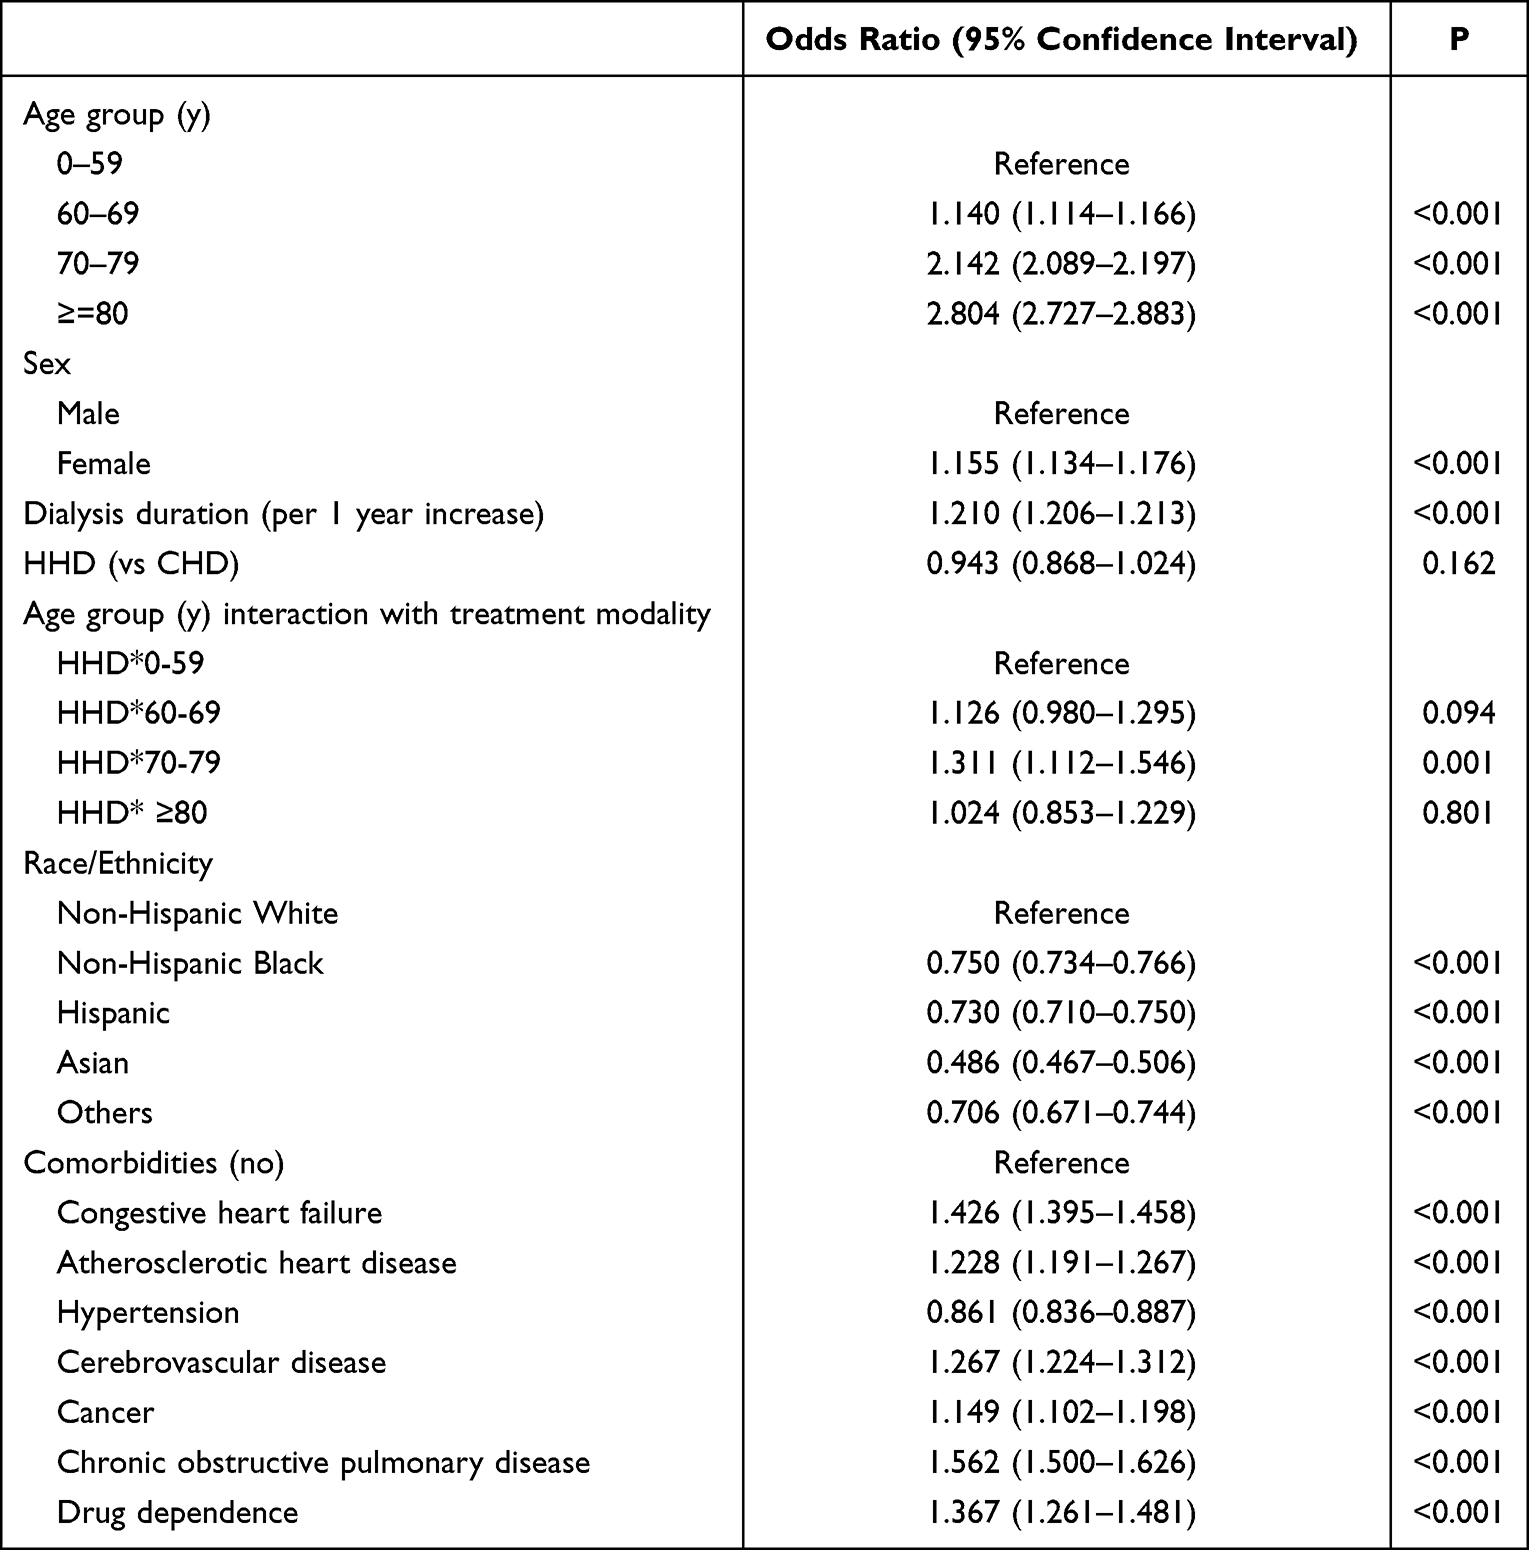 |
Table 7 Odds Ratios and 95% Confidence Intervals of Risk Factors for Hospitalization in the Overall Cohort (from Equation 3) |
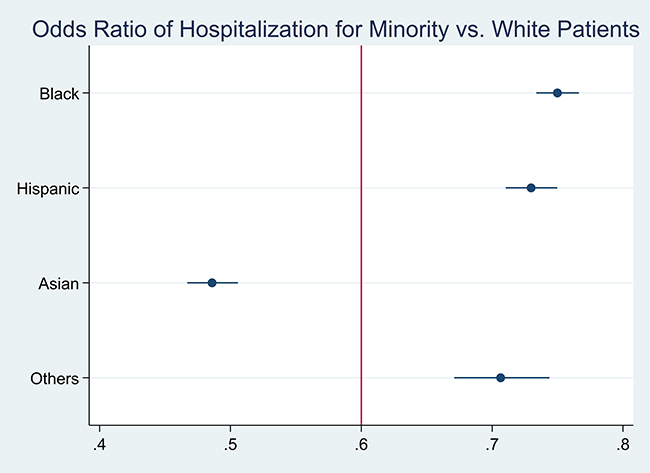 |
Figure 3 Adjusted odds ratios and 95% confidence intervals of whether have been hospitalized in minority groups (vs Whites). The adjusted model included demographics such as age group, race, gender, region, year of hemodialysis service, treatment (HHD or CHD), medical factors such as various comorbid and chronic conditions, and treatment and age group interaction. |
For the entire ESKD population as well as for each minority cohort, Table 8 displayed the percentage of hospitalizations for HHD and CHD. It also showed ORs, incident rate ratios (IRRs), and their corresponding 95% CIs for HHD compared to CHD within overall CKF cohort and each minority group (OR, Overall: 0.943, 95% CI, 0.868–1.024, p > 0.05; White: 0.893, 95% CI, 0.794–1.004, p > 0.05; Blacks: 0.953, 95% CI, 0.835–1.087, p > 0.05; Hispanics: 1.116, 95% CI, 0.868–1.433, p > 0.05; Asians: 1.338, 95% CI, 0.867–2.067, p > 0.05; Others: 1.549, 95% CI, 0.844–2.845, p > 0.05; IRR, Overall: 0.985, 95% CI, 0.965–1.005, p > 0.05; White: 0.979, 95% CI, 0.953–1.006, p > 0.05; Blacks: 0.952, 95% CI, 0.922–0.983, p < 0.01; Hispanics: 1.130, 95% CI, 1.058–1.208, p < 0.001; Asians: 1.186, 95% CI, 1.023–1.376, p < 0.05; Others: 1.188, 95% CI, 1.007–1.401, p < 0.05). There were no statistically significant differences between HHD and CHD in all cohorts for ORs of any hospitalization, and HHD had a lower IRR in all minorities for the number of hospitalizations.
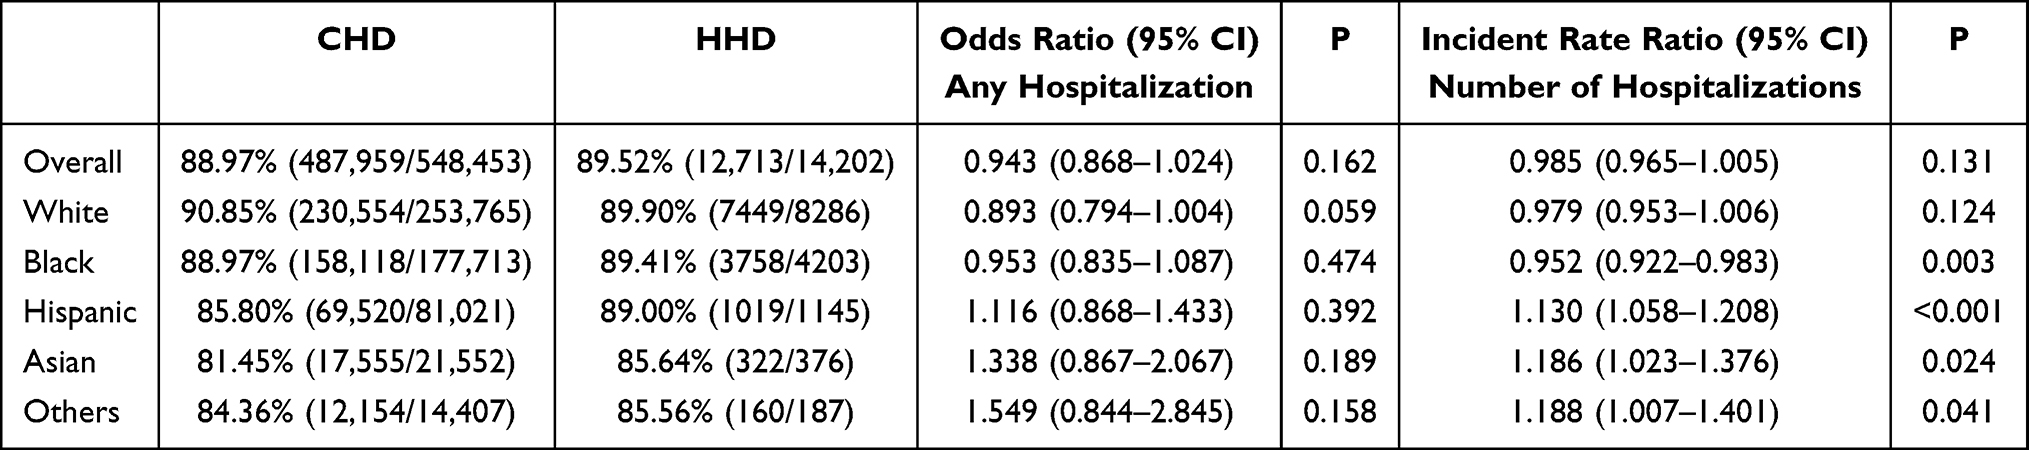 |
Table 8 Hospitalization of HHD vs CHD in Overall and Every Racial/Ethnic Cohort |
Conclusion/Discussion
Drawing on data from the USRDS’ nationally representative sample of patients receiving maintenance dialysis since 2010, this study provides a comprehensive examination of racial/ethnic disparities in the utilization and outcomes of HHD versus CHD among maintenance dialysis patients in the US and draws a few important findings. First, HHD was much less common in the United States for every racial or ethnic minority group than for white people, and demographic and medical factors alone were insufficient to account for this disparity. Therefore, the results supported the research hypothesis that HHD had lower use in the ESKD population in the United States, especially among minorities. Furthermore, all minority groups showed substantially lower mortality and hospitalization incidences than the White group when controlling for other risk factors; this may be due to the fact that the majority of minority patients were younger than Whites and less likely to have comorbid conditions. Finally, within the overall and major ethnic cohorts except for Asians, HHD patients’ mortality was noticeably lower than CHD patients when controlling for demographic, dialysis service years, and major coexisting diseases; in all minority groups, HHD also showed a lower incident rate ratio for a number of hospitalizations than CHD after adjustment for other covariates. These findings agreed with the earlier literature review.
HHD is not elected by many patients, of all ethnicity, because of his need for a full-time caregiver, home required conditions to install and maintain. For my patients, even self puncture is frightening and lack of another person to help with any complications. Racial and ethnic minorities were appreciably less likely to utilize HHD, according to long-standing data from the USRDS, the country’s largest registry of dialysis patients.33 This investigation proved that racial/ethnic minorities utilized HHD at lower rates than Whites, which cannot be explained by demographic or medical differences alone. Nevertheless, given that each minority group was much younger and less likely to have concurrent diseases, it made sense that they should use HHD more frequently.32,38–40 In the absence of demographic and medical factors clarifying the differential utilization, it is probable that patient preferences, societal differences (such as having enough space at home or having a partner to help with the procedure at home.), aspects of health care delivery (such as the availability of pre-ESKD nephrology therapy or an HHD training center in communities), or physician or other health care provider perception of patients are some of the causes of the discrepancies.31 Except for two studies showing that the likelihood of patients receiving pre-dialysis nephrology care was much lower for those who resided in or were treated in areas with a black majority, most of these above-mentioned problems had never been thoroughly investigated, either in quantitative or qualitative research.31,41,42 Additionally, other racial/ethnic groupings did not have access to such investigation. With HHD use experiencing historic and rapid expansion, it is more important than ever to guarantee fair access to pre-dialysis nephrology care, and these racial/ethnic variations required further research.
This analysis was the most recent nationally representative cohort study to compare HHD to CHD with a focus on the racial/ethnic variances in health outcomes such as mortality and hospitalization among patients treated with HHD in the United States. The decreased death and hospitalization in racial/ethnic minorities compared to Whites was in line with previous reports.31 In terms of HHD vs CHD, the results were also coherent with the past. The prevalence of age, gender, race, region, dialysis service years, vascular disease (cardiovascular disease, hypertension, and cerebrovascular accident), and other chronic coexisting conditions such as cancer and chronic obstructive pulmonary disease were significantly different at baseline. Although they were taken into account as potential confounders of survival outcomes, they might not reflect real variations between HHD and CHD characteristics; in particular, age and time of dialysis may act as the main changing modifier in the study of mortality assessment. This study made it obvious that minority patients had a lower risk of death and benefited considerably from the home therapy modality, yet they were even less prone to use the scheme. As far as the comparison of HHD with CHD was concerned, more matched samples and long-term patient follow-up would be necessary since the relatively small size of the HHD minority cohort made the analysis insufficient for drawing firm conclusions. Because discrepancy in hospitalization between HHD and center hemodialysis was evident for all minority groups, future research should examine racial/ethnic inequalities in hospital referral rates, the impact of insurance coverage, and other clinical and socioeconomic factors.
Tied back to the Aday-Andersen framework, this study contributes to the existing literature by examining the use of and barriers to home hemodialysis. For example, specific insights gained from analyzing patient-level characteristics, healthcare provider factors, and potential barriers related to racial/ethnic differences. These findings align with and provide new insights within the framework. For instance, individual factors influenced the choice of dialysis method and the barriers in pre-ESKD nephrology care identified in the study are in line with the Aday-Andersen model’s predictions.
These results need to be interpreted in terms of their limitations, which principally resulted from the absence of information on some important clinical indicators, socioeconomic traits, or pre-dialysis nephrology care that would have provided insight into the causes of the therapeutic outcomes and racial/ethnic inequalities observed here.
In conclusion, there are substantial racial/ethnic variations in home hemodialysis use and health outcomes in the United States. In order to make long-lasting improvements for the overall population of patients receiving maintenance dialysis, it is crucial to comprehend the causes of the racial/ethnic inequalities on health outcomes since ESKD disproportionately affects racial/ethnic minorities.
Abbreviations
Adjusted HR, adjusted hazard ratio; adjusted OR, adjusted odds ratio; AAKH, Advancing American Kidney Health; CMS, Centers for Medicare & Medicaid Services; CI, confidence Interval; CHD, center hemodialysis; CKD, chronic kidney disease; Stage 1, Kidney Damage with Normal or High GFR. GFR: ≥90 mL/min. Kidney damage is present, but the GFR is still normal or high; Stage 2, Mild Reduction in GFR. GFR: 60-89 mL/min. There is a mild reduction in GFR, indicating kidney function is moderately reduced; Stage 3: Moderate Reduction in GFR. GFR: 30–59 mL/min. Kidney function is moderately reduced. This stage is further divided into; Stage 4, Severe Reduction in GFR. GFR: 15–29 mL/min. Kidney function is severely reduced. This stage is associated with significant risk of complications; Stage 5, Kidney Failure (End-Stage Renal Disease). GFR: <15 mL/min. Kidney function is very low, and patients may require renal replacement therapy, such as dialysis or kidney transplantation; CKF, chronic kidney failure; ESKD, end-stage kidney disease; GAO, Government Accountability Office; HD, hemodialysis; HHD, home hemodialysis; NIDDK, National Institute of Diabetes and Digestive and Kidney Diseases; NKF, National Kidney Foundation; NOS, Newcastle-Ottawa Scale for quality assessment; UNOS, United Network for Organ Sharing; PD, peritoneal dialysis; SEF, socioeconomic factor; SAFs, Standard Analysis Files; US, United States; USRDS, United States Renal Disease System.
Ethical Statement
This study was approved by the University of Maryland Institutional Review Board (approval no. 1850214-1). All the data accessed complied with relevant data protection and privacy regulations.
Acknowledgments
In preparing this article, we would like to express our sincere gratitude to Dr. Luisa Franzini.
As a quantitative research paper of the author’s original Ph.D. dissertations, the whole article “Home Hemodialysis Utilization and Health Outcomes Among Racial and Ethnic Minority Population” was first published by the ProQuest, LLC (789 E. Eisenhower Parkway Ann Arbor, MI 48108-3218) on October 10, 2023, in the United States, with the registration number TX 9-324-524.
Disclosure
The author reports no conflicts of interest in this work.
References
1. Norris KC, Nissenson AR. Chapter 8: ethnicity and chronic kidney disease—United States. In: Kimmel PL, Rosenberg ME, editors. Chronic Renal Disease.
2. Lakkis J, Weir MR. Pharmacological strategies for kidney function preservation: are there differences by ethnicity? Adv Ren Replace Ther. 2004;11(1):24–40. doi:10.1053/j.arrt.2003.11.007
3. National Kidney Foundation. Race, ethnicity, & kidney disease; 2020. Available from: https://www.kidney.org/atoz/content/minorities-KD.
4. Price JH, Khubchandani J, McKinney M, Braun R. Racial/ethnic disparities in chronic diseases of youths and access to health care in the United States. Biomed Res Int. 2013;2013:1–12. doi:10.1155/2013/787616
5. United States Renal Data System (USRDS). 2018 USRDS annual data report: epidemiology of kidney disease in the United States. Bethesda, MD; 2018. Available from: https://usrds.org/previous-adrs/2010-2019/.
6. Stephens C, Krans B. Dialysis: purpose, types, risks, and more. Healthline; 2018. Available from: https://www.healthline.com/health/dialysis.
7. Institute for Quality and Efficiency in Health Care (IQWiG). Dialysis in chronic kidney disease. In: InformedHealth.Org. Cologne, Germany: Institute for Quality and Efficiency in Health Care (IQWiG); 2006.
8. Woods JD, Fort FK, Stannard D, Blagg CR, Held PJ. Comparison of mortality with home hemodialysis and center hemodialysis: a national study. Kidney Int. 1996;49(5):1464–1470. doi:10.1038/ki.1996.206
9. Chertow GM, Levin NW, Beck GJ, et al. In-center hemodialysis six times per week versus three times per week. N Engl J Med. 2010;363(24):2287–2300. doi:10.1056/NEJMOA1001593/SUPPL_FILE/NEJMOA1001593_DISCLOSURES.PDF
10. Suri RS, Nesrallah GE, Mainra R, et al. Daily hemodialysis: a systematic review. Clin J Am Soc Nephrol. 2006;1(1):33–42. doi:10.2215/CJN.00340705
11. Walsh M, Culleton B, Tonelli M, Manns A. A systematic review of the effect of nocturnal hemodialysis on blood pressure, left ventricular hypertrophy, anemia, mineral metabolism, and health-related quality of life. Kidney Int. 2005;67(4):1500–1508. doi:10.1111/J.1523-1755.2005.00228.X
12. Protein Metabolism. Anatomy and Physiology II. Available from: https://courses.lumenlearning.com/suny-ap2/chapter/protein-metabolism/.
13. Gotch FA. Kt/V is the best dialysis dose parameter. Blood Purif. 2000;18(4):276–285. doi:10.1159/000014449
14. Kuhlmann MK, Kotanko P, Levine NW. Chapter 90: hemodialys. Available from: https://scholar.google.com/scholar?hl=en&as_sdt=0%2C21&q=Kuhlmann+MK%2C+Kotanko+P%2C+Levine+NW.+Chapter+90%3A+Hemodialysis%3A+Outcomes+and+Adequacy.+In%3A+Floege+J%2C+Johnson+RJ%2C+Feehally+J%2C+editors.+Comprehensive+Clinical+Nephrology.+St.+Louis%3A+Elsevier+Saunders%3B+2010+p.+1060-1068.&btnG=.
15. StdKt/V– Dose Equivalency. Advanced renal education program. Available from: https://advancedrenaleducation.com/wparep/article/stdkt-v-dose-equivalency/.
16. National Institute of Health. National kidney and urologic diseases information clearinghouse: hemodialysis dose and adequacy. Natl Inst Diabetes Dig Kidney Dis. 2009;09(4556):1–6.
17. Mowatt G, Vale L, MacLeod A. Systematic review of the effectiveness of home versus hospital or satellite unit hemodialysis for people with end-stage renal failure. Int J Technol Assess Health Care. 2004;20(3):258–268. doi:10.1017/S0266462304001060
18. Ishani A, Slinin Y, Greer N, et al. Comparative effectiveness of home-based kidney dialysis versus in-center or other outpatient kidney dialysis locations – a systematic review. Comp eff home-based kidney dial versus in-center or other outpatient kidney dial locat. A Syst Rev. 2015;2015:1.
19. Weinhandl ED, Liu J, Gilbertson DT, Arneson TJ, Collins AJ. Survival in daily home hemodialysis and matched thrice-weekly in-center hemodialysis patients. J Am Soc Nephrol. 2012;23(5):895–904. doi:10.1681/ASN.2011080761
20. Marshall MR, Hawley CM, Kerr PG, et al. Home hemodialysis and mortality risk in Australian and New Zealand populations. Am J Kidney Dis. 2011;58(5):782–793. doi:10.1053/j.ajkd.2011.04.027
21. Howard K, Salkeld G, White S, et al. The cost-effectiveness of increasing kidney transplantation and home-based dialysis. Nephrology. 2009;14(1):123–132. doi:10.1111/J.1440-1797.2008.01073.X
22. Act SS, Part M, Security S, States U, Improvements M, Act P. Outpatient Dialysis Services; 2010.
23. Wilt TJ, Greer N, Macdonald R, Messana J, Rutks I. Comparative effectiveness of home-based kidney dialysis versus in-center or other outpatient kidney dialysis locations - a systematic review; 2015.
24. Weinhandl ED, Nieman KM, Gilbertson DT, Collins AJ. Hospitalization in daily home hemodialysis and matched thrice-weekly in-center hemodialysis patients. Am J Kidney Dis. 2015;65(1):98–108. doi:10.1053/j.ajkd.2014.06.015
25. Delano BG. Home hemodialysis offers excellent survival. Adv Ren Replace Ther. 1996;3(2):106–111. doi:10.1016/S1073-4449(96)80049-5
26. Finkelstein FO, Finkelstein SH, Wuerth D, Shirani S, Troidle L. Effects of home hemodialysis on health-related quality of life measures. Semin Dial. 2007;20(3):265–268. doi:10.1111/j.1525-139X.2007.00287.x
27. United States Renal Data System (USRDS). 2016 USRDS annual data report: epidemiology of kidney disease in the United States. Bethesda, MD; 2016. Available from: https://usrds.org/previous-adrs/2010-2019/.
28. Mailloux LU, Bellucci AG, Mossey RT, et al. Predictors of survival in patients undergoing dialysis. Am J Med. 1988;84(5):855–862. doi:10.1016/0002-9343(88)90063-0
29. Grant AC, Rodger RSC, Howie CA, Junor BJR, Briggs JD, Macdougall AI. Dialysis at home in the west of Scotland: a comparison of hemodialysis and continuous ambulatory peritoneal dialysis in age- and sex-matched controls. Perit Dial Int. 1992;12(4):365–368. doi:10.1177/089686089201200406
30. Mehrotra R, Marsh D, Vonesh E, Peters V, Nissenson A. Patient education and access of ESRD patients to renal replacement therapies beyond in-center hemodialysis. Kidney Int. 2005;68(1):378–390. doi:10.1111/j.1523-1755.2005.00453.x
31. Mehrotra R, Soohoo M, Rivara MB, et al. Racial and ethnic disparities in use of and outcomes with home dialysis in the United States. J Am Soc Nephrol. 2016;27(7):2123–2134. doi:10.1681/ASN.2015050472
32. Stack AG. Determinants of modality selection among incident US dialysis patients: results from a national study. J Am Soc Nephrol. 2002;13(5):1279–1287. doi:10.1681/asn.v1351279
33. United States Renal Data System (USRDS). 2014 USRDS annual data report: epidemiology of kidney disease in the United States. Bethesda, MD; 2014. Available from: https://usrds.org/previous-adrs/2010-2019/.
34. Shen JI, Chen L, Vangala S, et al. Socioeconomic factors and racial and ethnic differences in the initiation of home dialysis. Kidney Med. 2020;2(2):105–115. doi:10.1016/j.xkme.2019.11.006
35. USRDS – NIDDK. United States renal data system. Available from: https://www.niddk.nih.gov/about-niddk/strategic-plans-reports/usrds.
36. Andersen RM. Revisiting the behavioral model and access to medical care: does it matter ? J Health Soc Behav. 1995;36(1):1–10. doi:10.2307/2137284
37. Phillips KA, Morrison KR, Andersen R, Aday LA. Understanding the context of healthcare utilization: assessing environmental and provider-related variables in the behavioral model of utilization. Health Serv Res. 1998;33(3):571–596.
38. Kuttykrishnan S, Kalantar-Zadeh K, Arah OA, et al. Predictors of treatment with dialysis modalities in observational studies for comparative effectiveness research. Nephrol Dial Transplant. 2015;30(7):1208–1217. doi:10.1093/ndt/gfv097
39. Vonesh EF, Snyder JJ, Foley RN, Collins AJ. The differential impact of risk factors on mortality in hemodialysis and peritoneal dialysis. Kidney Int. 2004;66(6):2389–2401. doi:10.1111/j.1523-1755.2004.66028.x
40. Walker DR, Inglese GW, Sloand JA, Just PM. Dialysis facility and patient characteristics associated with utilization of home dialysis. Clin J Am Soc Nephrol. 2010;5(9):1649–1654. doi:10.2215/CJN.00080110
41. Prakash S, Rodriguez RA, Austin PC, et al. Racial composition of residential areas associates with access to pre-ESRD nephrology care. J Am Soc Nephrol. 2010;21(7):1192–1199. doi:10.1681/ASN.2009101008
42. Hall YN, Xu P, Chertow GM, Himmelfarb J. Characteristics and performance of minority-serving dialysis facilities. Health Serv Res. 2014;49(3):971–991. doi:10.1111/1475-6773.12144
 © 2024 The Author(s). This work is published and licensed by Dove Medical Press Limited. The full terms of this license are available at https://www.dovepress.com/terms.php and incorporate the Creative Commons Attribution - Non Commercial (unported, v3.0) License.
By accessing the work you hereby accept the Terms. Non-commercial uses of the work are permitted without any further permission from Dove Medical Press Limited, provided the work is properly attributed. For permission for commercial use of this work, please see paragraphs 4.2 and 5 of our Terms.
© 2024 The Author(s). This work is published and licensed by Dove Medical Press Limited. The full terms of this license are available at https://www.dovepress.com/terms.php and incorporate the Creative Commons Attribution - Non Commercial (unported, v3.0) License.
By accessing the work you hereby accept the Terms. Non-commercial uses of the work are permitted without any further permission from Dove Medical Press Limited, provided the work is properly attributed. For permission for commercial use of this work, please see paragraphs 4.2 and 5 of our Terms.