")
Back to Journals » International Journal of Nephrology and Renovascular Disease » Volume 15
Uric Acid, Ferritin, Albumin, Parathyroid Hormone and Gamma-Glutamyl Transferase Concentrations are Associated with Uremic Cardiomyopathy Characteristics in Non-Dialysis and Dialysis Chronic Kidney Disease Patients
Authors Tade G , Hsu HC, Woodiwiss AJ, Peters F, Robinson C, Dlongolo N, Teckie G, Solomon A, Norton GR, Dessein PH
Received 11 September 2022
Accepted for publication 22 November 2022
Published 7 December 2022 Volume 2022:15 Pages 353—369
DOI https://doi.org/10.2147/IJNRD.S389539
Checked for plagiarism Yes
Review by Single anonymous peer review
Peer reviewer comments 2
Editor who approved publication: Professor Pravin Singhal
Grace Tade,1,* Hon-Chun Hsu,1,2,* Angela J Woodiwiss,1 Ferande Peters,1 Chanel Robinson,1 Noluntu Dlongolo,3 Gloria Teckie,4 Ahmed Solomon,5 Gavin R Norton,1 Patrick H Dessein1,5,6
1Cardiovascular Pathophysiology and Genomics Research Unit, School of Physiology, Faculty of Health Sciences, University of the Witwatersrand, Johannesburg, South Africa; 2Nephrology Unit, Milpark Hospital, Johannesburg, South Africa; 3Rheumatology Unit, Rosebank Hospital, Johannesburg, South Africa; 4Division of Nephrology, Department of Medicine, Chris Hani Baragwanath Hospital and Faculty of Health Sciences, University of Witwatersrand, Johannesburg, South Africa; 5Rheumatology Department, University of the Witwatersrand, Johannesburg, South Africa; 6Internal Medicine Department, University of the Witwatersrand, Johannesburg, South Africa
*These authors contributed equally to this work
Correspondence: Patrick H Dessein, Departments of Medicine, Rheumatology and Physiology, Charlotte Maxeke Johannesburg Academic Hospital, University of the Witwatersrand Medical School, 7 York Road, Parktown, Johannnesburg, 2193, South Africa, Tel +27 662491468, Email [email protected]
Introduction: Circulating uric acid, ferritin, albumin, intact parathyroid hormone and gamma-glutamyl transferase each participate in biochemical reactions that reduce or/and enhance oxidative stress, which is considered the final common pathway through which pathophysiological mechanisms cause uremic cardiomyopathy. We hypothesized that the respective biomarkers may be involved in the development of uremic cardiomyopathy characteristics and can be useful in their identification among chronic kidney disease patients.
Methods: We assessed traditional and non-traditional cardiovascular risk factors including biomarker concentrations and determined central systolic blood pressure using SphygmoCor software and cardiac structure and function by echocardiography in 109 (64 non-dialysis and 45 dialysis) patients. Associations were evaluated in multivariate regression models and receiver operator characteristic (ROC) curve analysis.
Results: Each biomarker concentration was associated with left ventricular mass beyond stroke work and/or inappropriate left ventricular mass in all, non-dialysis and/or dialysis patients. Ferritin, albumin and gamma-glutamyl transferase levels were additionally associated with E/e’ in all, non-dialysis and/or dialysis patients. Dialysis status influenced the relationship of uric acid concentrations with inappropriate left ventricular mass and those of gamma-glutamyl transferase levels with left ventricular mass and inappropriate left ventricular mass. In stratified analysis, low uric acid levels were related to inappropriate left ventricular mass in dialysis but not non-dialysis patients (interaction p=0.001) whereas gamma-glutamyl transferase concentrations were associated with left ventricular mass and inappropriate left ventricular mass in non-dialysis but not dialysis patients (interaction p=0.020 to 0.036). In ROC curve analysis, uric acid (area under the curve (AUC)=0.877), ferritin (AUC=0.703) and albumin (AUC=0.728) concentrations effectively discriminated between dialysis patients with and without inappropriate left ventricular hypertrophy, left ventricular hypertrophy, and increased E/e,’ respectively.
Conclusion: Uric acid, ferritin, albumin, parathyroid hormone and gamma-glutamyl transferase were associated with uremic cardiomyopathy characteristics and could be useful in their identification. Our findings merit validation in future longitudinal studies.
Keywords: uremic cardiomyopathy, uric acid, ferritin, albumin, parathyroid hormone and gamma-glutamyl transferase
Introduction
Uremic cardiomyopathy refers to the functional and morphological cardiac changes that occur in response to chronic kidney disease (CKD).1 These alterations include mostly impaired diastolic function, left ventricular hypertrophy and marked fibrosis. Left ventricular hypertrophy typically occurs in order to compensate for an increased hemodynamic load as determined by stroke volume (preload) and central systolic blood pressure (afterload). In patients with CKD, the extent of left ventricular hypertrophy often exceeds hemodynamic needs.2 This condition is termed inappropriate left ventricular hypertrophy and comprises an additional independent predictor of incident cardiovascular events. Uremic cardiomyopathy accounts largely for the high rates of heart failure, arrhythmias and sudden cardiac death that occur particularly in patients with advanced CKD.3
The pathophysiology of uremic cardiomyopathy remains incompletely elucidated.1,3,4 Apart from increased preload due to volume overload and anaemia, increased afterload caused by hypertension and arteriosclerosis, other implicated mechanisms include overactivity of the renin-angiotensin-aldosterone and sympathetic nervous systems, CKD mineral and bone disorder, transforming growth factor-β, uremic toxins and endogenous cardiotonic steroids. Importantly in the present context, increased oxidative stress is considered the final common pathway through which each of these mechanisms causes uremic cardiomyopathy.1,5 In support of this paradigm, inhibition of Na/K-ATPase oxidant amplification with pNaKtide and induction of heme oxygenase-1 with cobalt protoporphyrin markedly attenuated the development of phenotypic features of uremic cardiomyopathy in 5/6 nephrectomised mice.6 PNaKtide also reversed many of these phenotypical features after induction of uremic cardiomyopathy.6
Considering the above, it is striking that circulating uric acid, ferritin, albumin, parathyroid hormone and gamma-glutamyl transferase concentrations are not only routinely assessed by health care providers in CKD patients but also each participate in biochemical reactions that reduce or/and enhance oxidative stress.5,7–13 Uric acid levels are increased in non-dialysis CKD patients14 whereas hemodialysis effectively removes uric acid from the circulation.15 Inflammation often increases ferritin concentrations in CKD and this impacts the prediction of ferritin for iron status.16 Inflammation as well as malnutrition are associated with hypoalbuminemia in CKD.17 Gamma-glutamyl transferase levels are overall unaltered in CKD patients.18 Raised parathyroid concentrations represent secondary hyperparathyroidism that is observed in most patients with end stage kidney disease.19 In the present study, we hypothesized that the respective biomarkers may be involved in the development of uremic cardiomyopathy features and can be useful in their identification among non-dialysis and dialysis CKD patients.
Patients and Methods
Patients
One hundred and nine patients including 64 non-dialysis and 45 dialysis participants were enrolled at the Milpark Hospital in Johannesburg, South Africa. Patients with infection or/and active cancer were excluded. Non-dialysis patients had a Chronic Kidney Disease Epidemiology Collaboration estimated glomerular filtration rate (eGFR)20 of <60 mL/min/1.73m2 upon enrolment. The study was carried out in accordance with the Helsinki Declaration as revised in 2013. Study approval was obtained from the University of the Witwatersrand Human (Medical) Research Ethics Committee (protocol number: M15-08-43) in Johannesburg, South Africa. Each patient provided written informed consent prior to participation.
Methods
Clinical Characteristics
Recorded clinical characteristics comprised demographic variables, lifestyle factors, anthropometric features, traditional and non-traditional cardiovascular risk factors, established cardiovascular disease and drug treatment. All investigations were performed on a single day. In dialysis patients, the data were recorded on the day prior to undergoing the respective procedure, which was applied thrice weekly.
Traditional and non-traditional or renal cardiovascular risk factors were recorded as previously reported.21 Briefly, hypertension was diagnosed when the systolic and/or diastolic blood pressure were >140mmHg and 90mmHg, respectively, and/or antihypertensive medication was employed. Dyslipidemia was diagnosed when the total cholesterol: HDL cholesterol ratio was >4 or/and lipid lowering drugs were employed. Diabetes was identified in patients with a fasting glucose level of ≥7 mmol/l and in those that used glucose lowering medications. Routine laboratory tests were performed on fasting blood samples for the determination of lipid, glucose, haemoglobin, phosphate, calcium, and alanine transaminase concentrations and transferrin saturation.
High sensitivity C-reactive protein concentrations were determined on Abbott Architect using an immunoturbidimetric assay. Uric acid was measured on the Alinity c analyser (Abbott Laboratories, Chicago, IL) using a uricase method and measuring a change in absorbance at 604 nm. The intra-assay and inter-assay coefficients of variation are each ≤2%. Ferritin was measured on the Alinity i analyser (Abbott Laboratories, Chicago, IL) using a chemiluminescent microparticle Immunoassay. The intra-assay and inter-assay coefficients of variation are each ≤5.5%. Albumin was measured on the Alinity c analyser (Abbott Laboratories, Chicago, IL). The albumin BCG procedure is based on the binding of bromocresol green specifically with albumin to produce a coloured complex. The intra-assay and inter-assay coefficients of variation are each ≤1%. Intact parathyroid hormone levels were determined by an electrochemiluminescence immunoassay “ECLIA” on Cobas (Roche Diagnostics, Mannheim, Germany). This assay employs a sandwich test principle in which a biotinylated monoclonal antibody reacts with the N-terminal fragment (1–37) and a monoclonal antibody labelled with a ruthenium complexa) reacts with the C-terminal fragment (38–84). The antibodies used in this assay are reactive with epitopes in the amino acid region 26–32 and 37–42. The measurement range is 1.2 to 5000 pg/mL. The intra-assay and inter-assay coefficients of variation are each ≤3.5%. Gamma-glutamyl transferase was measured on the Alinity c analyser (Abbott Laboratories, Chicago, IL). Gamma-glutamyl transferase catalyzes the transfer of the gamma-glutamyl group from the donor substrate (L-gamma-glutamyl-3-carboxy-4-nitroanilide) to the glycylglycine acceptor to yield 3-carboxy-4-nitroaniline. The rate of the absorbance increase at 416 nm is directly proportional to the gamma-glutamyl transferase in the sample. The intra-assay and inter-assay coefficients of variation are each ≤2.5%.
Mean arterial blood pressure for the peripheral waveform was determined electronically by the SphygmoCor device (see below) and using the formula
 where T0=start of the waveform; TF=end of the waveform; Pi=pressure points and
n=number of pressure points.
Established cardiovascular disease comprised ischemic heart disease (acute myocardial infarction, percutaneous transluminal coronary angioplasty and coronary artery bypass graft) and heart failure, cerebrovascular disease (stroke and transient ischemic attack) and peripheral vascular disease, the presence of which was confirmed by a cardiologist, neurologist and vascular surgeon, respectively.
Central Systolic Blood Pressure
Central systolic blood pressure was measured utilizing a high-fidelity SPC-301 micromanometer (Miller instrument, Inc., Houston, Texas), interfaced with a computer using SpygmoCor software, version 9.0 (AtCor Medical Pty. Ltd., West Ryde, New South Wales, Australia), as previously reported.21 After resting for 15 minutes in the supine position, arterial waveforms at the radial (dominant arm), carotid and femoral artery were recorded for a time period of ten consecutive waveforms (heart beats). Calibration of the pulse wave was done by manual measurement (auscultation) of the brachial blood pressure taken immediately prior to recordings. A validated generalized transfer function incorporated in the SphygmoCor software was used to convert the peripheral pressure waveform into a central aortic waveform. The results were discarded when systolic and diastolic variability of consecutive waveforms exceeded 5% or the amplitude of the pulse wave signal was less than 80 mV. All measurements were made by single experienced observer (CR) who was unaware of the cardiovascular risk factor profiles of the patients. Brachial blood pressure was recorded in all patients. Technically sound measurements of the central pressure wave were obtained in 103 patients.
Left Ventricular Structure and Function
Echocardiography was performed in accordance with the American Society of Echocardiography convention22 and employing a Philips CX50 POC Compact CompactXtreme Ultrasound System (Philips Medical Systems (Pty) Ltd, USA) equipped with a 1.8–4.2 MHz probe that allowed for M-mode, 2-D, pulsed and tissue Doppler measurements. Our methodology was previously described.22,23 Patients were examined in the partial left decubitus position. We assessed left ventricular geometry and systolic (lateral s’ and ejection fraction) and diastolic (e’ as a measure of active relaxation and E/e’ as an index of passive relaxation and left ventricular filling pressure).
Left ventricular dimensions were determined by measuring the left ventricular internal end diastolic and end systolic diameters and wall thickness (left ventricular septal and posterior wall thickness) in the parasternal long axis view by two-dimensional directed M-mode echocardiography. Left ventricular end diastolic and systolic volumes were assessed using the Teichholz method and indexed to body surface area (left ventricular end diastolic volume index). Stroke volume was determined from the difference between left ventricular end diastolic and systolic volumes as evaluated upon employing the Z-derived method. Cardiac output was determined as stroke volume x heart rate. Left ventricular ejection fraction was calculated as [(left ventricular end diastolic volume – left ventricular end systolic volume)/left ventricular end diastolic volume] x 100.
Left ventricular mass (LVM) was determined using a standard formula and indexed to body surface area (LVMI-BSA) and height1.7 (LVMI-ht1.7). Left ventricular hypertrophy was identified as LVM-ht1.7 greater than 80 g/m1.7 for men and greater than 60 g/m1.7 for women. Stroke work (SW) was calculated as stroke volume × central systolic blood pressure x 0.014 and expressed in gram-meters/beat. Inappropriate left ventricular mass (iLVM) was determined from predicted LVM, where predicted LVM was calculated as 55.37 + (6.64 × height2.7) + (0.64 × [central systolic blood pressure × stroke volume × 0.014]) – (18.07× sex), where male sex = 1 and female sex = 2. Inappropriate LVM was expressed as percentage actual LVM/predicted LVM. Inappropriate left ventricular hypertrophy was defined as inappropriate LVM above 128%.
Left ventricular relative wall thickness (RWT) was calculated as left ventricular diastolic posterior wall thickness x 2)/left ventricular end diastolic diameter. Increased relative wall thickness was determined as ≥0.45. Based on the LVMI and RWT measurements, geometric patterns were described as concentric remodelling (normal LVMI and increased RWT); eccentric hypertrophy (increased LVMI and normal RWT); concentric hypertrophy (increased LVMI and increased RWT).
Transmitral flow patterns were recorded at the mitral valve leaflet tips using pulsed Doppler in the apical four chamber view. The early (E) diastolic wave was measured from the mitral inflow velocity curve. Using tissue Doppler imaging, the velocity of myocardial tissue shortening (s’) and early diastolic mitral annulus motion (e’) were measured by placing the cursor at the septal and lateral corners of the mitral annulus. The left ventricular filling pressure index (E/e’ ratio) was calculated as mitral E/the average of septal and lateral e’. An E/e’>14 was considered elevated.
Echocardiographic measurements were made by the same observer that performed the arterial function evaluation. Intra-observer echocardiographic measurement variability is low in our setting with Pearson’s correlation coefficients and variances (mean % difference (SD)) for left ventricular end-diastolic diameter, septal wall thickness, posterior wall thickness, E and e’ of 0.92, 0.72, 0.76, 0.88 and 0.93 (p<0.0001 for all), and −0.41 (4.16), 0.45 (7.74), 1.74 (6.08), 0.16 (9.95) and −1.46 (8.58), respectively.
Systemic Vascular Resistance
Systemic vascular resistance was calculated from mean arterial pressure, right atrial pressure, and cardiac output as (mean arterial pressure – right atrial pressure)/cardiac output assuming that right atrial pressure=0 mmHg. For dialysis patients, we additionally calculated systemic vascular resistance using the same formula but upon assuming that right atrial pressure=10 mmHg as a fixed value, which is in keeping with previous studies among CKD patients.24
Data Analysis
Results are given as mean (SD), median (interquartile range) of percentages as appropriate. Variables were considered non-normally distributed when the skewness was <-1.0 or >1.0. Non-normally distributed variables were logarithmically transformed prior to entering them in linear multivariate regression models.
We compared the recorded patient characteristics between non-dialysis and dialysis patients in age, sex, and race adjusted models, with additional adjustment for statin and antihypertensive agent use when lipid and blood pressure variables, respectively, were dependent variables.
The relationships of biomarkers with LVMI-BSA and LVMI-ht1.7 were first assessed in age, sex, and race (and weight when LVMI-ht1.7 was the dependent variable) adjusted models. To determine whether biomarkers were associated to left ventricular mass indices beyond stroke work, the latter variable was subsequently added to the models. The associations of biomarkers with iLVMI were evaluated in age, sex, race, and weight adjusted models. The impact of CKD status (non-dialysis versus dialysis) on biomarker-left ventricular mass indices and function relationships was determined by adding interaction terms (together with their components) to the models.
The associations of biomarkers with markers of left ventricular systolic and diastolic function were first assessed in age, sex, and race adjusted models. We then added body mass index, mean arterial pressure, heart rate and diabetes as established confounders in the present context, to the models. To determine whether the identified biomarker-left ventricular function relationships were explained by cardiac preload and/or afterload, left ventricular end diastolic volume indexed to body surface area, central systolic blood pressure and systemic vascular resistance were added in separate models.
The biomarker-left ventricular mass indices and biomarker-left ventricular function associations were also re-evaluated in sensitivity analysis among patients without myocardial infarction and/or heart failure.
The relationships of biomarkers with left ventricular hypertrophy indexed to height1.7, inappropriate left ventricular hypertrophy and left ventricular function were first assessed in receiver operator characteristic curve analysis. The optimal biomarker cut-off values in predicting left ventricular hypertrophy and impaired function were determined by calculating the Youden index. Using the identified cut-off values, the associations of biomarkers with left ventricular hypertrophy and function were subsequently re-assessed in age, sex and race adjusted logistic regression models.
Finally, the main identified biomarker-left ventricular mass indices and biomarker-left ventricular function relationships were re-evaluated in linear regression models with adjustment for potential explanatory variables/mediators including high-sensitivity C-reactive protein levels (systemic inflammation), waist-hip ratio (adiposity) and alanine transaminase (non-alcoholic fatty liver disease) and haemoglobin concentrations.
The use of angiotensin converting enzyme inhibitors (ACEI) or angiotensin receptor blockers (ARB) were not associated with left ventricular mass indices and diastolic function in all, non-dialysis and dialysis patients. EGFR was also not associated with left ventricular mass indices and diastolic function among non-dialysis patients. ACEI and ARB use and EGFR were therefore not adjusted for in multivariable regression models.
Data analysis was performed on IBM SPSS statistical program (version 27.0 IBM, USA). Significance was set at p<0.05.
Results
Clinical Characteristics
Table 1 gives the clinical characteristics in all, non-dialysis, and dialysis patients. The median (interquartile range) dialysis vintage was 24 (12–36) months. Black patients were more often on dialysis whereas the reverse applied to white participants. Body weight was smaller in dialysis compared to non-dialysis patients, but the body mass index and waist-hip ratio did not differ significantly between the 2 groups. Mean arterial pressure was larger in dialysis compared to non-dialysis patients. Haemoglobin and uric acid concentrations were smaller whereas parathyroid hormone and ferritin levels were larger in dialysis compared to non-dialysis patients. Dialysis patients used erythropoietin stimulating agents and intravenous iron therapy more frequently than non-dialysis participants. Allopurinol was employed as often in dialysis compared to non-dialysis patients. In patients on dialysis, the median (interquartile range) dialysis duration was 36 (12–48) months. Dialysis duration was not associated with left ventricular mass indices, inappropriate left ventricular mass and left ventricular diastolic and systolic function measures (p=0.269 to 0.889). Also, in all (p=0.120 to 0.809), non-dialysis (p=0.158 to 0.681) and dialysis patients (p=0.157 to 0.822), dyslipidemia was not associated with left ventricular mass indices, inappropriate left ventricular mass and left ventricular diastolic and systolic function measures.
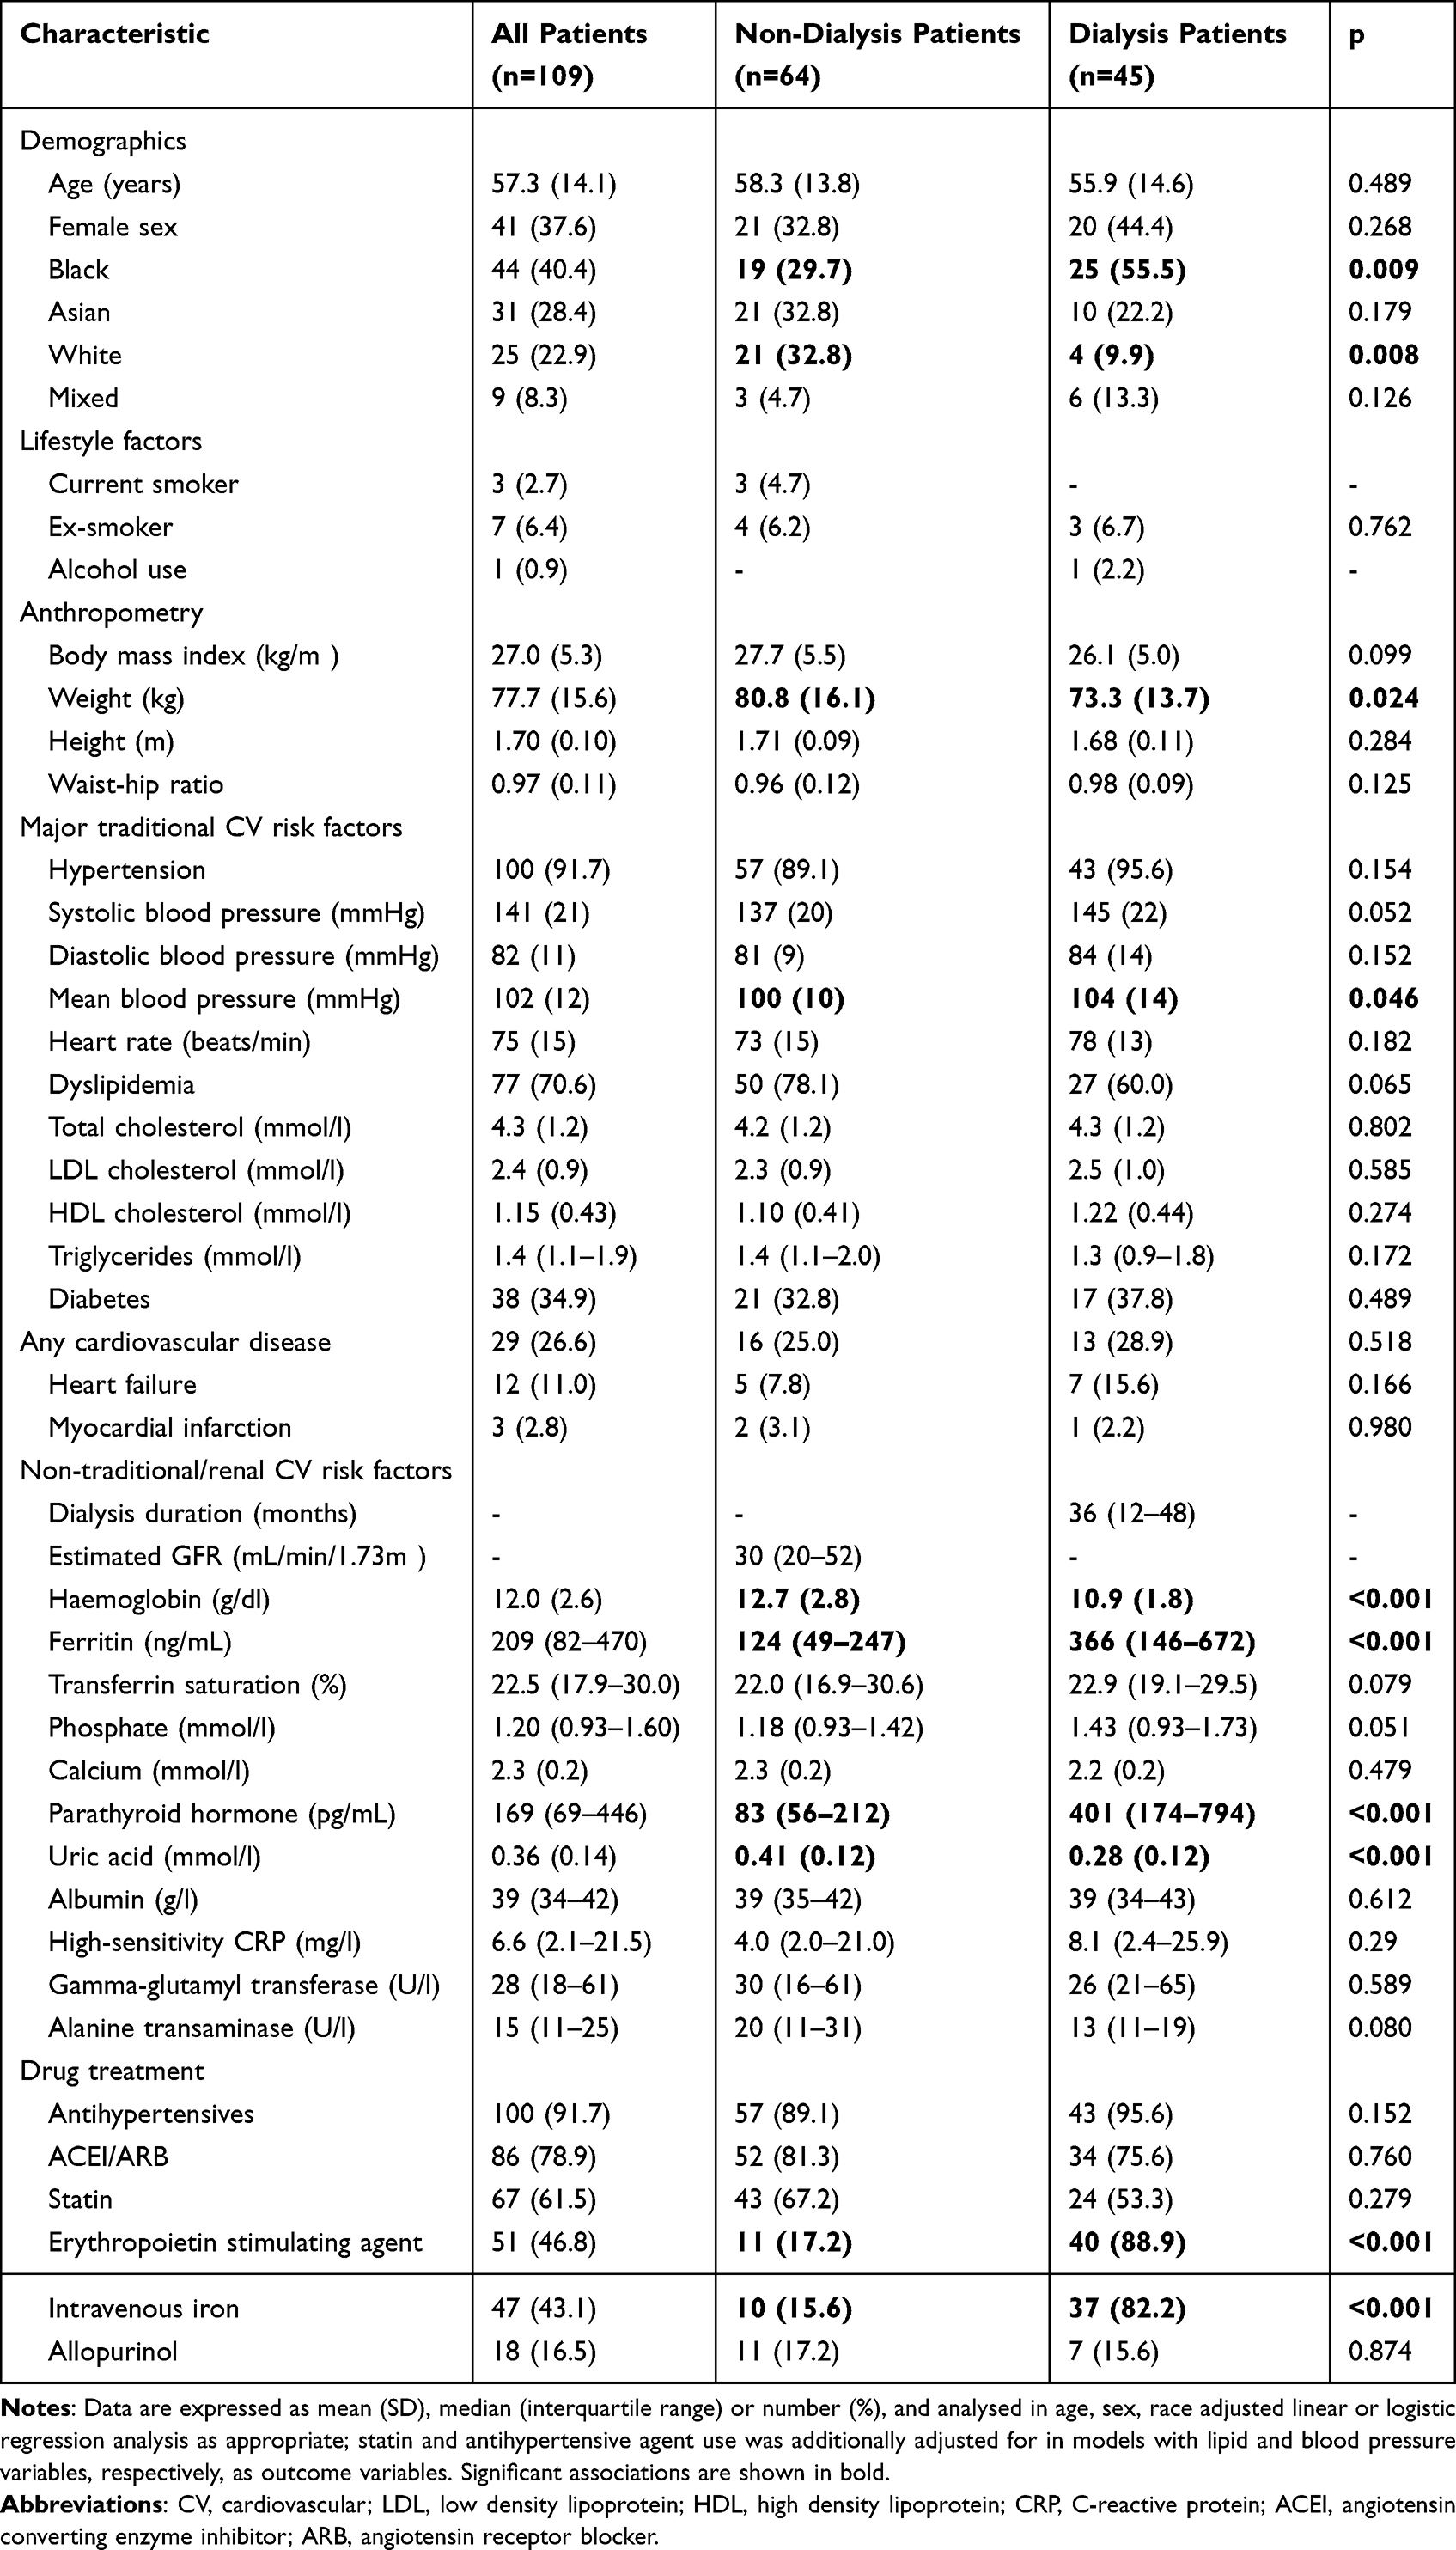 |
Table 1 Clinical Characteristics in Study Participants |
Central Systolic Blood Pressure, Left Ventricular Structure and Function and Systemic Vascular Resistance
Table 2 shows the central systolic blood pressure, left ventricular structure and function and systemic vascular resistance in all, non-dialysis, and dialysis patients. Compared to non-dialysis patients, those on dialysis had a larger central systolic blood pressure, LVMI-BSA, LVMI-ht1.7 and LVEDVI-BSA, and more frequent LVH-ht1.7. Inappropriate LVM and relative wall thickness did not differ among the 2 groups. E/e’ was larger and e’ smaller whereas systolic function did not differ significantly between dialysis and non-dialysis patients. Systemic vascular resistance was similar in both groups.
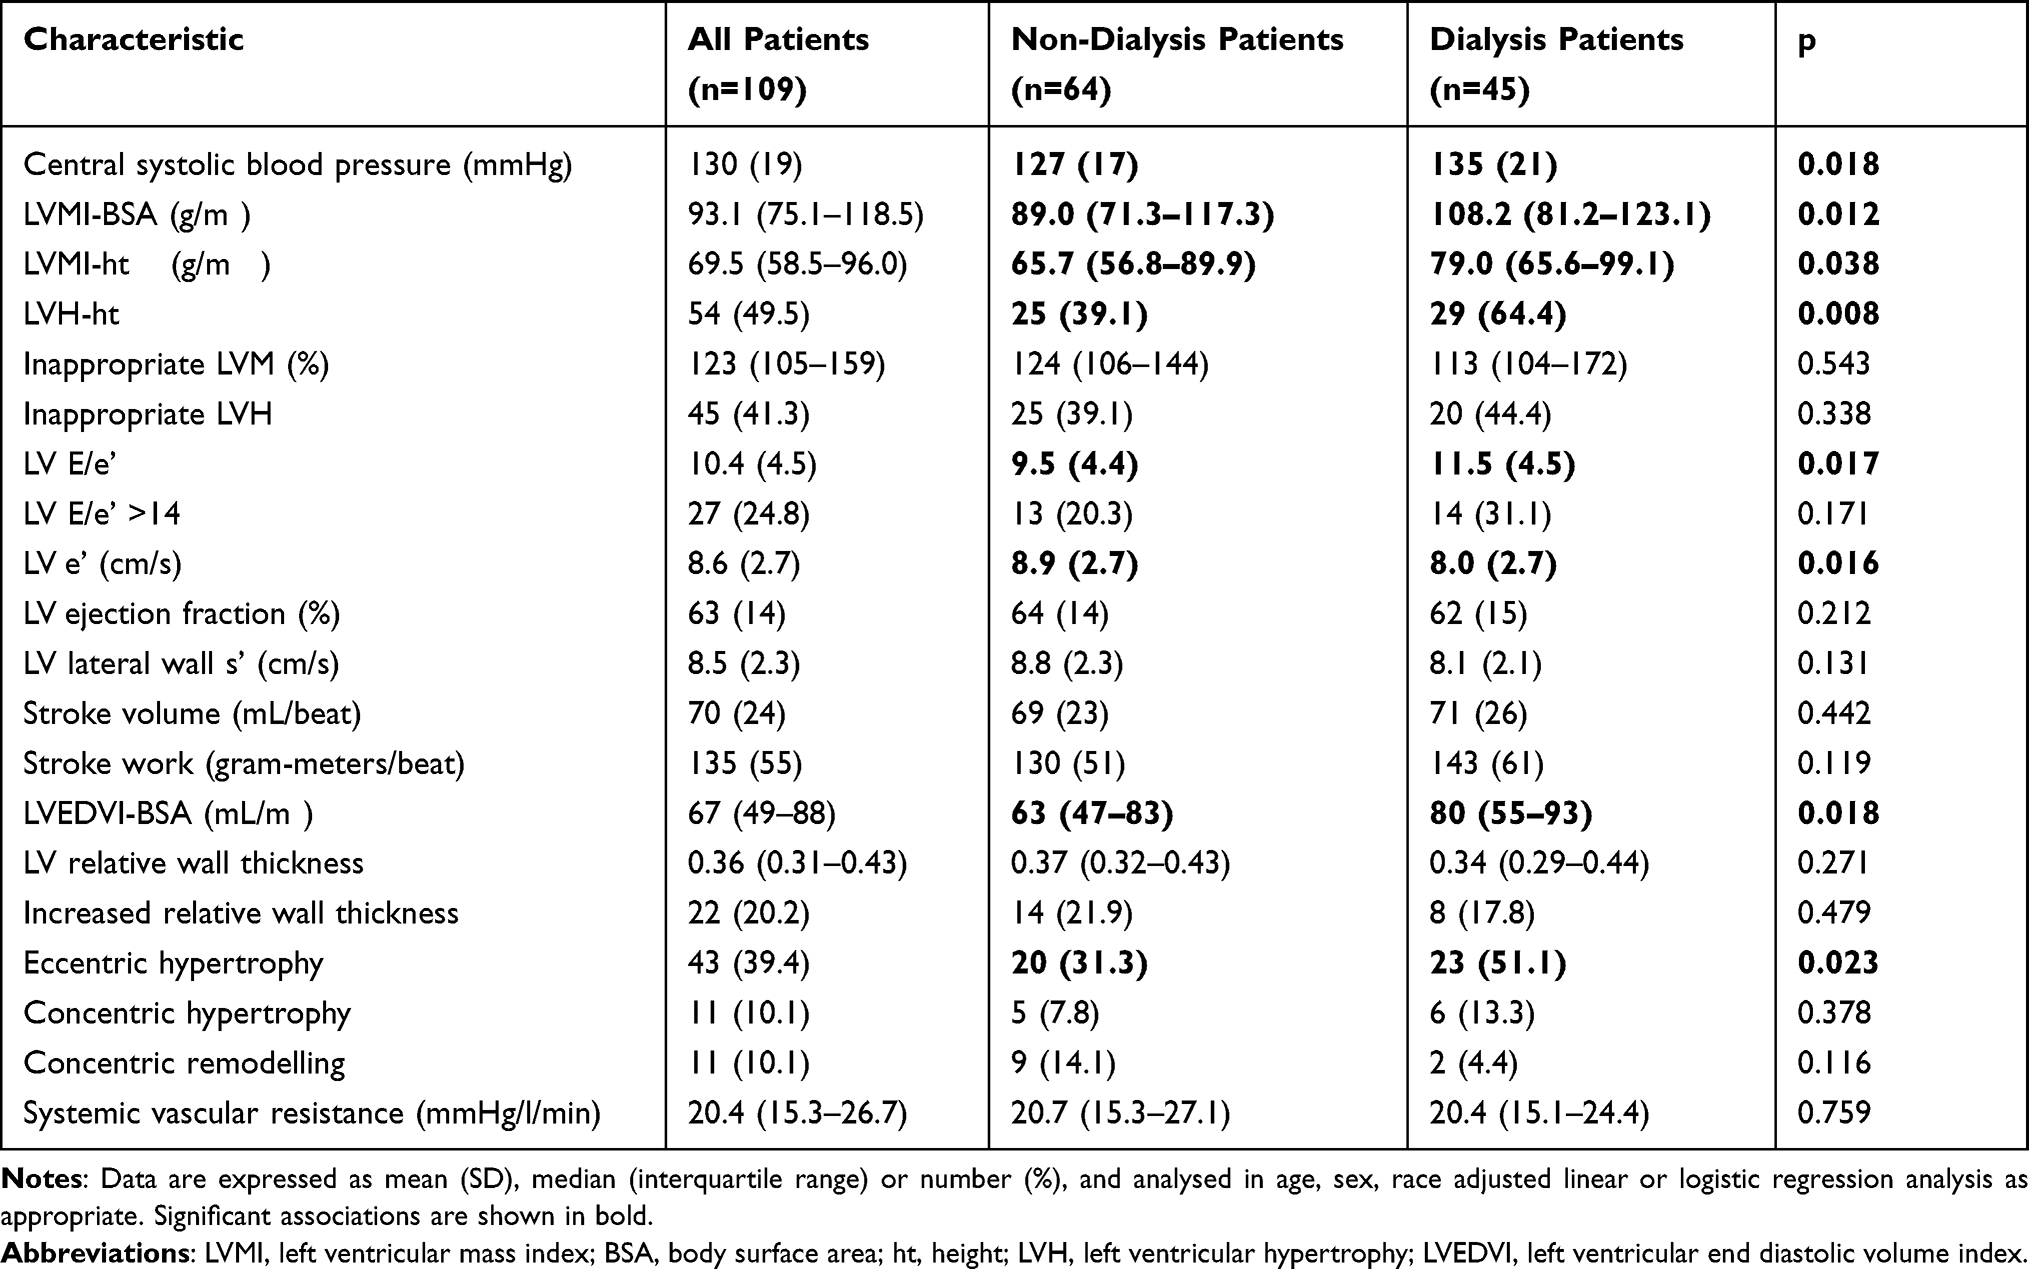 |
Table 2 Central Systolic Blood Pressure, Left Ventricular Structure and Function and Systemic Vascular Resistance in Study Participants |
Relationships of Biomarkers with LVMI-BSA and LVM-ht1.7
Table 3 gives the age, sex, and race (and weight when appropriate) adjusted associations of biomarkers with LVMI-BSA and LVMI-ht1.7. In all patients, ferritin and parathyroid hormone levels were consistently related to left ventricular mass indices. Albumin and gamma-glutamyl transferase concentrations were associated with left ventricular mass indices in non-dialysis but not dialysis patients. Uric acid levels were not associated with left ventricular mass indices. Table 4 shows that each of these associations remained significant after additional adjustment for, and therefore beyond stroke work. Additionally, CKD status tended to impact (p=0.094 to 0.064) the albumin-left ventricular mass indices relations and influenced (p=0.024 to 0.020) the gamma-glutamyl transferase-left ventricular mass indices relations, which is congruent with the finding that albumin and gamma-glutamyl transferase concentrations were related to left ventricular mass indices in non-dialysis but not dialysis patients.
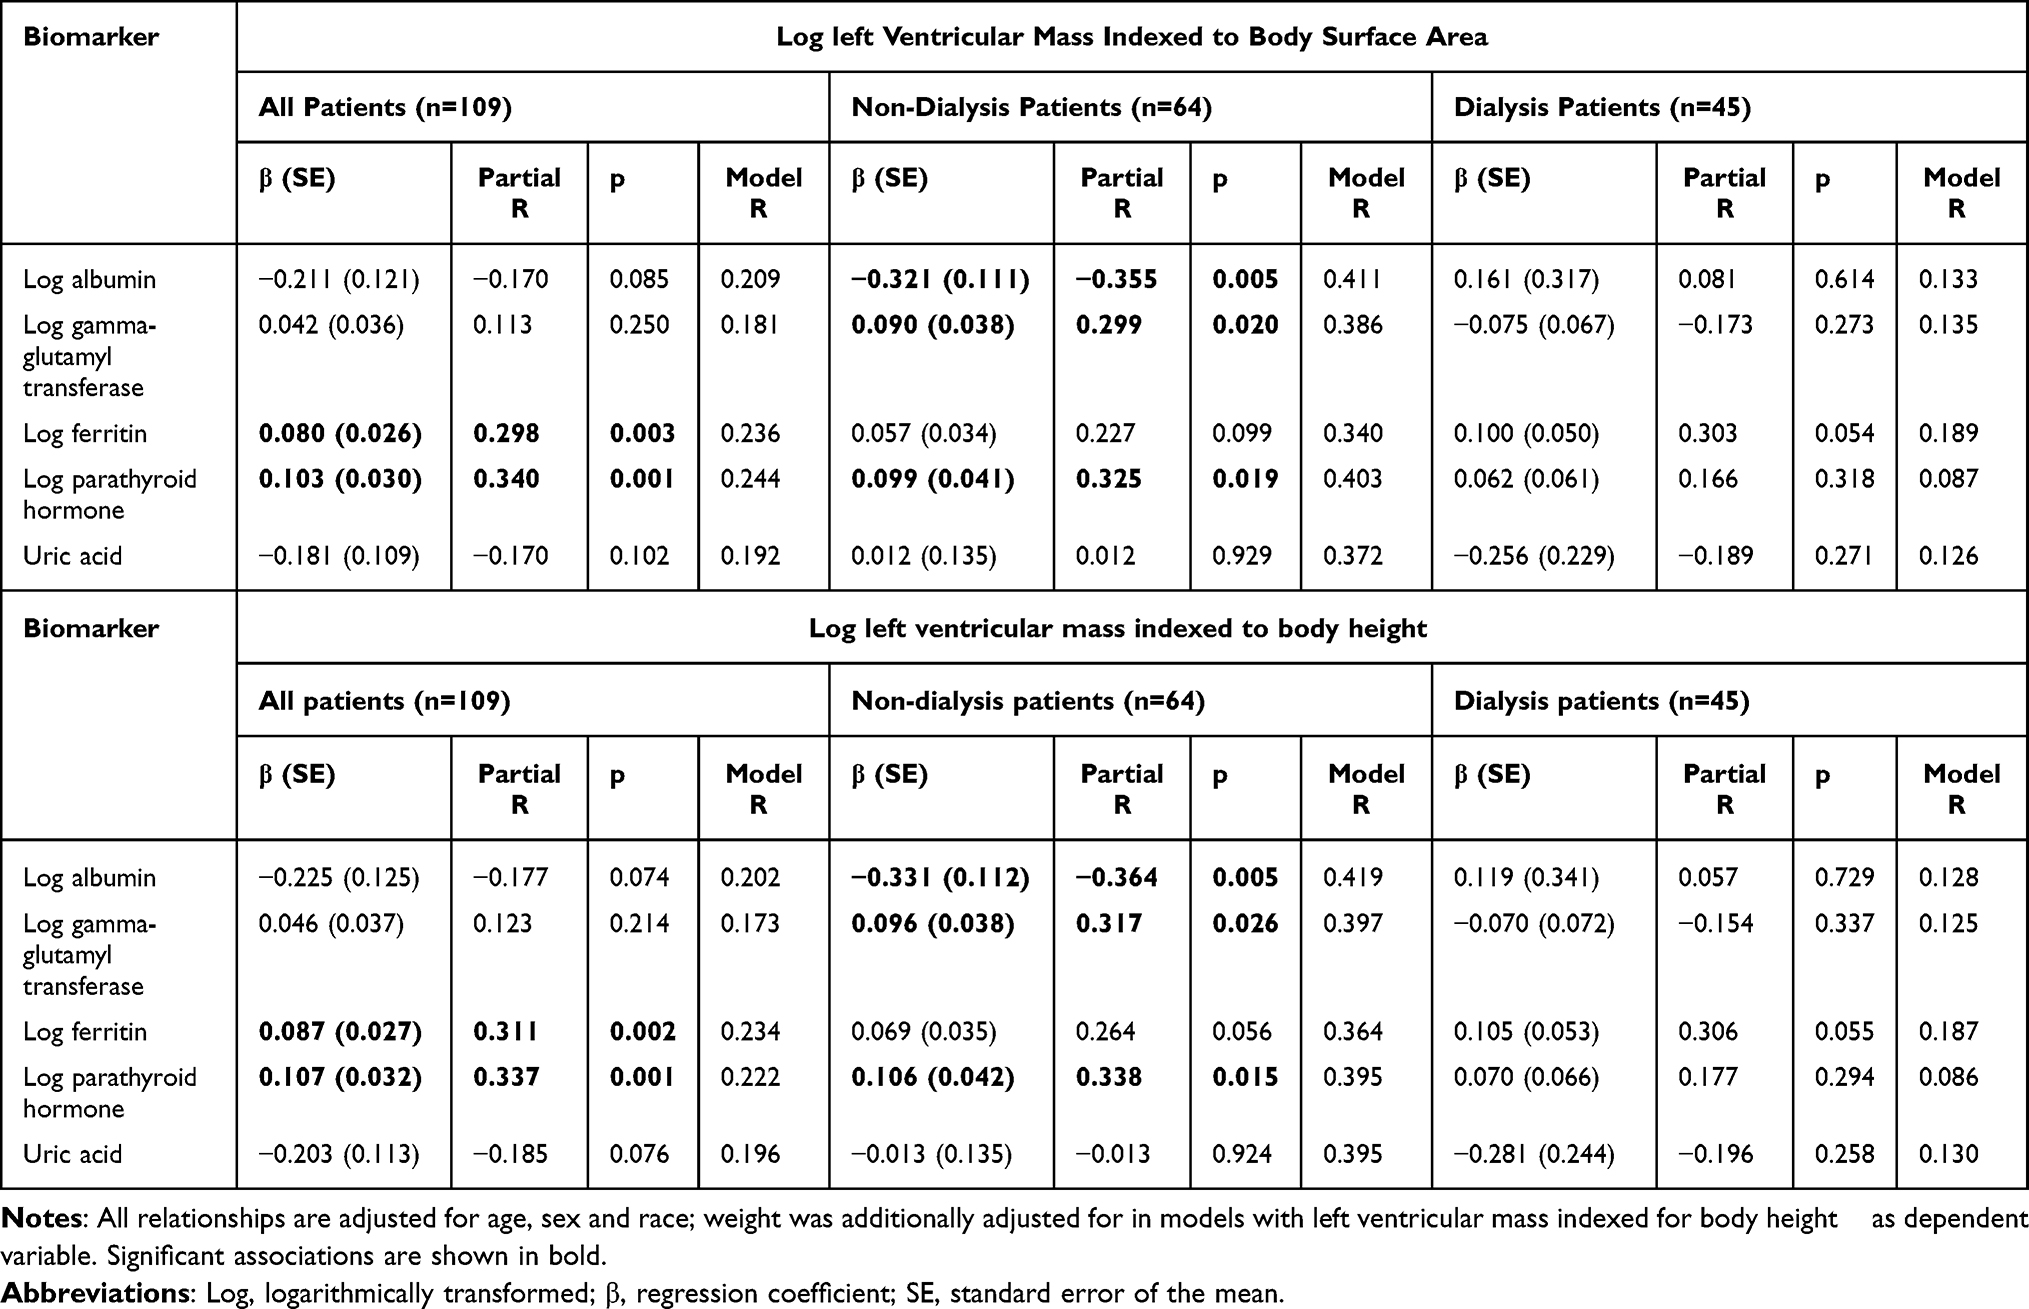 |
Table 3 Relationships of Biomarkers with Left Ventricular Mass Indexed to Body Surface and Body height1.7 |
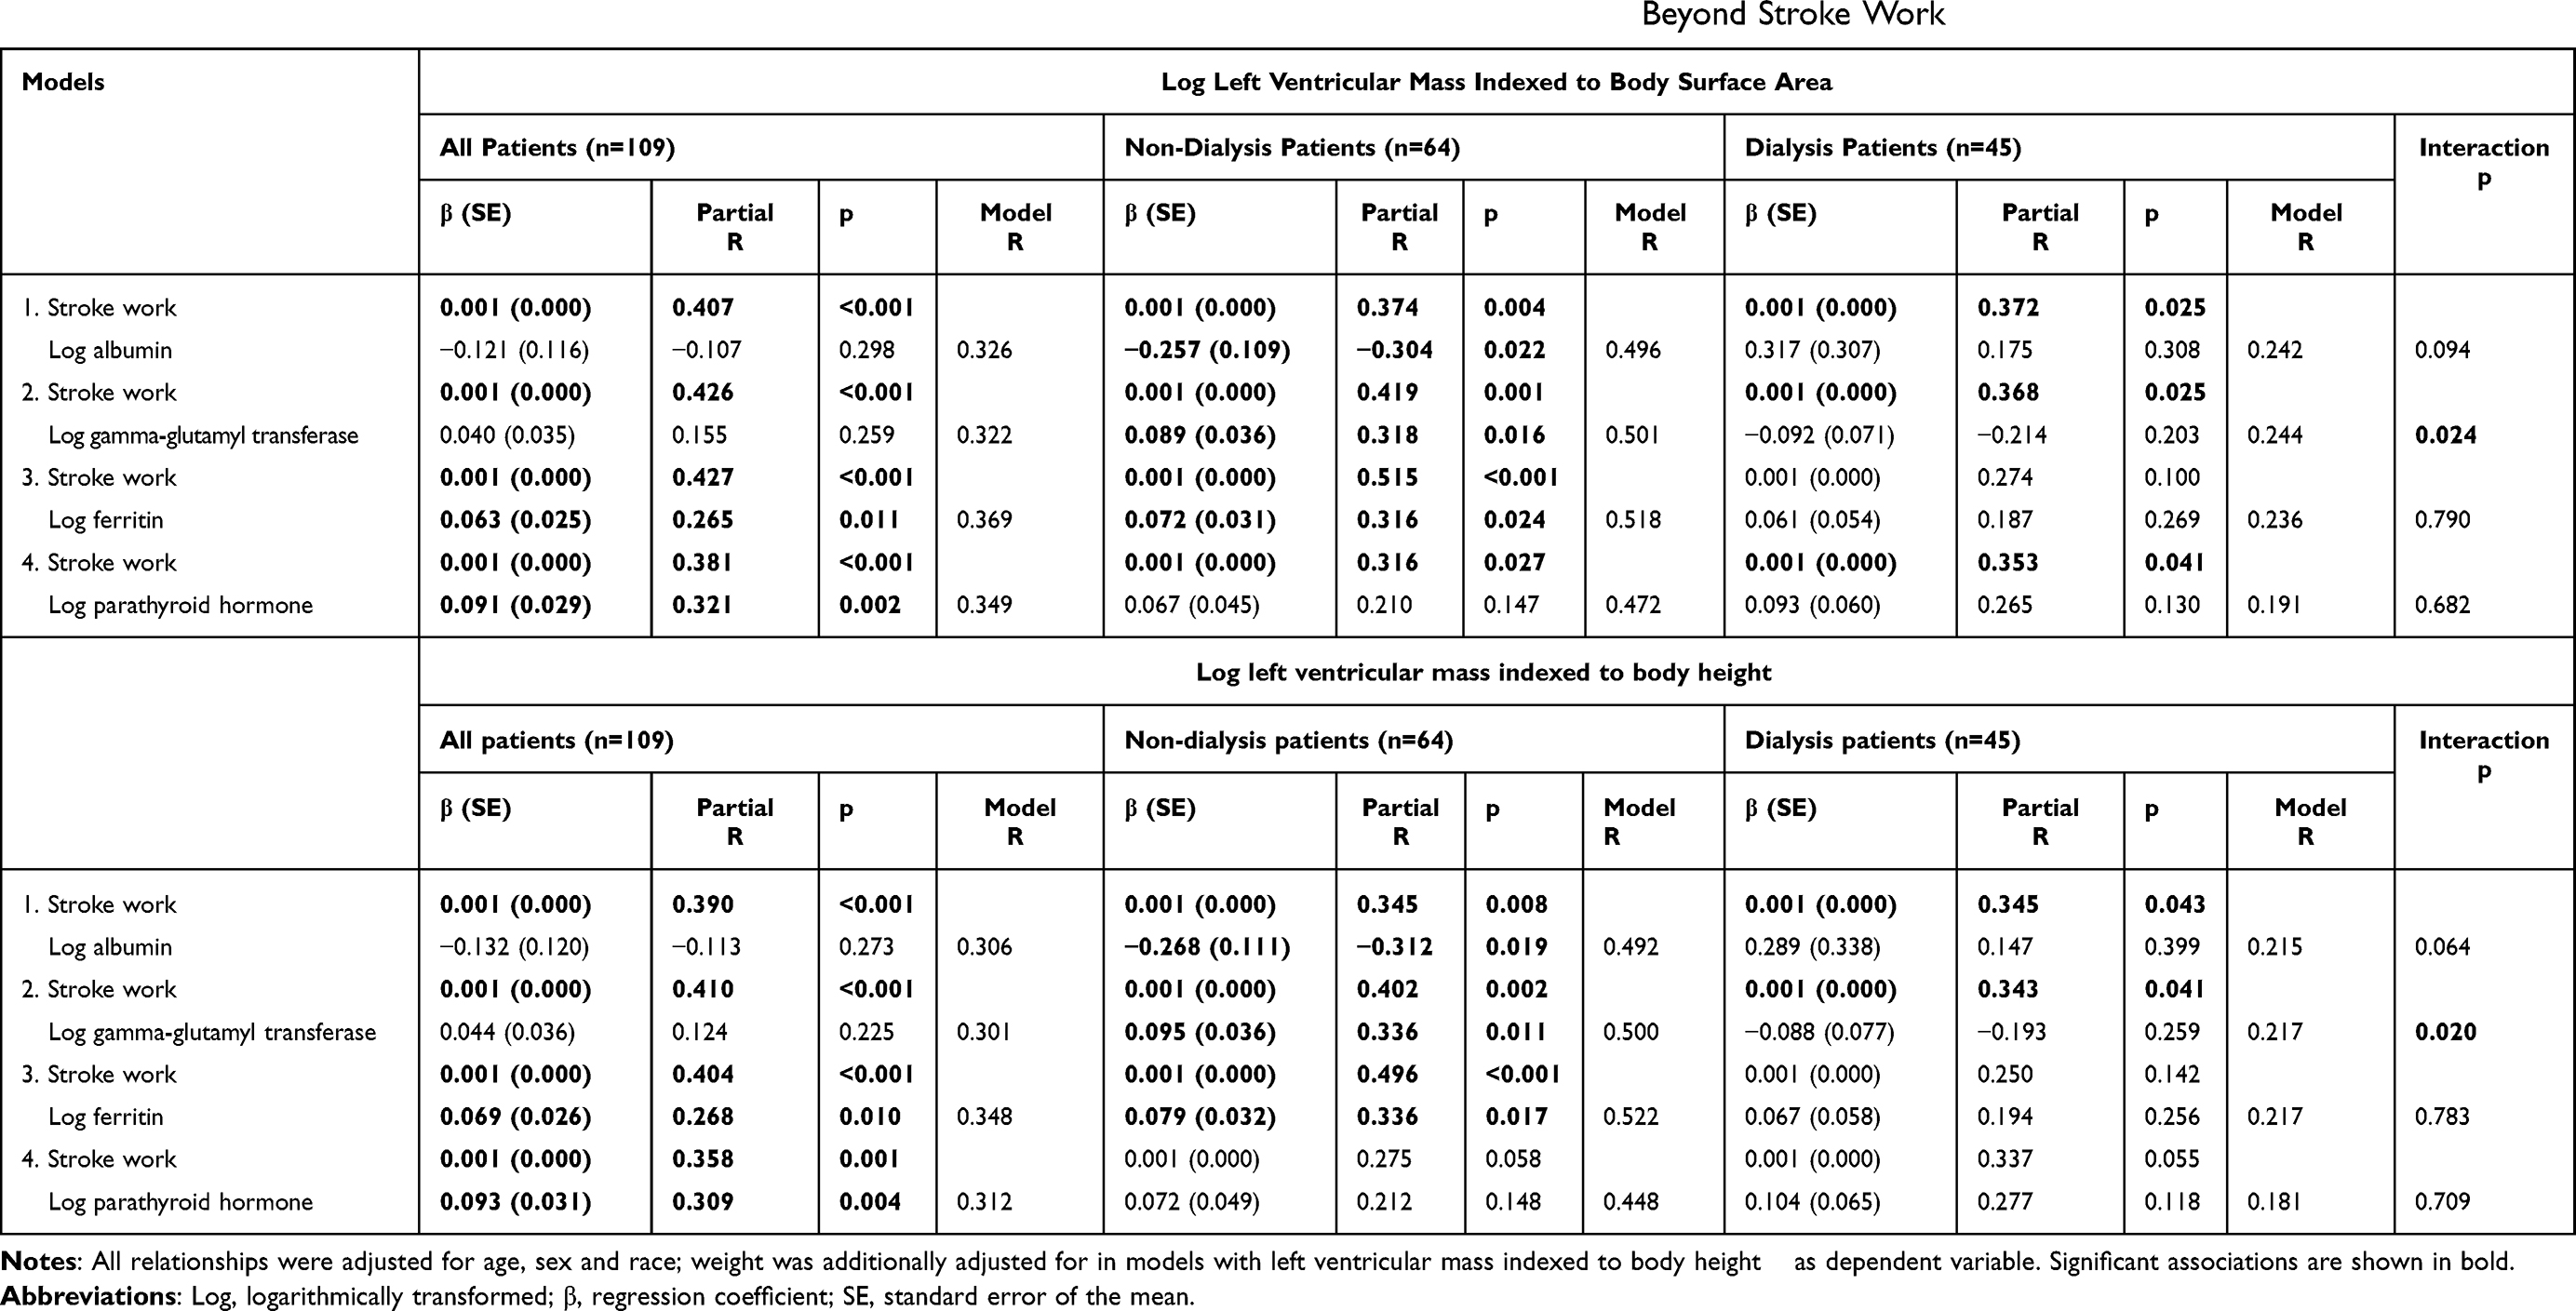 |
Table 4 Relationships of Biomarkers with Left Ventricular Mass Indexed to Body Surface Area and Body height1.7 Beyond Stroke Work |
Relationships of Biomarkers with Inappropriate Left Ventricular Mass
Table 5 gives the associations of biomarkers with inappropriate left ventricular mass.
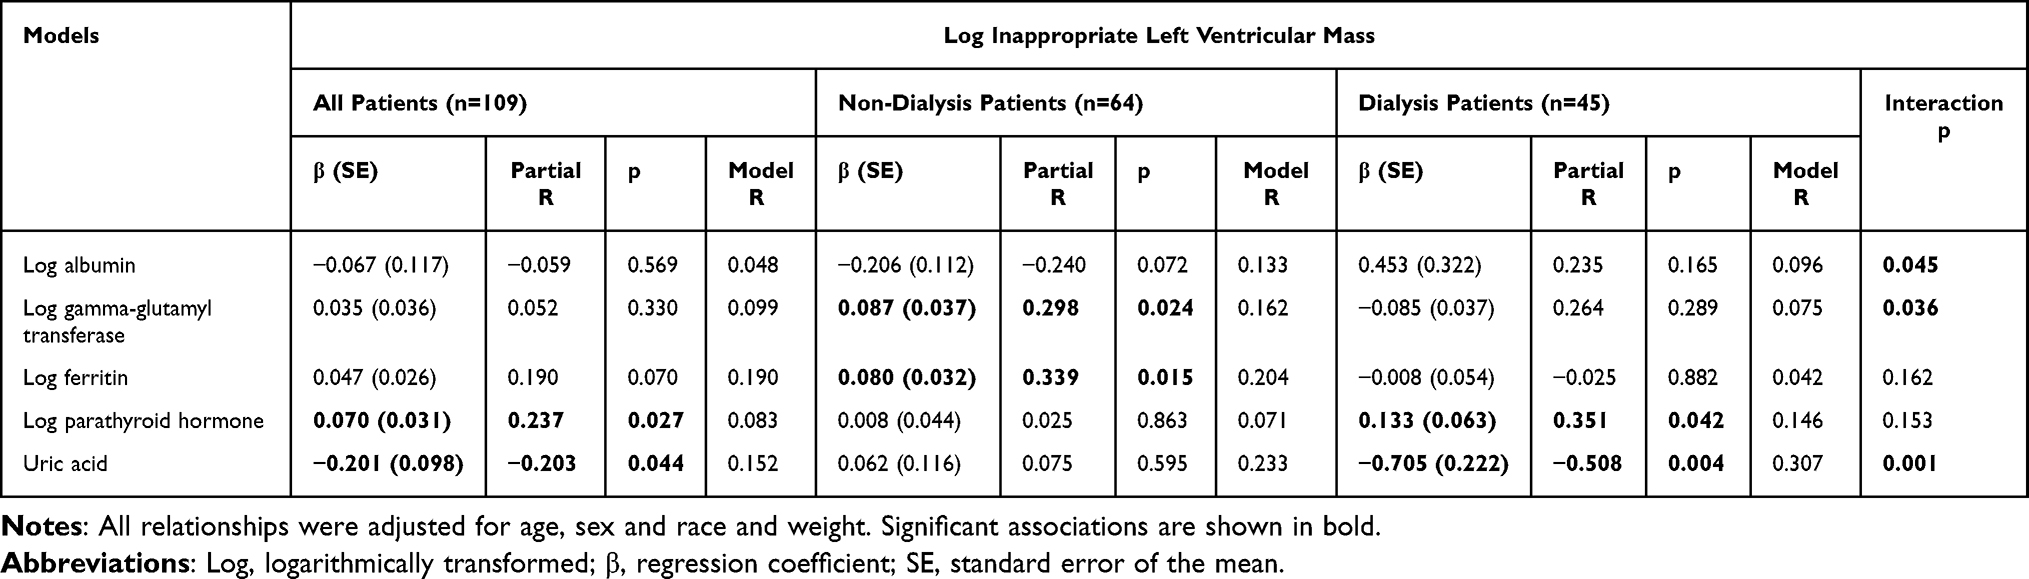 |
Table 5 Relationships of Biomarkers with Inappropriate Left Ventricular Mass |
Parathyroid hormone and uric acid levels were associated with inappropriate left ventricular mass in all patients. Parathyroid hormone was also related to inappropriate left ventricular mass in dialysis patients. CKD status strongly impacted the uric acid-inappropriate left ventricular mass relation. Consequently, uric acid concentrations were strongly (and inversely) related to inappropriate left ventricular mass in dialysis but not non-dialysis patients. Dialysis status also influenced the gamma-glutamyl transferase-inappropriate left ventricular mass association. Gamma-glutamyl transferase concentrations were related to inappropriate left ventricular mass in non-dialysis but not dialysis patients. Ferritin levels were associated to inappropriate left ventricular mass in non-dialysis patients only. Albumin concentrations were not related to inappropriate left ventricular mass.
Relationships of Biomarkers with E/e’
Table 6 shows the age, sex, and race adjusted associations of biomarkers with E/e’. Albumin and gamma-glutamyl transferase levels were associated with E/e’ in all patients. Gamma-glutamyl transferase concentrations were also related to E/e’ in dialysis patients. Ferritin levels were associated with E/e’ in non-dialysis patients. Parathyroid hormone and uric acid concentrations were not related to E/e.’
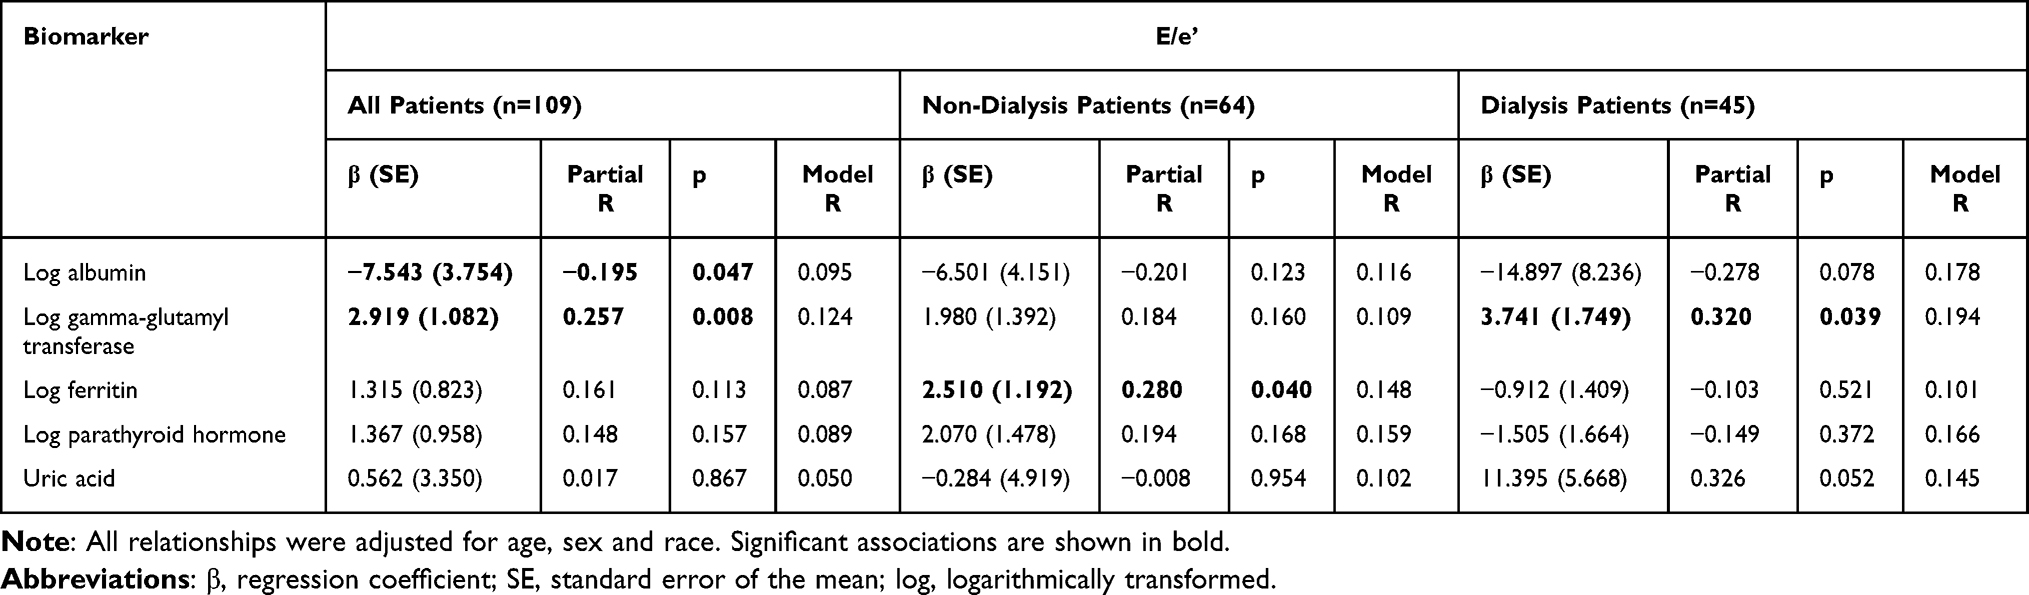 |
Table 6 Relationships of Biomarkers with E/e’ |
Table 7 gives the associations of biomarkers with E/e’ after additional adjustment for body mass index, mean arterial pressure, heart rate and diabetes. In all and dialysis patients, gamma-glutamyl transferase levels remained associated with E/e.’ Ferritin concentrations also remained associated with E/e’ in non-dialysis patients. Albumin levels were related to E/e’ in dialysis patients only.
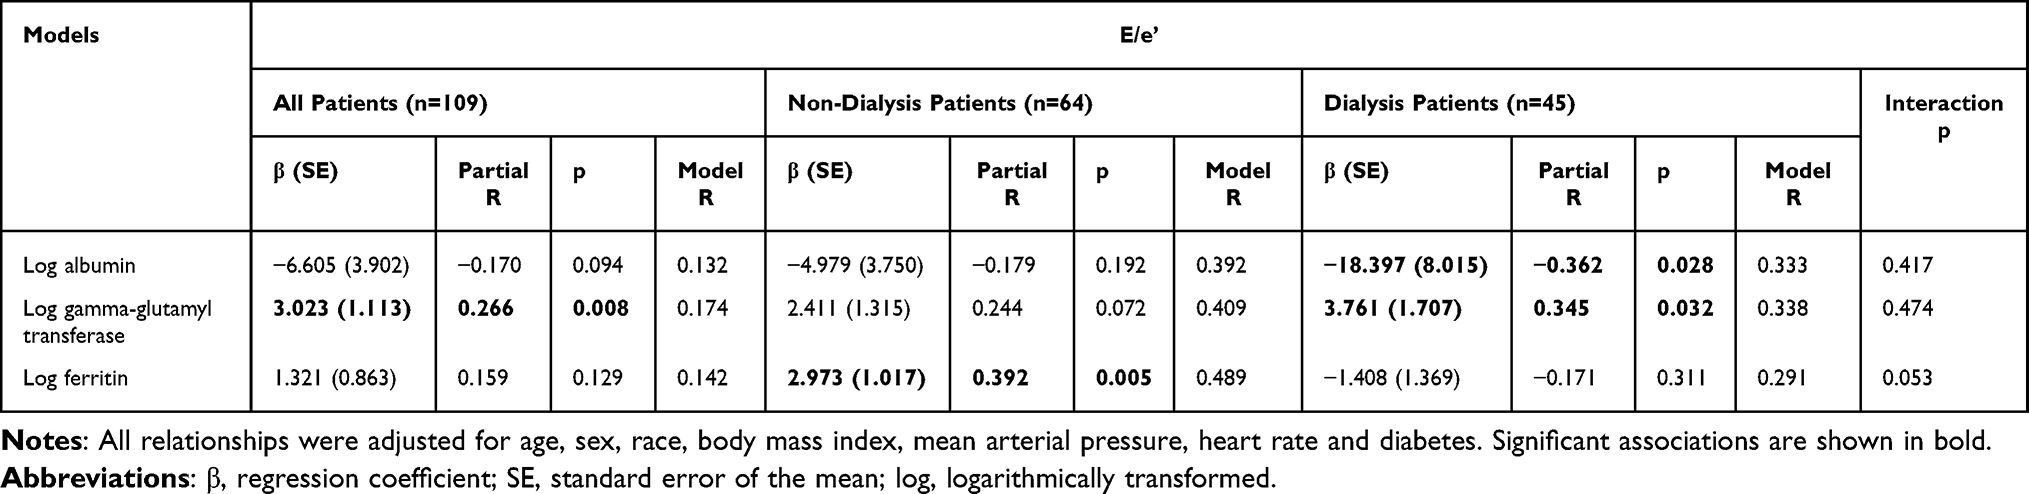 |
Table 7 Independent Relationships of Biomarkers with E/e’ |
Supplementary Table 1 shows that upon adjustment for cardiac preload (left ventricular end diastolic volume indexed to body surface area) and afterload (central systolic blood pressure and systemic vascular resistance), gamma-glutamyl transferase in all patients and ferritin concentrations in non-dialysis participants remained associated with E/e’. When we set atrial pressure at 10 mmHg upon calculating systemic vascular resistance among dialysis patients, its median (interquartile range) value was 18.4 (13.8–21.9) mmHg/l/min and the results in Supplementary Table 1 were unaltered (see Supplementary Table 2).
None of the biomarkers were associated with e’ and left ventricular systolic measures including lateral s’ or ejection fraction (see Supplementary Table 3).
Relationships of Biomarkers with LVMI-BSA, LVMI-ht1.7, Inappropriate Left Ventricular Mass, and E/e’ in Sensitivity Analysis Among Patients Without Myocardial Infarction or Heart Failure
As shown in, Supplementary Tables 4–6, overall, the associations of biomarkers with LVMI-BSA, LVMI-ht1.7, inappropriate left ventricular mass, and E/e’ in sensitivity analysis among patients without myocardial infarction or heart failure did not materially differ from those in all study participants (Tables 3, 5 and 6). The exception was that the associations of ferritin levels with LVMI-BSA and LVMI-ht1.7 in dialysis patients were now significant at p=0.035.
Relationships of Biomarkers with Left Ventricular Hypertrophy and Increased E/e’
The associations of biomarkers with left ventricular hypertrophy indexed to height1.7, inappropriate left ventricular hypertrophy, and E/e’ >14 in all, non-dialysis and dialysis patients were first examined in receiver operator characteristic (ROC) curve analysis. The significant findings are given in Figure 1. Among all patients, ferritin (area under the curve (AUC) for the ROC curve=0.648, p=0.010) and parathyroid hormone concentrations (AUC=0.630, p=0.028) were associated with LVH-ht1.7 whereas gamma-glutamyl transferase levels (AUC=0.654, p=0.026) were related to E/e’ >14. Among dialysis patients, ferritin concentrations (AUC=0.703, p=0.026) were associated with LVH-ht1.7, uric acid levels (AUC=0.877, p <0.001) were related to appropriate left ventricular hypertrophy and albumin concentrations (AUC=0.728, p=0.018) were associated with E/e’ ≤14.
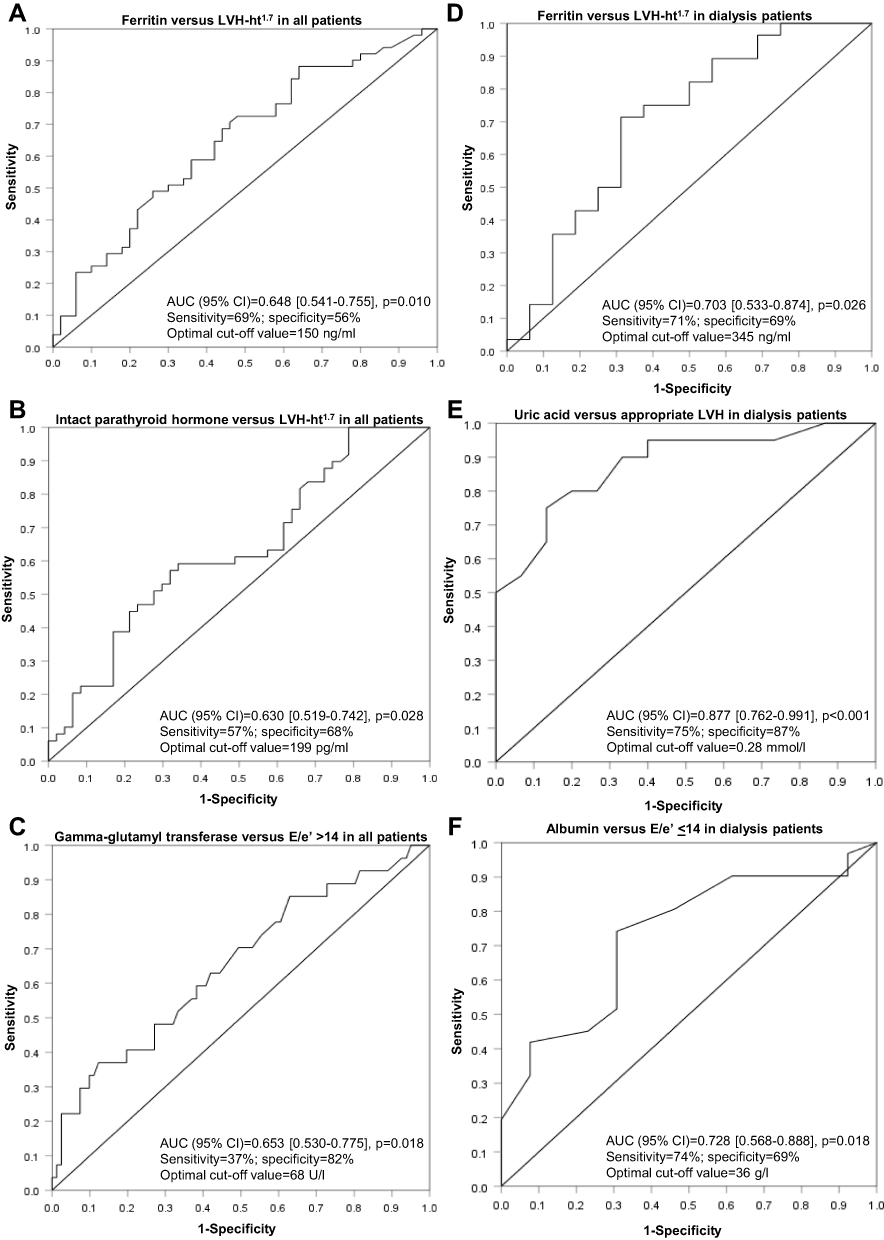 |
Figure 1 Receiver operator characteristic curve analysis showing the performance of biomarkers in identifying left ventricular hypertrophy, inappropriate left ventricular hypertrophy and E/e’ > 14 among all patients (A–C) and those on dialysis (D–F). No significant associations were found in non-dialysis patients. LVH-ht1.7=left ventricular hypertrophy indexed to height1.7; LVH=left ventricular hypertrophy. |
As shown in Table 8, upon using the optimal cut-off values as identified in ROC curve analysis, the associations of elevated or reduced (as appropriate) biomarker levels with LVH-ht1.7, inappropriate left ventricular hypertrophy, and E/e’ >14 in age, sex and race adjusted logistic regression models remained significant (p=0.001 to 0.040).
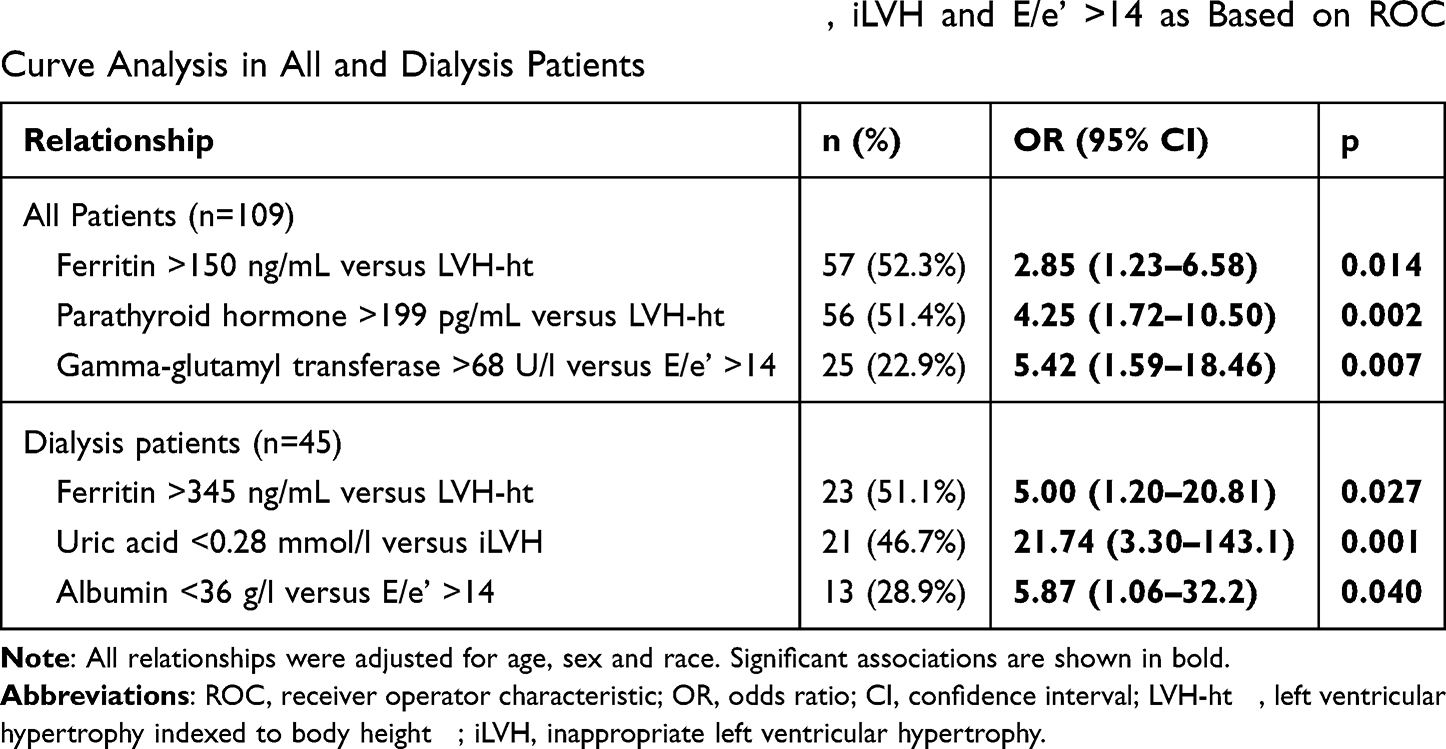 |
Table 8 Relationships of Biomarkers with LVH-ht1.7, iLVH and E/e’ >14 as Based on ROC Curve Analysis in All and Dialysis Patients |
Table 9 gives the cut-off values and sensitivity or specificity when sensitivity and specificity were set at 80% in ROC analysis for the biomarker-cardiac parameter associations in dialysis patients.
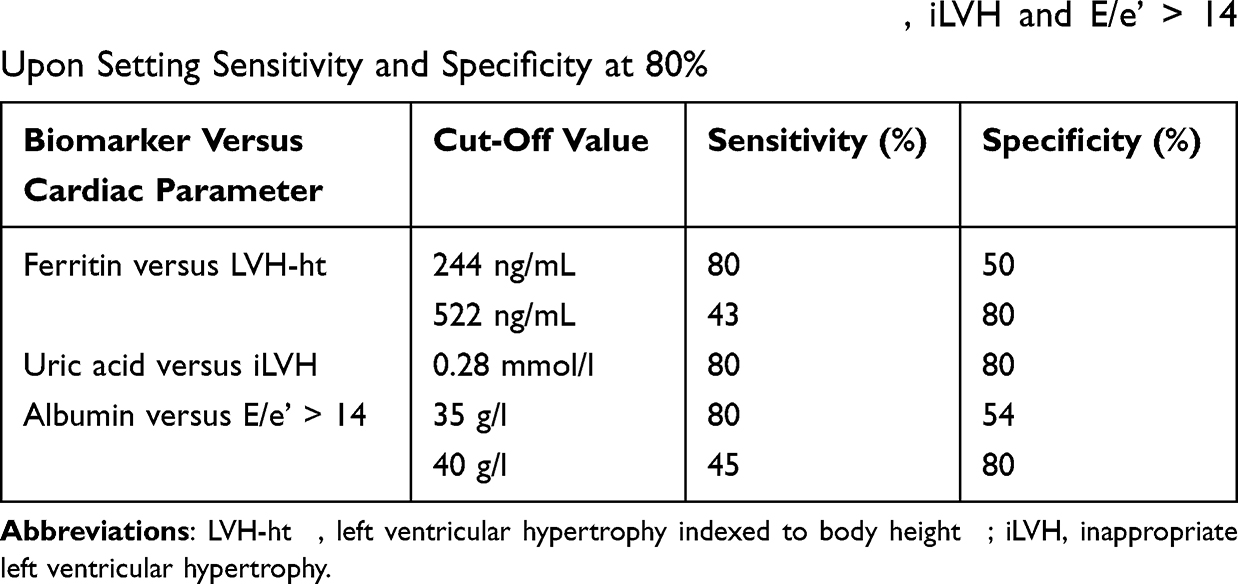 |
Table 9 Classification of Dialysis Patients with LVH-ht1.7, iLVH and E/e’ > 14 Upon Setting Sensitivity and Specificity at 80% |
Relationships of Biomarkers with Left Ventricular Mass and E/E’ After Adjustment for Potential Mediators
As given in Supplementary Table 7, to determine whether the main associations that were identified in Tables 3, 5 and 6 could be explained by inflammation or nutritional status, we re-assessed those respective relationships in models adjusted for high-sensitivity C-reactive protein, alanine transaminase and haemoglobin levels, and waist-hip ratio. Apart from a marginal attenuation of the albumin-E/e’ association, the findings remained unaltered.
Discussion
This study examined independent relationships of uric acid, ferritin, albumin, parathyroid hormone and gamma-glutamyl transferase concentrations with core features of uraemic cardiomyopathy including high left ventricular mass, inappropriate left ventricular mass, and E/e’ as a marker of impaired diastolic function in CKD. We also determined whether these associations differed in non-dialysis compared to dialysis patients. Each evaluated biomarker was associated with left ventricular mass beyond stroke work and/or inappropriate left ventricular mass in all, non-dialysis and/or dialysis patients. Ferritin, albumin and gamma-glutamyl transferase levels were additionally associated with E/e’ in all, non-dialysis and/or dialysis patients. Dialysis status influenced the relationship of uric acid concentrations with inappropriate left ventricular mass and those of gamma-glutamyl transferase levels with left ventricular mass and inappropriate left ventricular mass. Accordingly, in stratified analysis, low uric acid levels were related to inappropriate left ventricular mass in dialysis but not non-dialysis patients whereas gamma-glutamyl transferase concentrations were associated with left ventricular mass and inappropriate left ventricular mass in non-dialysis but not dialysis patients. Uric acid, ferritin and albumin concentrations effectively discriminated between dialysis patients with and without inappropriate left ventricular hypertrophy, left ventricular hypertrophy, and increased E/e’, respectively. Our results indicate that uric acid, ferritin, albumin, parathyroid hormone and gamma-glutamyl transferase may be involved in the development of uremic cardiomyopathy and useful in its identification.
We found that uric acid levels were strongly and inversely associated with inappropriate left ventricular mass (partial R=−0.508, p=0.004) in dialysis patients. Accordingly, in ROC curve analysis, uric acid concentrations differentiated dialysis patients with inappropriate left ventricular hypertrophy from those without to a clinically useful extent, ie, with an AUC of 0.877 and a corresponding sensitivity and specificity of 75% and 87%, respectively, at an optimal cut-off value of 0.28 mmol/l. Interestingly, a recent investigation by Selim et al25 disclosed that low uric acid was associated with left ventricular hypertrophy in 225 hemodialysis patients. Inappropriate left ventricular mass was not assessed in the latter study. Our findings and those in the Selim study25 contrast sharply with those disclosed in non-dialysis CKD patients14,26 where uric acid was directly associated with left ventricular mass and inappropriate left ventricular mass, as well as impaired diastolic and systolic function. Also, whereas high uric acid associates with increased cardiovascular mortality in non-dialysis patients,27 the reverse was found in some studies that comprised dialysis patients.27,28 What could explain these contrasting relationships between non-dialysis and dialysis CKD patients? At physiological concentrations, uric acid accounts for approximately half of the plasma free radical scavenger capacity.7 In this regard, circulating uric acid reduces hydroxyl and superoxide radicals as well as lipid peroxidation and ascorbate oxidation.29 Contrariwise, hyperuricemia causes increased oxidative stress and has profibrotic and proinflammatory effects that can lead to left ventricular hypertrophy and impaired diastolic function, as recently documented in mice fed a western diet.30 In relation to oxidative stress, intracellular adipocyte uric acid stimulates nicotinamide adenine dinucleotide phosphate oxidase-dependent production of reactive oxygen species.29 Uric acid levels increase as the glomerular filtration rate declines in non-dialysis CKD patients.14 However, in patients with end stage renal disease, one hemodialysis session eliminates as much as ~1 gram of uric acid7 thereby reducing its concentrations by ~80% and keeping them below saturation level.15 In keeping with this observation, the mean (SD) uric acid level was 0.41 (0.12) versus 0.28 (0.12) in our non-dialysis versus dialysis study participants despite similar frequencies of allopurinol use among the 2 groups. A recent randomized controlled trial showed that in dialysis patients that had a mean (SD) baseline uric acid concentration of 0.36 (0.09) mmol/l, allopurinol use did not reduce left ventricular mass.31 Taken together, whether uric acid lowering may in fact enhance cardiovascular risk in at least some haemodialysis patients requires further study.
Our analysis revealed that ferritin levels were independently associated with left ventricular mass in all study participants and with inappropriate left ventricular mass and E/e’ in non-dialysis patients. In ROC curve analysis, ferritin concentrations usefully distinguished between dialysis patients with versus those without left ventricular hypertrophy with an AUC of 0.703 and a corresponding sensitivity and specificity of 71% and 69%, respectively, at an optimal cut-off value of 345 ng/mL. Upon setting the sensitivity and specificity at 80% in ROC curve analysis, the cut-off values were 244 ng/mL and 522 ng/mL, respectively. In line with our findings, previous non-CKD studies have shown that iron overload can cause oxidative stress via the Fenton reaction and thereby induce left ventricular hypertrophy, cardiac fibrosis, and markedly impaired left ventricular diastolic function before systolic function decreases.8,9 On the other hand, both iron overload as well as iron deficiency induce oxidative stress including lipid peroxidation and thereby mediate mitochondrial damage32 and increased heart failure risk.33 Iron deficiency is highly prevalent in particularly advanced CKD and associates with increased cardiovascular event rates and mortality.34 In the recent PIVOTAL trial35 that comprised hemodialysis patients, administering intravenous iron unless serum ferritin was >700 µg/l or serum transferrin saturation was 40% was associated with reduced adverse cardiovascular events or death compared to the use of intravenous iron triggered only by a ferritin level of <200 µg/l or serum transferrin saturation of <20%. However, it remains unknown whether a ferritin concentration target <700 µg/l may be sufficient and even optimal.34 Our results indeed argue towards targeting a ferritin level that is lower than 700 µg/l upon treating iron deficiency in hemodialysis patients with intravenous iron.
Serum albumin concentrations were inversely associated with left ventricular mass in non-dialysis patients and, in a fully adjusted model (Table 7), with E/e’ in dialysis patients. In ROC curve analysis, albumin levels discriminated effectively between patients with and without increased E/e’ with an AUC of 0.728 and a corresponding sensitivity and specificity of 74% and 69%, respectively, at an optimal cut-off value of 36 g/l. Upon setting the sensitivity and specificity at 80% in ROC curve analysis, the cut-off values were 35 g/l and 40 g/l, respectively. Hypoalbuminemia represents a negative acute phase reactant and marker of malnutrition.17 Serum albumin is also an abundant antioxidant under normal and oxidative stress conditions.11,12 CKD reduces circulating levels of serum albumin hydroperoxide, which is a potent antioxidant.10 Hemodialysis restores serum albumin hydroperoxide concentrations.10 Hypoalbuminemia strongly associates with incident cardiovascular events and overall mortality in both non-dialysis and hemodialysis CKD patients.36,37 Our findings confirm the inverse association between serum albumin levels and left ventricular mass in non-dialysis CKD patients as recently reported by Gupta et al17 In relation to the potential effects of low serum albumin concentrations on E/e’ in dialysis patients as identified in the present study, Prenner et al38 recently found that low serum albumin associates with myocardial fibrosis, N-terminal pro B-type natriuretic peptide levels, incident heart failure hospitalization and death among heart failure with preserved ejection fraction patients. This was not attributable to sarcopenia or cachexia.38 The mechanisms underlying the association of low serum albumin with uremic cardiomyopathy characteristics merit further investigation.
Hyperparathyroidism causes mitochondrial calcium excess in cardiomyocytes that leads to oxidative stress, necrotic cell death and fibrosis.13 Parathyroid hormone was recently also shown to induce mitochondrial calcium overload driven reactive oxygen species production in endothelial cells.39 Secondary hyperparathyroidism is particularly implicated in uremic cardiomyopathy among patients with end stage chronic kidney disease. Parathyroidectomy in such patients reduces left ventricular hypertrophy and improves left ventricular systolic function.19 We recently reported that persistent secondary hyperparathyroidism is independently associated with impaired diastolic function in stable kidney transplant recipients.22 In the present study, parathyroid levels were associated with left ventricular mass and inappropriate left ventricular mass. Notably, our results show for the first time that the potential impact of parathyroid hormone levels on left ventricular mass is equally strong in non-dialysis as it is in dialysis patients (interaction p=0.682 to 0.709). In ROC curve analysis, parathyroid hormone concentrations discriminated between patients with and without left ventricular hypertrophy (p=0.028) but not to a clinically reliable extent (AUC=0.630).
Gamma-glutamyl transferase concentration is an established marker of liver disease and excessive alcohol use as well as steatosis in the context of metabolic syndrome.5 However, gamma-glutamyl transferase also hydrolyses extra-cellular glutathione, which is a major antioxidant.5 This produces cysteinylglycine, which can generate superoxide anion radicals upon interacting with free iron. On the other hand, together with membrane dipeptidases, gamma-glutamyl transferase thereby also frees amino acids for the production and repletion of intracellular glutathione and protein. Hence, high gamma-glutamyl transferase levels represent a marker of increased oxidative stress. In this regard, gamma-glutamyl transferase concentrations independently predict cardiovascular and overall mortality in various populations including patients with end stage chronic kidney disease.5 In this study, gamma-glutamyl transferase levels were independently related to left ventricular mass and inappropriate left ventricular mass in non-dialysis but not dialysis CKD patients (interaction p=0.020 to 0.036). Additionally, gamma-glutamyl transferase concentrations were related to E/e’ in all patients and to a similar extent in non-dialysis compared to dialysis patients. In ROC curve analysis, gamma-glutamyl transferase levels discriminated between patients with and without left ventricular hypertrophy (p=0.018) but not to a clinically reliable extent (AUC=0.653). Our results and previously reported data suggest that the association of gamma-glutamyl transferase concentrations with adverse cardiovascular outcomes in CKD may originate in oxidative stress induced left ventricular hypertrophy and impaired diastolic function.
As previously alluded to, the Na/K-ATPase oxidant amplification loop is strongly implicated in uremic cardiomyopathy.6 To our knowledge, whether the biomarkers that were evaluated in the present study impact the Na/K-ATPase oxidant amplification loop is currently unknown.
The major limitation of this study is its cross-sectional design, which precludes drawing inferences about cause-effect relationships. The sample sizes were small in subgroups. Also, larger studies will be needed to determine whether intact parathyroid hormone and gamma-glutamyl transferase levels can be useful in identifying patients with uremic cardiomyopathy. We evaluated many relationships, but our conclusions are based on results obtained in comprehensively adjusted models.
In conclusion, uric acid, ferritin, albumin, parathyroid hormone and gamma-glutamyl transferase were associated with uremic cardiomyopathy characteristics and could be useful in their identification. Our findings merit validation in future longitudinal studies.
Ethics Statement
This study was performed according to the Helsinki Declaration of 1975 as revised in 2013. The study was approved by the University of the Witwatersrand Human (Medical) Research Ethics Committee (protocol number: M15-08-43) in Johannesburg, South Africa. Written informed consent was obtained in each patient prior to participation.
Author Contributions
All authors made substantial contributions to conception and design, acquisition of data, or analysis and interpretation of data; took part in drafting the article or revising it critically for important intellectual content; agreed to submit to the current journal; gave final approval of the version to be published; and agree to be accountable for all aspects of the work.
Funding
The study was supported by the South African National Research Foundation.
Disclosure
The authors declare no conflicts of interest in this work.
References
1. Wang X, Shapiro JI. Evolving concepts in the pathogenesis of uraemic cardiomyopathy. Nat Rev Nephrol. 2019;15(3):159–175. doi:10.1038/s41581-018-0101-8
2. Chen S-C, Chang J-M, Liu W-C, et al. The ratio of observed to predicted left ventricular mass is independently associated with increased cardiovascular events in patients with chronic kidney disease. Hypertens Res. 2012;35(8):832–838. doi:10.1038/hr.2012.40
3. Garikapati K, Goh D, Khanna S, Echampati K. Uraemic cardiomyopathy: a review of current literature. Clin Med Insights Cardiol. 2021;23(15):1179546821998347.
4. Bao J-F, Hu -P-P, She Q-Y, Zhang D, Mo J-J LA, Li A. A bibliometric and visualized analysis of uremic cardiomyopathy from 1990 to 2021. Front Cardiovasc Med. 2022;9:908040. doi:10.3389/fcvm.2022.908040
5. Postorino M, Marino C, Tripepi G, Zoccali C. Gammaglutamyltransferase in ESRD as a predictor of all-cause and cardiovascular mortality: another facet of oxidative stress burden. Kidney Int Suppl. 2008;74(Suppl 111):S64–S66. doi:10.1038/ki.2008.515
6. Liu J, Tian J, Chaudrhy M, et al. Attenuation of Na/K-ATPase mediated oxidant amplification with pNaKtide ameliorates experimental uremic cardiomyopathy. Sci Rep. 2017;20(7):46893. doi:10.1038/srep46893
7. Zawada AM, Carrero JJ, Wolf M, et al. Serum uric acid and mortality among haemodialysis patients. Kidney Int Rep. 2020;5:1196–1206. doi:10.1016/j.ekir.2020.05.021
8. Sukumaran A, Chang JC, Han M, Mintri S, Khaw B-A, Kim J. Iron overload exacerbates age-associated cardiac hypertrophy in a mouse model of hemochromatosis. Sci Rep. 2017;7(1):5756. doi:10.1038/s41598-017-05810-2
9. Kremastinos DT, Farmakis D. Iron overload cardiomyopathy in clinical practice. Circulation. 2011;124(20):2253–2263. doi:10.1161/CIRCULATIONAHA.111.050773
10. Shibata A, Ishima Y, Ikeda M, et al. Human serum albumin hydropersulfide is a potent reactive oxygen species scavenger in oxidative conditions such as chronic kidney disease. Biochem Biophys Res Commun. 2016;479(3):578–583. doi:10.1016/j.bbrc.2016.09.113
11. Roche M, Rondeau P, Singh NR, Tarnus E, Bourdon E. The antioxidant properties of serum albumin. FEBS Lett. 2008;582(13):1783–1787. doi:10.1016/j.febslet.2008.04.057
12. Belinskaia DA, Veronina VI, Schmurak V, et al. The universal soldier: enzymatic and non-enzymatic antioxidant functions of serum albumin. Antioxidants. 2020;9(10):966. doi:10.3390/antiox9100966
13. Fujii H. Association between parathyroid hormone and cardiovascular disease. Ther Apher Dial. 2018;22(3):236–241. doi:10.1111/1744-9987.12679
14. Kim IY, Ye BM, Kim MJ, et al. Association between serum uric acid and left ventricular hypertrophy/left ventricular diastolic dysfunction in patients with chronic kidney disease. PLoS One. 2021;16(5):e0251333. doi:10.1371/journal.pone.0251333
15. Arenas MD, Soriano R, Andres M, Pascual E. Serum urate levels of hemodialyzed renal patients revisited. J Clin Rheumatol. 2021;27(8):e362–e366. doi:10.1097/RHU.0000000000001438
16. Ueda N, Takasawa K. Impact of inflammation on ferritin, hepcidin and the management of iron deficiency anemia in chronic kidney disease. Nutrients. 2018;10(9):1173. doi:10.3390/nu10091173
17. Gupta J, Dominic EA, Fink JC, et al. Association between inflammation and cardiac geometry in chronic kidney disease: findings from the CRIC study. PLoS One. 2015;10(4):e0124772. doi:10.1371/journal.pone.0124772
18. Settle LHBC, Lopes EPDA. Liver enzymes serum levels in patients with chronic kidney disease on hemodialysis: a comprehensive review. Clinics. 2014;69(4):271–278. doi:10.6061/clinics/2014(04)09
19. Chen S, Sheng K, Shen Y, et al. Impact of parathyroidectomy on left ventricular function in end stage renal disease patients. BMC Nephrol. 2020;21(1):479. doi:10.1186/s12882-020-02139-3
20. Levey AS, Stevens LA, Schmid CH, Zhang YL. Castro 3rd AF, Feldman HI, et al. A new equation to estimate glomerular filtration rate. Ann Intern Med. 2009;150(9):604–612. doi:10.7326/0003-4819-150-9-200905050-00006
21. Gunter S, Robinson C, Woodiwiss AJ, et al. Arterial wave reflection and subclinical atherosclerosis in rheumatoid arthritis. Clin Exp Rheumatol. 2018;36(3):412–420.
22. Hsu H-C, Norton GR, Peters F, et al. Association of post transplantation anaemia and persistent secondary hyperparathyroidism with diastolic function in stable kidney transplant recipients. J Nephrol Renovasc Dis. 2021;14:211–223. doi:10.2147/IJNRD.S314313
23. Bello H, Woodiwiss AJ, Naran R, et al. Impact of stroke work on the ability of left ventricular mass to account for pressure effects on function in a community with prevalent systemic flow-dependent hypertension. J Hypertens. 2021;39(10):2092–2102. doi:10.1097/HJH.0000000000002896
24. Santosh S, Chu C, Mwangi J, et al. Changes in pulmonary artery systolic pressure and right ventricular function in patients with end-stage renal disease on maintenance dialysis. Nephrology. 2019;24(1):74–80. doi:10.1111/nep.13183
25. Selem G, Stojceva-Taneva O, Tozija L, et al. Uric acid and left ventricular hypertrophy: another relationship in haemodialysis patients. Clin Kidney J. 2021;14(2):578–585. doi:10.1093/ckj/sfz172
26. Chiu T-H, Wu P-Y, Huang J-C, et al. Hyperuricemia is associated with left ventricular dysfunction and inappropriate left ventricular mass in chronic kidney disease. Diagnostics. 2020;10(8):514. doi:10.3390/diagnostics10080514
27. Luo Q, Xia X, Li B, Lin Z, Yu X, Huang F. Serum uric acid and cardiovascular mortality in chronic kidney disease: a meta-analysis. BMC Nephrol. 2019;20(1):18. doi:10.1186/s12882-018-1143-7
28. Dousdampanis P, Trigka K, Musso CG, Fourtounas C. Hyperuricemia and chronic kidney disease: an enigma yet to be solved. Ren Fail. 2014;36(9):1351–1359. doi:10.3109/0886022X.2014.947516
29. Murea M, Tucker BM. The physiology of uric acid and the impact of end-stage kidney disease and dialysis. Semin Dial. 2019;32(1):47–57. doi:10.1111/sdi.12735
30. Jia G, Habibi J, Bostick BP, et al. Uric acid promotes left ventricular diastolic dysfunction in mice fed a western diet. Hypertension. 2015;65(3):531–538. doi:10.1161/HYPERTENSIONAHA.114.04737
31. Rutherford E, Ireland S, Mangion K, et al. A randomized, controlled trial of the effect of allopurinol on left ventricular mass in haemodialysis patients. Kidney Int Rep. 2021;6(1):146–155. doi:10.1016/j.ekir.2020.10.025
32. Walter PB, Knutson MD, Paler-Martinez A, Lee S, Xu Y, Viteri FE. Iron deficiency and iron excess damage mitochondria and mitochondrial DNA in rats. Proc Natl Acad Sci USA. 2002;99(4):22649. doi:10.1073/pnas.261708798
33. Melenovsky V, Petrak J, Mracek T, et al. Myocardial iron content and mitochondrial function in human heart failure: a direct tissue analysis. Eur J Heart Fail. 2017;19(4):522–530. doi:10.1002/ejhf.640
34. Babitt JL, Eisenga MF, Haase VH, et al. Controversies in optimal anemia management: conclusions from a Kidney Disease: Improving Global Outcomes (KDIGO) conference. Kidney Int. 2021;99(6):1280–1295. doi:10.1016/j.kint.2021.03.020
35. Macdougall IC, White C, Anker SD, et al. Intravenous iron in patients undergoing maintenance haemodialysis. N Engl J Med. 2019;380(5):447–458. doi:10.1056/NEJMoa1810742
36. Shah NR, Dumler F. Hypoalbuminaemia – a marker of cardiovascular disease in patients with chronic kidney disease stages II-IV. Int J Med Sci. 2008;5(6):366–370. doi:10.7150/ijms.5.366
37. Foley RN, Parfrey PS, Harnett JD, Kent GM, Murray DC, Barre PE. Hypoalbuminemia, cardiac morbidity, and mortality in end-stage renal disease. J Am Soc Nephrol. 1996;7:728–736. doi:10.1681/ASN.V75728
38. Prenner SB, Pillutla R, Yenigalla S, et al. Serum albumin is a marker of myocardial fibrosis, adverse pulsatile hemodynamics, and prognosis in heart failure with preserved ejection fraction. J Am Heart Assoc. 2020;9(3):e014716. doi:10.1161/JAHA.119.014716
39. Gambardella J, De Rosa M, Sorriento D, et al. Parathyroid hormone causes endothelial dysfunction by inducing mitochondrial ROS and specific oxidative signal transduction modifications. Oxid Med Cell Longev. 2018;2018:9582319. doi:10.1155/2018/9582319
 © 2022 The Author(s). This work is published and licensed by Dove Medical Press Limited. The full terms of this license are available at https://www.dovepress.com/terms.php and incorporate the Creative Commons Attribution - Non Commercial (unported, v3.0) License.
By accessing the work you hereby accept the Terms. Non-commercial uses of the work are permitted without any further permission from Dove Medical Press Limited, provided the work is properly attributed. For permission for commercial use of this work, please see paragraphs 4.2 and 5 of our Terms.
© 2022 The Author(s). This work is published and licensed by Dove Medical Press Limited. The full terms of this license are available at https://www.dovepress.com/terms.php and incorporate the Creative Commons Attribution - Non Commercial (unported, v3.0) License.
By accessing the work you hereby accept the Terms. Non-commercial uses of the work are permitted without any further permission from Dove Medical Press Limited, provided the work is properly attributed. For permission for commercial use of this work, please see paragraphs 4.2 and 5 of our Terms.