")
Back to Journals » International Journal of General Medicine » Volume 17
Trabecular Bone Score Improves Fracture Risk Discrimination in Postmenopausal Rheumatoid Arthritis Patients Receiving Glucocorticoids
Authors Ruangnopparut R, Charoensri S , Sribenjalak D, Theerakulpisut D , Pongchaiyakul C
Received 16 November 2023
Accepted for publication 11 January 2024
Published 26 January 2024 Volume 2024:17 Pages 287—295
DOI https://doi.org/10.2147/IJGM.S448659
Checked for plagiarism Yes
Review by Single anonymous peer review
Peer reviewer comments 2
Editor who approved publication: Dr Scott Fraser
Ratthanin Ruangnopparut,1 Suranut Charoensri,2 Dueanchonnee Sribenjalak,2 Daris Theerakulpisut,3 Chatlert Pongchaiyakul2
1Department of Medicine, Faculty of Medicine, Khon Kaen University, Khon Kaen, Thailand; 2Division of Endocrinology and Metabolism, Department of Medicine, Faculty of Medicine, Khon Kaen University, Khon Kaen, Thailand; 3Division of Nuclear Medicine, Department of Radiology, Faculty of Medicine, Khon Kaen University, Khon Kaen, Thailand
Correspondence: Suranut Charoensri, Division of Endocrinology and Metabolism, Department of Medicine, Faculty of Medicine, Khon Kaen University, Khon Kaen, 40002, Thailand, Email [email protected]
Background: Bone mineral density (BMD) might not be a sensitive tool for predicting osteoporotic fracture risk among patients with rheumatoid arthritis (RA), especially when receiving glucocorticoids. Trabecular bone score (TBS), which has emerged as a new assessment technique representing bone microarchitecture and strength, may be considered an alternative approach.
Materials and Methods: In this cross-sectional analytical study, postmenopausal RA patients receiving glucocorticoids were identified from the postmenopause BMD database. The database included clinical data of postmenopausal outpatients who had at least one BMD measurement between January 2014 and December 2017. TBS was calculated from lumbar spine BMD with the microarchitecture assessment software. The presence of osteoporotic fractures, either vertebral or non-vertebral, was identified at the time of BMD measurement.
Results: A total of 64 postmenopausal RA patients receiving glucocorticoids were included. The TBS values were inversely associated with osteoporotic fractures, with a TBS cut-off of less than 1.24, showing the best accuracy with a sensitivity of 79% and a specificity of 84% in discriminating fractures. This newly proposed TBS threshold combined with a BMD T-score of − 2.5 or less demonstrated a greater area under receiver operating characteristic curve in identifying patients with osteoporotic fractures than the BMD threshold alone (p value = 0.003).
Conclusion: The reduction in TBS was associated with an osteoporotic fracture in postmenopausal RA patients receiving glucocorticoids. Combining TBS and BMD in these patients incrementally improves fracture risk discrimination and may serve as a supplementary tool in identifying patients at greatest risk of osteoporotic fracture.
Keywords: bone mineral density, trabecular bone score, osteoporotic fractures, rheumatoid arthritis, glucocorticoids
Introduction
Osteoporosis is an important problem in the elderly, particularly among postmenopausal women. It is characterized by the deterioration of bone mass and microarchitecture, which subsequently elevates the risk of osteoporotic fractures and associated complications.1,2 Rheumatoid arthritis (RA) is one of the major risk factors of osteoporosis due to chronic inflammation, limitation of mobility, and concomitant glucocorticoid treatment. Patients with RA are more susceptible to developing skeletal consequences, including osteoporotic fracture, than those without RA.3,4
Bone mineral density (BMD), measured by dual-energy X-ray absorptiometry (DXA), serves as a diagnostic tool for osteoporosis.5 However, some patients exhibit increased fracture risk despite having normal BMD,6 especially in those receiving chronic glucocorticoid therapy.7 The rapid onset of bone loss and increased fragility fracture is observed when glucocorticoid therapy is initiated, and these risks escalate with higher doses and longer durations of treatment.8,9 It is important to note that glucocorticoids have an impact on fracture risk that is independent of BMD.10 Therefore, relying solely on BMD measurements is not the most effective way to predict fracture risk in glucocorticoid-induced osteoporosis.
In recent years, advancements in bone strength assessment have led to the introduction of a new software tool called trabecular bone score (TBS) for evaluating bone microarchitecture.11–13 TBS measures texture variations in DXA images and can be computed automatically from BMD measurements using specialized software installed on DXA machines. Previous studies have demonstrated a strong correlation between TBS and the incidence of osteoporotic fractures in various conditions, such as diabetes mellitus, chronic kidney disease, primary hyperparathyroidism, Cushing’s syndrome, and ankylosing spondylitis.14–19 Moreover, previous research suggests that patients with rheumatoid arthritis (RA) exhibit lower TBS values and an elevated risk of vertebral fractures,20 and consistent evidence has indicated that TBS outperforms lumbar spine BMD in identifying the presence of vertebral fractures in RA patients.21–23 TBS has also shown superior discriminatory ability compared to BMD when assessing fracture risk in patients with glucocorticoid-induced osteoporosis.24 However, the use of TBS in postmenopausal RA patients currently receiving chronic glucocorticoid treatment has not been thoroughly evaluated. Additionally, existing studies have predominantly focused on the relationship between TBS and vertebral fractures, with limited inclusion of non-vertebral fractures as an outcome measure. Therefore, our study aims to assess the performance of TBS in distinguishing osteoporotic fractures (both vertebral and non-vertebral) in postmenopausal RA patients currently on chronic glucocorticoid therapy. We also evaluate the correlation between TBS and BMD, as well as the added value of TBS in identifying individuals at high risk of osteoporotic fractures.
Materials and Methods
This study was a cross-sectional analytical study. We collected the data from the postmenopause BMD database in a tertiary care center in Khon Kaen province of northeastern Thailand. The database contained clinical data of postmenopausal outpatients who had at least one BMD measurement between January 2014 and December 2017. We retrospectively reviewed the database and identified RA patients who met the two following criteria: 1) a confirmed diagnosis of RA based on the classification criteria of the American College of Rheumatology/European League Against Rheumatism (ACR/EULAR),25 and 2) currently receiving glucocorticoid treatment at a dose of 5 mg or higher of prednisolone-equivalent for at least three months prior to the date of BMD measurement. The baseline data consisted of age, body mass index (BMI), previous treatment of RA, and duration of RA, defined as the time elapsed between the onset of first RA-related symptoms and the date of BMD measurement. Alcohol consumption was defined as taking 30 grams or more units of alcohol daily. BMD data in all patients were obtained using a Lunar Prodigy densitometer (GE Healthcare, Madison, WI, USA). The data of BMD included the value of the lumbar spine, femoral neck, total hip BMD, and the T-scores. T-scores were analyzed using Asian population reference databases provided by the device manufacturer. BMD T-score ≤ −2.5 at any sites among the lumbar spine, femoral neck, or total hip was used to diagnose osteoporosis. TBS values were derived from the corresponding lumbar spine BMD using the iNsight software (Med-Imaps, Pessac, France). Both lumbar spine BMD and TBS in patients with a history of previous vertebral fractures were evaluated from two or more vertebrae with the exclusion of the fractured vertebrae. The femoral neck BMD was evaluated from the contralateral hip without fracture in patients with prior hip fractures. For the outcome measurement, patients were categorized as having prevalent osteoporotic fractures if they met either of the following criteria: 1) an event of symptomatic osteoporotic fracture from low-energy trauma that occurred prior to the BMD measurement, or 2) a prevalent asymptomatic morphometric vertebral fracture identified by vertebral fracture assessment (VFA) at the time of BMD measurement. The fracture sites defined as osteoporotic fractures included the thoracic spine, lumbar spine, distal radius, and proximal humerus. This study was designed by the authors and approved by the Human Research Ethics Committee of Khon Kaen University per the Helsinki Declaration and the Good Clinical Practice Guidelines (HE641615). Since this study was performed by reviewing medical records and data from the hospital database system, a waiver/exemption on informed consent was obtained from the Human Research Ethics Committee of Khon Kaen University. Patient data confidentiality has been maintained through the anonymization of all identifiable patient information throughout the analysis and dissemination of the data.
Statistical Analyses
Student’s t-test, Mann–Whitney U-test, Chi-square, and Fisher’s exact test were used to describe the difference of parameters between patients with fracture and without fracture when appropriate. Spearman correlation based on Fisher’s transformation was performed to analyze the correlation between BMD and TBS. Logistic regression analysis was used to calculate the odds ratio (OR) of BMD and TBS on fracture prevalence. We defined significance as a two-tailed p value < 0.05. To determine the optimal threshold for fracture discrimination, we utilized the receiver operating characteristic (ROC) curve and calculated the Youden index. These analyses allowed us to identify the cut-off point that provided the best balance between sensitivity and specificity for discriminating individuals with fractures from those without fractures. Data analysis was performed using R software version 4.1.2 (Foundation for Statistical Computing, Vienna, Austria).
Results
From 1372 women in the postmenopausal BMD database at our institution during the study period, we identified a total of 64 postmenopausal RA patients undergoing chronic glucocorticoid treatment at the time of BMD measurement. The mean age was 61.7 ± 9.3 years. Prevalent osteoporotic fractures were found in 14 patients (21.9%). Five of them (35.7%) had symptomatic osteoporotic fractures prior to BMD measurement; all were non-vertebral fractures (3 proximal femurs, one distal radius, and one proximal humerus). The other nine patients (64.3%) had asymptomatic morphometric vertebral fractures detected by VFA at the date of BMD measurement. Baseline characteristics, including age, BMI, alcohol consumption, smoking status, duration of RA, and glucocorticoid regimens, were similar between fracture and non-fracture groups. Patients with osteoporotic fractures had significantly lower lumbar spine BMD, femoral neck BMD, and total hip BMD than the non-fractures. TBS and TBS T-scores were also significantly lower in patients with fractures than those without fractures (Table 1).
 |
Table 1 Baseline Characteristics, BMD, and TBS of Postmenopausal Rheumatoid Arthritis Patients Receiving Glucocorticoids with and without Osteoporotic Fracture |
The Spearman correlation analysis found that TBS had a positive correlation with the lumbar spine, femoral neck, and total hip BMD, with r = 0.527 (95% confidence interval [CI] 0.321–0.685, p value < 0.001), 0.539 (95% CI 0.338–0.693, p value < 0.001), and 0.536 (95% CI 0.331–0.687, p value < 0.001), respectively. Logistic regression analysis revealed that lower BMD in all three sites and lower TBS significantly increased osteoporotic fracture risk, which remained significant after adjusting for age and BMI (Table 2). The area under the ROC curve (AUROC) in discriminating osteoporotic fractures after adjusting for age and BMI were 0.78, 0.74, 0.82, and 0.81 for TBS, lumbar spine BMD, femoral neck BMD, and total hip BMD, respectively. There was no statistically significant difference after adjustment between AUROC TBS vs AUROC lumbar spine BMD (p value = 0.56), AUROC TBS vs AUROC femoral neck BMD (p value = 0.59), or AUROC TBS vs AUROC total hip BMD (p value = 0.63). (Figure 1) The optimal threshold of TBS for osteoporotic fracture discrimination was identified by the Youden index. The TBS threshold <1.24 showed the discriminative ability to reach the best sensitivity (79%) and specificity (84%) in identifying prevalent osteoporotic fractures.
 |
Table 2 Logistic Regression Analysis of BMD and TBS Reduction and the Prevalent Osteoporotic Fracture |
 |
Figure 1 Receiver operating characteristic (ROC) curve in predicting osteoporotic fracture when using TBS (red line), lumbar spine BMD (blue dashed line), femoral neck BMD (green dotted line), and total Hip BMD (purple dashed line). There was no statistically significant difference between each parameter. |
According to the newly proposed TBS threshold, using this new TBS cut-off <1.24 or the standard BMD threshold for osteoporosis diagnosis (BMD T-score ≤ −2.5 at any measured site) increased the sensitivity of fracture discrimination from 79% to 86%. On the other hand, applying a TBS cut-off <1.24 in combination with a BMD T-score ≤ −2.5 increased the specificity of fracture discrimination from 62% to 90%, with the greatest accuracy of 86% in identifying osteoporotic fractures (Table 3). The AUROC of combining the proposed TBS threshold with the standard BMD threshold is significantly better than using the BMD threshold alone (p value = 0.003) (Figure 2).
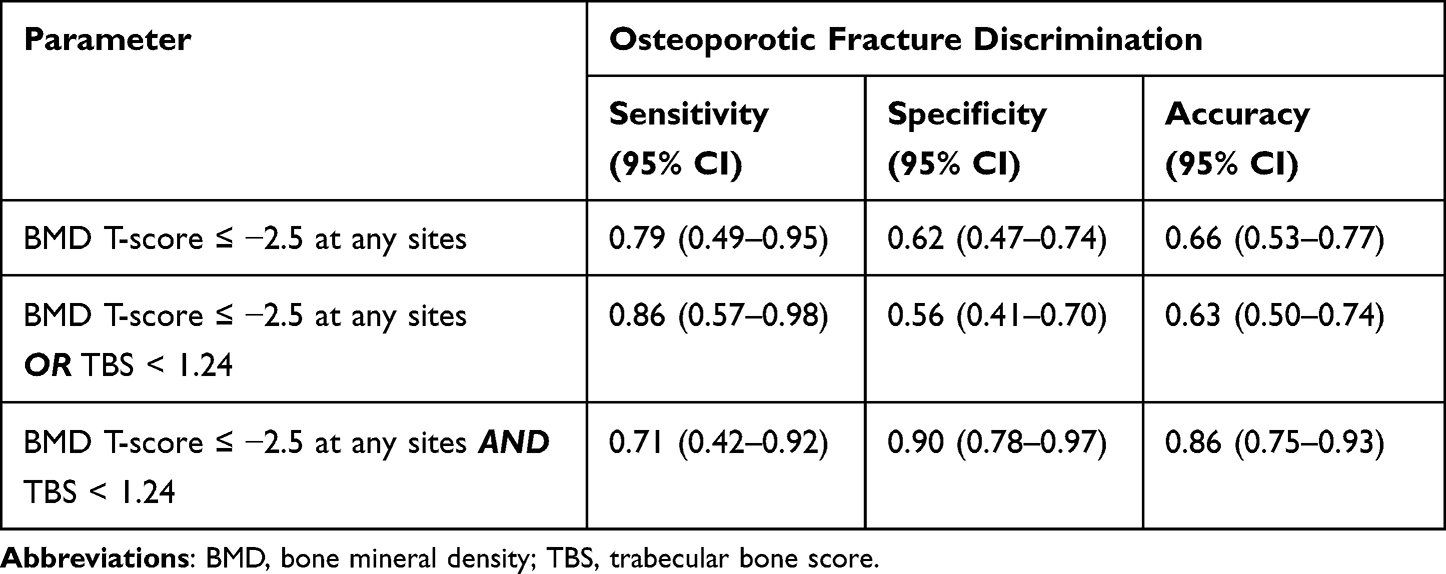 |
Table 3 The Accuracy of Using a BMD T-Score ≤ −2.5 Alone, BMD T-Score ≤ −2.5 or TBS < 1.24, and BMD T-Score ≤ −2.5 Combined with TBS Threshold <1.24 in Osteoporosis Fracture Discrimination |
 |
Figure 2 Receiver operating characteristic (ROC) curve in discriminating osteoporotic fracture between using BMD T-score threshold ≤ −2.5 alone (grey dotted line), BMD T-score threshold ≤ −2.5 alone or the proposed TBS of < 1.24 (blue dashed line), and combining BMD T-score threshold of ≤ −2.5 and the proposed TBS of < 1.24 (red line). The area under ROC of combining the BMD threshold and the proposed TBS threshold is significantly better than the BMD threshold alone (p value = 0.003). |
Discussion
The current study is the first study in Thailand to assess the role of TBS in osteoporotic fracture discrimination among postmenopausal RA who received glucocorticoids. We found that lower TBS increased the risk of overall osteoporotic fractures, including both vertebral and non-vertebral fractures. The TBS threshold <1.24 was proposed as a cut-off according to the greatest discriminative ability in the detection of prevalent osteoporotic fractures. In addition, combining this proposed TBS threshold with the standard BMD T-score ≤ −2.5 help increase the accuracy in discriminating osteoporotic fractures among postmenopausal RA patients receiving glucocorticoids.
Osteoporosis is common among patients with RA.26 The risk of osteoporotic fractures in RA patients is significantly higher when compared to the general population, both from the chronic inflammatory nature of the disease itself and the use of glucocorticoid treatment.26 A recent meta-analysis reported that osteoporosis affected nearly one-third (27.6%) of RA patients,27 and another meta-analysis of 13 studies showed a significantly higher risk of skeletal complications in patients with RA with a higher frequency of vertebral and hip fractures.28 Our result confirms these findings, with 46.9% (30/64) of postmenopausal RA patients on glucocorticoids having a BMD T-score ≤ −2.5 and 21.9% (14/64) having at least one vertebral or non-vertebral osteoporotic fracture. Importantly, our study included only postmenopausal women and patients who received glucocorticoids. The combined effects of estrogen deficiency after menopause and the pathological consequences of RA itself and glucocorticoid therapy likely contributed synergistically to progressive bone loss and an increased risk of osteoporotic fractures.29 This could explain, at least in part, the higher rates of osteoporosis observed in our population compared to other RA studies.
Although BMD measurement using the DXA machine is a valuable tool to evaluate fracture risk in patients with RA, the limitation of BMD in assessing bone microarchitecture alterations may underestimate the actual fracture probability. Therefore, TBS, which can evaluate bone quality and microstructure, could theoretically be an excellent supplementary tool for discriminating fracture risk among RA patients in clinical practice. A previous report in Egypt found that TBS was inversely correlated with FRAX score, implying that lower TBS could be an important marker in predicting fractures.30 A study of postmenopausal RA women in South Korea showed a significantly lower TBS in women with vertebral fractures compared to those without, and TBS predicted prevalent vertebral fractures in an adjusted model.21 In our study, we also demonstrated that TBS and all three sites of BMD (lumbar spine, femoral neck, and total hip) were associated with the presence of osteoporotic fracture in postmenopausal RA patients receiving glucocorticoids. However, a low femoral neck BMD was, in this matter, a better predictor than both lumbar spine BMD and TBS, which was consistent with the data obtained in the general population without RA indicating that bone density at the femoral neck may be better than lumbar spine assessment in determining overall osteoporotic fracture risk.31 These findings partially reflect the confounding effect of degenerative artifacts on spine measurements, which attenuates fracture discrimination accuracy.32,33 Nevertheless, not all lumbar spine assessments are the same. TBS in the current study showed greater odds of prevalent osteoporotic fracture compared to lumbar spine BMD after being adjusted for age and BMI, suggesting that TBS could add benefit in fracture risk assessment among postmenopausal RA patients receiving glucocorticoids.
In light of the TBS performance assessment using AUROC, there was no significant difference in AUROC between TBS and all sites of BMD measurement among postmenopausal RA patients receiving glucocorticoids in our study (Figure 1). This finding conflicts with the previous cross-sectional studies of RA patients in France and South Korea, which reported better AUROC for prevalent vertebral fracture prediction with TBS than lumbar spine BMD.22,23 We believe that the disagreement might arise from variations in the population studied and how the outcomes were defined. Previous studies included only 50–60% of RA patients using glucocorticoids and primarily focused on vertebral fractures as an outcome. In contrast, our study examined both vertebral and non-vertebral fractures. It is important to note that the exclusive focus on patients receiving glucocorticoid treatment in our study could have influenced the results since glucocorticoids are known to have negative impacts on both vertebral and hip fractures.9
Although the discriminative value of TBS assessed by AUROC was similar to BMD in our study, we showed the supplementary value of TBS when added to BMD measurement in classifying patients at risk of fractures. We proposed the TBS threshold <1.24 with the most excellent accuracy in identifying osteoporotic fracture in our population. This cut-off is similar to the threshold of 1.23 proposed by McCloskey et al in discriminating individuals at high risk of fracture in general population.34 Adding this proposed TBS threshold <1.24 to the BMD threshold helps increase the sensitivity of fracture detection from 79% to 86%, which implies that we would be able to recognize more patients at high risk of fractures who were misidentified by BMD. On the other hand, in patients already diagnosed with osteoporosis by BMD, combining the proposed TBS threshold increased the specificity of having fractures from 62% to 90%. The AUROC of combining the proposed TBS and BMD threshold is significantly better than using BMD alone, highlighting the added value of TBS in identifying postmenopausal RA patients who received glucocorticoids with the greatest osteoporotic fracture risk.
This is the first study demonstrating the correlation between TBS and osteoporotic fracture of postmenopausal RA patients in Thailand. Also, we proposed the cut-off or threshold of TBS < 1.24 that best discriminates osteoporotic fracture risk. However, it is important to acknowledge that our study had several significant limitations. Firstly, the sample size and the number of fracture events were relatively small, which may have limited the statistical power and generalizability of our findings. It is important to note that our study is based on a retrospective review of the existing postmenopausal BMD database. Importantly, there is a notable under-evaluation of BMD in RA patients in Thailand, which could lead to a limited inclusion of RA patients in our database. Furthermore, our focus includes postmenopausal RA patients currently undergoing glucocorticoid therapy only, contributing to a more restricted sample size. Secondly, the absence of information on RA severity and the use of anti-resorptive agents could potentially introduce confounding and affect the reliability of our results. Lastly, we lacked the data on FRAX score, a widely used tool for assessing fracture risk, which could have provided a more comprehensive and accurate evaluation of fracture. Future prospective studies with larger sample sizes are needed to demonstrate the superiority of TBS to BMD in future osteoporotic fracture prediction among postmenopausal RA patients, especially those on chronic glucocorticoid treatment.
Conclusions
The lower TBS increased the risk of osteoporotic fracture in postmenopausal RA patients who received glucocorticoids, with a TBS threshold <1.24 demonstrating the best accuracy in discriminating osteoporotic fracture. Combining TBS and BMD incrementally improves osteoporotic fracture risk discrimination in postmenopausal RA patients receiving glucocorticoids. TBS should be considered as a supplementary tool to BMD in identifying patients at greatest risk of osteoporotic fracture.
Disclosure
The authors report no conflicts of interest in this work.
References
1. Cosman F, de Beur SJ, LeBoff MS, et al. Clinician’s Guide to Prevention and Treatment of Osteoporosis. Osteoporos Int. 2014;25(10):2359–2381. doi:10.1007/s00198-014-2794-2
2. Harvey N, Dennison E, Cooper C. Osteoporosis: impact on health and economics. Nat Rev Rheumatol. 2010;6(2):99–105. doi:10.1038/nrrheum.2009.260
3. Smolen JS, Aletaha D, McInnes IB. Rheumatoid arthritis. Lancet. 2016;388(10055):2023–2038. doi:10.1016/S0140-6736(16)30173-8
4. Heinlen L, Humphrey MB. Skeletal complications of rheumatoid arthritis. Osteoporos Int. 2017;28(10):2801–2812. doi:10.1007/s00198-017-4170-5
5. Jain RK, Vokes T. Dual-energy X-ray Absorptiometry. J Clin Densitom. 2017;20(3):291–303. doi:10.1016/j.jocd.2017.06.014
6. Lespessailles E, Cortet B, Legrand E, Guggenbuhl P, Roux C. Low-trauma fractures without osteoporosis. Osteoporos Int. 2017;28(6):1771–1778. doi:10.1007/s00198-017-3921-7
7. Chotiyarnwong P, McCloskey EV. Pathogenesis of glucocorticoid-induced osteoporosis and options for treatment. Nat Rev Endocrinol. 2020;16(8):437–447. doi:10.1038/s41574-020-0341-0
8. van Staa TP, Leufkens HG, Abenhaim L, Begaud B, Zhang B, Cooper C. Use of oral corticosteroids in the United Kingdom. QJM. 2000;93(2):105–111. doi:10.1093/qjmed/93.2.105
9. van Staa TP, Leufkens HGM, Cooper C. The epidemiology of corticosteroid-induced osteoporosis: a meta-analysis. Osteoporos Int. 2002;13(10):777–787. doi:10.1007/s001980200108
10. Kanis JA, Johansson H, Oden A, et al. A meta-analysis of prior corticosteroid use and fracture risk. J Bone Miner Res. 2004;19(6):893–899. doi:10.1359/JBMR.040134
11. Martineau P, Silva BC, Leslie WD. Utility of trabecular bone score in the evaluation of osteoporosis. Curr Opin Endocrinol Diabetes Obes. 2017;24(6):402–410. doi:10.1097/MED.0000000000000365
12. Martineau P, Leslie WD. Trabecular bone score (TBS): method and applications. Bone. 2017;104:66–72. doi:10.1016/j.bone.2017.01.035
13. Silva BC, Leslie WD, Resch H, et al. Trabecular bone score: a noninvasive analytical method based upon the DXA image. J Bone Miner Res. 2014;29(3):518–530. doi:10.1002/jbmr.2176
14. Leslie WD, Aubry-Rozier B, Lamy O, Hans D. Manitoba Bone Density Program. TBS (trabecular bone score) and diabetes-related fracture risk. J Clin Endocrinol Metab. 2013;98(2):602–609. doi:10.1210/jc.2012-3118
15. Yavropoulou MP, Vaios V, Pikilidou M, et al. Bone Quality Assessment as Measured by Trabecular Bone Score in Patients With End-Stage Renal Disease on Dialysis. J Clin Densitom. 2017;20(4):490–497. doi:10.1016/j.jocd.2016.11.002
16. Brunerová L, Ronová P, Verešová J, et al. Osteoporosis and Impaired Trabecular Bone Score in Hemodialysis Patients. Kidney Blood Press Res. 2016;41(3):345–354. doi:10.1159/000443439
17. Silva BC, Boutroy S, Zhang C, et al. Trabecular bone score (TBS)--a novel method to evaluate bone microarchitectural texture in patients with primary hyperparathyroidism. J Clin Endocrinol Metab. 2013;98(5):1963–1970. doi:10.1210/jc.2012-4255
18. Belaya ZE, Hans D, Rozhinskaya LY, et al. The risk factors for fractures and trabecular bone-score value in patients with endogenous Cushing’s syndrome. Arch Osteoporos. 2015;10:44. doi:10.1007/s11657-015-0244-1
19. Kang KY, Kim IJ, Park SH, Hong YS. Associations between trabecular bone score and vertebral fractures in patients with axial spondyloarthritis. Rheumatology. 2018;57(6):1033–1040. doi:10.1093/rheumatology/key027
20. Richards C, Leslie WD. Trabecular Bone Score in Rheumatic Disease. Curr Rheumatol Rep. 2022;24(4):81–87. doi:10.1007/s11926-022-01062-w
21. Choi YJ, Chung YS, Suh CH, Jung JY, Kim HA. Trabecular bone score as a supplementary tool for the discrimination of osteoporotic fractures in postmenopausal women with rheumatoid arthritis. Medicine. 2017;96(45):e8661. doi:10.1097/MD.0000000000008661
22. Kim D, Cho SK, Kim JY, Choi YY, Sung YK. Association between trabecular bone score and risk factors for fractures in Korean female patients with rheumatoid arthritis. Mod Rheumatol. 2016;26(4):540–545. doi:10.3109/14397595.2015.1101212
23. Bréban S, Briot K, Kolta S, et al. Identification of rheumatoid arthritis patients with vertebral fractures using bone mineral density and trabecular bone score. J Clin Densitom. 2012;15(3):260–266. doi:10.1016/j.jocd.2012.01.007
24. Florez H, Hernández-Rodríguez J, Muxi A, et al. Trabecular bone score improves fracture risk assessment in glucocorticoid-induced osteoporosis. Rheumatology. 2020;59(7):1574–1580. doi:10.1093/rheumatology/kez464
25. Aletaha D, Neogi T, Silman AJ, et al. 2010 Rheumatoid arthritis classification criteria: an American College of Rheumatology/European League Against Rheumatism collaborative initiative. Arthritis Rheum. 2010;62(9):2569–2581. doi:10.1002/art.27584
26. van Staa TP, Geusens P, Bijlsma JWJ, Leufkens HGM, Cooper C. Clinical assessment of the long-term risk of fracture in patients with rheumatoid arthritis. Arthritis Rheum. 2006;54(10):3104–3112. doi:10.1002/art.22117
27. Moshayedi S, Tasorian B, Almasi-Hashiani A. The prevalence of osteoporosis in rheumatoid arthritis patient: a systematic review and meta-analysis. Sci Rep. 2022;12(1):15844. doi:10.1038/s41598-022-20016-x
28. Xue AL, Wu SY, Jiang L, Feng AM, Guo HF, Zhao P. Bone fracture risk in patients with rheumatoid arthritis: a meta-analysis. Medicine. 2017;96(36):e6983. doi:10.1097/MD.0000000000006983
29. Weitzmann MN, Pacifici R. Estrogen deficiency and bone loss: an inflammatory tale. J Clin Invest. 2006;116(5):1186–1194. doi:10.1172/JCI28550
30. Senosi MR, Fathi HM, Baki NMA, Zaki O, Magdy AM, Gheita TA. Bone mineral density, vitamin D receptor (VDR) gene polymorphisms, fracture risk assessment (FRAX), and trabecular bone score (TBS) in rheumatoid arthritis patients: connecting pieces of the puzzle. Clin Rheumatol. 2022;41(5):1333–1342. doi:10.1007/s10067-022-06048-8
31. Leslie WD, Tsang JF, Caetano PA, Lix LM. Manitoba Bone Density Program. Effectiveness of bone density measurement for predicting osteoporotic fractures in clinical practice. J Clin Endocrinol Metab. 2007;92(1):77–81. doi:10.1210/jc.2006-1415
32. Liu G, Peacock M, Eilam O, Dorulla G, Braunstein E, Johnston CC. Effect of osteoarthritis in the lumbar spine and Hip on bone mineral density and diagnosis of osteoporosis in elderly men and women. Osteoporos Int. 1997;7(6):564–569. doi:10.1007/BF02652563
33. O’Gradaigh D, Debiram I, Love S, Richards HK, Compston JE. A prospective study of discordance in diagnosis of osteoporosis using spine and proximal femur bone densitometry. Osteoporos Int. 2003;14(1):13–18. doi:10.1007/s00198-002-1311-1
34. McCloskey EV, Odén A, Harvey NC, et al. A Meta-Analysis of Trabecular Bone Score in Fracture Risk Prediction and Its Relationship to FRAX. J Bone Miner Res. 2016;31(5):940–948. doi:10.1002/jbmr.2734
 © 2024 The Author(s). This work is published and licensed by Dove Medical Press Limited. The full terms of this license are available at https://www.dovepress.com/terms.php and incorporate the Creative Commons Attribution - Non Commercial (unported, v3.0) License.
By accessing the work you hereby accept the Terms. Non-commercial uses of the work are permitted without any further permission from Dove Medical Press Limited, provided the work is properly attributed. For permission for commercial use of this work, please see paragraphs 4.2 and 5 of our Terms.
© 2024 The Author(s). This work is published and licensed by Dove Medical Press Limited. The full terms of this license are available at https://www.dovepress.com/terms.php and incorporate the Creative Commons Attribution - Non Commercial (unported, v3.0) License.
By accessing the work you hereby accept the Terms. Non-commercial uses of the work are permitted without any further permission from Dove Medical Press Limited, provided the work is properly attributed. For permission for commercial use of this work, please see paragraphs 4.2 and 5 of our Terms.