")
Back to Journals » Journal of Inflammation Research » Volume 17
The Prognostic Value and Potential Immune Mechanisms of lncRNAs Related to Immunogenic Cell Death in Papillary Thyroid Carcinoma
Authors Wang Y, Li X, Huang Y, Gang Q, Liu M, Zhang H, Shen S, Qi Y, Zhang J
Received 23 December 2023
Accepted for publication 26 March 2024
Published 29 March 2024 Volume 2024:17 Pages 1995—2008
DOI https://doi.org/10.2147/JIR.S456452
Checked for plagiarism Yes
Review by Single anonymous peer review
Peer reviewer comments 2
Editor who approved publication: Dr Tara Strutt
Yixian Wang,1,* Xin Li,2,* Yinde Huang,3,* Qingwei Gang,1 Mingyu Liu,1 Han Zhang,1 Shikai Shen,1 Yao Qi,1 Jian Zhang1
1Department of Vascular and Thyroid Surgery, The First Hospital, China Medical University, Shenyang, Liaoning, 110001, People’s Republic of China; 2Department of Head and Neck Surgery, Liaoning Cancer Hospital & Institute, Shenyang, Liaoning, 110042, People’s Republic of China; 3Department of Breast and Thyroid Surgery, Chongqing General Hospital, Chongqing, 401147, People’s Republic of China
*These authors contributed equally to this work
Correspondence: Jian Zhang, Email [email protected]
Background: Long non-coding RNAs (lncRNAs) associated with immunogenic cell death (ICD) play a pivotal role in tumorigenesis and offer prognostic insights for papillary thyroid carcinoma (PTC) patients. This study delves into the impact of ICD-related lncRNAs on the prognosis of PTC.
Methods: PTC samples were accessed from The Cancer Genome Atlas-Thyroid carcinoma database (TCGA-THCA) and consensus cluster analysis to elucidate the influence of ICD-related lncRNA expression. To gauge the prognostic significance of these lncRNAs, we developed a prognostic model. Additionally, we conducted GO and KEGG enrichment analyses, assessed immune cell infiltration (ICI) using CIBERSORT and ssGSEA, examined immune checkpoint expression, tumor mutation burden (TMB), tumor microenvironment (TME), T-cell dysfunction and exclusion (TIDE), TCIA, and drug sensitivity across various groups. A comprehensive suite of in vitro experiments, encompassing EdU labeling, wound scratch assays, Transwell assays, and flow cytometry, were conducted to elucidate the regulatory role of LINC00924 in two PTC cell lines, BCPAP and TPC1, transfected with LINC00924 overexpression plasmids.
Results: Two distinct clusters demonstrated varying TME, BRAF, NRAS, and ICI characteristics, suggesting potential immune mechanisms in PTC. Our prognostic model identified seven lncRNAs: SRRM2-AS1, AC008556.1, BHLHE40-AS1, EGOT, AL39066.1, LINC00924, and PICART1. The expression of ICD-related lncRNAs correlated with progression-free interval (PFI) in PTC patients. Overexpression of LINC00924 significantly reduced cell proliferation, migration, and invasion, while augmenting apoptosis in PTC cells.
Conclusion: Our findings highlight the potential of ICD-related lncRNAs as prognostic biomarkers for PFI in PTC. In vitro experiments suggest a protective role of LINC00924 in PTC progression.
Keywords: immunogenic cell death, LncRNA, papillary thyroid carcinoma, prognosis
Introduction
The prevalence of thyroid cancer (TC), the most common endocrine malignancy, has shown a significant increase in incidence worldwide in recent decades. In 2020, it ranked ninth in cancer incidence in the United States.1,2 Papillary thyroid carcinoma (PTC),3 despite its relatively favorable prognosis, advanced-stage PTC continues to exhibit an escalating mortality rate.4 Postoperative recurrence or distant metastasis poses substantial threats to overall patient survival.2 Consequently, there is a pressing need for improved diagnostic criteria to identify individuals at risk of poor prognosis.
Immunogenic cell death (ICD) is characterized by an inflammatory response that activates adaptive immunity, fostering long-term immunological memory. This process enhances antigenicity, thereby aiding the immune system in clearing infected and tumor cells.5,6 ICD has emerged as a significant cell death subroutine.7 Dying cells release damage-associated molecular patterns (DAMPs), such as HMGB1, ATP, and Calreticulin, which serve as “eat me” signals, triggering ICD and initiating an inflammatory response.6,8 ICD is not limited to infected cells; it also occurs in tumor cells. Dying tumor cells release DAMPs, eliciting immune responses that support cytotoxic T lymphocytes in eliminating tumor cells.9 The induction of ICD in tumors has become a crucial aspect of immunotherapies.8
Long non-coding RNAs (LncRNAs), transcripts consisting of at least 200 nucleotides, are non-coding in nature.10 Research has unveiled their pivotal role in cellular function.11 LncRNAs are intricately linked to tumorigenesis, development, and growth.12,13 Furthermore, some LncRNAs are expressed at elevated levels in immune cells associated with immune cell infiltration.14 Certain lncRNAs have been demonstrated to enhance the immunology of tumor cells, promoting anti-tumor immunity among T cells. This effect reduces the number of tumor cells evading immune surveillance and offers novel avenues for tumor immunotherapy.15–17 However, the impact of ICD-related lncRNAs on the prognosis of PTC patients remains unexplored.
In this study, we primarily employed bioinformatics to investigate the influence of ICD-related lncRNAs on the prognosis of PTC patients (Figure 1). Utilizing consensus clustering, we compare the prognosis between groups with high and low expression of ICD-related lncRNAs, leveraging PTC transcriptome data from the publicly available TCGA-THCA database. TCGA-THCA data was further categorized into two groups to construct a prognostic model, and progression-free interval (PFI) was used as an outcome criterion to assess risk groups.18 Our analysis encompasses various factors, including the tumor microenvironment, immune microenvironment, immune checkpoints, and drug susceptibility, in pursuit of identifying potential immune mechanisms underlying PTC.
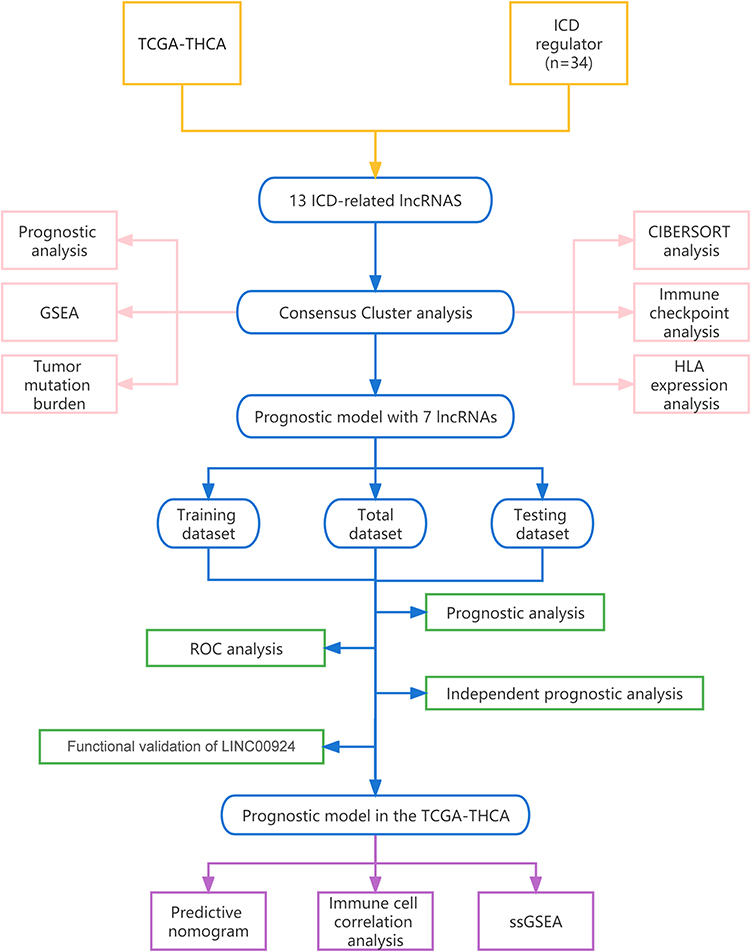 |
Figure 1 Work flow chart of the analysis. |
Materials and Methods
Data Collection
Analysis of cancer-related DNA, RNA, proteins, and epigenetic profiles was facilitated by the extensive resources available within the Cancer Genome Atlas (TCGA), which houses a wealth of data concerning human cancers.19 For this study, we sourced transcriptome profiling and single nucleotide variation data from TCGA, encompassing 512 papillary thyroid carcinoma (PTC) samples and 58 normal thyroid tissues. Clinical data from the TCGA-THCA dataset were acquired through the UCSC Xena browser. (https://xenabrowser.net; accessed 7 August 2022).20 Patients with inadequate follow-up data were disqualified.
Gene expression files and clinical data from the GEO dataset (GSE33630) were obtained from (https://www.ncbi.nlm.nih.gov/geo/query/acc.cgi?acc=GSE33630). The GSE33630 dataset comprises 49 PTC samples and 45 adjacent non-cancerous samples.
Identification of ICD-Related lncRNAs
We identified a total of 34 genes associated with ICD in thyroid cancer through an extensive literature review.21–26 Utilizing the “limma” package of R software (version: 4.2.1), we performed co-expression analysis of ICD-related genes and lncRNAs, employing criteria of a “|correlation coefficient| of ≥ 0.5” and “p-value of < 0.001”. Simultaneously, we constructed a co-expression network of expression data using the “igraph” R package.
Consensus Clustering Analysis
To explore the impact of ICD-related lncRNA on PTC, we applied consensus clustering analysis to the dataset obtained from TCGA-THCA for subgroup analysis. The 329 lncRNAs identified from the co-expression network underwent univariate Cox proportional hazards analysis using the “glmnet” package, yielding 13 regulatory factors for subsequent cluster analysis. We employed the ‘ggalluvial’ package to visualize the relationship between lncRNAs and ICD genes. Subsequently, we classified PTC patients into distinct groups based on these 13 lncRNAs using the ‘ConsensusClusterPlus’ package.
Subsequent Cluster Analysis
Using the “pheatmap” package, a heat map was created to visualize and more easily assess the expression of lncRNAs. Kaplan-Meier (KM) survival curves, constructed using the ‘survival’ package, were employed to compare PFI between high- and low-risk groups. We utilized “GSEA” software (version: 4.2.3) to analyze GO and KEGG enrichment analyses across different clusters. Simple nucleotide variation analysis was executed using the ‘maftools’ package to assess tumor mutation burden within the TCGA-THCA dataset. In addition, we employed ‘CIBERSORT’, a method for studying infiltrating immune cells in tumors, to investigate differences of tumor immune microenvironments in PTC clusters.27 Further investigation encompassed the examination of gene expression profiles related to immune checkpoints and human leucocyte antigen (HLA) associations.
Development of Prognostic Model
To identify differentially expressed lncRNAs between clusters, we conducted differential expression analysis employing the “limma” software with the criteria of “P 0.05 and |fold change| > 1”. Subsequently, the construction of the prognostic model involved a two-step process. Initially, target lncRNAs were identified, followed by the formulation of the model itself. This was accomplished through a combination of multivariate Cox analysis and LASSO regression analysis.28 Each sample was assigned a risk level based on the calculated risk score, with values exceeding the median risk score classified as high risk and those below as low risk. The dataset was then evenly split into training and testing groups, and the accuracy of the prognostic model was verified within these groups and the TCGA-THCA dataset.
Analysis of the Prognostic Model
To assess the predictive accuracy of the model, we employed receiver operating characteristic (ROC) analysis, with a larger area under the curve (AUC) indicating higher accuracy. We established distinct subgroups based on clinical characteristics, including age, gender, and the American Joint Committee on Cancer (AJCC) stage, to evaluate the model’s applicability. Additionally, we designed a nomogram using the “rms” package to provide a scoring system for thyroid cancer risk assessment. Furthermore, we assessed variations in immune cell infiltration and immunological function between high and low-risk groups using single sample gene set enrichment analysis (ssGSEA). We also tested 103 drugs for their therapeutic effects in high and low-risk groups, employing IC50 as an evaluation parameter with the “oncopredict” package.29 Additionally, immunotherapy results were obtained from TCIA (http://tcia.at/) and TIDE (http://tide.dfci.harvard.edu/).30,31
Cell Transfection
TPC1 and BCPAP cells purchased from Wuhan Pu-nuo-sai Life Technology Co. Ltd. (Wuhan, China), were cultured in 1640 medium supplemented with 10% fetal bovine serum until reaching approximately 70% confluency. A custom-designed LINC00924 overexpression plasmid was synthesized by Suzhou Jima Gene Co. Ltd. (Suzhou, China). Transfection of the LINC00924 overexpression plasmid into PTC cells was conducted using Lipo3000 liposomes (Invitrogen, Cat. No. L3000015, USA).
Quantitative Real-Time PCR
Total RNA extraction was carried out using the SevenFast Total RNA Extraction Kit (Cat. No. SM132, China). Quantitative real-time reverse transcription PCR (qRT-PCR) was performed using the Takara ExTaq PCR kit (Cat. No. 639,505, Japan) following the manufacturer’s instructions. PCR results were analyzed using QuantStudio™ Design & Analysis Software from Applied Biosystems. The following PCR primers were utilized: Forward primer for LINC00924: 5′-CCAGTATGCCAAGTGAACACA-3′; Reverse primer for LINC00924: 5′-ATGCACAGTGCTGAGTTGTTT-3′.
EdU Assay
Cell proliferation staining utilizing the EdU kit (ApexBio, Cat. No. K1075, USA) was conducted in this study. TPC1 and BCPAP cells (3 × 10⁴ cells/well) were seeded in 24-well plates and incubated at 37 °C overnight. Subsequently, 10μM EDU reagent was added, and the cells were incubated with EdU for 5 hours. Afterward, the cells were fixed with 4% paraformaldehyde for 15 minutes and permeabilized with 0.3% Triton X-100 for another 15 minutes. The cells were then incubated with the Click Reaction Mixture in a dark at room temperature for 30 minutes, followed by Hoechst 33,342 incubation for 15 minutes. Images were captured at 100× magnification using a fluorescence microscope, and cell counting was performed utilizing ImageJ software.
Wound Scratch Assay
To evaluate cell migration capability, we employed a scratch wound assay. TPC1 and BCPAP cells were cultured until they reached full confluence over a 2-day period. Subsequently, a single straight scratch was meticulously created across the cell monolayer using a pipette tip, followed by a media replacement. The wound was monitored and imaged at both the 0-hour and 24-hour time points using microscopy at 200× magnification in each well. We measured the mean width of the wound at these time points using ImageJ software, and cell migration was quantified by calculating the percentage of the wound closure area.
Transwell Assay
For the Transwell assay, we coated the upper chamber with matrix gel (diluted 10-fold with serum-free culture medium). TPC1 and BCPAP cells were adjusted to a concentration of approximately 90,000 cells/mL using a serum-free culture medium. The lower chamber was filled with medium containing 10% FBS, while the upper chamber received 300 μL of the cell suspension. Cells were incubated at 37°C with 5% CO2 for 24 hours to facilitate cell migration. Subsequently, each well was gently fixed with 700 μL of ice-cold methanol (−20°C) for 30 minutes at room temperature. Following fixation, we added 700 μL of crystal violet staining solution to each well and incubated it for an additional 30 minutes. Images were captured at a 200× magnification, and cell counting was performed using ImageJ software.
Cell Apoptosis Analysis
Flow cytometry analysis was conducted to assess cell apoptosis using the Cell Apoptosis Detection Kit (MultiSciences, Cat. No. AT105, China). TPC1 and BCPAP cells were resuspended in 1× Binding Buffer and subsequently treated with 5 μL of Annexin V-APC and 10μL of 7-AAD. The cells were then incubated at room temperature in the dark for 5 minutes. Flow cytometry analysis was performed using the FACS C6 flow cytometer.
Statistical Analysis
Student’s t–test and analysis of variance (ANOVA) were used to compare quantitative data. HR and Cox P-value were assessed by Univariate Cox regression method. Correlation analysis was conducted using Spearman correlation test. PFI was assessed using the Kaplan-Meier (KM) method and Log rank tests. Statistical significance was set at P-value <0.05. SPSS26.0 software was used for statistical analysis.
Results
Identification of Two Subtypes Based on ICD-Related lncRNAs via Consensus Clustering
We observed co-expression patterns among ICD-related genes and lncRNAs, leading to the identification of a total of 329 regulatory elements used to construct co-expression plots. (Supplementary Figure 1A and B). Through Univariate Cox analysis of these 329 lncRNAs associated with ICD, we pinpointed 13 regulators for subsequent consensus clustering analysis (Figure 2A). Notably, all 13 of these lncRNAs were found to enhance the expression of ICD-related genes, as illustrated in the Sankey diagram, with the exception of AL590062.1 (Figure 2B). Utilizing the consensus matrix, we effectively segregated the TCGA-THCA cohort into Clusters 1 and 2 (Figure 2C and D). Further visual examination of the expression levels of these 13 lncRNAs in both clusters revealed that Cluster 2 exhibited markedly higher levels of ICD-related lncRNA expression than Cluster 1. Consequently, we denoted Cluster 1 as the ICD-low group (C1) and Cluster 2 as the ICD-high group (C2) (Figure 2E). Importantly, patients with elevated expression levels of ICD-related lncRNAs in the ICD-high group displayed extended progression-free intervals (PFI), suggesting potential anti-tumor effects associated with these lncRNAs (Figure 2F).
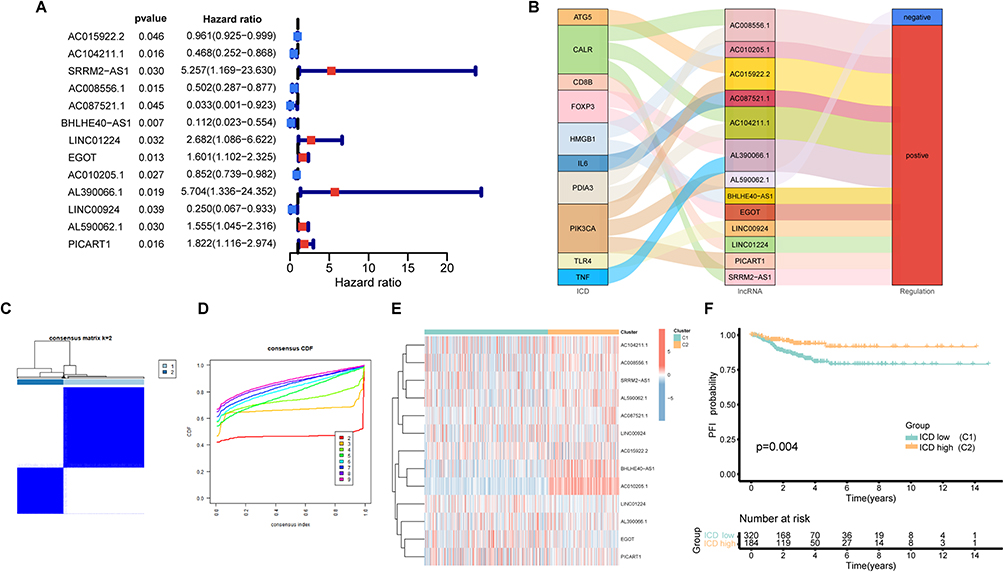 |
Figure 2 Consensus clustering analysis. (A) The forest plot of ICD-related lncRNAs based on univariate cox progression analysis; (B) Sankey diagram of relationship between ICD and lncRNAs; (C) Consensus matrix with k=2; (D) Consensus CDF curve; (E) Heatmap of ICD-related lncRNAs in two clusters; (F) The K-M curve for PFI between two clusters. |
Analysis of Two Clusters
Gene set enrichment analyses, GO and KEGG pathways, unveiled distinct enrichment patterns. Cluster 1 exhibited enrichment primarily related to substance metabolism enrichment, while Cluster 2 was marked by RNA splicing (Figure 3A and B). We evaluated the tumor mutation burden (TMB) to assess genetic mutation levels in PTC patients, and both subgroups demonstrated high BRAF mutation frequencies, with the ICD-high group exhibiting the higher frequency (Figure 3C). Additionally, our analysis of immune cell correlations revealed strong positive associations between Macrophages M1, T cells CD8 and T cells follicular helper, whereas these cell types exhibited a negative correlation with Macrophages M0, M2, Tregs, and Dendritic cells activated (Figure 3D; Supplementary Figure 1C). Distinct variations in the degrees of immune cell infiltration were also evident within the individual clusters (Figure 3E). Further investigation unveiled differential expression patterns of HLA-associated genes and genes associated with immunological checkpoints across the two participant categories. (Figure 3F and G)
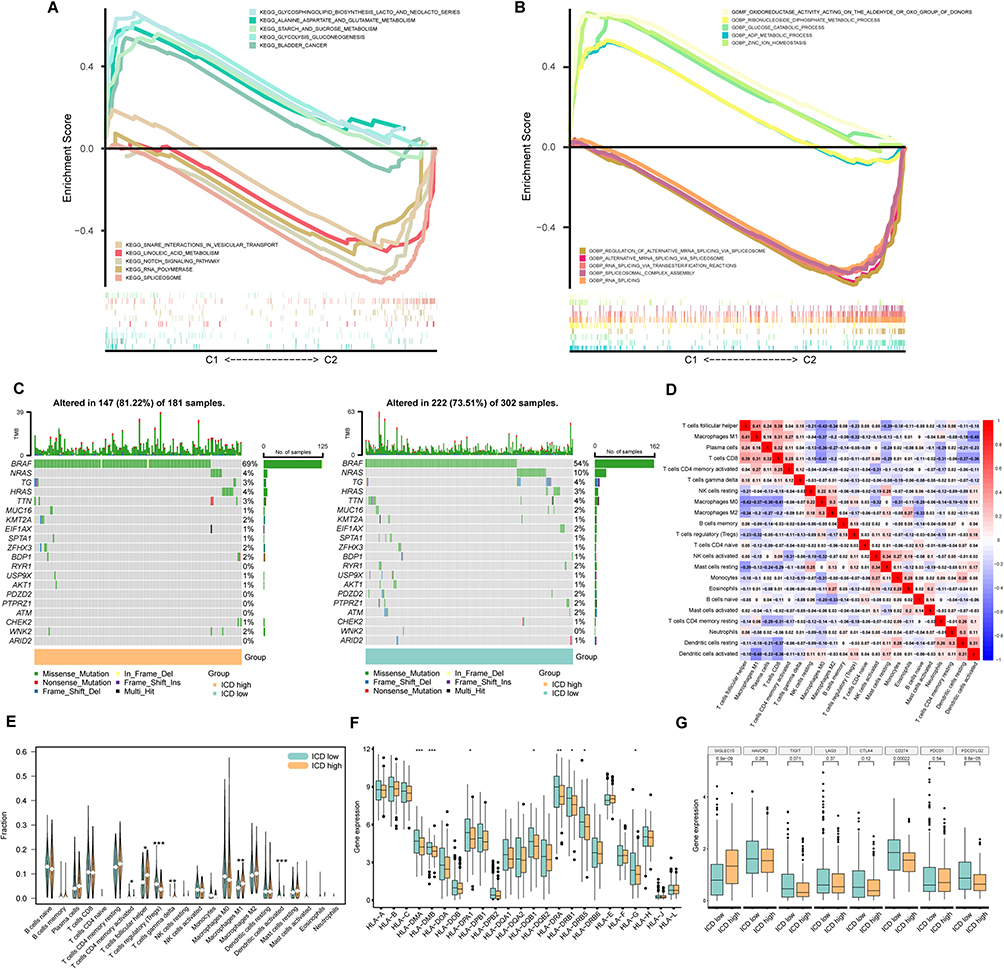 |
Figure 3 Further Analysis of the clusters. (A) KEGG analysis with top 5 pathway in two clusters; (B) GO analysis with top 5 cell function in two clusters; (C) TMB of two clusters; (D) Correlation of immune cells in tumor environment; (E) Violin plot of immune cell infiltration between two clusters; (F) Box plot of HLA-related genes expression; (G) Box plot of gene expression associated with immune checkpoint. *Indicates p<0.05, **Indicates p<0.01 and ***Indicates p<0.001. |
Development of the Prognostic Model
To explore the link between PFI and ICD-related lncRNAs in PTC, we developed a prognostic model employing multivariate Cox analysis and LASSO regression analysis (Supplementary Figure 1D and E). The final prognostic model comprised seven lncRNAs and was represented by the following formula: Risk score = (1.792904122* SRRM2-AS1 expression) + (0.105582374 * EGOT expression) + (1.179538958 * AL390066.1 expression) + (0.115070552 * PICART1 expression) + (−0.419224168 * AC008556.1 expression) + (−1.313999256 * BHLHE40-AS1 expression) + (−0.414922479 * LINC00924 expression). Each patient was assigned a risk score based on this formula, enabling the division of the TCGA-THCA cohort into High-risk group (n = 245) and low-disk groups (n = 259) groups (Supplementary Figure 1F–H).
Validation of Prognostic Model Accuracy
We assessed the accuracy of our prognostic model through the Kaplan-Meier (K-M) survival analysis, revealing and compelling relationship between patient PFI and risk score. Notably, patients in the high-risk group exhibited significantly shorter PFIs compared to their low-risk counterparts across multiple datasets, including TCGA-THCA (p<0.001), the training group (p<0.001), and the testing group (p=0.003) (Figure 4A and C). Both univariate and multivariate Cox analyses affirmed the potential of the risk score as a distinct prognostic factor influencing PFI in PTC patients (all: Figure 4D; training: Figure 4E; testing: Figure 4F).
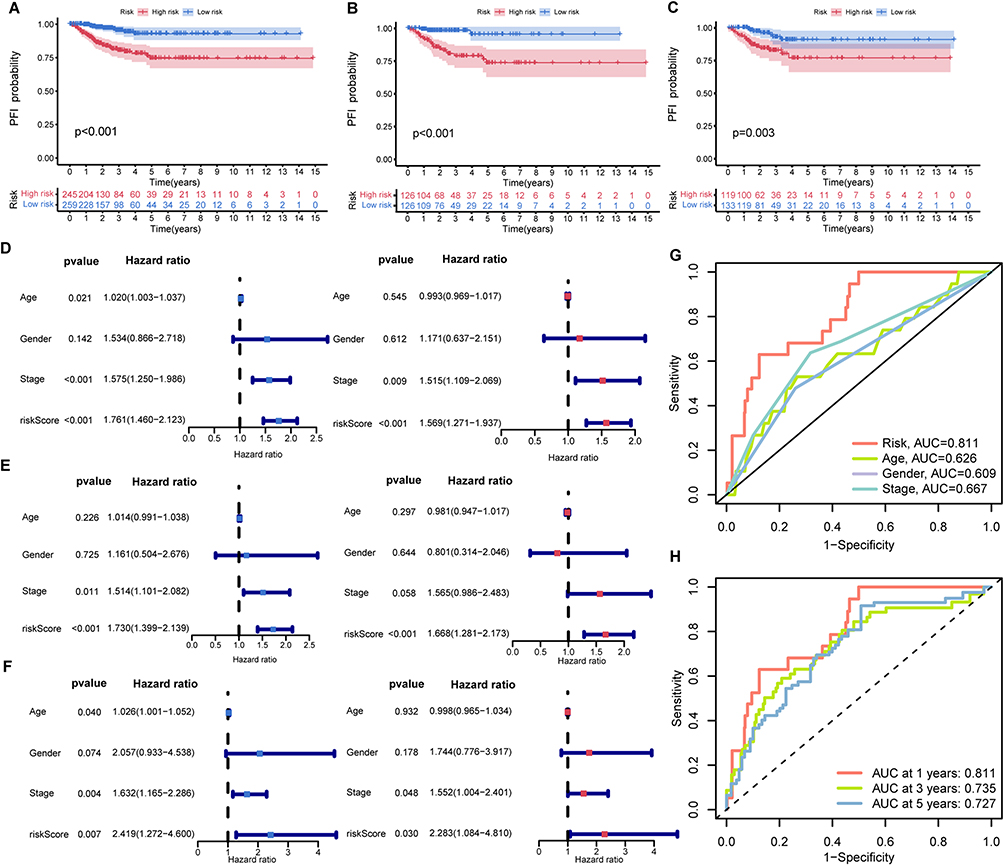 |
Figure 4 Analysis of prognostic model. The K-M curve of the TCGA-THCA dataset (A), the training group (B), and test group (C); Univariate cox analysis and multivariate cox analysis of the TCGA-THCA dataset (D), the training group (E), and the testing group (F). (G) ROC curve to predict the PFI in TCGA-THCA by kinds of clinical features; (H) ROC curve to predict the PFI in TCGA-THCA in 1,3,5 years. |
The ROC curve underscored the model’s robust predictive power, with an AUC of 0.811, significantly surpassing other parameters in distinguishing high-risk from low-risk PTC cases (Figure 4G). Time-dependent ROC curve analyses further validated its reliability over the years, with AUC values of 0.811, 0.735, and 0.727 in the first, third, and fifth years, respectively (Figure 4H).
Furthermore, the model’s predictive accuracy was substantiated through PFI probability assessments across various clinical subgroups, including age (<50 years, ≥ 50 years), gender (male, female), AJCC T / M / N, AJCC stage (I + II, III + IV), with the low-risk group consistently displaying markedly improved prognosis (p < 0.05) (Figure 5A–L). These findings reinforce the reliability of our prognostic model in predicting PFI of PTC patients.
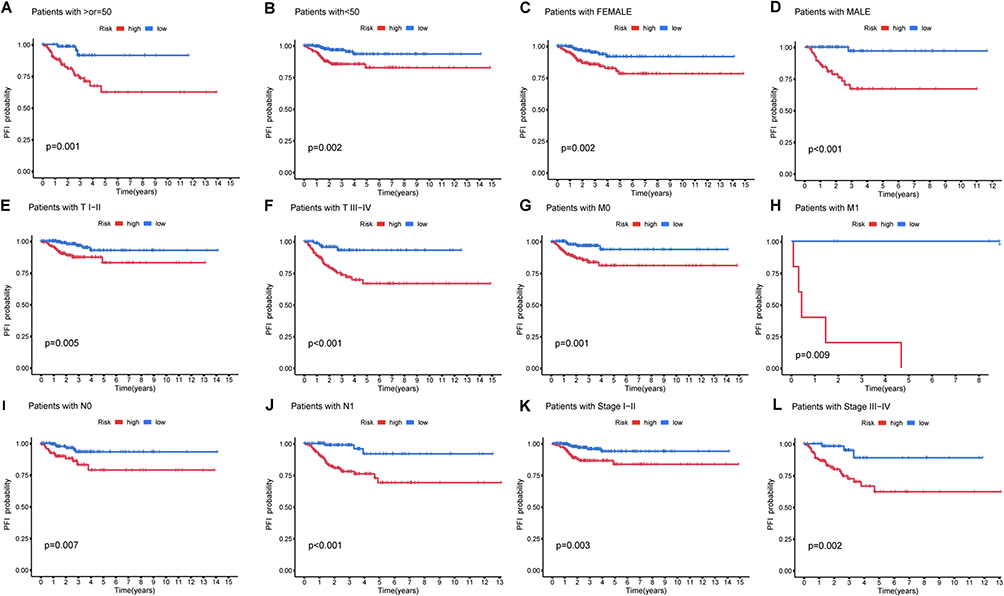 |
Figure 5 K-M curve of different clinicopathological characteristics in the TCGA-THCA dataset. (A and B) Age(≥55, <55); (C and D) Gender (Female, Male); (E and F) T (I + II, III + IV); (G and H) M (M0, M1); (I and J) N (N0, N1); (K and L) Stage (I + II, III + IV). |
Further Analysis of the Prognostic Model
To facilitate rapid risk assessment following model validation, we constructed a nomogram based on our prognostic model (Figure 6A). Considering the potential relationship between patient prognosis and immunity, we explored immune cell correlations in the two risk groups. Interestingly, T cells regulatory(Tregs) and Dendritic cells activated(DCs) exhibited increased levels with increasing risk scores, while Macrophages M1 (M1) and T cells follicular helper(Tfh) displayed an inverse trend in the tumor immune microenvironment (Figure 6B–E). These observations suggest a potential role for these cells in mediating immunogenic cell death and influencing thyroid cancer development. Subsequent single sample gene set enrichment analysis (ssGSEA) revealed significant differences in immune cell infiltration and immune-related functions between the two risk groups (Figure 6F and G). Notably, the high-risk group exhibited reduced scores when assessing the potential effectiveness of immunotherapy, indicating greater efficacy for this group (Figure 6H).
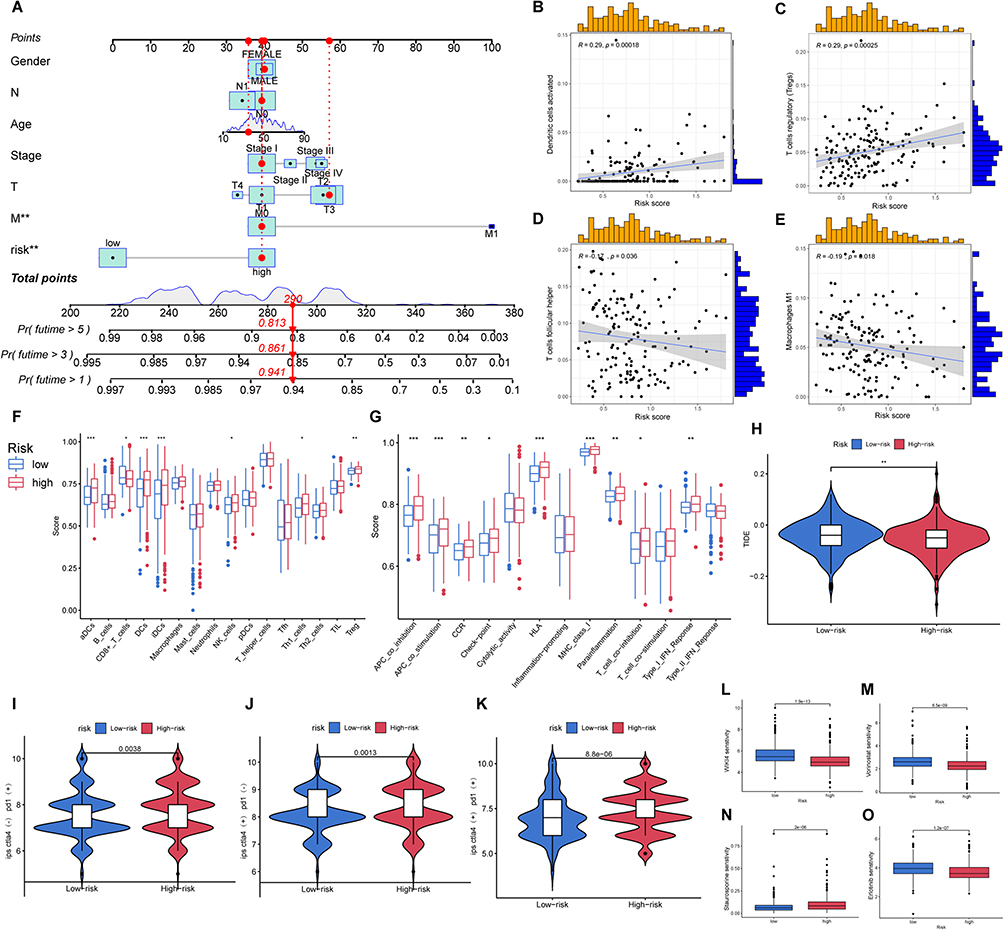 |
Figure 6 Further analysis of the prognostic model. (A) Nomogram based on prognostic model; The correlation of group and immune cell: (B) DCa; (C) Tregs; (D) Tfh; (E) M1; (F and G) Box plot of immune cell infiltration and expression of immune function-related gene; (H) TIDE score of two groups; Score of immunotherapy in tow groups by TCIA: (I) CTLA4(-),PD1(+); (J) CTLA4(+),PD1(-); (K) CTLA4(+),PD1(+); Different drug sensitivity of two groups: (L) WIK14; (M) Vorinostat; (N) Staurosporine; (O) Erlotinib. *Indicates p<0.05, **Indicates p<0.01 and ***Indicates p<0.001. |
In line with these findings, analysis of TCIA data suggested that anti-CTLA-4 and anti-PD-1 antibodies have a more pronounced therapeutic effect in high-risk patients (Figure 6H–K). We also identified several drugs with significant differences in drug sensitivity prediction, offering novel immunotherapy prospects for high-risk clinical patients (Figure 6L–O).
In vitro Experiments Confirm the Tumor Suppressor Role of LINC00924 in PTC Cell Lines
In our pursuit of a robust biomarker for guiding PTC treatment, we identified the LINC00924 gene as a promising candidate. Analysis of LINC00924 expression in tumor and normal tissues consistently revealed significantly lower expression levels in tumor tissues (P < 0.05) (Figure 7A). This finding was further substantiated in the external dataset GSE33630, which also demonstrated the downregulation of LINC00924 in PTC tissues (Figure 7B). Importantly, patients with lower LINC00924 expression exhibited shorter PFI (Figure 7C).
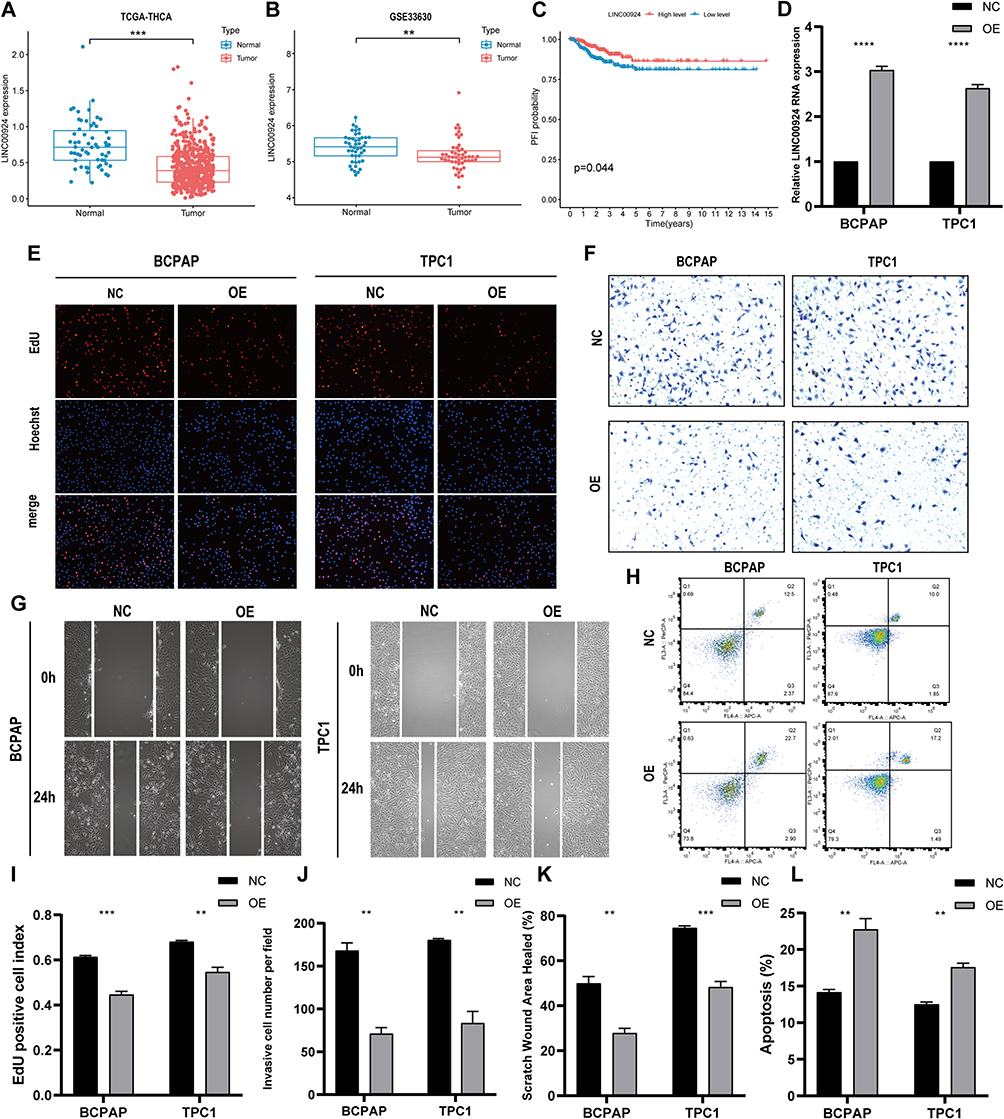 |
Figure 7 In vitro experiments confirm the protective biological behavior of LINC00924 in PTC cell lines. (A) Differential analysis of LINC00924 between PTC tissues and adjacent normal tissues in TCGA THCA; (B) Differential analysis of LINC00924 between PTC tissues and adjacent normal tissues in GSE33630 (C) PFI curves of patients with high and low expression of LINC00924; (D) PCR analysis of LINC00924 in BCPAP and TPC1 cell lines after transfecting overexpression plasmid (OE) or control vector plasmid (NC); (E and I) EdU staining results and statistical graphs for each group; (F and J) Transwell assays results and statistical graphs for each group; (G and K) Scratch assays results and statistical graphs for each group; (H and L) Flow cytometry analysis of apoptosis levels in each group and statistical graphs. **Indicates p<0.01, ***Indicates p<0.001 and ****Indicates p<0.0001. |
To delve deeper into this investigation, we conducted overexpression experiments involving LINC00924 in BCPAP and TPC1 cell lines. PCR analysis confirmed a substantial upregulation of LINC00924 following plasmid transfection (Figure 7D). EdU staining revealed a remarkable reduction in cell proliferation upon LINC00924 overexpression in both BCPAP and TPC1 cells (Figure 7E–I). Transwell assays further underscored that LINC00924 overexpression restrained cell invasion in both BCPAP and TPC1 cells (Figure 7F–J). Scratch assays indicated a notable decline in the migratory capacity of BCPAP and TPC1 cells upon LINC00924 overexpression (Figure 7G–K). Moreover, LINC00924 overexpression exerted a profound impact on apoptotic phenotype, significantly enhancing apoptosis in both cell lines (Figure 7H–L).
Discussion
In this study, we classified patients into high- and low-risk groups based on the expression of seven ICD-related lncRNAs and subsequently developed a predictive model to forecast their prognosis. The interplay between thyroid carcinoma and the immune system is notably intricate, and it significantly influences tumor prognosis.32,33 Immunogenic cell death, a process modulating cellular immune function, has been demonstrated to impact tumor development. Upon ICD, the release of Damage-Associated Molecular Patterns (DAMPs) from cancer cells enhances tumor antigenicity, rendering tumor cells more susceptible to recognition and elimination by immune cells.8,34,35 Therefore, the occurrence of ICD exerts a positive influence on tumors, as evidenced by our Kaplan-Meier analysis. Cluster 1, identified through consensus clustering, exhibited higher expression of ICD-related lncRNAs and significantly better prognoses compared to Cluster 2.
A retrospective study36 attempted to develop a risk scoring model based on recurrence risk factors, with multivariate analysis identifying male gender, age ≤35 years, tumor size >0.5cm, distant metastasis to the lung, psammoma bodies positivity, multifocality, and capsular invasion as independent risk factors for central lymph node metastasis in PTC (P<0.01). Based on these factors, the established risk scoring model for predicting central lymph node metastasis in PTC patients yielded an area under the receiver operating characteristic curve (AUC) of 0.672. In contrast, our lncRNA model associated with ICD demonstrated diagnostic AUCs of 0.811 for 1-year adverse prognosis, 0.735 for 3 years, and 0.727 for 5 years, indicating that our model performs well in prognostic efficacy. This result highlights the superior accuracy and practicality of our model in predicting the prognosis of PTC patients compared to current clinical practices and available models.
In our comprehensive analysis of ICD development in thyroid cancer, we unveiled potential immune mechanisms. There were noticeable differences in immune cell infiltration, particularly Tregs, M1, DCs, Tfh, γδ T cell in particular, in the tumor microenvironment of the two clusters. M1 macrophages and γδ T cells have been shown to inhibit tumor cell growth and induce tumor cell death, resulting in improved patients’ outcomes,37–39 while Tregs promote tumor progression via immune inhibitory.40 Tregs were associated with worse patient prognosis, and the overexpression of ICD-related lncRNAs tended to reduce the number of Tregs in the tumor environment.41,42 Variations in immune cell infiltration in tumor beds likely contribute to the differences in PFI between the two clusters defined by ICD-related lncRNAs. We attempted to investigate the connection between these immune cells and the lncRNAs associated with ICD. Our investigation revealed that the co-expressed genes with the seven lncRNAs used in the prognostic model construction, such as CALR, and HMGB1, play roles in inducing dying tumor cells to secrete Calreticulin and HMGB1. This induction prompts immune cells to phagocytose tumor cells and enhances their antigenicity.35,43,44 This mechanism may account for the more favorable prognostic outcomes observed in the ICD-high group.
In prognostic models, high-risk groups generally exhibit worse prognoses than low-risk groups. Additionally, the model’s prognostic accuracy has been corroborated by other clinical cohorts. The nomogram derived from this model potentially introduces a novel clinical diagnostic method for PTC patients. Our analysis of immune cell proportions in the tumor microenvironment revealed that, with increasing risk, the fraction of M1 cells decreased while Tregs’ proportion increased. This observation aligns with our initial hypothesis and may unveil the underlying immune mechanisms through which ICD-related lncRNAs impact tumor development. Immunotherapy represents a pivotal treatment avenue for thyroid cancer patients,45,46 with drugs targeting immune checkpoints like Anti-PD1 and anti-CTLA4 being widely used.47,48 Notably, this form of immunotherapy appears more efficacious in high-risk patients. To further facilitate clinical PTC treatment, we have included a comparison of the therapeutic effects of various medications.
In HBV-related hepatocellular carcinoma (HCC), downregulation of LINC00924 has been linked to adverse outcomes. Elevated LINC00924 impedes cell invasion and epithelial-mesenchymal transition by sponging miR-6755-5p and upregulating NDRG2.49 Our study findings consistently demonstrate a significant downregulation of LINC00924 in PTC tissues, with its low expression positively correlated with poor prognosis. Our In vitro experiments further confirmed that LINC00924 reduced the proliferative, migratory, and invasive capabilities of PTC cell lines BCPAP and TPC1 while increasing apoptotic cell proportions. These results imply that LINC00924 plays a protective role in PTC, aligning with conclusions drawn in HCC research, thus underscoring its potential as a therapeutic target. Nonetheless, the precise mechanisms underlying LINC00924’s protective role in PTC warrant further investigation.
However, certain limitations persist in this study. The prognostic model we constructed has solely been validated in the TCGA dataset and necessitates validation across other databases to establish its generalizability. Secondly, the investigation of ICD-related lncRNAs’ immune mechanisms in thyroid tissue via bioinformatic analysis may lack some degree of reliability. Additionally, the associative findings from our study do not imply causality, a crucial aspect when considering the clinical application of our bioinformatics findings. In-depth in vivo studies are indispensable to uncover the true significance of these ICD-related lncRNAs.
Conclusion
The prognostic model, which relies on seven pivotal ICD-related lncRNAs, revealed reduced PFI in PTC patients with higher risk scores and yielded an AUC of 0.811. By augmenting tumor cell immunogenicity, ICD-related lncRNAs have the potential to modify the immune cell composition within the tumor microenvironment, consequently enhancing patient prognosis. In summary, ICD-related lncRNAs hold promise as prognostic biomarkers for predicting the outcomes of PTC patients.
Data Sharing Statement
The data utilized to substantiate the conclusions of this research can be obtained by reaching out to the corresponding author upon inquiry.
Ethics Approval and Consent to Participate
The study was approved by the The First Hospital of China Medical University (Ethics approval number: 2023-497) and was carried out in accordance with the Declaration of Helsinki.
Acknowledgments
Yixian Wang, Xin Li and Yinde Huang are co-first authors for this study. We wish to extend our heartfelt gratitude for the invaluable contribution made by the TCGA and GEO public database to the field of human medicine and for the linguistic editing by Bullet Edits Limited.
Author Contributions
All authors have made significant contributions to the work reported, covering aspects from concept formation, study design, execution, data acquisition, analysis, and interpretation, to the entirety of these fields. They have engaged in drafting, revising, or critically evaluating the manuscript; provided final approval for the version to be published; concurred on the choice of journal for submission; and have committed to being accountable for all aspects of the work.
Funding
The National Natural Science Foundation of China (82170507) provided funding for this study.
Disclosure
The authors confirm that they have no known financial or interpersonal conflicts that might have impacted the research provided in this publication.
References
1. Sung H, Ferlay J, Siegel RL., et al. Global cancer statistics 2020: GLOBOCAN estimates of incidence and mortality worldwide for 36 cancers in 185 countries. CA Cancer J Clin. 2021;71(3):209–249. doi:10.3322/caac.21660
2. Kitahara CM, Sosa JA. The changing incidence of thyroid cancer. Nat Rev Endocrinol. 2016;12:646–653. doi:10.1038/nrendo.2016.110
3. Cabanillas ME, McFadden DG, Durante C. Thyroid cancer. Lancet. 2016;388:2783–2795.
4. Lim H, Devesa SS, Sosa JA, Check D, Kitahara CM. Trends in thyroid cancer incidence and mortality in the United States, 1974–2013. JAMA. 2017;317:1338–1348. doi:10.1001/jama.2017.2719
5. Galluzzi L, Buqué A, Kepp O, Zitvogel L, Kroemer G. Immunogenic cell death in cancer and infectious disease. Nat Rev Immunol. 2017;17:97–111. doi:10.1038/s41590-022-01132-2
6. Galluzzi L, Vitale I, Warren S, et al. Consensus guidelines for the definition, detection and interpretation of immunogenic cell death. J Immunother Cancer. 2020;8:e000337.
7. Galluzzi L, Vitale I, Aaronson SA, et al. Molecular mechanisms of cell death: recommendations of the nomenclature committee on cell death 2018. Cell Death Differ. 2018;25:486–541. doi:10.1038/s41418-017-0012-4
8. Krysko DV, Garg AD, Kaczmarek A, Krysko O, Agostinis P, Vandenabeele P. Immunogenic cell death and DAMPs in cancer therapy. Nat Rev Cancer. 2012;12:860–875. doi:10.1158/2326-6066.CIR-19-0616
9. Kroemer G, Galassi C, Zitvogel L, Galluzzi L. Immunogenic cell stress and death. Nat Immunol. 2022;23:487–500.
10. Djebali S, Davis CA, Merkel A, et al. Landscape of transcription in human cells. Nature. 2012;489:101–108.
11. Qian X, Zhao J, Yeung PY, Zhang QC, Kwok CK. Revealing lncRNA structures and interactions by sequencing-based approaches. Trends Biochem Sci. 2019;44:33–52. doi:10.1016/j.tibs.2018.09.012
12. Gil N, Ulitsky I. Regulation of gene expression by cis-acting long non-coding RNAs. Nat Rev Genet. 2020;21:102–117. doi:10.1038/s41576-019-0184-5
13. Goodall GJ, Wickramasinghe VO. RNA in cancer. Nat Rev Cancer. 2021;21:22–36. doi:10.1038/s41568-020-00306-0
14. Li Y, Jiang T, Zhou W, et al. Pan-cancer characterization of immune-related lncRNAs identifies potential oncogenic biomarkers. Nat Commun. 2020;11:1000. doi:10.1038/s41467-020-14802-2
15. Li G, Kryczek I, Nam J, et al. LIMIT is an immunogenic lncRNA in cancer immunity and immunotherapy. Nat Cell Biol. 2021;23:526–537. doi:10.1038/s41556-021-00672-3
16. Munteanu MC, Sethuraman SN, Singh MP, Malayer J, Ranjan A. LncRNA FENDRR expression correlates with tumor immunogenicity. Genes. 2021;12:897. doi:10.3390/genes12060897
17. Hu Q, Ye Y, Chan L-C, et al. Oncogenic lncRNA downregulates cancer cell antigen presentation and intrinsic tumor suppression. Nat Immunol. 2019;20:835–851. doi:10.1038/s41590-019-0400-7
18. Liu J, Lichtenberg T, Hoadley KA, et al. An integrated TCGA pan-cancer clinical data resource to drive high-quality survival outcome analytics. Cell. 2018;173:400–416.e11. doi:10.1016/j.cell.2018.02.052
19. Weinstein JN, Collisson EA, Mills GB, et al. The cancer genome atlas pan-cancer analysis project. Nat Genet. 2013;45:1113–1120. doi:10.1038/ng.2764
20. Lee CM, Barber GP, Casper J, et al. UCSC genome browser enters 20th year. Nucleic Acids Res. 2020;48:D756–D761. doi:10.1093/nar/gkz1012
21. Garg AD, De Ruysscher D, Agostinis P. Immunological metagene signatures derived from immunogenic cancer cell death associate with improved survival of patients with lung, breast or ovarian malignancies: a large-scale meta-analysis. Oncoimmunology. 2015;5:e1069938. doi:10.1080/2162402X.2015.1069938
22. Bezu L, Sauvat A, Humeau J, et al. eIF2α phosphorylation is pathognomonic for immunogenic cell death. Cell Death Differ. 2018;25:1375–1393. doi:10.1038/s41418-017-0044-9
23. Juneja VR, McGuire KA, Manguso RT, et al. PD-L1 on tumor cells is sufficient for immune evasion in immunogenic tumors and inhibits CD8 T cell cytotoxicity. J Exp Med. 2017;214:895–904. doi:10.1084/jem.20160801
24. Ma Y, Aymeric L, Locher C, et al. Contribution of IL-17-producing gamma delta T cells to the efficacy of anticancer chemotherapy. J Exp Med. 2011;208:491–503. doi:10.1084/jem.20100269
25. Mónaco A, Chilibroste S, Yim L, Chabalgoity JA, Moreno M. Inflammasome activation, NLRP3 engagement and macrophage recruitment to tumor microenvironment are all required for Salmonella antitumor effect. Cancer Immunol Immunother. 2022;71:2141–2150. doi:10.1007/s00262-022-03148-x
26. Lau TS, Chan LKY, Man GCW, et al. Paclitaxel induces immunogenic cell death in ovarian cancer via TLR4/IKK2/SNARE-dependent exocytosis. Cancer Immunol Res. 2020;8:1099–1111. doi:10.1158/2326-6066.CIR-19-0616
27. Newman AM, Liu CL, Green MR, et al. Robust enumeration of cell subsets from tissue expression profiles. Nat Methods. 2015;12:453–457. doi:10.1038/nmeth.3337
28. Friedman J, Hastie T, Tibshirani R. Regularization paths for generalized linear models via coordinate descent. J Stat Softw. 2010;33:1–22.
29. Maeser D, Gruener RF, Huang RS. oncoPredict: an R package for predicting in vivo or cancer patient drug response and biomarkers from cell line screening data. Briefings Bioinf. 2021;22(6):bbab260.
30. Charoentong P, Finotello F, Angelova M. Pan-cancer immunogenomic analyses reveal genotype-immunophenotype relationships and predictors of response to checkpoint blockade. Cell Rep. 2017;18(1):248–262.
31. Jiang P, Gu S, Pan D, et al. Signatures of T cell dysfunction and exclusion predict cancer immunotherapy response. Nat Med. 2018;24:1550–1558. doi:10.1038/s41591-018-0136-1
32. Xie Z, Li X, He Y, et al. Immune cell confrontation in the papillary thyroid carcinoma microenvironment. Front Endocrinol. 2020;11:570604. doi:10.3389/fendo.2020.570604
33. Dong X, Yang Q, Gu J, et al. Identification and validation of L antigen family member 3 as an immune-related biomarker associated with the progression of papillary thyroid cancer. Int Immunopharmacol. 2021;90:107267. doi:10.1016/j.intimp.2020.107267
34. Minute L, Teijeira A, Sanchez-Paulete AR, et al. Cellular cytotoxicity is a form of immunogenic cell death. J Immunother Cancer. 2020;8:e000325. doi:10.1136/jitc-2019-000325
35. Hayashi K, Nikolos F, Lee YC, et al. Tipping the immunostimulatory and inhibitory DAMP balance to harness immunogenic cell death. Nat Commun. 2020;11:6299. doi:10.1038/s41467-020-19970-9
36. Jiang LH, Yin KX, Wen QL, Chen C, Ge MH, Tan Z. Predictive risk-scoring model for central lymph node metastasis and predictors of recurrence in papillary thyroid carcinoma. Sci Rep. 2020;10(1):710. doi:10.1038/s41598-019-55991-1
37. Silva-Santos B, Serre K, Norell H. γδ T cells in cancer. Nat Rev Immunol. 2015;15:683–691. doi:10.1038/nri3904
38. Yang G, Lu S-B, Li C, et al. Type I macrophage activator photosensitizer against hypoxic tumors. Chem Sci. 2021;12:14773–14780. doi:10.1039/d1sc04124j
39. Mills CD, Ley K. M1 and M2 macrophages: the chicken and the egg of immunity. J Innate Immun. 2014;6:716–726. doi:10.1159/000364945
40. Togashi Y, Shitara K, Nishikawa H. Regulatory T cells in cancer immunosuppression - implications for anticancer therapy. Nat Rev Clin Oncol. 2019;16:356–371. doi:10.1038/s41571-019-0175-7
41. Huang F-Y, Lei J, Sun Y, et al. Induction of enhanced immunogenic cell death through ultrasound-controlled release of doxorubicin by liposome-microbubble complexes. Oncoimmunology. 2018;7:e1446720. doi:10.1080/2162402X.2018.1446720
42. Wang H, Tang Y, Fang Y, et al. Reprogramming Tumor Immune Microenvironment (TIME) and metabolism via biomimetic targeting codelivery of shikonin/JQ1. Nano Lett. 2019;19:2935–2944. doi:10.1021/acs.nanolett.9b00021
43. Fucikova J, Spisek R, Kroemer G, Galluzzi L. Calreticulin and cancer. Cell Res. 2021;31:5–16. doi:10.1038/s41422-020-0383-9
44. Han A, Li C, Zahed T, et al. Calreticulin is a critical cell survival factor in malignant neoplasms. PLoS Biol. 2019;17:e3000402.
45. Crespo-Rodriguez E, Bergerhoff K, Bozhanova G, et al. Combining BRAF inhibition with oncolytic herpes simplex virus enhances the immune-mediated antitumor therapy of BRAF-mutant thyroid cancer. J Immunother Cancer. 2020;8:e000698. doi:10.1136/jitc-2020-000698
46. Mould RC, van Vloten JP, AuYeung AWK, Karimi K, Bridle BW. Immune responses in the thyroid cancer microenvironment: making immunotherapy a possible mission. Endocr Relat Cancer. 2017;24:T311–T329. doi:10.1530/ERC-17-0316
47. Liotti F, Kumar N, Prevete N, et al. PD-1 blockade delays tumor growth by inhibiting an intrinsic SHP2/Ras/MAPK signalling in thyroid cancer cells. J Exp Clin Cancer Res. 2021;40:22. doi:10.1186/s13046-020-01818-1
48. Byun DJ, Wolchok JD, Rosenberg LM, Girotra M. Cancer immunotherapy - immune checkpoint blockade and associated endocrinopathies. Nat Rev Endocrinol. 2017;13:195–207. doi:10.1038/nrendo.2016.205
49. Yu K, Mei Y, Wang Z, Liu B, Deng M. LncRNA LINC00924 upregulates NDRG2 to inhibit epithelial-mesenchymal transition via sponging miR-6755-5p in hepatitis B virus-related hepatocellular carcinoma. J Med Virol. 2022;94:2702–2713. doi:10.1002/jmv.27578
 © 2024 The Author(s). This work is published and licensed by Dove Medical Press Limited. The full terms of this license are available at https://www.dovepress.com/terms.php and incorporate the Creative Commons Attribution - Non Commercial (unported, v3.0) License.
By accessing the work you hereby accept the Terms. Non-commercial uses of the work are permitted without any further permission from Dove Medical Press Limited, provided the work is properly attributed. For permission for commercial use of this work, please see paragraphs 4.2 and 5 of our Terms.
© 2024 The Author(s). This work is published and licensed by Dove Medical Press Limited. The full terms of this license are available at https://www.dovepress.com/terms.php and incorporate the Creative Commons Attribution - Non Commercial (unported, v3.0) License.
By accessing the work you hereby accept the Terms. Non-commercial uses of the work are permitted without any further permission from Dove Medical Press Limited, provided the work is properly attributed. For permission for commercial use of this work, please see paragraphs 4.2 and 5 of our Terms.