")
Back to Journals » Clinical Ophthalmology » Volume 10
The new Bruch’s membrane opening – minimum rim width classification improves optical coherence tomography specificity in tilted discs
Authors Rebolleda G, Casado A , Oblanca N, Muñoz-Negrete FJ
Received 20 August 2016
Accepted for publication 3 October 2016
Published 5 December 2016 Volume 2016:10 Pages 2417—2425
DOI https://doi.org/10.2147/OPTH.S120237
Checked for plagiarism Yes
Review by Single anonymous peer review
Peer reviewer comments 3
Editor who approved publication: Dr Scott Fraser
Gema Rebolleda, Alfonso Casado, Noelia Oblanca, Francisco J Muñoz-Negrete
Department of Ophthalmology, Hospital Universitario Ramón y Cajal, Madrid, Spain
Background and objective: To investigate and compare the false-positive (FP) diagnostic classification of the Bruch’s membrane opening – minimum rim width (BMO-MRW) and retinal nerve fiber layer (RNFL) thickness in healthy eyes with tilted optic disc.
Materials and methods: Fifty healthy eyes of 30 participants with tilted optic disc underwent BMO-MRW and RNFL scanning using Spectralis and macular Cirrus optical coherence tomography (OCT) scans.
Results: The overall FP rate was significantly lower using BMO-MRW map compared with both RNFL map by Spectralis (8% vs 62%, respectively, P<0.001) and ganglion cell analysis (GCA) map by Cirrus (8% vs 50%, respectively, P<0.001). Specificity was significantly higher using BMO-MRW than RNFL in eyes with low (89.7% vs 41.4%, P<0.001) and moderate myopia (95.2% vs 33.3%, P<0.001).
Conclusion: OCT-derived BMO-MRW analysis provides significantly greater specificity than RNFL in tilted disc irrespectively of the refractive error, and it is more specific than GCA analysis in tilted disc with moderate myopia.
Keywords: tilted disc, optical coherence tomography, false-positive, Bruch membrane
Introduction
Optical coherence tomography (OCT) allows automated quantification of both peripapillary retinal nerve fiber layer (RNFL) and ganglion cell-inner plexiform layer (GCIPL) macular thicknesses, providing information on the probability of an abnormality being present after comparison with an internal normative database.
Several known factors can affect these measurements such as age, ethnic background, refractive errors, optic disc area, and foveal-disc angle.1–6 Recently, longer axial length has been significantly associated with an increased incidence of false-positives (FPs) on ganglion cell analysis (GCA) and RNFL maps after uni- and multivariate analyses.3–7 Caution is recommended in moderate myopic individuals because a high percentage can be misclassified as abnormal by RNFL and GCA Cirrus OCT maps.4
A study has reported that Spectralis OCT (Heidelberg Engineering, Dossenheim, Germany) might be more specific than Cirrus (39% vs 18%) when evaluating RNFL thickness for Caucasians and moderate myopic population.5 Axial length, mean spherical equivalent, presence of peripapillary atrophy, and tilted disc were significantly related to the RNFL FP occurrence displayed by both the devices; therefore, the degree of myopic optic disc tilt should be considered when interpreting the RNFL thickness measured by OCT.5,7–10 Clinical features of tilted disc overlap with other conditions, such as myopic disc and glaucoma, but the role of conventional OCT imaging technologies for the optic nerve head (ONH) is limited.4,5
Currently, rim width measurement method uses the Bruch’s membrane opening (BMO) as the anatomical border of the rim, referenced to a BMO horizontal reference plane, termed as “BMO-horizontal rim width” (BMO-HRW).11 In contrast, the Spectralis OCT Glaucoma Module Premium (GMP) Edition provides a new, objective method of ONH analysis using BMO, but the neuroretinal rim assessment is performed from the BMO to the nearest point on the internal limiting membrane (ILM), and this shortest distance measurement is referred to as BMO – minimum rim width (BMO-MRW). This parameter considers the orientation of the rim tissue relative to the point of measurement, and the highly variable anatomy of the ONH both within and between individuals, and quantifies the rim width perpendicular to the trajectory of axons. Moreover, the new software provides an anatomic positioning system (APS) where acquisition of data is based on fovea-to-BMO-center axis, reducing the interindividual variation.11–13
Recently, a higher sensitivity of BMO-MRW compared with BMO-HRW methods has been reported.11 Moreover, the structure–function relationship was enhanced due to its geometrically accurate properties, indicating MRW as a new structural marker for the detection and risk profiling of glaucoma.11,14,15
The aims of the current study were to evaluate and to compare the rates of FP results in eyes with tilted optic disc regarding the color code classification of RNFL and BMO-MRW using the new GMP Edition (Spectralis Heidelberg Engineering, Dossenheim, Germany), as well as the macular GCA by Cirrus OCT (Carl Zeiss Meditec, Dublin, CA, USA).
Materials and methods
Participants
This study is based on the BMO-MRW imaging study, an ongoing prospective study of patients with glaucoma and other optic neuropathies and healthy volunteers at the Glaucoma and Neurophthalmic Department of Ramon y Cajal University Hospital.
The study protocol was approved by the ethics committee of Hospital Universitario Ramón y Cajal, and the study adhered to the tenets of the Declaration of Helsinki. After a discussion of the nature and purpose of the study, written informed consent was obtained from all participants.
Thirty healthy individuals with tilted disc aged ≥18 years without other ocular pathology were invited to participate and were recruited between July 2014 and February 2015. Eligible participants underwent a thorough ophthalmic examination (GR) to confirm the lack of ocular pathology other than tilted optic disc. This examination included measurement of Snellen visual acuity, noncycloplegic refraction using an autorefractor, intraocular pressure by applanation tonometry, axial length using partial laser interferometry (IOL Master; Carl Zeiss Meditec), slit-lamp biomicroscopy with a plus 90D lens, and automated visual field (VF) testing (Humphrey Field analyzer with Swedish Interactive Thresholding Algorithm standard 24-2 test program). VF was classified as normal when there was a mean deviation or a pattern standard deviation within the 95th percentile; a normal glaucoma hemifield test and absence of a cluster of three or more non-edge points on the pattern deviation plot with a probability of occurring in <5% of the normal population, with one of these points having the probability of occurring in <1% of the normal population.
Exclusion criteria included refractive error >6.0 diopters (D) of spherical equivalent or 3.0 D of astigmatism, any history of ocular surgery, ocular disease, best corrected visual acuity as poor as 20/40, intraocular pressure (IOP) ≥18 mmHg, past history of raised IOP, evidence of increased or asymmetric cupping (interocular asymmetry ≥0.2), neuroretinal rim notching, or optic disc hemorrhages.
Digital fundus images were used to assess the disc characteristics, and all the optic discs were evaluated by a single experienced examiner (AC). Tilted disc was defined as an index of tilt <0.8 calculated as the quotient of the minimum diameter of the disc divided by its maximum.16
OCT measurements
After the screening examination, all included eyes underwent OCT scanning by the new module Glaucoma Premium by Spectralis and macular OCT scanning by Cirrus on the same day by one well-trained operator (NO).
Spectralis OCT imaging
The new GMP Edition provided by Spectralis 6.0c version (Heidelberg Engineering GmbH, Heidelberg, Germany) was used, including 24 radial and 3 circular scans.
The mean corneal radius (C-Curve value) affects the absolute measurements; therefore, it was introduced for all participants in the eye data box before starting any scanning.
BMO-based MRW is measured from radial B-scans automatically centered at the ONH. Twenty-four radial B-scans were acquired over a 15 degree area. Each B-scan consisted of 768 A-scans and was the average of 25 repetitions. The location of BMO was automatically identified in each of the radial B-scans. The BMO-MRW was then measured based on the shortest distance from each identified BMO point to the ILM.
RNFL thickness measurements of each individual eye are normalized for anatomic orientation of the fovea-to-BMO-center axis to ensure accurate and consistent positioning of the RNFL thickness profile across eyes. This technique minimizes scan orientation variability by aligning the scan position relative to an anatomical landmark. Although the new module includes 3 circle scans (inner circle: 3.5 mm, middle circle: 4.1 mm, and outer circle: 4.7 mm), we registered only the figures provided by the inner circle scan (standard).
For both, MRW and RNFL maps, a green sector represents the range above the 5th percentile of the distribution in normal eyes and is considered as “within normal limits”. Yellow sector represents the range below the 5th percentile but above the 1st percentile and is considered as “borderline”. Red sector represents the range below the 1st percentile and is considered as “outside normal limits”.
After image acquisition, the BMO segmentation was reviewed and confirmed by a trained examiner (GR). All acquired spectral domain-OCT data sets had a quality score (Q) >25.
To determine the frequency of FP results, the sector maps of Spectralis for each participant’s eye were examined. A yellow or red color-coded average thickness and a sector map with ≥1 yellow- or red-colored sectors were considered as abnormal in both RNFL and BMO-MRW classifications. The BMO area and the fovea-to-BMO-center axis measurements were also registered.
Cirrus
A macular cube scan was used to obtain GCIPL thickness. This protocol performs 512 horizontal A-scans and 128 vertical B-scan lines within a 6×6 mm cube of acquired signal data centered on the fovea. The GCIPL software algorithm automatically identifies the outer boundary of the RNFL and the outer boundary of the inner plexiform layer and measures macular GCIPL thickness within an annulus with inner vertical and horizontal diameters of 1 and 1.2 mm, respectively, and outer vertical and horizontal diameters of 4 and 4.8 mm, respectively. The GCA provides quantitative assessment of the overall average, minimum thickness (the lowest GCIPL thickness over a single meridian crossing the annulus), and 6 sector areas (superotemporal, superior, superonasal, inferonasal, inferior, and inferotemporal). The GCIPL thicknesses in the normal range are represented by green backgrounds. Those that are abnormally decreased at the 5% and at the 1% level are represented by yellow and red backgrounds, respectively.
To determine the FP rate and average and minimum thickness, the sector and deviation maps were all considered. Two independent observers (GR and AC) identified the FP color codes on GCA maps. An abnormal result on the Cirrus GCL deviation map was defined and categorized according to Kim’s criteria.6 Eyes with abnormal GCA deviation maps were categorized into the following 3 groups based on the shape and location of abnormal GCIPL color-coded area: group A (donut-shaped round color pattern around the inner annulus); group B (island-like isolated color pattern); and group C (diffuse and circular color pattern with an irregular inner margin in either or both hemifields).6
Statistics
The frequency of FP results was calculated by the number of eyes with abnormal MRW, RNFL, or GCA maps divided by the total number of eyes. For the overall FP rate for RNFL and MRW classifications, the number of eyes with ≥1 average and sector map with abnormal color codes was determined. The overall FP rate for GCA maps, the number of eyes with ≥1 GCA (average, minimum, sector, and deviation) maps with abnormal color codes was assessed.
Comparative analysis between the FP rates of each OCT protocol was performed using McNemar test. A generalized estimating equations (GEE) model was used to compare demographic and clinical factors between the eyes with normal findings and eyes with abnormal results. Variables assessed in this study included age, gender, eye side, spherical equivalent, axial length, presence of peripapillary atrophy, tilted index, BMO area, and fovea-to-BMO-center axis.17–19
Student’s t-test for independent samples was used to compare age and ovality index between non/low myopia and moderate myopia. Data were analyzed using statistical software SPSS version 20.0 (IBM Corporation, Armonk, NY, USA) and Stata software version 12.0 (StataCorp., College Station, TX, USA). Statistical significance was defined as P<0.05.
Results
This study included 50 eyes from 30 healthy participants; 29 eyes had non/low myopia (≥−2 D, range: +2.13 to −2 D) and 21 had moderate myopia (<−2 D; range: −2.5 to −6 D). Demographic and clinical characteristics of the participants are shown in Table 1. Eyes with moderate myopia had a significant longer axial length and were younger compared with non/low myopic eyes (25 vs 23.9 mm, P<0.001 and 32.4 vs 42.9 years, P=0.004, respectively). The ovality index was not significantly different between groups (P=0.423).
 | Table 1 Demographic and clinical characteristics of the participants (50 eyes of 30 individuals) |
FP rate of RNFL and MRW classification sector maps by Spectralis
The overall frequency of FPs for the MRW classification was 8% (n=4). Three of these eyes (75%) had >−2 D (0, −1, and −1.5 D) and one eye (25%) had −4.75 D. One case was observed in the superotemporal sector and 3 in the inferonasal sector. No eye was abnormal at the <1% level, and all the abnormal cases were unilateral. All the 4 eyes that were classified as abnormal in MRW map had the same result in RNFL map by Spectralis.
The overall incidence of FPs for the RNFL-GMP 3.5 mm color code analysis was 62% (n=31). The highest FP rate had occurred in the nasal sector (28%). Of the FP cases, 70.9% (22 out of 31) occurred bilaterally. A significantly higher specificity was seen using the new BMO-MRW (92%) thickness protocol analysis compared with RNFL analysis (38%) (P<0.001). Table 2 shows a comparison of FP rates between eyes with non/low myopia (≥−2 D) and moderate myopia (<−2 D). Specificity continued being significantly higher for BMO-MRW analysis compared with RNFL-GMP in both the groups of eyes (89.7% vs 41.4%, P<0.001 and 95.2% vs 33.3%, P<0.001 in non/low and moderate myopia, respectively).
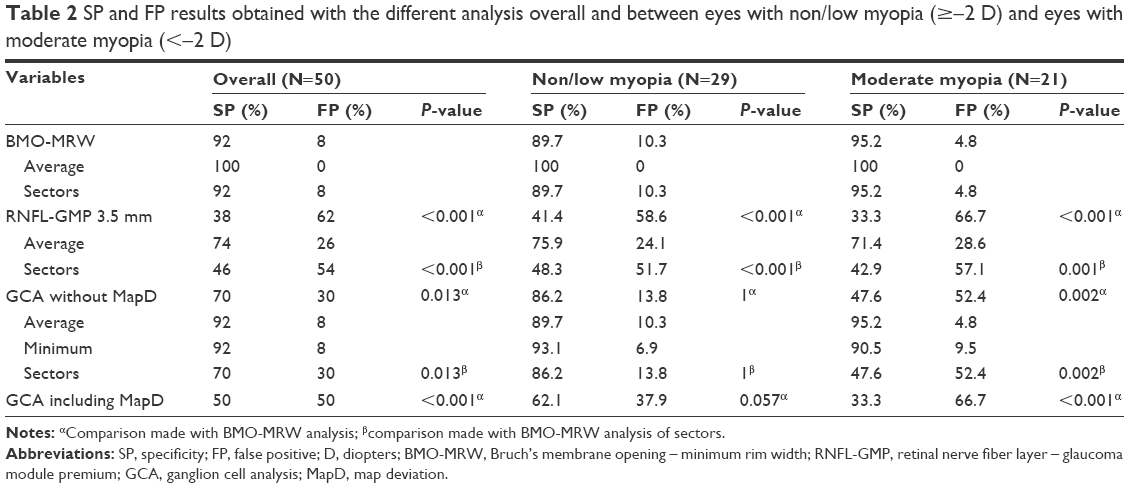 | Table 2 SP and FP results obtained with the different analysis overall and between eyes with non/low myopia (≥−2 D) and eyes with moderate myopia (<−2 D) |
In summary, the overall FP rate with BMO-MRW thickness analysis was significantly lower than that with RNFL-GMP 3.5 mm analysis (8% vs 62%, respectively, P<0.001) after considering eyes with low and moderate myopia. Figure 1 provides a detailed summary of the RNFL and MRW thicknesses with regard to the color code below the 5th percentile (yellow) or 1st percentile (red) for each of the sectors measured with the new GMP by Spectralis.
 | Figure 1 Frequency of false-positive diagnostic classification (FPDC) of (A) retinal nerve fiber layer (central-average and sector) and (B) minimum rim width (central-average and sector) maps, presented as yellow thicknesses (less than the lower 5th percentile of normal distribution) and red thicknesses (less than the lower 1st percentile of normal distribution) color codes. |
FP rate in GCA by Cirrus
The overall frequency of ≥1 FP GCIPL color code in any of the 3 GCA (average, minimum, and sector) maps was 30% (n=15). Ten out of 15 occurred bilaterally (66.6%). Considering the 3 GCA parameters and the map deviation, the FP rate increased to 50%. Eighteen out of 25 (72%) were observed bilaterally.
The deviation map (50%) showed the highest rate of abnormal diagnostic GCA classification, followed by the sector map (30%), minimum thickness (8%), and average thickness (8%). On the sector maps, the superotemporal sector had the highest frequency of FP diagnostic classification (14%), and the inferior sector had no FPs.
Figure 2 represents GCIPL thicknesses with regard to the color code below the 5th percentile (yellow) or 1st percentile (red) for average, minimum, and each of the sectors was measured by GCA Cirrus.
 | Figure 2 Frequency of false-positive diagnostic classification (FPDC) of ganglion cell analysis (average, minimum, and sector maps), presented as yellow thicknesses (less than the lower 5th percentile of normal distribution) and red thicknesses (less than the lower 1st percentile of normal distribution) color codes. |
Among 25 eyes with abnormal GCA deviation map, 5 (20%) and 20 (80%) were classified into groups B and C, respectively. No case showed a pattern to be classified as group A (donut-shaped, round color pattern around the inner annulus).
Among the 20 eyes in group C, 14 (70%), 3 (15%), and 3 (15%) eyes showed an irregular circle at the inferior, superior, or both hemifields, respectively. Among the 5 eyes in group B, 4 eyes (80%) showed abnormal color-coded area in the inferior hemifield and 1 eye (20%) in the superior. Axial length was significantly higher in group C than B (P=0.023).
No statistically significant differences were found in age, BMO area, fovea-to-BMO-center axis, or spherical equivalent between B and C groups.
Comparison between Cirrus and Spectralis
The overall FP rate in any of the GCA parameters by Cirrus was significantly lower than FPs in RNFL protocol by Spectralis (P=0.001). However, the overall FP rate in BMO-MRW by Spectralis was significantly lower than the FP yielded by GCA by Cirrus with (8% vs 50%, P<0.001) and without including the map deviation (8% vs 30%, P=0.013) (Figure 3).
 | Figure 3 In each case, the left row shows the new Glaucoma Module Premium by Spectralis and the right row shows the GCA. |
Differences in specificity between BMO-MRW and GCA were significant in eyes with moderate myopia (Table 2). Considering the spherical equivalent, specificity for BMO-MRW was significantly better than GCA for eyes with moderate myopia (95.2% vs 47.6%, P=0.002 without including map deviation, and 95.2% vs 33.3%, P<0.001 including map deviation) (Table 2).
Associated factors
Association between several demographic and clinical factors and an increase in the incidence of FPs in the color code in univariate GEE model are shown in Table 3. The factors associated with a higher incidence of FPs in any of GCA Cirrus maps with P<0.05 were axial length (odds ratio [OR]: 1.1, P=0.008) and spherical equivalent (OR: 1.1, P=0.004).
 | Table 3 Univariate GEE model for the presence of false-positives in MRW and RNFL classification by Spectralis and GCIPL by Cirrus OCT |
Discussion
Although OCT color-coded maps provide information on the probability of an abnormality being present, careful interpretation is required because healthy individuals can be misclassified as abnormal. Hence, it is critical to compare and establish which analysis is more reliable and to identify the factors associated with the FP rate occurrence.
Kim et al3 reported a 26.2% of FP rate in healthy eyes for all the RNFL measurements including quadrant, clock-hour, and deviation maps by Cirrus. In a previous report,5 we found a significantly higher RNFL FP rate for Cirrus (39%) than for Spectralis (18%), suggesting that Spectralis might be more specific than Cirrus for Caucasians and moderate myopic population. By contrast, the Spectralis RNFL FP rate showed no significant difference when compared to the FP rate by Cirrus GCIPL (13%) and ONH (11%) analysis. Similarly, in healthy moderate myopic eyes, Aref et al4 found a higher FP rate while using RNFL parameters (47%) compared with GCIPL (26%) and ONH parameters (7%) in nonglaucomatous myopic eyes. More recently, Kim et al6 found that 40.4% and 30.8% of healthy eyes showed abnormal diagnostic classifications on any of the GCA and RNFL maps, respectively.
Several reasons have been reported to explain discrepancies in the FP rates which were observed in previous studies.7 Longer axial length has been significantly associated with an increased incidence of FPs on RNFL and GCA analyses.4–6 Aref et al4 suggested an increased risk of detection of a FP for each additional millimeter of axial length by both RNFL and GCIPL analyses.
Apart from axial length, we reported that tilted disc was significantly associated with a higher incidence of FPs in any of the Cirrus RNFL maps (OR =10.24), Spectralis RNFL maps (OR =5.67), and GCIPL parameters (OR =4.30).5 Data about tilted degree were not mentioned in Aref et al’s4 or Kim et al’s6 studies.
The tilted disc is a relatively common anatomical variant with a prevalence ranging from 0.4% to 3.5% of populations that can mimic other clinical conditions.16 The association among tilted disc, myopia, and longer axial length is well known, and recent studies have suggested that the degree of myopic optic disc tilt is correlated with the peripapillary RNFL characteristics measured by the Cirrus HD OCT in healthy individuals.7–10 Therefore, the challenge of distinguishing otherwise healthy myopic eyes with tilted disc from those afflicted with glaucoma is complex. Furthermore, the validated normative data sets for tilted disc do not currently exist.20
Currently, image acquisition and data analysis algorithms report data according to the sector positions relative to the fixed horizontal and vertical axes of the image. As the sector position refers to different anatomic locations, the artificially large interindividual differences decrease the diagnostic precision of imaging devices. Recently, a change paradigm emphasizes the importance to regionalize neuroretinal rim width and peripapillary and macular RNFL thicknesses according to the fovea-to-BMO-center axis to ensure that measurements are distributed according to the pertinent anatomy of the individual eye.11–14
Spectralis spectral domain-OCT incorporates the GMP Edition software with APS that places the circle around the optic disc according to the axis from the fovea to the BMO. GMP provides both the new RNFL protocol (RNFL-GMP) and a new parameter named BMO-MRW that measures neuroretinal rim tissue using the minimum distance from BMO to the ILM. A higher sensitivity in early glaucoma of BMO-MRW compared with BMO-HRW parameter has been reported.11 Furthermore, the structure–function relationship is enhanced compared with the other neuroretinal rim measurements, because of geometrically accurate properties BMO-MRW, indicating a new promising structural marker for the detection of glaucoma.14
The current study found that the Spectralis-GMP BMO-MRW analysis had significantly greater specificity than peripapillary RNFL thickness in both non-myopic and moderately myopic eyes with tilted optic disc and also had greater specificity than Cirrus GCIPL analysis in moderately myopic eyes with tilted optic disc. In other words, OCT-derived BMO-MRW analysis provides significantly greater specificity than RNFL in tilted disc irrespectively of the refractive error, and it is more specific than GCA analysis in tilted disc with moderate myopia.
Kim et al6 categorized FPs in three patterns in map deviation: group A (donut-shaped round area around the inner annulus), group B (island-like isolated area), and group C (diffuse, circular area with an irregular inner margin in either or both hemifields). The axial length showed a significant increasing trend from group A to C, the group C being the most myopic. The current study identified 25 eyes with abnormal GCA deviation map. Unsurprisingly, most of these (80%) were classified into group C and no case as group A (donut-shaped, round, color pattern around the inner annulus). Similar to Kim et al’s study, axial length was significantly higher in group C than B (P=0.023).
Similar to previous studies, a significant association between both axial length and spherical equivalent and GCIPL FP rate was found.4–7 In fact, the specificity using GCA was higher in eyes with non/low myopia compared with moderate myopia including and without including map deviation (62.0% vs 33.3%, P=0.085, and 86.2% vs 47.6%, P=0.005, respectively).
This study has some limitations. It included both the eyes of an individual, and most of the FPs occurred bilaterally (72% and 68% for Cirrus and Spectralis, respectively). However, we used a GEE analysis to minimize this fact.17–19 Eyes with a refractive error >6.0 D of spherical equivalent were excluded because BMO-MRW normative database just included subjects with refraction between +6 and −6 D; therefore, data for high myopia or more severe tilting cannot be extrapolated of these findings.
Another possible source of bias is that the definition of healthy subjects was based on the VF parameters. Some eyes with very early optic nerve abnormality might be misclassified, but this is an unavoidable limitation of this type of study, and it can only be answered with a longitudinal follow-up.
Furthermore, since only specificity was evaluated in the current study, it is not possible to make any meaningful conclusion about the overall diagnostic performance of the new BMO-derived parameters in tilted discs with and without glaucoma.
These findings suggest that the new MRW classification might be more specific for Caucasians and moderate healthy myopic population with tilted disc than RNFL thickness measurements despite to be calculated according to the fovea-to-BMO-center axis. Furthermore, the new MRW map might be more specific than GCA analysis provided by Cirrus; however, further studies with larger sample sizes are necessary.
Conclusion
The results indicate that BMO-MRW thickness measurements had a higher overall specificity than peripapillary RNFL measurements by GMP-Spectralis in eyes with tilted disc with low and moderate myopia, and it performed better than GCA analysis by Cirrus in eyes with tilted disc and moderate myopia.
Author contributions
GR and AC contributed toward the design and conduct of the study; AC and NO toward collection; and GR, AC, and FJMN toward management, analysis, interpretation of the data, and preparation, review, and approval of the manuscript. All authors contributed toward data analysis, drafting and critically revising the paper, gave final approval of the version to be published, and agree to be accountable for all aspects of the work.
Disclosure
The authors report no conflicts of interest in this work.
References
Knight OJ, Girkin CA, Budenz DL, Durbin MK, Feuer WJ; Cirrus OCT Normative Database Study Group. Effect of race, age, and axial length on optic nerve head parameters and retinal nerve fiber layer thickness measured by Cirrus HD-OCT. Arch Ophthalmol. 2012;3:312–318. | ||
Mohammad Salih PA. Evaluation of peripapillary retinal nerve fiber layer thickness in myopic eyes by spectral-domain optical coherence tomography. J Glaucoma. 2012;21:41–44. | ||
Kim NR, Lim H, Kim JH, Rho SS, Seong GJ, Kim CY. Factors associated with false positives in retinal nerve fiber layer color codes from spectral-domain optical coherence tomography. Ophthalmology. 2011;9:1774–1781. | ||
Aref AA, Sayyad FE, Mwanza JC, Feuer WJ, Budenz DL. Diagnostic specificities of retinal nerve fiber layer, optic nerve head, and macular ganglion cell-inner plexiform layer measurements in myopic eyes. J Glaucoma. 2014;23:487–493. | ||
Leal-Fonseca M, Rebolleda G, Oblanca N, Moreno-Montañes J, Muñoz-Negrete FJ. A comparison of false positives in retinal nerve fiber layer, optic nerve head and macular ganglion cell-inner plexiform layer from two spectral-domain optical coherence tomography devices. Graefes Arch Clin Exp Ophthalmol. 2014;252:321–330. | ||
Kim KE, Jeoung JW, Park KH, et al. Diagnostic classification of macular ganglion cell and retinal nerve fiber layer analysis: differentiation of false-positives from glaucoma. Ophthalmology. 2015;122(3):502–510. | ||
Rebolleda G, Leal-Fonseca M, Moreno-Montañés J, Casas-Llera P, Muñoz-Negrete FJ. Re: Kim et al: Diagnostic classification of macular ganglion cell and retinal nerve fiber layer analysis: differentiation of false-positives from glaucoma. Ophthalmology. 2015;122(7):e43–e44. | ||
Hwang YH, Yoo C, Kim YY. Myopic optic disc tilt and the characteristics of peripapillary retinal nerve fiber layer thickness measured by spectral-domain optical coherence tomography. J Glaucoma. 2012;4:260–265. | ||
Hwang YH, Yoo C, Kim YY. Characteristics of peripapillary retinal nerve fiber layer thickness in eyes with myopic optic disc tilt and rotation. J Glaucoma. 2012;6:394–400. | ||
Law SK, Tamboli DA, Giaconi J, Caprioli J. Characterization of retinal nerve fiber layer in nonglaucomatous eyes with tilted discs. Arch Ophthalmol. 2010;128:141–142. | ||
Chauhan BC, O’Leary N, Almobarak FA, et al. Enhanced detection of open-angle glaucoma with an anatomically accurate optical coherence tomography-derived neuroretinal rim parameter. Ophthalmology. 2013;120(3):535–543. | ||
Povazay B, Hofer B, Hermann B, et al. Minimum distance mapping using three-dimensional optical coherence tomography for glaucoma diagnosis. J Biomed Opt. 2007;12(4):041204. | ||
Reis AS, O’Leary N, Yang H, et al. Influence of clinically invisible, but optical coherence tomography detected, optic disc margin anatomy on neuroretinal rim evaluation. Invest Ophthalmol Vis Sci. 2012;53(4):1852–1860. | ||
Danthurebandara VM, Sharpe GP, Hutchison DM, et al. Enhanced structure-function relationship in glaucoma with an anatomically and geometrically accurate neuroretinal rim measurement. Invest Ophthalmol Vis Sci. 2014;56(1):98–105. | ||
Pollet-Villard F, Chiquet C, Romanet JP, Noel C, Aptel F. Structure-function relationships with spectral-domain optical coherence tomography retinal nerve fiber layer and optic nerve head measurements. Invest Ophthalmol Vis Sci. 2014;55(5):2953–2962. | ||
Tay E, Seah SK, Chan SP, et al. Optic disk ovality as an index of tilt and its relationship to myopia and perimetry. Am J Ophthalmol. 2005;2:247–252. | ||
Glassman AR, Melia M. Randomizing 1 eye or 2 eyes: a missed opportunity. JAMA Ophthalmol. 2015;133(1):9–10. | ||
Zeger SL, Liang KY, Albert PS. Models for longitudinal data: a generalized estimating equation approach. Biometrics. 1988;44:1049–1060. | ||
Fan Q, Teo YY, Saw SM. Application of advanced statistics in ophthalmology. Invest Ophthalmol Vis Sci. 2011;52:6059–6065. | ||
Witmer MT, Margo CE, Drucker M. Tilted optic disks. Surv Ophthalmol. 2010;5:403–428. |
 © 2016 The Author(s). This work is published and licensed by Dove Medical Press Limited. The full terms of this license are available at https://www.dovepress.com/terms.php and incorporate the Creative Commons Attribution - Non Commercial (unported, v3.0) License.
By accessing the work you hereby accept the Terms. Non-commercial uses of the work are permitted without any further permission from Dove Medical Press Limited, provided the work is properly attributed. For permission for commercial use of this work, please see paragraphs 4.2 and 5 of our Terms.
© 2016 The Author(s). This work is published and licensed by Dove Medical Press Limited. The full terms of this license are available at https://www.dovepress.com/terms.php and incorporate the Creative Commons Attribution - Non Commercial (unported, v3.0) License.
By accessing the work you hereby accept the Terms. Non-commercial uses of the work are permitted without any further permission from Dove Medical Press Limited, provided the work is properly attributed. For permission for commercial use of this work, please see paragraphs 4.2 and 5 of our Terms.