")
Back to Journals » Risk Management and Healthcare Policy » Volume 17
The Impact of Age Group in Hierarchical Forecasting of Monthly Blood Donations in Zimbabwe
Authors Chideme C , Chikobvu D, Makoni T
Received 11 September 2023
Accepted for publication 7 December 2023
Published 9 February 2024 Volume 2024:17 Pages 311—328
DOI https://doi.org/10.2147/RMHP.S439699
Checked for plagiarism Yes
Review by Single anonymous peer review
Peer reviewer comments 2
Editor who approved publication: Dr Jongwha Chang
Coster Chideme, Delson Chikobvu, Tendai Makoni
Department of Mathematical Statistics and Actuarial Sciences, University of the Free State, Bloemfontein, South Africa
Correspondence: Coster Chideme, Tel +263 777 098 263, Email [email protected]; [email protected]
Background: To meet the blood requirements for transfusion therapy, blood banks need to ensure that blood inventories are maintained at desirable levels. There is a rising global need for optimal ways to manage blood supply and demand using statistical models in blood inventory planning and management. Thus, blood donation forecasting using donor-specific characteristics such as donor type and age is critical in managing the blood bank inventory.
Methods: The monthly blood donation data covering the period 2007 to 2018, collected from the National Blood Service Zimbabwe (NBSZ) was used in this study. The data is first disaggregated based on donor age, and further disaggregation is performed for each age group based on donor type. The hierarchical forecasting approaches, namely the bottom-up, top-down and the optimal combination methods were used in the data analysis. The Error-Trend-Seasonality (ETS) and Autoregressive Integrated Moving Average (ARIMA) methods are used in the hierarchical forecasting approaches to generate the forecasts.
Results: New blood donors account for more than 55% of blood donations in Zimbabwe. The younger donors (16– 29 years) dominate the blood donations, accounting for 89.2% of the donations. Young and new donors account for nearly 50% of the donations. The middle-aged and older donors have lower blood donations. The bottom-up approach under the ARIMA model outperformed all the other approaches. The future projections show that new and young donors will increase in blood donations, regular donations will decline slightly while the occasional donations are projected to remain constant.
Conclusion: Hierarchical forecasting is a unique approach in that the different aggregation levels reveal important features of the blood donation data. The lower percentage of regular donations is worrisome to blood authorities as it points to new blood donors not returning for further donations. Blood authorities need to develop policies that will encourage new and young donor categories to become regular donors.
Keywords: hierarchical forecasting, blood donation, top-down, bottom-up, optimal combinations, forecasting accuracy
Introduction
With better data storage structures, blood bank operations are now capable of generating huge data sets with hierarchical structures. Blood donation forecasts at different time periods and levels for decision making purposes are often required. Forecasting models play a critical role in understanding patterns and projections of future values of the blood donation time series data with minimal errors. Hierarchical forecasting has gained so much recognition in the recent years and allows the time series to be aggregated or disaggregated at different levels into clusters based on specific features of a time series.1,2
Blood donation plays a critical role in the blood transfusion therapy in any health care delivery system. To meet the blood requirements, blood banks need to ensure that blood inventories are maintained at desirable levels through continuous and timed blood collections from eligible donors. Total blood donations at any given blood bank are determined by blood donor characteristics with an inherent hierarchical structure.
There is a rising global need for optimal ways to manage blood supply and demand by using statistical models in blood inventory planning and management.3 Blood donation forecasting is one tool which can be used by blood centre authorities in managing the inventory. In the hierarchical blood donations forecasting, the time series may correspond to blood donations based on donor age groups, which can be further be grouped into donor types. The monthly blood donations can be aggregated by donor age, namely: young, middle-aged and older donors, and further into donor types, such as new, regular, and occasional donors. Accurate projections help in minimising understocking and overstocking of perishable blood components, which can result in shortages or wastages, respectively.4
The uncertainty in blood supply and demand requires statistical methods as part of the decision-supporting tools to provide empirical evidence that optimise the functionality of blood centres.5 One such method is the hierarchical blood donation forecasting model. Accurate blood donation time series forecasting at each level of the identified hierarchies helps in decision making at each hierarchical level.2 These decisions include targeting specific donor age groups in donor recruitment, allocating resources to convert new donors into regular donors and implementing measures to encourage occasional donors to donate blood regularly.
In the blood supply chain, statistical and machine learning methods have been applied to forecast blood donation and demand patterns.6–12 With reference to the available literature, hierarchical time series forecasting has not been applied in blood supply forecasting in Zimbabwe to the best of our knowledge. It is difficult to find any literature in other parts of the world on hierarchical forecasting of blood donations. The current study brings a new paradigm in generating accurate and coherent forecasts for hierarchical blood donation time series.
Time series forecasting methods in the blood supply chain were applied to model demand for packed red blood cells (PRC) in Indonesia.13 The study results established an exponential smoothing (with  ) to be the best forecasting method for the blood component demand.
The importance of accurate and efficient forecasting methods in managing blood supply and demand were highlighted in a study at the Canadian Blood Services.14 The study reduced the blood inventory and ordering quantities, resulting in reduced incidences of shortages and wastages. In a different study, autoregressive integrated moving average (ARIMA) time series model was applied in forecasting blood components demand in China. The study established a seasonal ARIMA  as the best short-term model to simulate the varying trend in red blood cells demand.15
In Taiwan, the supply of blood at blood centres was forecasted using data from the Taiwan Blood Services Foundation.16 The study applied two different techniques in the forecasting, viz; time series and machine learning. The study results showed that the time series forecasting methods (seasonal ESM and ARIMA models) generated more accurate predictions when compared to machine learning algorithms.
Blood demand patterns were forecasted in the blood supply chain using platelets at the Canadian Blood Services.17 The results showed that with limited data, multivariate models (LASSO and LSTM) performed better than univariate models (ARIMA and Prophet). However, with adequate data, ARIMA models produced similar results to multivariate methods.
Several previous hierarchical time series studies have applied three methods in generating forecasts in different disciplines, viz; the top-down, bottom-up and the optimal combinations, with each method having its own merits and demerits.2,18–23 In these studies, ETS and ARIMA have been widely applied as the forecasting methods as they generated precise forecasts.24 Furthermore, these studies have used the MAPE metric in assessing accuracy in forecasting because it is easier to understand.25
The current study is hinged on the determination of a suitable method to reconcile and obtain coherent blood donation forecasts using a hierarchical (data grouped by age and donor type) approach, especially in the case of Zimbabwe. This statistical approach, to the best of our knowledge, has not been explored in any previous blood supply studies.
The current use of expert opinions, experience, and intuition by the blood authorities in Zimbabwe frequently results in bias, subjectivity, and low accuracy in blood donation projections. The aim of the study is to use hierarchical time series forecasting approach leading to the generation of more accurate and coherent blood donation forecasts.
The paper is structured as follows; section 2 describes the methods and materials. Hierarchical forecasting methods are described in section 3. In section 4, results are presented and section 5 presents discussions and conclusions.
Material and Methods
This study uses a blood donation data set in Zimbabwe for the years 2007 to 2018, organised by age and donor type. The approaches used in the aggregation and disaggregation for the hierarchical time series are, namely, bottom-up, top-down and optimal combination methods. The secondary blood donation data used in this study was extracted from the NBSZ donor database. The data was categorised according to blood donor age group [young (less than 30 years), middle aged (30–39 years) and older (above 40 years) and blood donor type (new, regular and occasional)]. The data is schematically presented as a two-level hierarchical structure. At the top of the hierarchy is total blood donations  , followed by donor age (
 ) and donor type (
 ), where
  and
and  as shown in Figure 1. The advantages of this type of grouping after forecasting is: one is able to identify a declining category of donors, and hence corrective action targeting the concerned group.
 |
Figure 1 Blood donation hierarchical structure based on donor status and age. Abbreviations: N, new; R, regular, O, occasional; Y, young; M, middle-aged; A, old/aged. |
Data analysis is performed using the R-package HTS with bottom-up, top-down and optimal combination approaches. The ETS and ARIMA models are used to generate the forecasts since they are capable of accounting for trend and seasonality in the data series, hence giving more accurate forecasts. The top-down approach uses disaggregation proportions according to the historical proportions of the data such as the top-down Gross-Sohl method A (TDGSA), top-down Gross-Sohl method F (TDGSF), and Top-down forecast proportions (TDFP). A spline smoothing approach is performed to help in interpretation of the historical blood donation data.26
Hierarchical Forecasting Methods
In the application of hierarchical time series in forecasting, the most critical step is the selection of a suitable method to reconcile and obtain coherent forecasts.27
Forecasting is done for all the levels and are reconciled so that the lower-level forecasts add up to the higher levels. The reconciliation is performed as a multi-regression problem as follows:

The notation can be simplified to:

where,
yT,t – 13x1-dimensional vector of all the observations in the hierarchy at time t.
 - 13 × 9 summing matrix that aggregates the donor type level series to each hierarchical level
 – 9x1-dimensional vector of all donor type level observations at time t.
The Bottom-Up Method
The bottom-up approach first generates the individual base forecasts at the bottom level of the hierarchy using a forecasting model for example, ARIMA or ETS. The other forecasts in the hierarchy are generated by aggregating the base forecasts upwards through matrix  . The advantage of the bottom-up approach is that no information is lost since forecasts are generated at the lowest or base level of the hierarchy. The total blood donations are calculated by summing up the donations made by each donor and based on age. The approach starts by producing h-step-ahead forecasts for individual bottom level time series (n = 9):

The calculations used for the bottom-up approach in this study are expressed as:


The summing matrix (S) will combine the h-step-ahead forecasts up the hierarchical structure. For the bottom-up approach, the forecast will be combined using the formula:

where k=0,1,2.
The Top-Down Method
The top-down approach generates a forecast for the top level of the hierarchy ( ) and disaggregates it to the different nodes at lower levels through the use of proportions. These proportions include average historical proportions, proportions of the historical averages and forecast proportions.19,22 The major setback of the method is that there is general loss of information resulting in less accurate forecasts being generated at the base or lower levels of the hierarchy.
The most commonly used approach to disaggregate the series to the different nodes at lower levels, is the average historical proportions expressed as:

where j=1,2,…, mk .Every proportion reveals the average of the historical proportions of the bottom level series over time relative to the aggregated series (yt), which is the total blood donations, for  28 Using one of the nodes in Figure 1 and the bottom level series
  as an example, we can have;


Optimal Combination Method
This optimal-combination approach involves making independent forecasts at all levels, which are then reconciled using a linear regression model. The resulting forecasts are coherent and based on weights obtained by solving a system of equations that respect the relationships between the different levels of the hierarchy. This method can estimate the unknown future expected values of the lowest level of the dataset, K. Given a vector of the unknown means ( ), thus,

Since yt represents the vector of all observations at time t while and yk,n+h represents the vector of observations in the bottom level K. The base forecasts ( ) will be presented in a regression format to give:

where  denotes a white noise process with covariance matrix
  which is difficult to find in large hierarchies.29
The unbiased estimator for  is represented by:

The revised forecasts are therefore given by;

The revised forecasts are unbiased since SPS = S and  .
.
The hierarchical forecasting with reconciliation can be written as;
 for a defined matrix P. In this case linear combinations of the base forecasts
  are reconciled and summed by S to give the revised hierarchical forecasts
  .
.
Evaluating Forecast Accuracy
An accuracy measure that outperforms other accuracy metrics in evaluating the model performance is selected from the mean absolute percentage error (MAPE) where:

where yt is the actual blood donations at time t,  is the corresponding forecasted value of blood donations at time t and N is the prediction period.
Results
Table 1 illustrates blood donations by donor type (status) and age categories in percentages.
 |
Table 1 Percentages of Blood Donations by Donor Type and Age |
New donations account for 55.2% of blood donations in Zimbabwe. The younger donors (16–29 years) dominate the blood donations accounting for 89.2% of the blood donations. The lower percentage of regular donations (32.4%) is worrisome and points to the fact that most new blood donors do not return for further donations. This points to donor lapsing as a real threat to blood bank inventory management.
Results from Table 2 show that the young and new donors had the highest average of 2582 blood units which accounts for nearly 50% of the blood donation. The middle-aged occasional and the older occasional donors had the least monthly mean donations of 34 blood units each. For each age category, new blood donations have the highest blood units, followed by regular and lastly the occasional donations. The positive skewness exhibited in the results from younger new donors (YN) to old occasional donors (AO) means that the blood donation distribution is non-normal. The negative kurtosis (platykurtic) shows that more donation data are located near the mean and less values are located on the tails thus no cases of extreme values or outliers.
 |
Table 2 Descriptive Statistics |
A box plot representation of the monthly units of blood donations is shown Figure 2. The box plots illustrate that the units of blood donations in Zimbabwe are dominated by younger donors with younger and new donations (YN) at the top, followed by the younger and regular (YR) and younger and occasional donations. The middle-aged new donations (MN) and the old (AN) new donations have small significance in the blood donation.
 |
Figure 2 Box plots of blood donations by donor status from 2007 to 2018. |
Hierarchical Time Series
The plots of the hierarchical time series with each donation category denoted by a unique colour code as in Figure 3 assist in comprehending the analysis of the hierarchical forecasting structure.
 |
Figure 3 Time series plots of blood donations based on donor status from 2007–2018. Abbreviations: YN, young new; YO, young occasional; YR, young regular; MN, middle-aged new; MR, middle-aged regular; MO, middle-aged occasional; AN, aged new; AR, aged regular; AO, aged occasional; M, middle-aged; A, Aged; N, new; R, regular; O, occasional. |
The plots in Figure 3 show the original blood donation data series at the top (level 0). In the second (middle) plot, the black colour at level 1, represents donations by the younger donors (Y). The middle-aged (M) (blue line) and the older (A) (red) donors’ donations nearly coincide. At level 1, the blood donations by the younger donors are significantly dominant than the other age categories. At level 2, the blood donations by new young donors (YN) (black) lead the donation volumes, followed by regular young donors (YR) (orange) and then occasional young donors (YO) (grey). Donations from middle-aged and the older donors from the new, regular and occasional (MN, MR, MO, AN, AR, AO) are very low. The blood donations exhibit a seasonal trend.
Forecasting Hierarchical Blood Donations Series
The ETS and ARIMA models are used in generating the base forecasts of the future hierarchical blood donations as implemented in the R forecast package.1,29,30
The bottom-up approach is applied across all the donation status categories, and in predicting the blood donations in Zimbabwe over the next 5 years, the bottom-up (BU) approach is also used across all the nine blood donor categories.
Forecasting Accuracy of the Models
Table 3 shows the comparison in MAPE values for the ARIMA and ETS forecasting models for each of the forecasting horizons  months.
 |
Table 3 Hierarchical Blood Donation Forecasting Based on ARIMA and ETS with MAPE |
The smallest average MAPE under each predictive horizon (h) written in bold defines the best forecasting approach. It is evident from Table 2 that the bottom-up approach under the ARIMA model outperformed all the other approaches and has the lowest average MAPE values of 10.84, 17.41 and 17.68 for the forecasting horizons  months respectively. Therefore, the ARIMA forecasting method with a bottom-up approach is used in generating future blood donations forecasts for donor type and donor age time series data.
Table 4 shows the SARIMA and ETS forecasting models for each series used in generating the forecasts.
 |
Table 4 SARIMA and ETS Forecasting Models for Each Series |
Blood Donations Forecasts
Table 5 shows the out-of-sample forecasts for 36 months from the year 2019 and Figure 4 depicts the time series plot for the 60 months ahead forecasts. The bottom-up approach is applied in the forecasting.
 |
Table 5 Out-of-Sample Future Blood Donations Forecasts |
 |
Figure 4 Bottom-up forecasts for the units of blood donations. Abbreviations: YN, young new; YO, young occasional; YR, young regular; MN, middle-aged new; MR, middle-aged regular; MO, middle-aged occasional; AN, aged new; AR, aged regular; AO, aged occasional; M, middle-aged; A, Aged; N, new; R, regular; O, occasional. |
In Figure 4, level 0 represents the monthly total units of blood donations in Zimbabwe. The solid lines represent historical blood donation data while the dashed/dotted lines are the forecasted blood donations. The total series depicts a consistent blood donation pattern in the future. The forecasted donation pattern ensures a steady blood supply in the future assuming a stable demand pattern. At level 1, the upper line (Y-Forecast) is for young donors showing their predominance in blood donations in the next 5 years. The middle-aged donors (M-Forecast) and older donors (A-Forecast) will have very low and similar donations within the next 5 years. At level 2, the new and young blood donors (YN) will increase their donations as projected by an upward trend in the next 5 years and continue to dominate over the other categories. The young and regular (YR) donors are projected to decline in bloods donations in the future as indicated by a downward forecasted trend. This is followed by the young and occasional donors (YO) who exhibit a constant donation pattern into the future. There are no significant variations in blood donations by the middle-aged and older donors in all the donation states of new, regular and occasional. At all the levels, the bottom-up approach shows seasonality in the forecasted blood donations. Therefore, there is a need for blood authorities to develop policies that will encourage new and young donors to become regular donors. Also, measures need to be put in place to encourage occasional donors to become regular blood donors.
Bottom-Up Approach Diagnostic Plots
The bottom-up approach diagnostic plots for the next 60 monthly blood donations forecast are depicted in Figure 5. The density plot, normal quantile to quantile (QQ) plot and the box plot are presented to further validate the forecasting accuracy.
 |
Figure 5 Diagnostic plots for bottom-up approach for 60 monthly blood donations forecasts. |
In Figure 5, the lower end of the distribution (QQ-plot and density plot) shows a small deviation from the normal distribution.
Figure 6 depicts the out-of-sample monthly blood donations trend superimposed with a smoothing spline (blue colour) from January 2019 to December 2023. The smoothing spline was fitted with an estimated  Lambda is a parameter that controls the penalty being imposed on the function. It determines how curvy the function can be. The spline method gives a good estimate of the trend coinciding with the bottom-up ARIMA model. The smoothing spline is used to extrapolate the blood donations into the future giving a smooth trend estimate. The spline approach provides a smooth trend function that helps in interpretation of the historical blood donation data.
 |
Figure 6 Forecast plot of blood donations with superimposed smoothing spline trend. |
The forecasts are smoothed using the penalised cubic smoothing spline function are expressed as:
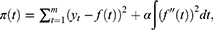
where  is the smoothing parameter,
  is the smooth function,
  is the second derivative of
  . The
. The  -value based on the generalised cross validation (GCV) is
  .
.
To validate the model, Table 6 displays actual and forecast blood donations for 2019 and 2020.
 |
Table 6 Actual and Forecast Blood Donations for 2019 and 2020 |
Table 6 shows good forecast results for the year 2019 with a MAPE value of 15.12%. However, from April 2020, the Covid-19 pandemic had a negative impact on blood collections. In April 2020, the government of Zimbabwe introduced Covid-19 lockdown restrictions to reduce the spread of the pandemic. These measures rendered most blood collection sites inaccessible as movement of people was restricted. The NBSZ had to rely on community based and walk in blood donors and this resulted in a 40% decrease in units of blood collected compared to 2019.
Discussion
Blood donation patterns are generally influenced by many factors including demography, social and haematology. This study focuses on the blood donations based on donor type and age. This study analyses the monthly blood donation units over a period of twelve years from 2007 to 2018 and estimated future blood donations. Zimbabwe’s blood donors are mainly the young donors. The new and young donors are projected to increase their blood donations, the young and regular donations are projected to decline slightly while the young and occasional donations are projected to remain constant. The results also show that there are no significant variations in blood donations by the middle-aged and older donors for all the donor types, viz; new, regular and occasional.
The study findings are useful to the blood centre managers in determining the quantity of blood collections and the donor trends and characteristics. Blood authorities need to develop policies that will encourage new and young donors to become regular donors. Also, measures should be put in place to encourage occasional donors to donate blood regularly.
In the current study, forecast performance of the models was evaluated using the accuracy measure of MAPE. Three approaches are applied and compared, viz; bottom-up approach, top-down approach (TDGSA, TDGSF, TDFP) and optimal combinations approach. The bottom-up approach under the ARIMA model outperformed all the other approaches and has the lowest average MAPE values of 10.84, 17.41 and 17.68 for the forecasting horizons  months respectively. The ARIMA forecasting method with a bottom-up approach is used in generating future blood donations forecasts. The superiority of the bottom-up approach using ARIMA forecasting method in this study is consistent with other studies in different disciplines.21
The predominance of young blood donors in total blood donations is a common feature in most blood centres across the globe.31,32 This study shows the same trend of young donors below the age of 30 years dominating in the blood donations compared to the middle-age and older donors. Over 70% of the blood donations in Zimbabwe is from young donors below the age of 30 years. This concurs with conclusions from a study in Ghana which revealed that more than 70% of the blood donors were classified as young donors.33
New blood donors supply most of the blood in blood banks globally.15 Similar observations were made when it was stated that a small proportion of first-time donors return for further donations.34 This leaves blood centres with no other option but to rely on new donations all the time, yet regular and voluntary blood donors are preferred and are the lifeline of any blood bank.
There is a need to put in place favourable donor retention policies that encourage new donors to become regular donors.35 Contrary to the findings of this study, other researchers concluded that regular donors do in fact have more blood donations than the other types of donors.36,37 Similarly, in a study of Chilean blood donors, it was concluded that blood donors who had previously donated blood were more likely to dominate in future donations.38
In a related study, it was concluded that first-time (new) donors were dominant in blood donations.33 However, this puts the blood bank at a disadvantage due to a high risk of transfusion transmissible infections associated with first-time donors. This study reveals the same pattern of young and first-time donors dominating the blood donations throughout the study period. Therefore, blood centre authorities need to develop policies and interventions that promotes regular donations by encouraging first-time donors to become regular donors.
Other researchers have highlighted that blood donation practice decreased with increase in age.39 In some cases, 70% of the donors being less than 20 years old. The high donor attrition rates associated with young donors requires constant motivation and persuasion to the young to continuously return for further donations.40,41
The application of the developed model yielded good forecast results for year 2019 as indicated by the MAPE value of 15.12%. However, the model did not yield accurate forecasts of blood donations in 2020 and this can be extended up to June 2022 when the Covid-19 restrictions were finally lifted. This means that alternative models could be developed in future studies to analyse the impact of pandemics in forecasting blood donations.
Conclusion
Available literature shows that hierarchical time-series forecasting models have been extensively applied in the recent years and their evidence of increased accuracy in forecasts is associated with their wider application.24 However, it has not been used in the blood supply chain. This study brings a new paradigm in blood donation forecasting using hierarchical time series. This method is known for its ability to generate more accurate forecasts.
The continued dominance of young and new donors in the forecast gives insights to blood managers to put in place sound blood donor retention interventions on the young donors to ensure availability of blood. In this study, the middle-aged and older donors are not significant sources of blood, which is a sharp contrast with the results from developed countries. Therefore, there is need to intensify blood donation awareness programmes targeting the middle-aged and older donors to continue donating blood. These two age categories are potential sources of safe blood because of maturity and responsible behaviour associated with the donors.
Young and first-time blood donors have high attrition rates especially during the first year of their donation career.42 Therefore, the continued dominance of young and new donors in Zimbabwe as depicted in the forecasts, calls for the blood managers to put in place sound blood donor retention interventions on the young donors to ensure the availability of blood in future.
This study has potential limits. The impact of the Covid-19 pandemic distorted the blood donation patterns such that the developed model becomes difficult to apply during the pandemic period. Also, the lack of prior research studies on the topic limited the scope of the current study.
Abbreviations
ANN, Artificial Neural Networks; ARIMA, Autoregressive Integrated Moving Average; ETS, The Error-Trend-Seasonality; HTS, Hierarchical Time Series; LASSO, Least Absolute Shrinkage and Selection Operator; LSTM, Long Short-Term Memory; MAE, Mean Absolute Error; MAPE, Mean Absolute Percentage Error; MSE, Mean Square Error; NBSZ, National Blood Service Zimbabwe; RMSE, Root Mean Square Error; RNN, Recurrent Neural Network; SARIMA, Seasonal Autoregressive Integrated Moving Average; TDFP, Top-Down Forecasting Proportions; TDGSA, Top-Down Gross-Sohl Method A; TDGSF, Top-Down Gross-Sohl Method F.
Data Sharing Statement
The data that support the findings of this study are available from the corresponding author and the National Blood Service Zimbabwe upon reasonable request.
Ethics Approval
The blood donations data used in this study were as approved by the General/Human Research Ethics Committee (GHREC) of the University of the Free State, South Africa (Ethical Clearance number: UFS-HSD2023/1370). Furthermore, permission to use the data was granted by the NBSZ authorities. There was no direct interaction with the individual blood donors and the identity of the blood donors remained anonymous, only identification numbers were used for each donor.
Acknowledgments
The authors would like to extend their sincere gratitude to the NBSZ staff for their critical role in facilitating access to the data used in this study.
Author Contributions
All authors contributed to data analysis, drafting and revising the article. The authors have agreed on the journal to which the article will be submitted, gave final approval of the version to be published, and agree to be accountable for all aspects of the work.
Funding
There is no funding to this study.
Disclosure
The authors declare no conflict of interest.
References
1. Hyndman RJ, Kandahar Y. Automatic time series forecasting: the forest package for R. J Sta Softw. 2008;26:1–22.
2. Hyndman RJ, Ahmed RA, Athanasopoulos G, Shang HL. Optimal combination forecasts for hierarchical time series. Comput Stat Data Anal. 2011;55(9):2579–2589. doi:10.1016/j.csda.2011.03.006
3. Down D. Blood product demand forecast modelling using clinical predictors. McMaster University; 2019. Available from: https://www.blood.ca/en/research/blood-product-demand-forecast-modeling-using-clinical-predictors-0.
4. Turkulainen EV, Wemelsfelder ML, Janssen MP, Arvas M. A robust autonomous method for blood demand forecasting. Transfusion. 2022;62(6):1261–1268. doi:10.1111/trf.16870
5. Meneses M, Santos D, Barbosa-Pόvoa A. Modelling the blood supply chain. Eur J Oper Res. 2023;307(2):499–518. doi:10.1016/j.ejor.2022.06.005
6. Pereira A. Performance of time-series methods in forecasting the demand for red blood cell transfusion. Transfusion. 2004;44(5):739–746. doi:10.1111/j.1537-2995.2004.03363.x
7. Bischoff F, Koch M, Rodrigues PP. Predicting blood donations in a tertiary care center using time series forecasting. Stud Health Technol Inform. 2019;258:135–139.
8. Salviano GR, Filho OSS, Carvalho MA, Cezarino WR. Demand forecasting for blood components distribution of a blood supply chain. IFAC Proc. 2013;46:565–571.
9. Drackley A, Newbold KB, Paez A, Heddle N. Forecasting ontario’s blood supply and demand. Transfusion. 2012;52(2):366–374. doi:10.1111/j.1537-2995.2011.03280.x
10. Akita T, Tanaka J, Ohisa M, et al. Predicting future blood supply and demand in Japan with a Markov model: application to the sex- and age-specific probability of blood donation. Transfusion. 2016;56(11):2750–2759. doi:10.1111/trf.13780
11. Filho OSS, Cezarino W, Salviano GR. A decision-making tool for demand forecasting of blood components. IFAC Proc. 2012;14:1499–1504.
12. Sarvestani SE, Hatam N, Seif M, Kasraian L, Lari FS, Bayati M. Forecasting blood demand for different blood groups in Shiraz using auto regressive integrated moving average (ARIMA) and artificial neural network (ANN) and a hybrid approaches. Sci Rep. 2022;12(1):22031. doi:10.1038/s41598-022-26461-y
13. Lestari F. Managing inventory on blood supply chain. In: Ao SI, Gelman L, Kim H, editors. Transactions on Engineering Technologies. WCE. Singapore: Springer; 2017. doi:10.1007/978-981-13-0746-1_27
14. Li N, Chiang F, Down DG, Heddle NM. A decision integration strategy for short-term demand forecasting and ordering for red blood cell components. Oper Res Health Care. 2021;29. doi:10.1016/j.orhc.2021.100290
15. Guo K, Song S, Qiu L, Wang X, Ma S. Prediction of red blood cell demand for pediatric patients using a time-series model: a single-center study in China.Front Med. 2022;9:706284. doi:10.3389/fmed.2022.706284
16. Shih H, Rajendran S. Comparison of time series methods and machine learning algorithms for forecasting Taiwan blood services foundation’s blood supply. J Healthc Eng. 2019;2019:6123745. PMID: 31636879; PMCID: PMC6766103. doi:10.1155/2019/6123745
17. Motamedi M, Li N, Down D, Heddle N. Demand forecasting for platelet usage: from univariate time series to multivariate models; 2021.
18. Schilling M, Rickmann L, Hutschenreuter G, Spreckelsen C. Reduction of platelet outdating and shortage by forecasting demand with statistical learning and deep neural networks: modeling study. JMIR Med Inform. 2022;10(2):e29978. doi:10.2196/29978
19. Zellner A, Tobias J. A note on aggregation, disaggregation and forecasting performance. Technical report; 1998.
20. Athanasopoulos G, Ahmed RA, Hyndman RJ. Hierarchical forecasts for Australian domestic tourism. Int j Forecasting. 2009;25(1):146–166. doi:10.1016/j.ijforecast.2008.07.004
21. Makoni T, Chikobvu D, Sigauke C. Combined hierarchical tourist arrival forecasts for Great Zimbabwe National Monuments. Afr J Hosp Tour Leis. 2022;11(6):2092–2102. doi:10.46222/ajhtl.19770720.2102
22. Dipankar M, Ranjit P, Soumen P. Hierarchical time-series models for forecasting oilseeds and pulses production in India. Econ Affairs. 2017;62:103–111. doi:10.5958/2230-7311.2017.00045.9
23. Gross CW, Sohl JE. Disaggregation methods to expedite product line forecasting. J Forecasting. 1990;9(3):233–254. doi:10.1002/for.3980090304
24. Strijbosch LWG, Heuts RMJ, Moors JJA. Hierarchical estimation as a basis for hierarchical forecasting. IMA J Manag Math. 2008;19(2):193–205. doi:10.1093/imaman/dpm032
25. Spiliotis E, Petropoulos F, Assimakopoulos V, Calcagnì A. Improving the forecasting performance of temporal hierarchies. PLoS One. 2019;14(10):e0223422. doi:10.1371/journal.pone.0223422
26. Hong T, Xie J, Black J. Global energy forecasting competition 2017: hierarchical probabilistic load forecasting. Int J Forecast. 2019;35:1389–1399. doi:10.1016/j.ijforecast.2019.02.006
27. Hyndman R, King ML, Pitrun I, Billah B. Local linear forecasts using cubic smoothing splines. Aust N Z J Stat. 2005;47(1):87–99. doi:10.1111/j.1467-842X.2005.00374.x
28. Mancuso P, Piccialli V, Sudoso AM. A machine learning approach for forecasting hierarchical time series. Expert Syst Appl. 2021;182:115102. doi:10.1016/j.eswa.2021.115102
29. Morgan L. Forecasting in Hierarchical models; 2015.
30. Hyndman RJ. Forecast: forecasting functions for time series and linear models. R package version 6.1; 2015. Available from: cran.r-package.org/package=forecast.
31. Hyndman R, Athanasopoulos G, Bergmeir C, Caceres G, Chhay L, O’Hara-Wild M. Forecasting functions for time series and linear models; 2018. Available from: http://pkg.robjhyndman.com/forecast.
32. Goldman M, Steele WR, Di Angelantonio E, et al. Comparison of donor and general population demographics over time: a BEST collaborative group study. Transfusion. 2017;57(10):2469–2476. doi:10.1111/trf.14307
33. Marade C, Pradeep A, Mohanty D, Patil C. Forecasting blood donor response using predictive modelling approach. Int J Comput Sci Mobile Comput. 2019;8(4):73–77.
34. Mohammed S, Essel HB. Motivational factors for blood donation, potential barriers, and knowledge about blood donation in first-time and repeat blood donors. BMC Hematol. 2018;18(1). doi:10.1186/s12878-018-0130-3
35. Lourençon Ade F, Almeida RGDS, Ferreira O, Martinez EZ. Evaluation of the return rate of volunteer blood donors. Rev Bras Hematol Hemoter. 2011;33(3):190–194. doi:10.5581/1516-8484.20110052
36. Ownby HE, Kong F, Watanabe K, Tu Y, Nass CC. Analysis of donor return behavior. retrovirus epidemiology donor study. Transfusion. 1999;39(10):1128–1135. doi:10.1046/j.1537-2995.1999.39101128.x
37. Davison TE, Masser BM, Thorpe R. Growing evidence supports healthy older people continuing to donate blood into later life. Transfusion. 2019;59(4):1166–1170. doi:10.1111/trf.15237
38. Elmir WB, Hemmak A, Senouci B. Smart platform for data blood bank management: forecasting demand in blood supply chain using machine learning. Information. 2023;14(31). doi:10.3390/info14010031
39. Salazar-Concha C, Ramírez-Correa P. Predicting the intention to donate blood among blood donors using a decision tree algorithm. Symmetry. 2021;13(8):1460. doi:10.3390/sym13081460
40. Roopadevi V, Nanjaiah R, Karinagannanavar A. A descriptive study on factors affecting blood donation among young adult students. Natl J Community Med. 2017;8(8):487–491.
41. Ou-Yang J, Bei CH, Liang HQ, He B, Chen JY. Effective methods for reactivating inactive blood donors: a stratified randomised controlled study. BMC Public Health. 2020;20:475. doi:10.1186/s12889-020-08594-9
42. Schreiber GB, Sharma UK, Wright DJ, et al. First year donation patterns predict long-term commitment for first-time donors. Vox Sanguinis. 2005;88(2):114–121. doi:10.1111/j.1423-0410.2005.00593.x
 © 2024 The Author(s). This work is published and licensed by Dove Medical Press Limited. The full terms of this license are available at https://www.dovepress.com/terms.php and incorporate the Creative Commons Attribution - Non Commercial (unported, v3.0) License.
By accessing the work you hereby accept the Terms. Non-commercial uses of the work are permitted without any further permission from Dove Medical Press Limited, provided the work is properly attributed. For permission for commercial use of this work, please see paragraphs 4.2 and 5 of our Terms.
© 2024 The Author(s). This work is published and licensed by Dove Medical Press Limited. The full terms of this license are available at https://www.dovepress.com/terms.php and incorporate the Creative Commons Attribution - Non Commercial (unported, v3.0) License.
By accessing the work you hereby accept the Terms. Non-commercial uses of the work are permitted without any further permission from Dove Medical Press Limited, provided the work is properly attributed. For permission for commercial use of this work, please see paragraphs 4.2 and 5 of our Terms.