")
Back to Journals » Medical Devices: Evidence and Research » Volume 17
The Hearing Test App for Android Devices: Distinctive Features of Pure-Tone Audiometry Performed on Mobile Devices
Authors Masalski M
Received 28 December 2023
Accepted for publication 22 March 2024
Published 20 April 2024 Volume 2024:17 Pages 151—163
DOI https://doi.org/10.2147/MDER.S454359
Checked for plagiarism Yes
Review by Single anonymous peer review
Peer reviewer comments 2
Editor who approved publication: Dr Scott Fraser
Marcin Masalski1,2
1Department of Biomedical Engineering, Wroclaw University of Science and Technology, Wroclaw, Poland; 2Department of Otolaryngology Head and Neck Surgery, Wroclaw Medical University, Wroclaw, Poland
Correspondence: Marcin Masalski, Department of Biomedical Engineering, Wroclaw University of Science and Technology, 27 wybrzeże Stanisława Wyspiańskiego street, Wroclaw, 50-370, Poland, Tel +48 515 086 252, Fax +48 71 328 36 96, Email [email protected]
Abstract: The popularity of mobile devices, combined with advances in electronic design and internet technology, has enabled home-based hearing tests in recent years. The purpose of this article is to highlight the distinctive aspects of pure-tone audiometry performed on a mobile device by means of the Hearing Test app for Android devices. The first version of this app was released a decade ago, and since then the app has been systematically improved, which required addressing many issues common to the majority of mobile apps for hearing testing. The article discusses techniques for mobile device calibration, outlines the testing procedure and how it differs from traditional pure-tone audiometry, explores the potential for bone conduction testing, and provides considerations for interpreting mobile audiometry including test duration and background noise. The article concludes by detailing clinically relevant aspects requiring special attention during testing and interpretation of results which are of substantial value to the hundreds of thousands of active users of the Hearing Test app worldwide, as well as to users of other hearing test apps.
Keywords: mobile audiometry, self-testing, hearing threshold, hearing test app
Introduction
The popularity of mobile devices, combined with advances in electronic design and internet technology, has enabled home-based hearing tests in recent years. Specialized audiometers are no longer the only option, as common mobile devices can now be employed for the screening of hearing ability.1–14 The same is true for personal computers.15–17 Self-administered hearing tests at home, tests in general practitioners’ offices, speech-language pathology clinics, neurosensory therapy centers or other facilities, especially in underserved areas, serve as a valuable adjunct to specialized audiological testing.
In 2019, an estimated 1.6 billion individuals across the world experienced hearing loss, accounting for over 20% of the global population.18,19 This figure is projected to increase to 2.45 billion by 2050, attributed to two factors: expanding life expectancy contributing to an aging global community and a significant positive correlation between age and hearing loss.18,19 Untreated and undiagnosed hearing loss can lead to reduced quality of life, social isolation, depression, dementia, and significant financial burdens on health systems.20–23 Mobile hearing testing, which is readily available and simple to use, provides a valuable means of initially identifying hearing loss in resource-limited environments. As the number of individuals affected by hearing loss continues to grow, the role of mobile testing is likely to become increasingly important.
Pure-tone audiometry is the primary hearing assessment to establish auditory thresholds, which determine the minimum sound intensity still audible to the individual.24 The examination employs a sound signal comprising a single sine wave with a frequency range from 250 Hz to 8 kHz. The signal can be easily generated by a personal computer or portable device and delivered through commercially available headphones.
The Hearing Test app for Android devices was released in 2013 and has been continuously developed since then.10 The idea for its development stems from a paper that discussed the feasibility of performing hearing tests on a personal computer calibrated in relation to the hearing threshold of a normal hearing individual.16 Subsequent research utilizing the app has addressed calibration methods,25,26 comparison with pure-tone audiometry in a clinical setting,4,11 and use in epidemiologic studies.19 To date, the application has been downloaded over 2 million times from the Play Store and hosts hundreds of thousands of active users. Therefore, it is reasonable to summarize its developmental findings since they are useful for testing and interpreting the results, most of which are also applicable to hearing tests with other apps. A literature review provides an overview of other mobile apps for hearing testing.27–30
The purpose of this article is to highlight the distinctive aspects of pure-tone audiometry performed on mobile devices, using the publicly available Hearing Test app for Android devices as an example.10 It intends to outline the similarities and differences between conventional pure-tone audiometry and mobile audiometry, while also pointing out the additional factors associated with mobile audiometry that require consideration when interpreting the results.
The article discusses techniques for calibrating mobile devices used for hearing testing, outlines the testing procedure and how it differs from traditional pure-tone audiometry, and explores the potential for bone conduction testing. Specific considerations for interpreting mobile audiometry results are highlighted, stressing the importance of accounting for additional factors, including test duration and background noise. Additionally, the article covers the challenges of masking the untested ear.
In addition to pure-tone audiometry, the Hearing Test app includes a digit-in-noise (DIN) test, which allows speech intelligibility to be assessed rather than hearing threshold.31 The DIN test involves recognizing combinations of digits presented in noise and is a valuable complement to pure tone audiometry. However, this paper does not provide a detailed description of the test, as it is beyond its scope. More information about the DIN test can be found in the review papers.32–34
Calibration
To determine the hearing threshold accurately, an electronic device must generate a sound signal with the correct intensity and frequency parameters. Typically, a digital electronic device creates the sound stimulus from a discrete digital signal sampled at a specific frequency, commonly 44,100 or 48,000 Hz. Since the stimulus frequency is a direct outcome of both the number of samples per period and the accurately controlled sampling rate, the generated stimulus exhibits high frequency accuracy, thereby negating the necessity for calibration in this domain.
However, stimulus intensity is a different matter. In audiometric testing, stimulus intensity is reported on the dB HL (hearing level) scale, which was developed based on research conducted between 1940 and 1950 by American physicist Harvey Fletcher.35 The reference level of the dB HL scale was set at 0 dB HL, which corresponds to the hearing threshold of a normal-hearing person between the ages of 18 and 30, as determined by studies conducted at that time. This scale simplifies audiological diagnosis because the hearing threshold of a normal hearing person is 0 dB HL regardless of frequency. It does, however, introduce special considerations in the design of a device for hearing testing. The dB HL scale characterizes the intensity of the sound perceived by the ear, so in addition to apparent factors such as the performance of the digital-to-analog converter (DAC) or the electromagnetic characteristics of the headphones, the intensity of the sound is also affected by the geometry of the headphones. An in-the-ear headphone, with its diaphragm closer to the eardrum, will produce a signal with a higher perceived loudness than an over-the-ear headphone with the same transducer. For this reason, the audio outputs of electronic devices are not standardized on the dB HL scale, and it is necessary to calibrate the entire set: electronic device plus headphones, for the purpose of hearing testing.25,26 The same situation exists for clinical audiometers. ISO standards for calibration specify, among many other elements, the geometry of the audiometric headphone and also the type of coupling between the earphone and the calibration microphone.36 Calibration results in calibration coefficients that determine the reference sound level at different audiometric frequencies.
In the Hearing Test app, calibration coefficients are determined for frequencies of 250 Hz, 500 Hz, 1 kHz, 2 kHz, 4 kHz, 6 kHz, and 8 kHz. For intermediate frequencies, interpolated coefficients are utilized. The application uses several methods to determine the calibration coefficients, which are described in the following sections.
Laboratory Calibration
Calibration under laboratory conditions can be done using an artificial ear, such as the Brüel & Kjær type 4153 (Brüel & Kjær, Nærum, Denmark). An audiometric earphone with a standardized geometry, such as TDH-39 (Telephonics, Farmingdale, NY, US), is connected to the artificial ear with a coupler that is suitable for both the artificial ear and the earphone. This type of calibration provides the highest accuracy, but can only be applied to an audiometric earpiece with a strictly defined geometry. An alternative for an artificial ear is to calibrate using a head simulator, such as Carl Pro (Ahead Simulations, Kitchener, Canada).37 This simulator is a geometric model of the head that includes the auricle and external ear canal, terminating in a microphone (Figure 1). Calibration employing a head simulator is notably precise and adaptable for most headphones available in the market. However, given the limited availability of the head simulator and the high cost of the device, such calibration for self-administered hearing screening at home is not justified.
 |
Figure 1 Carl Pro head simulator, with permission of Ahead Simulations.37 |
In the Hearing Test app, calibration can be performed under laboratory conditions by adjusting the calibration coefficients. The intensity of the sound signal generated by the application during the test should be measured with a laboratory instrument and then entered into the application using the Adjust Calibration option (see also Calibration with a Reference to Audiogram).
Calibration by a Normal Hearing Individual
Tuning fork tests, such as the Schwabach or absolute bone conduction tests, often determine a patient’s hearing threshold in relation to that of a clinician who is presumed to have normal hearing.38 During the test, the vibrating tuning fork is presented to the patient, and immediately after the sound is no longer audible to the patient, the clinician checks to see whether he or she can hear the tone. An analogous method can be successfully used to calibrate a mobile device for the purpose of a hearing test. The individual performing the calibration determines the hearing threshold, which is then taken as the reference sound level. It has been shown that subjects aged 18–35 years with no history of hearing loss have a hearing threshold close to 0 dB HL and that the inter-individual variability of the threshold is relatively small, with a standard deviation of about 5 dB.25,39 Therefore, a reliable biological calibration can be obtained in this way. The standard deviation of the difference between a test performed with a biologically calibrated device and a clinical audiometer ranges from 7.3 dB to 10.7 dB, depending on the measurement method and settings.16,25 As expected, these values are slightly higher than the test-retest deviation of the clinical audiometer, which is estimated to be about 6 dB.16
In the Hearing Test app, calibration by a person with normal hearing is carried out using the Bekesy method (see further below). The threshold of the person performing the calibration is assumed to be 0 dB HL.
Calibration with a Reference to Audiogram
A mobile device with headphones can also be calibrated using the pure tone audiometry findings from the clinical audiometer. The difference in hearing thresholds between the mobile device and pure tone audiometry provides the correction for the calibration coefficients. The accuracy of this calibration method is slightly lower than that of a normal hearing person. The standard deviation of the difference between the device and the audiometer is determined based on four measurements, consisting of two calibration-related tests, the actual test on the mobile device, and the comparative test conducted on the audiometer. Assuming a standard deviation of 5 dB for a single measurement, the standard deviation of the difference in this case is 10 dB (the measurements are treated as independent variables, so the deviation of the difference is the square root of the sum of the squares).
Predefined Calibration Coefficients
Calibration coefficients that are established for a particular device and headphones can also be applied to other sets of the same model, provided that the differences between sets of the same model are minimal. Studies investigating the applicability of calibration coefficients across different sets of the same model found that the standard deviation of the difference between the mobile test and the pure-tone audiometry was below 8.5 dB.11,26
In the Hearing Test app, calibration coefficients determined for the device and the headphones provided by the manufacturer with the device, or designed by the manufacturer for a particular model but sold separately, are stored in the cloud for reuse. These coefficients are then applied to calculate new ones, which are made available to future users as predefined coefficients. The accuracy of the predefined coefficients depends on the number of calibrations performed. It is expected that after 16 calibrations performed under unsupervised conditions, reliable predefined coefficients can be determined.11,26
For wired headphones, predefined calibration coefficients must be provided for the entire set, consisting of the device and the headphones, since both the DAC in the device and the electroacoustic transducer in the headphones affect the intensity of the sound produced. With wireless headphones, which have both a DAC and electroacoustic transducer, it may be viable to implement the same coefficients independently with the control device. Work is currently underway to investigate such a solution.
Hearing Threshold Assessment
Various techniques can be applied for self-assessment of hearing thresholds in mobile audiometry. The assessment can be performed using either methods adapted from clinical audiometry, such as the ascending method or the Bekesy method, or others developed especially for mobile audiometry like the self-adjustment method.
Pure-tone audiometry typically uses the ascending method to determine a subject’s hearing threshold, defined as the minimum stimulus intensity at which the subject begins to hear.40 At each frequency tested, a suprathreshold stimulus is first presented to familiarize the subject with the signal frequency. The intensity is then decreased in 10 dB steps until the stimulus becomes inaudible. Next, the stimulus intensity is increased in 5 dB steps until it becomes audible. At least two repetitions of the “10 dB down, 5 dB up” algorithm should be performed. If there are differences in the intensity levels obtained in the first two repetitions, the test should be continued until the same threshold is reached in at least 50% of the repetitions. Usually the test starts at 1 kHz and progresses to measure thresholds at other frequencies and in the other ear. It is important to vary the stimulus duration and the pause between stimuli randomly each time, between 1 s and 3 s.
The Bekesy method is another technique used to determine hearing thresholds in clinical audiometry.41 It involves an automated change in the frequency and intensity of the stimulus. The test typically begins at a low frequency, and the stimulus is then gradually increased at a rate of about one octave per minute. If the stimulus is not audible, its intensity increases at a rate of 2.5 dB/s. If it is audible, the intensity decreases at the same rate. To indicate that the stimulus is audible, the subject should press and hold a button. This produces a characteristic folded curve, as shown in Figure 2, which indicates the hearing threshold. In certain extensions of the method, the stimulus can be amplitude modulated at 2 Hz.
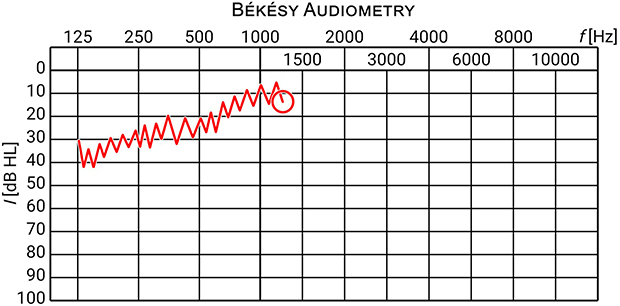 |
Figure 2 Example of a threshold curve in Bekesy audiometry. |
The self-adjustment method was proposed solely for use in mobile audiometry.25 It involves playing a continuous amplitude modulated stimulus that the subject self-adjusts using the “I can hear” and “I cannot hear” buttons to find the intensity of the softest audible tone. Once found, the threshold is confirmed by pressing the “Barely audible” button, and testing proceeds to the next frequency and the other ear (Figure 3).
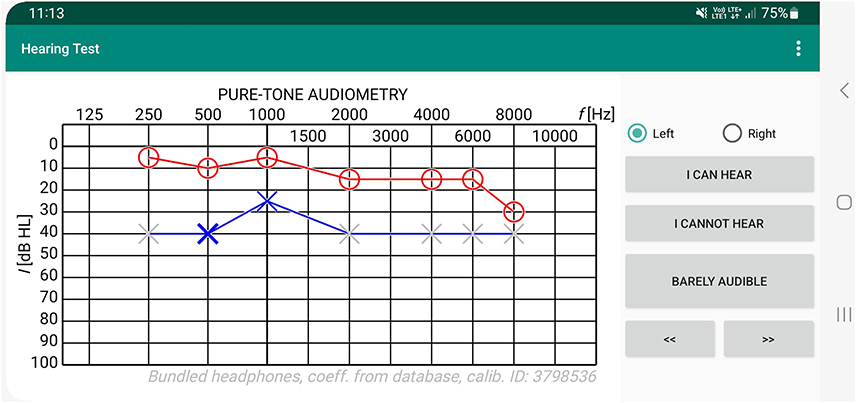 |
Figure 3 A screenshot from the Hearing Test app during the assessment of hearing threshold using the stimulus intensity self-adjustment method. |
A comparison of the ascending method, the Bekesy method, the self-adjustment method and others for the purpose of mobile audiometry can be found in the literature.25 The Bekesy method was found to be the most accurate, with a standard deviation of 3.9 dB (95% CI 3.5–4.3). However, its drawback was the time consumption. The self-adjustment method was found to be the easiest and quickest to perform from the subject’s perspective. Additionally, it yielded a satisfactory test-retest deviation of 5.0 dB (95% CI 4.5–5.6), which was even lower than the test-retest deviation of the ascending method.25
Guided by the above analysis, the Hearing Test application uses a method of self-adjustment of stimulus intensity due to its speed, simplicity and satisfactory accuracy, and the Bekesy method in the calibration performed by a person with normal hearing to maximize the accuracy of the calibration.
Bone-Conduction Hearing Threshold
Hearing thresholds may be evaluated by air conduction or bone conduction. Air conduction testing utilizes headphones equipped with a diaphragm that vibrates, generating sound waves that are then transmitted through the ossicles and into the cochlea in the inner ear. Bone conduction, on the other hand, employs a bone transducer rather then conventional headphones. The transducer transmits vibrations through physical contact with the mastoid bone or forehead, thereby reaching the inner ear by bypassing the outer and middle ear. The difference between the air and bone conduction thresholds is called the air-bone gap (ABG) and should be close to 0 dB in a normal hearing individual. A clinically significant air-bone gap is considered to be 15 dB or greater, indicating impaired sound transmission in the outer or middle ear.
There are significant limitations to the use of a professional bone transducer eg B71 (RadioEar, Middelfart, Denmark), for bone conduction assessment in mobile audiometry (Figure 4).13 The bone transducer is a specialized device that cannot be found in electronic supply stores, and its purchase may not be rationalized for personal use. Additionally, correctly positioning the transducer on the skull’s surface is not apparent and usually requires the assistance of a second person. Connecting the transducer to a mobile device is also a potential issue, as not all mobile devices have a headphone jack. Even if they do, an adapter is still required because in addition to the transducer, an additional earphone must be connected for masking (see the Masking section for more details).13
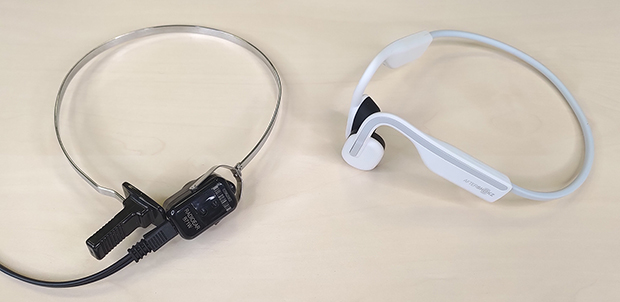 |
Figure 4 B71 bone transducer (left) and AfterShokz OpenMove open-ear headphones (right). Reprinted from Masalski M, Turski M, Zatoński T. Self-assessment of bone conduction hearing threshold using mobile audiometry: comparison with pure tone audiometry. Int J Audiol. 2023;1-8. Creative Commons.13 |
Commercially available open-ear bone headphones, like AfterShokz OpenMove (Shockz, Austin, TX, US), provide an alternative to professional bone transducers (Figure 4).13,42 These headphones have an intuitive design, offer wireless connectivity, and feature two transducers located in the preauricular region over the temporomandibular joint, one of which can be used for masking. Measurements conducted on open-ear headphones demonstrate excellent repeatability, with a standard deviation of hearing threshold test-retest difference measuring 3.33 dB (95% CI 2.92–3.79), in contrast to the B71 professional transducer, which measured 4.75 dB (95% CI 4.21–5.49).13 The better repeatability of open-ear headphones can be attributed to their more convenient placement. However, it should be noted that the transducers of open-ear headphones are placed differently from those of professional transducers. Consequently, the stimulus generated by open-ear headphones follows a different path to the inner ear, involving the osseotympanic component in addition to the bone conduction component.43 This results in underestimating the air-bone gap when compared to a professional transducer. To estimate the air-bone gap from open-ear headphone measurements, the resulting value should be multiplied by 1.5.13 Another consequence of placing the transducer in the preauricular region is inter-individual variability due to anatomical variations, especially the amount of subcutaneous tissue, which may be more abundant in obese men at this location.13
The Hearing Test app allows for the evaluation of bone conduction hearing threshold using open-ear headphones. The app comes with predetermined calibration coefficients for AfterShokz OpenMove headphones. However, it is important to be aware of the aforementioned limitations when interpreting the outcomes.
Masking
In pure-tone audiometry, masking involves presenting additional noise in the non-tested ear so that the stimulus presented in the tested ear is not heard in the non-tested ear. Masking is of particular importance when there is a large threshold difference between the ears, since testing the ear with the worse threshold requires the presentation of high-intensity stimuli that can be heard in the non-tested ear with the better threshold. Narrow-band noise, with a bandwidth of 1/3 or 1/2 octave and a center equal to the stimulus frequency, is commonly used for masking. The intensity of the masking noise is expressed in dB EML (effective masking level) unit, which indicates the maximum stimulus intensity that the masking noise can suppress. During the test, the intensity of the masking noise should be set between the minimum effective masking level, ie the level that masks the stimulus presented in the non-tested ear, and the maximum usable masking level, ie, a level that does not interfere with the perception of the stimulus on the tested ear.
There are several strategies for determining the appropriate level of masking. The most widely used strategy is to calculate the masking level based on interaural attenuation. For instance, it is commonly assumed that in-the-ear headphones have an interaural attenuation of 50 dB. Thus, presenting a stimulus at 60 dB HL with these headphones results in a sensation of 10 dB HL in the non-tested ear, and an effective masking of at least 10 dB EML is required. At the same time, the masking noise must not exceed 110 dB EML or it will mask the stimulus in the tested ear. Besides the interaural attenuation, it is also necessary to consider the ABG when determining the masking level. The ABG in the non-tested ear increases the minimum effective masking level because the masking noise decays in transmission to the cochlea of the non-tested ear and must be louder to effectively mask the stimulus there. Meanwhile, the ABG in the tested ear decreases the maximum usable masking level because the stimulus reaches the cochlea of the tested ear at a lower level and loud masking noise may interfere with its perception. Returning to the previous example, if there is an ABG of 40 dB in the non-tested ear, the minimum effective level will be 10 dB EML + 40 dB = 50 dB EML, whereas if there is an ABG of 40 dB in the tested ear, the maximum usable masking level will be 110 dB EML - 40 dB = 70 dB EML.
In clinical settings, testing typically commences with the better ear and the masker is then adjusted according to the intensity of the stimulus so that the masker intensity is slightly higher than the minimum effective intensity. Another approach is the plateau-seeking method.40 This approach is more time-consuming and is typically employed when there is uncertainty about the appropriate level of masking, which is primarily the case for bone conduction thresholds. Due to its complexity, it is unsuitable for mobile audiometry and its description exceeds the scope of this paper. In mobile audiometry, it is crucial to simplify the masking method to the extent that an untrained person can perform the test either alone or with assistance. This necessitates an automated approach to determine the intensity of the masking noise.
The Hearing Test app utilizes an automated masking algorithm that determines the masker noise level based on the intensity of the stimulus. The masker noise level is configured for air conduction headphones with an interaural attenuation of at least 50 dB and an air-bone gap of no more than 40 dB to ensure that the masker intensity is always between the minimum effective level and the maximum usable level (Table 1). A constant masking level was adopted for stimuli with intensities falling within a range of 20 dB. The difference between masking levels in adjacent ranges was also established at 20 dB.13 Notably, the masking noise intensities determined in this way are also appropriate for testing with open-ear bone headphones, as they fall between the minimum effective and maximum usable levels for these headphones. When determining the masking noise level for open-ear bone headphones, the interaural attenuation value should be taken as that of a professional transducer at the level of 15 dB, and the effect of an air-bone gap should be ignored, since masking is also via bone conduction (Table 1).
 |
Table 1 Masking Levels Applied in the Hearing Test App as a Function of Stimulus Intensity, Along with the Minimum Effective and Maximum Usable Masking Levels Calculated for Air Conduction Headphones and for Open-Ear Bone Headphones |
There are three masking noise options implemented in the Hearing Test app: (a) noise is on for stimuli above 40 dB - the default option for air conduction tests, (b) noise is always on - for bone conduction tests, (c) noise is always off, eg for free field tests.
The advantages of this approach include no manual adjustment of masking noise and no requirement to commence testing with the better ear. Notably, the former greatly simplifies the test and allows for self-testing without extensive training.
Using a constant intensity of masking noise for stimuli belonging to a single interval reduces the risk of the subject responding incorrectly to the masking noise instead of the stimulus. However, a drawback of this method is the coinciding alteration of both the masking noise and stimulus intensity at the interval boundary. To prevent impaired stimulus evaluation during interval transitions, the intensity of the masking noise was changed smoothly at a slow rate.
Test Validation
When performing pure-tone audiometry, audiologists are responsible for ensuring satisfactory test conditions and supervising test execution. In the context of a self-administered hearing test carried out on a mobile device in a home-like setting, verification of the test results is crucial. This involves assessing the level of background noise during the test, evaluating the amount of time taken by the subject to detect the threshold and checking the worse ear threshold for incorrect responses to masking noise.
Background Noise
The background noise level during pure-tone audiometry should not exceed 35 dB (A).40 This allows for the evaluation of hearing thresholds as low as 0 dB HL. Likewise, mobile audiometry should be performed under similar conditions. However, there is a fundamental difference between the ascending method used in pure-tone audiometry and the self-adjustment method used in mobile audiometry. In the former, the stimulus is administered randomly and its presentation may coincide with a transient increase in background noise, whereas in the self-adjustment method, the subject decides whether to listen to the stimulus again and can avoid short-term elevations in background noise.
An investigation of more than 30,000 tests has been undertaken to estimate the effect of background noise on hearing thresholds using the self-adjustment method.19 It has been found that a 25 dB increase in background noise level, from 35 dB (A) to 60 dB (A), is associated with a mean shift in hearing threshold of approximately 8 dB (Figure 5). It is expected that this shift will depend on the degree of hearing loss and will be greater in subjects with normal hearing than in those with severe hearing loss. Another study, which also employed the self-adjustment method, was conducted mainly on subjects with normal hearing (22 subjects with normal hearing, 3 with mild hearing loss) and reported a hearing threshold shift of about 7.5 dB for an identical increase in background noise level, ie from 35 dB(A) to 60 dB(A).44
 |
Figure 5 Change in average hearing threshold as a function of equivalent ambient noise level LEQ(A). Reprinted from Masalski M, Morawski K. Worldwide prevalence of hearing loss among smartphone users: cross-sectional study using a mobile-based app. J Med Internet Res. 2020;22(7). Creative Commons.19 |
The Hearing Test app allows for background noise monitoring using the built-in microphone. To enable this feature, the app must be granted permission to use the microphone, which can be done in the options menu during testing or in the app settings. When enabled, the a-weighted equivalent continuous sound level LEQ(A) is recorded during testing and reported in the statistics along with the result. The LEQ(A) provided by the app should be considered approximate, as it is usually measured outside the range specified in the Android specification, ie outside the range of 72 to 102 dB SPL.45 When interpreting the results, it should be assumed that at LEQ(A) =35 dB (A) or less the hearing threshold is not subject to noise bias, while at LEQ(A) =60 dB (A) the threshold can be shifted by no more than 10 dB.
The use of Active Noise Cancelling (ANC) headphones can reduce the effect of noise on test results. ANC technology captures ambient noise with microphones built into the headphones and generates a sound wave that is phase-reversed so that the sounds cancel each other out. Currently, ANC reduces noise levels by about 30 dB. Headphones with ANC have been successfully used in mobile audiometry performed outside of a quiet booth.6,46
Test Duration
If the hearing threshold is assessed by self-adjustment of stimulus intensity, it is essential to verify the accuracy of the test by analyzing the time taken to complete the test. A threshold assessment that is too quick, eg, 2–3 seconds at a single frequency, cannot be reliable. An attempt has been made to estimate the minimum time required to assess hearing thresholds at a single frequency.19 Based on data from more than half a million tests (637,169 tests to be exact), the average standard deviation of hearing thresholds was calculated as a function of the time taken to assess hearing thresholds at a single frequency (Figure 6). A stabilization of the standard deviation was observed around 7 s (the threshold of 6.7 s was determined heuristically by fitting the data to a lognormal distribution and taking the value with a cumulative probability density of 0.99).19
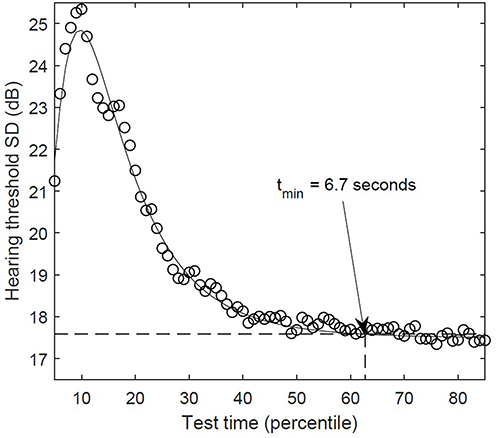 |
Figure 6 Mean standard deviation of hearing threshold in relation to time spent assessing hearing threshold at a single frequency calculated on a group of 637,169 tests. Reprinted from Masalski M, Morawski K. Worldwide prevalence of hearing loss among smartphone users: cross-sectional study using a mobile-based app. J Med Internet Res. 2020;22(7). Creative Commons.19 |
When assessing hearing threshold using other methods like ascending or Bekesy, testing time becomes much less important in validating the test. Within the ascending method, the duration of the test primarily relies on the method’s parameters, namely the duration of the stimulus presentation and the waiting time for a response. However, an increased test time could indicate issues with threshold determination. If the intensities obtained from the “10 dB down, 5 dB up” algorithm are inconsistent, it must be repeated until the same intensity is obtained in at least half of the repetitions. This may extend the test’s overall duration due to the need for multiple repetitions.
The accuracy of the test performed with the Bekesy method can be verified by evaluating the shape of the threshold curve. The presence of large oscillations on the threshold curve indicates a delayed patient response. The test duration remains constant every time since it is directly derived from the rate of frequency change of the stimulus and the frequency range of the test.
Masking
The automatic settings for noise masking require using headphones with interaural attenuation of at least 50 dB, ie, in-the-ear earphones or around-the-ear headphones with surrounding isolation, either active or passive. It is important to ensure that the tests were performed with headphones that have adequate interaural attenuation, especially when a significant hearing asymmetry is suspected. An additional concern regarding masking is the potential overlapping of the worse ear threshold with the boundaries of the masking noise interval, as this might indicate that the subject is incorrectly responding to the masking noise instead of the stimulus. This situation is most likely to occur when the masking noise is activated, which is set by default to 45 dB HL.
Applications
There are numerous applications for pure-tone audiometry conducted with mobile devices. Mobile devices can be used for self-monitoring of hearing in various conditions, including Meniere’s disease, sudden sensorineural hearing loss, fluctuating sensorineural hearing loss, tinnitus, as well as for hearing screening of oneself or other household members, hearing monitoring as part of a telemedicine consultation, or for online hearing aid retailing.11,12,26,42,47 Mobile audiometry can be useful in settings with limited access to professional equipment, for preliminary assessment before visiting a physician, screening tests at schools or workplaces, hearing tests at speech-language pathologists, when qualifying for or undergoing therapy for auditory processing disorders using Neuroflow, Johanasen, Tomatis, and other similar methods.2,4,8,13 Mobile audiometry may be also beneficial in other situations where the purchase of a clinical audiometer is not economically viable and the accuracy offered by mobile audiometry is sufficient.2,4,8 It can also be useful in epidemiology research.19
The benefits of mobile audiometry include a reduction in the resources required for testing, particularly in terms of cost and time, increased availability of testing leading to a decrease in the incidence of hearing loss and related disorders, increased public awareness, and improved quality of life.48 In addition to the general benefits mentioned above, specific applications can provide even more detailed advantages for both individuals with hearing loss and healthcare professionals.
In the course of a hearing test with a mobile device, the following stages can be distinguished: preparation of the device for the test, performance of the test, and interpretation and validation of the results. These stages can be performed by both non-professionals and trained professionals, depending on the application. For example, in the case of self-monitoring of hearing, all stages are usually performed by a person without audiometric training, whereas in the case of hearing assessment as part of auditory processing disorder therapy, a specialist in the field is usually involved in all stages.
User education is highly important to achieve accurate results in mobile audiometry. However, some smartphone users may not be interested in learning about test details, especially before taking the test, and some may even have difficulty understanding the information. Furthermore, providing too much information can easily discourage a user from taking the test. Therefore, the app should be designed to make the test as intuitive as possible to minimize the risk of misconduct. It is also important to acknowledge the user that the test is not a substitute for professional hearing tests and that the role of the app is purely informational. The consequences of misinterpreting results are application-dependent and must be considered when planning to use the app.
For health care professionals, however, it is crucial to be educated not only on how to perform the test correctly but, more importantly, on how to validate the test, as this is necessary when interpreting the results. Validation of the test includes the previously discussed assessment of the reliability of the calibration coefficients, the time consumed to evaluate the stimulus if using the self-adjustment method, and the level of the background noise. For more complex applications, the interpretation of the results must take into account the correction of the air-bone gap measured with open-ear bone headphones and, in the case of asymmetrical hearing loss, the validation of the masking level used. It is also worth recalling the principle of cross-checking in audiometry, which means that the results of a single test are confirmed by other independent measures.
Conclusions
The article discusses the distinctive features of pure-tone audiometry performed on a mobile device, exemplified by the Hearing Test app for Android devices. The following aspects require particular attention during testing and when interpreting the results: (i) reliability of the calibration coefficients, (ii) test duration, (iii) background noise, (iv) automatic masking level, and (v) air-bone gap correction. Not only are they important for performing the test correctly, but they are also necessary for validating the results and assessing the test’s reliability. Educating app users, either individuals with hearing loss or healthcare professionals, about these findings will improve the accuracy and reliability of the mobile audiometry method.
The reliability of the calibration coefficients applied during testing affects the reliability of the entire test. It should be assumed that the predefined coefficients are the most reliable, followed by the coefficients determined by reference to a pure-tone audiogram, and the coefficients determined by reference to the hearing threshold of a normal hearing individual.
Another important factor affecting reliability is the duration of the test. An evaluation of the hearing threshold by means of the self-adjustment method conducted in less than 7 seconds for a single frequency should be considered of limited reliability.
Attention should also be given to background noise during testing. If the noise level exceeds 35 dB (A), the results may be overestimated. For each 15 dB of background noise above 35 dB (A), a possible 5 dB overestimation should be considered. When background noise exceeds 35 dB, the use of Active Noise Cancelling headphones should be encouraged.
The automatic setting for masking noise greatly simplifies the test. However, when testing subjects with asymmetrical hearing loss, it is recommended to use in-the-ear or around-the-ear headphones with interaural attenuation of 50 dB or more. Additionally, careful consideration is required when the hearing threshold of the worse ear overlaps with the intensity at which the masking noise is altered, as the subject may have incorrectly responded to the masking noise instead of the stimulus.
Bone conduction testing can be performed using open ear bone headphones. When estimating the air-bone gap with open ear bone headphones, it is necessary to multiply the resulting value by 1.5, since there is a different conduction path of the stimulus to the inner ear compared to a professional bone transducer.
Disclosure
Dr Marcin Masalski is the developer and owner of the Hearing Test app presented in this article. He has no commercial interest in Brüel & Kjær, Ahead Simulations, or AfterShokz products. He also reports personal fees from Google Payment Ireland Ltd, outside the submitted work.
References
1. Foulad A, Bui P, Djalilian H. Automated audiometry using Apple iOS-based application technology. Otolaryngology. 2013;149(5):700–706. doi:10.1177/0194599813501461
2. Sandström J, Swanepoel DW, Carel Myburgh H, Laurent C. Smartphone threshold audiometry in underserved primary health-care contexts. Int J Audiol. 2016;55(4):232–238. doi:10.3109/14992027.2015.1124294
3. Kam ACS, Sung JKK, Lee T, Wong TKC, Van Hasselt A. Clinical evaluation of a computerized self-administered hearing test. Int J Audiol. 2012;51(8):606–610. doi:10.3109/14992027.2012.688144
4. Renda L, Selcuk ÖT, Eyigör H, Osma Ü, Yılmaz MD. Smartphone based audiometric test for confirming the level of hearing; is it useable in underserved areas? J Int Adv Otol. 2016;12(1):61–66. doi:10.5152/iao.2016.1421
5. Peer S, Fagan JJ. Hearing loss in the developing world: evaluating the iPhone mobile device as a screening tool. South Afr Med J. 2015;105(1):35–39. doi:10.7196/SAMJ.8338
6. Saliba J, Al-Reefi M, Carriere JS, Verma N, Provencal C, Rappaport JM. Accuracy of mobile-based audiometry in the evaluation of hearing loss in quiet and noisy environments. Otolaryngology. 2017;156(4):706–711. doi:10.1177/0194599816683663
7. Yeung J, Javidnia H, Heley S, Beauregard Y, Champagne S, Bromwich M. The new age of play audiometry: prospective validation testing of an iPad-based play audiometer. J Otolaryngol. 2013;
8. Swanepoel DW, Myburgh HC, Howe DM, Mahomed F, Eikelboom RH. Smartphone hearing screening with integrated quality control and data management. Int J Audiol. 2014;53(12):841–849. doi:10.3109/14992027.2014.920965
9. Larrosa F, Rama-Lopez J, Benitez J, et al. Development and evaluation of an audiology app for iPhone/iPad mobile devices. Acta Otolaryngol. 2015;135(11):1119–1127. doi:10.3109/00016489.2015.1063786
10. Masalski M. Hearing Test app for Android. Available from: https://play.google.com/store/apps/details?id=mobile.eaudiologia.
11. Masalski M, Grysiński T, Kręcicki T. Hearing tests based on biologically calibrated mobile devices: comparison with pure-tone audiometry. JMIR Mhealth Uhealth. 2018;6(1). doi:10.2196/mhealth.7800
12. Resler K, Masalski M, Babicki M, Mastalerz-Migas A, Fraczek M. Self-assessment of hearing using a mobile app among COVID-19 patients. J Hear Sci. 2022;12(4):19–25. doi:10.17430/JHS.2022.12.4.2
13. Masalski M, Turski M, Zatoński T. Self-assessment of bone conduction hearing threshold using mobile audiometry: comparison with pure tone audiometry. Int J Audiol. 2023. doi:10.1080/14992027.2023.2208287
14. Szudek J, Ostevik A, Dziegielewski P, et al. Can uHear me now? Validation of an iPod-based hearing loss screening test. J Otolaryngol. 2012;41(SUPPL. 1). doi:10.2310/7070.2011.110089
15. Honeth L, Bexelius C, Eriksson M, et al. An internet-based hearing test for simple audiometry in nonclinical settings: preliminary validation and proof of principle. Otol Neurotol. 2010;31(5):708–714. doi:10.1097/MAO.0b013e3181de467a
16. Masalski M, Krecicki T. Self-test web-based pure-tone audiometry: validity evaluation and measurement error analysis. J Med Internet Res. 2013;15(4):7–12. doi:10.2196/jmir.2222
17. Choi JM, Lee HB, Park CS, Oh SH, Park KS. PC-based tele-audiometry. Telemed E-Health. 2007;13(5). doi:10.1089/tmj.2007.0085
18. Haile LM, Kamenov K, Briant PS, et al. Hearing loss prevalence and years lived with disability, 1990–2019: findings from the Global Burden of Disease Study 2019. Lancet. 2021;397(10278):996–1009. doi:10.1016/S0140-6736(21)00516-X
19. Masalski M, Morawski K. Worldwide prevalence of hearing loss among smartphone users: cross-sectional study using a mobile-based app. J Med Internet Res. 2020;22(7). doi:10.2196/17238
20. Tseng YC, Liu SHY, Lou MF, Huang GS. Quality of life in older adults with sensory impairments: a systematic review. Qual Life Res. 2018;27(8):1957–1971. doi:10.1007/s11136-018-1799-2
21. Blazer DG. Hearing loss and psychiatric disorders. Hear J. 2020;73(11):6. doi:10.1097/01.HJ.0000722492.41773.6c
22. Livingston G, Huntley J, Sommerlad A, et al. Dementia prevention, intervention, and care: 2020 report of the Lancet Commission. Lancet. 2020;396(10248):413–446. doi:10.1016/S0140-6736(20)30367-6
23. Reed NS, Altan A, Deal JA, et al. Trends in health care costs and utilization associated with untreated hearing loss over 10 years. JAMA Otolaryngol Head Neck Surg. 2019;145(1):27–34. doi:10.1001/jamaoto.2018.2875
24. Olusanya BO, Davis AC, Hoffman HJ. Hearing loss grades and the international classification of functioning, disability and health. Bull World Health Organ. 2019;97(10):725–728. doi:10.2471/BLT.19.230367
25. Masalski M, Grysiński T, Krȩcicki T. Biological calibration for web-based hearing tests: evaluation of the methods. J Med Internet Res. 2014;16(1). doi:10.2196/jmir.2798
26. Masalski M, Kipiński L, Grysiński T, Krêcicki T. Hearing tests on mobile devices: evaluation of the reference sound level by means of biological calibration. J Med Internet Res. 2016;18(5). doi:10.2196/jmir.4987
27. Wasmann JW, Pragt L, Eikelboom R, Swanepoel DW. Digital approaches to automated and machine learning assessments of hearing: scoping review. J Med Internet Res. 2022;24(2):e32581. doi:10.2196/32581
28. Chen CH, Lin HYH, Wang MC, et al. Diagnostic accuracy of smartphone-based audiometry for hearing loss detection: meta-analysis. JMIR Mhealth Uhealth. 2021;9(9):1–14. doi:10.2196/28378
29. Melo IMM, Silva ARX, Camargo R, et al. Accuracy of smartphone-based hearing screening tests: a systematic review. Codas. 2022;34(3). doi:10.1590/2317-1782/20212020380
30. Irace AL, Sharma RK, Reed NS, Golub JS. Smartphone-based applications to detect hearing loss: a review of current technology. J Am Geriatr Soc. 2021;69(2):307–316. doi:10.1111/jgs.16985
31. Masalski M, Adamczyk M, Morawski K. Optimization of the speech test material in a group of hearing impaired subjects: a feasibility study for multilingual digit triplet test development. Audiol Res. 2021;11(3):342–356. doi:10.3390/audiolres11030032
32. Kwak C, Seo JH, Oh Y, Han W. Efficacy of the digit-in-noise test: a systematic review and meta-analysis. J Audiol Otol. 2022;26(1). doi:10.7874/JAO.2021.00416
33. Van den Borre E, Denys S, van Wieringen A, Wouters J. The digit triplet test: a scoping review. Int J Audiol. 2021;60(12):946–963. doi:10.1080/14992027.2021.1902579
34. Zokoll MA, Wagener KC, Brand T, Buschermöhle M, Kollmeier B. Internationally comparable screening tests for listening in noise in several European languages: the German digit triplet test as an optimization prototype. Int J Audiol. 2012;51(9):697–707. doi:10.3109/14992027.2012.690078
35. Barbour JM, Fletcher H. Speech and hearing in communication. Notes. 1953;10(4). doi:10.2307/893762
36. The International Organization for Standardization. ISO 389-1: Acoustics — Reference Zero for the Calibration of Audiometric Equipment ; 2017. Available from: https://www.iso.org/standard/69855.html.
37. AHEAD Simulations. Carl-Pro. Available from: https://aheadsimulations.com/products/carl-pro.
38. Clarke TA. On hearing tests. J R Soc Med. 1929;22(3). doi:10.1177/003591572902200328
39. Engdahl B, Tambs K, Borchgrevink HM, Hoffman HJ. Screened and unscreened hearing threshold levels for the adult population: results from the nord-trøndelag hearing loss study. Int J Audiol. 2005;44(4):213–230. doi:10.1080/14992020500057731
40. British Society of Audiology. Recommended Procedure Pure-Tone Air-Conduction and Bone-Conduction Threshold Audiometry with and without Masking; 2018. Available from: https://www.thebsa.org.uk/wp-content/uploads/2018/11/OD104-32-Recommended-Procedure-Pure-Tone-Audiometry-August-2018-FINAL.pdf.
41. Jerger J. Bekesy Audiometry in Analysis of Auditory Disorders. J Speech Hear Res. 1960;3(3). doi:10.1044/jshr.0303.275
42. Li L, Yang J, Chen C, Tsai C. Validation of a personalized hearing screening mobile health application for persons with moderate hearing impairment. J Personal Med. 2021;80:1–10.
43. Sugawara Y, Otsuka S, Nakagawa S. Estimation of relationships between transducer placements and peripheral propagation in cartilage conduction. Annu Int Conf IEEE Eng Med Biol Soc. 2021;2021:6755–6758. doi:10.1109/EMBC46164.2021.9629860
44. Na Y, Joo HS, Yang H, Kang S, Hong SH, Woo J. Smartphone-based hearing screening in noisy environments. Sensors. 2014;14(6):10346–10360. doi:10.3390/s140610346
45. Google LLC and the Open Handset Alliance. Audio: implementation: configuring preprocessing effects. Available from: https://source.android.com/docs/core/audio/implement-pre-processing.
46. Chang HY, Luo CH, Lo TS, Tai CC. Compensated active noise cancellation earphone for audiometric screening tests in noisy environments. Int J Audiol. 2019;58(11):747–753. doi:10.1080/14992027.2019.1627006
47. Abrams HB, Singh J. Preserving the role of the audiologist in a clinical technology, consumer channel, clinical service model of hearing healthcare. Semin Hear. 2023;44. doi:10.1055/s-0043-1769627
48. D’Onofrio KL, Zeng FG. Tele-audiology: current state and future directions. Front Digit Health. 2021;3:788103. doi:10.3389/FDGTH.2021.788103
 © 2024 The Author(s). This work is published and licensed by Dove Medical Press Limited. The full terms of this license are available at https://www.dovepress.com/terms.php and incorporate the Creative Commons Attribution - Non Commercial (unported, v3.0) License.
By accessing the work you hereby accept the Terms. Non-commercial uses of the work are permitted without any further permission from Dove Medical Press Limited, provided the work is properly attributed. For permission for commercial use of this work, please see paragraphs 4.2 and 5 of our Terms.
© 2024 The Author(s). This work is published and licensed by Dove Medical Press Limited. The full terms of this license are available at https://www.dovepress.com/terms.php and incorporate the Creative Commons Attribution - Non Commercial (unported, v3.0) License.
By accessing the work you hereby accept the Terms. Non-commercial uses of the work are permitted without any further permission from Dove Medical Press Limited, provided the work is properly attributed. For permission for commercial use of this work, please see paragraphs 4.2 and 5 of our Terms.