")
Back to Journals » Clinical and Experimental Gastroenterology » Volume 17
TCHH as a Novel Prognostic Biomarker for Patients with Gastric Cancer by Bioinformatics Analysis
Received 11 December 2023
Accepted for publication 23 February 2024
Published 26 February 2024 Volume 2024:17 Pages 61—74
DOI https://doi.org/10.2147/CEG.S451676
Checked for plagiarism Yes
Review by Single anonymous peer review
Peer reviewer comments 2
Editor who approved publication: Professor Andreas M. Kaiser
Fu Yu,1 Li Xia Zhao,2 Shangqi Chu3
1Department of Medical Oncology, Mingguang People’s Hospital of Anhui Province in China, Chuzhou, 239400, People’s Republic of China; 2Department of Radiation Oncology, Jieshou People’s Hospital of Anhui Province in China, Fuyang, 236500, People’s Republic of China; 3Department of Medical Oncology, Nantong Haimen District People’s Hospital, Nantong, Jiangsu Province, 226100, People’s Republic of China
Correspondence: Shangqi Chu, Department of Medical Oncology, Nantong Haimen District People’s Hospital, Nantong, Jiangsu Province, 226100, People’s Republic of China, Tel/Fax +86-513-82263620, Email [email protected]
Background: This study aims to investigate the clinicopathological significance and prognostic value of Trichohyalin (TCHH) in gastric cancer patients through bioinformatics analysis.
Materials and Methods: Data on TCHH expression and clinicopathological information were sourced from The Cancer Genome Atlas (TCGA). The Wilcoxon signed-rank test was used for evaluating the correlation between TCHH mRNA expression levels and clinicopathological features. The predictive significance of TCHH mRNA expression for overall survival (OS), disease-specific survival (DSS), and progression-free interval (PFI) in patients with gastric cancer was assessed using Cox regression models. Furthermore, measures of immune cell infiltration in gastric cancer were made, and studies of gene ontology (GO) and Kyoto Encyclopedia of Genes and Genomes (KEGG) enrichment were also carried out to investigate the possible roles of TCHH in patients with gastric cancer.
Results: Compared to normal tissues, gastric cancer had a considerably higher expression of TCHH mRNA (P < 0.05). Wilcoxon analysis revealed a significant association between TCHH mRNA expression and the pathologic M stage (P = 0.017). High TPMT mRNA levels were also correlated with worse OS, DFS, and PFI in gastric cancer patients (both P < 0.05). TCHH showed significant negative correlations with the levels of NK CD56dim infiltration (r = − 0.157, p = 0.002), Th17 cells infiltration (r = − 0.235, P < 0.001), and Th2 infiltration (r = − 0.195, P < 0.001). Furthermore, enrichment analysis indicated potential involvement in intermediate filament cytoskeleton organization, DNA methylation in gamete generation, cell-cell recognition, and G protein-coupled peptide receptor (GPCRs) activity.
Conclusion: The level of TCHH mRNA may serve as a novel prognostic biomarker for gastric cancer patients.
Keywords: gastric cancer, TCHH, biomarker, prognosis, bioinformatics
Introduction
Globally, stomach cancer is one of the most common malignant tumors in the digestive system. It ranks fifth in terms of its annual incidence rate, accounting for 5.6% of all newly diagnosed cancers, and fourth in terms of cancer mortality rate, accounting for 7.7% of all cancer deaths.1 In China, gastric cancer holds the third position in both incidence rate and mortality rate.2,3 Factors such as unbalanced economic development and dispersed population distribution in China have hindered the widespread adoption of early screening for gastric cancer, resulting in advanced-stage gastric cancer becoming the predominant type among patients in China. Despite significant advancements in medical technologies, including surgery, intervention, chemotherapy, radiotherapy, and targeted therapy, the risk of recurrence and metastasis remains for gastric cancer patients. With less than 30% of patients surviving for five years after treatment, the efficacy of advanced-stage stomach cancer treatment is still inadequate.4,5 Finding novel markers that can forecast a patient’s prognosis for stomach cancer is therefore crucial.
Trichohyalin (TCHH) is an intermediate filament-associated protein found in the hair follicle, first discovered by Rothnagel in 1986.6 The human TCHH protein consists mainly of two N-terminal EF-hand domains, three different types of long internal repeats, and a non-structured short C-terminal tail.7 TCHH functions as a calcium-binding protein, a precursor of the cornified cell envelope, and an intermediate filament-associated protein. It has been associated with various hair or epidermal growth-related disorders, such as trichothiodystrophy and skin keratinization diseases.8,9 Emerging studies have demonstrated the significant involvement of TCHH in various types of tumors, establishing its strong correlation with tumor initiation, progression, and prognosis.10–13 However, limited literature exists regarding the expression level of TCHH in gastric cancer. Additionally, the relationship between TCHH and clinicopathological characteristics remains poorly understood, and its prognostic value in gastric cancer patients requires further investigation.
Using publically accessible datasets, our goal in this study was to examine the expression of TCHH and its relationship to clinicopathological information in patients with gastric cancer. Our analysis included a comparison of TCHH expression levels between normal tissue and gastric cancer, as well as an assessment of its differential expression across various clinicopathological characteristics. Furthermore, we sought to evaluate the prognostic value of TCHH by analyzing disease-specific survival (DSS), progression-free interval (PFI), and overall survival (OS). Additionally, we explored the potential functional roles of TCHH, including its association with immune infiltration in gastric cancer. To further elucidate its molecular mechanisms, we conducted Gene Ontology (GO) and Kyoto Encyclopedia of Genes and Genomes (KEGG) pathway enrichment analyses.
Materials and Methods
Data Accessing and Preparing
From The Cancer Genome Atlas (TCGA, https://cancergenome.nih.gov/), the TCGA-STAD dataset was obtained. Transcripts Per Kilobase of exon model per Million mapped reads (TPM), which is a measure of transcript abundance, was used to determine the expression levels of TCHH in the TCGA-STAD dataset. The results were normalized using log2(TPM+1). The database yielded quantifiable information on gender, age, pathological TNM stage, histologic grade, and residual tumor. Patients with gastric cancer who did not contain clinical information were excluded. For the statistical study, R version 4.2.1 was utilized.
Immunohistochemical Analysis of TCHH in Gastric Cancer
Information about the expression and location of human proteins in different tissues and organs can be found using the online resource “human protein atlas” (HPA) (https://www.proteinatlas.org). Immunohistochemical staining data from HPA were used to assess the differential expression of TCHH protein in gastric cancer.14,15
Associations Between TCHH Expression and Different Clinical Characteristics in Gastric Cancer
The expression levels of TCHH were compared between normal tissues and gastric cancer in the TCGA-STAD datasets. Additionally, the associations between TCHH expression and distinctive clinicopathological groups were investigated using the Wilcoxon signed-rank test in R software. A significance level of P < 0.05 was considered statistically significant.
Survival Prognosis Analysis
Based on the median score of TCHH expression, patients in the TCGA-STAD dataset were categorized into high or low expression groups in order to investigate the relationship between TCHH mRNA level and the risk of survival time in gastric cancer. Cox regression analysis was used to evaluate the prognostic significance of TCHH, including DSS, OS, and PFI. The survminer tool in R software was utilized to display the results, and a significance level of P < 0.05 was deemed statistically significant.
Immune Infiltration Analysis
The level of immune infiltration was determined using a total of 24 immune cells, and the relative enrichment score of these immune cells in the stomach was evaluated by GSEA, which was carried out using the R package GSVA.16,17 The study employed Spearman correlation analysis to examine the relationship between the expression of TCCH and these immune cells. The Wilcoxon rank-sum test was implemented to evaluate the differences in immune infiltration levels between the groups with high and low TCCH expression, and a P value of under 0.05 was deemed statistically significant.
Differentially Expressed Gene Analysis
Patients with gastric cancer in TCGA were categorized into high and low TCH expression groups based on the median score of THH expression. The differentially expressed gene (DEG) analysis between these two groups was carried out using the R package DESeq2, with adjusted P value < 0.05 and | log2-fold-change (FC) |> 1 set as the DEG thresholds.18
Co-Expression Gene Analysis of TCHH in Gastric Cancer
Gene co-expression patterns were visualized using heatmaps based on a |Spearman correlation coefficient| > 0.2 cutoff in R software. The top 15 genes that positively and negatively correlated with TCHH expression in gastric cancer were explored, along with displaying the relationship between TCHH and the top 9 genes.
Gene Ontology Enrichment Analysis of TCHH in Gastric
Using the R package ggplot2 (version 3.3.6), enrichment analysis of Gene Ontology (GO) categories, such as cell component (CC), biological process (BP), and molecular function (MF), and Kyoto Encyclopedia of Genes and Genomes (KEGG) pathway analysis, were carried out for the differentially expressed genes (DEGs).19 Statistical significance was determined for enriched function or pathway terms that had an adjusted p-value < 0.05 and |log2-fold-change (FC)| > 1.
Construction of the Nomogram and Calibration of Patients
Using multivariate Cox analysis, a nomogram was created based on specific clinicopathological characteristics in order to predict the overall survival probability. While the nomogram’s discriminating power was measured with the concordance index (C-index), calibration plots were utilized to evaluate the nomogram’s performance. The R package RMS (version 4.2.1) was used to create the nomogram and calibration graphs.
Results
The Expression of TCHH mRNA Was in Pan-Cancer and Gastric Cancer
The pan-cancer analysis revealed that the expression of TCH was upregulated in the majority of cancer types, including esophageal carcinoma, kidney renal papillary cell carcinoma, lung squamous cell carcinoma, stomach adenocarcinoma, thyroid carcinoma, breast invasive carcinoma, cervical squamous cell carcinoma, colon adenocarcinoma, and uterine corpus endometrial carcinoma. On the other hand, TCHH expression was reduced in the following cancer types: glioblastoma multiforme, kidney chromophobe, liver hepatocellular carcinoma, and lung adenocarcinoma.(Figure 1A).
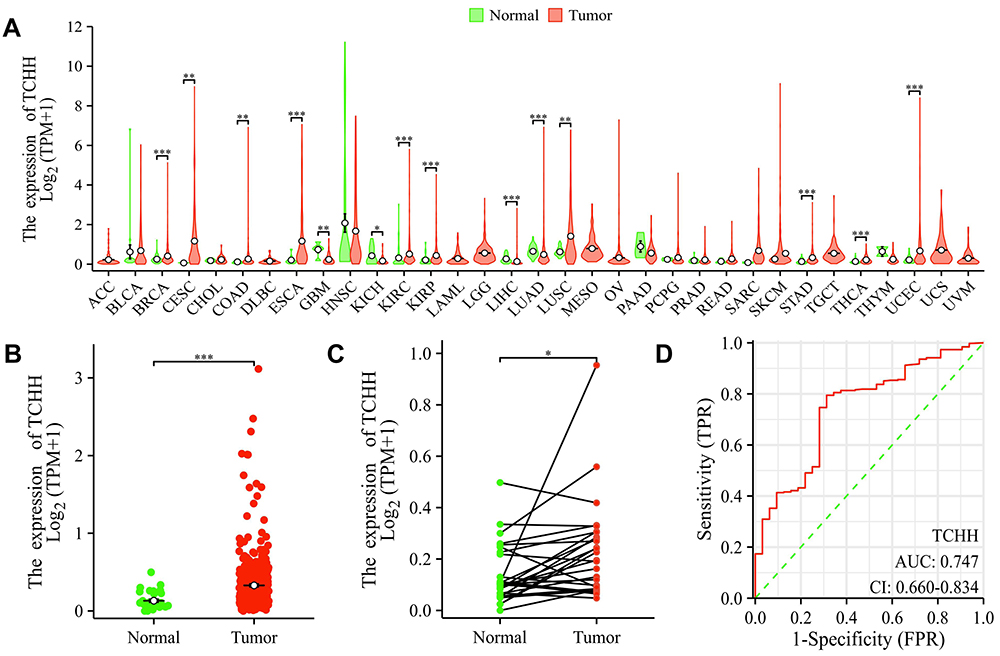 |
Figure 1 TCHH expression levels in gastric cancer and pan-cancers. (A) TCHH expression in pan-cancers and normal tissues in TCGA databases. The expression of TCHH in gastric cancer in comparison to non-matched (B) and matched (C) normal tissues, as well as ROC curves (D) for classifying gastric cancer and normal gastric tissues. **p < 0.01; ***p < 0.001; *p < 0.05. |
The expression of TCHH mRNA in primary gastric adenocarcinoma was considerably higher than in non-paired and paired normal gastric tissues, respectively, based on the analytical results of the TCGA-STAD dataset (both p < 0.05, Figure 1B and C). Furthermore, the ROC curve demonstrated that the expression of TCH had a strong predictive ability to distinguish gastric cancer tissues from normal tissues, with an area under the curve (AUC) of 0.747 (95% confidence interval [CI]=0.660–0.834) (Figure 1D).
The expression of TCHH in normal and gastric cancer tissues was analyzed utilizing the HPA database in order to figure out its expression in more detail. The results of the IHC labeling indicated that the cytoplasmic/membranous cells of gastric cancer had a substantial amount of TCHH. Furthermore, Figure 2 reveals that the majority of patients with gastric cancer had moderate to high TCHH staining (5/12), while the minority had low staining (3/12).
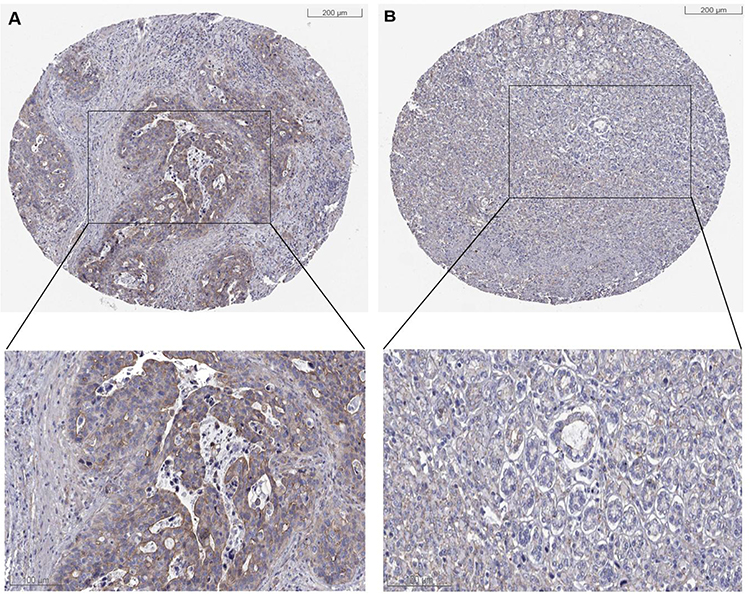 |
Figure 2 Immunohistochemical staining of TCHH in gastric cancer. The TCHH was high (A) and low (B) expressed in gastric cancer. |
Association Between TCHH and Clinicopathological Characteristics
Our cohort comprised 375 patients with stomach cancer who had RNA sequencing data and clinical information available. Of these, 32 patients had matched neighboring normal tissue samples that were sourced from the TCGA-STAD dataset. As shown in Table 1, 375 gastric cancer patients contain 134 female and 241 male patients. Stage I and II were found in 61 patients in the TCHH-high group. The number of patients with positive lymph node metastasis was 121, and 125 in TCHH-high or TCHH-low group, respectively. 18 patients had H pylori infection, and 25 patients had distant metastasis. The elevated expression of TCHH was significantly associated with pathologic M stage (P = 0.017).
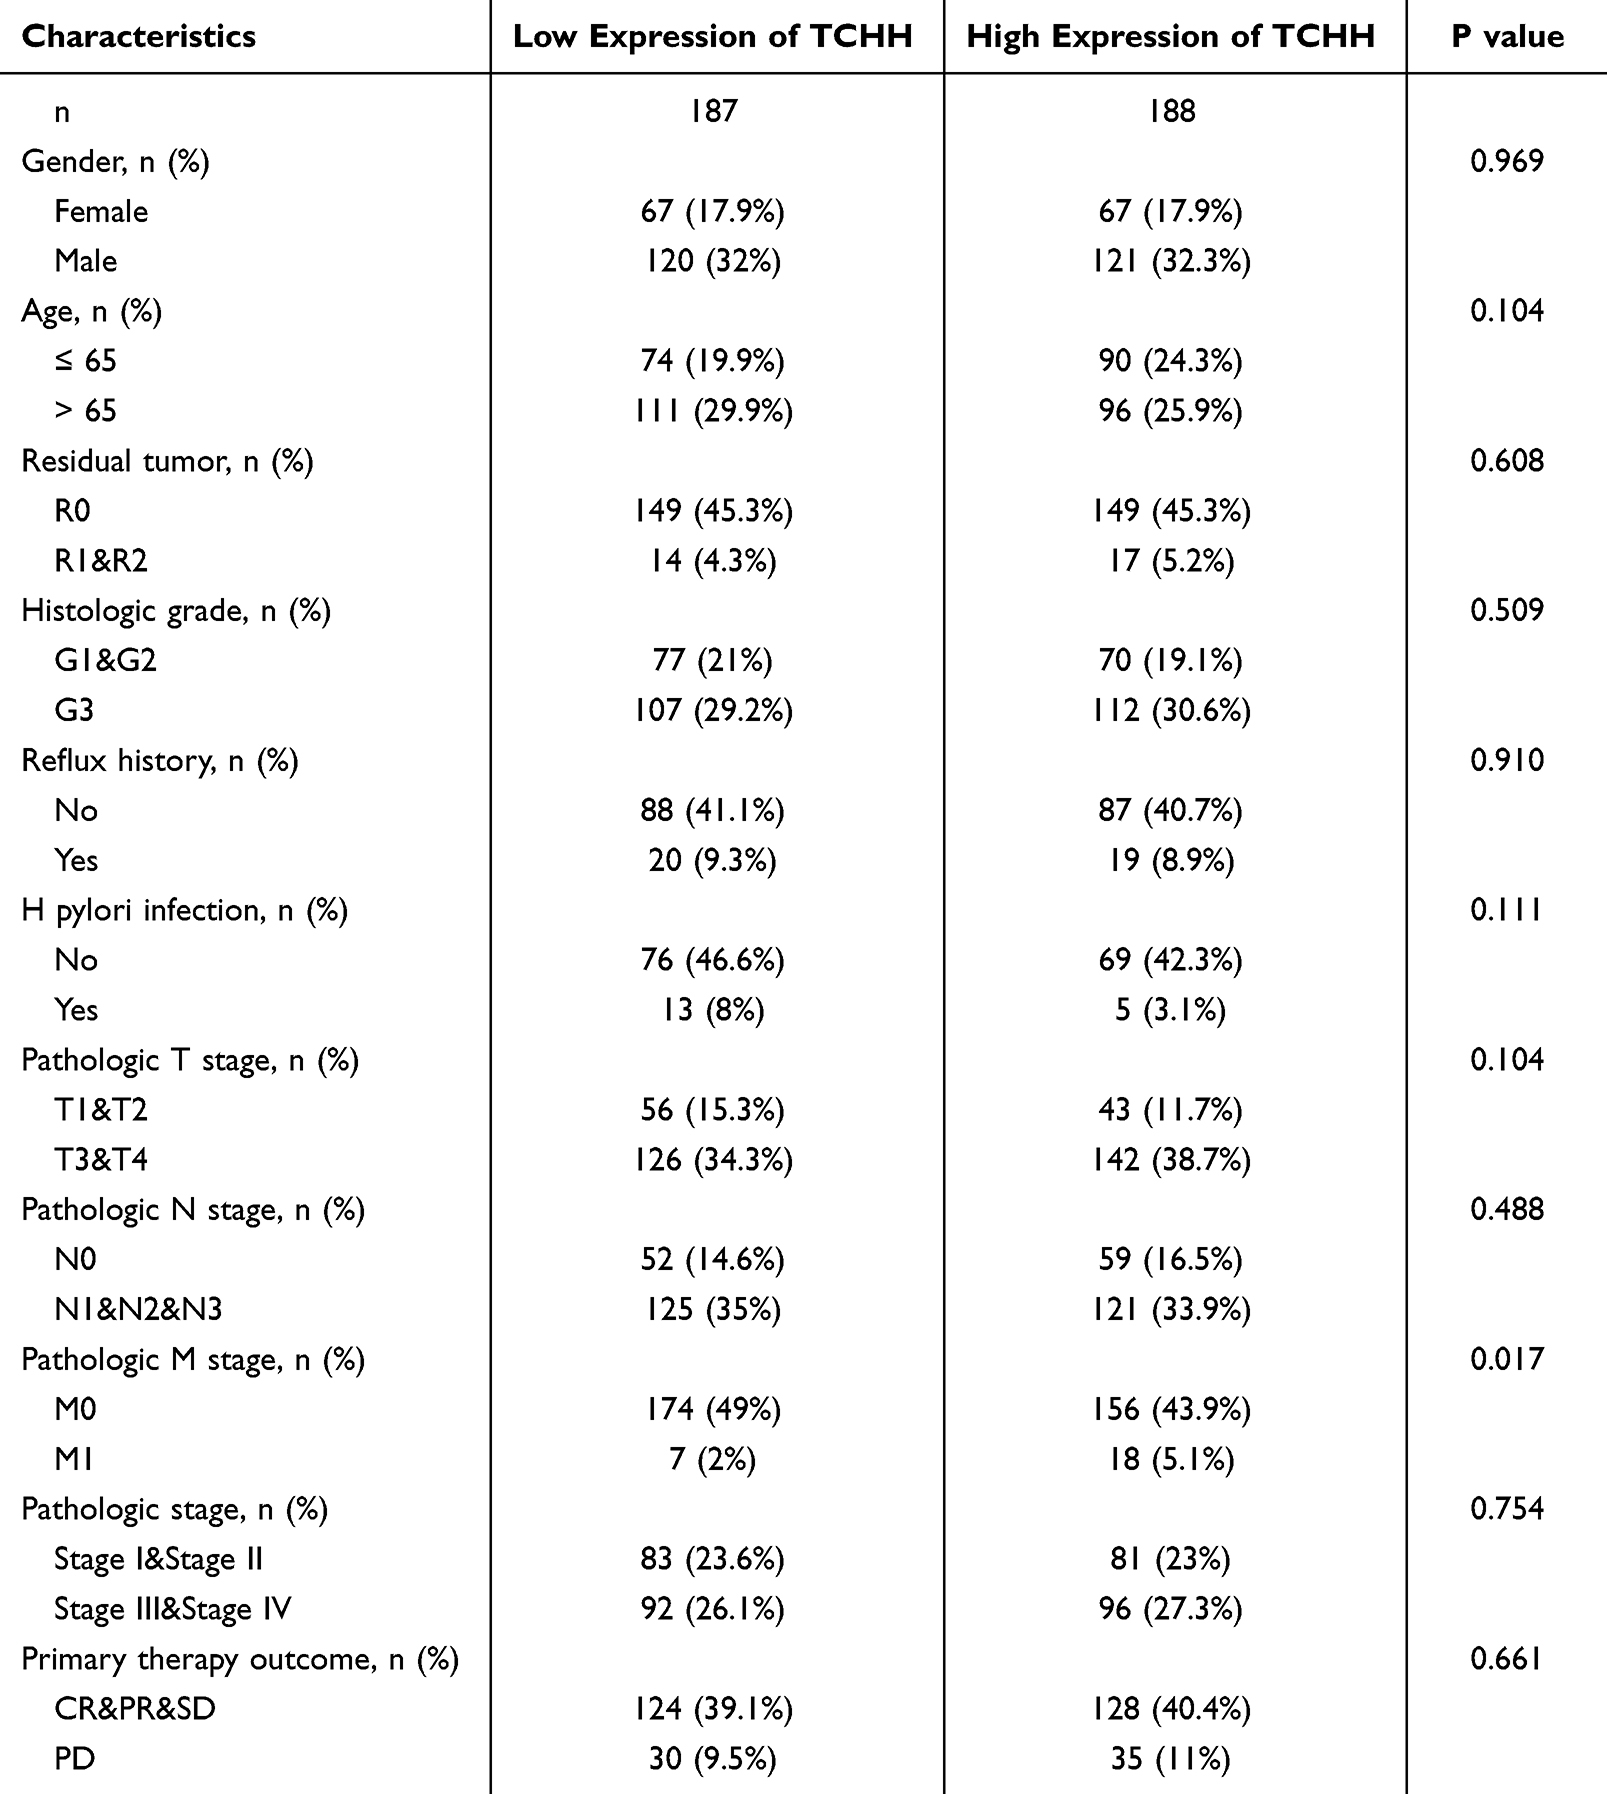 |
Table 1 The Clinicopathological Characteristics of Patients in the TCGA-STAD Dataset |
Survival Analysis of Gastric Cancer Patients Concerning TCHH Expression
Survival studies were conducted to investigate the potential prognostic value of TCHH mRNA level in gastric cancer patients. The findings indicated that, in the TCGA-STAD dataset, patients with TCHH low had improved DSS, PFI, and OS compared to those with TCHH high (all P < 0.05, Figure 3).
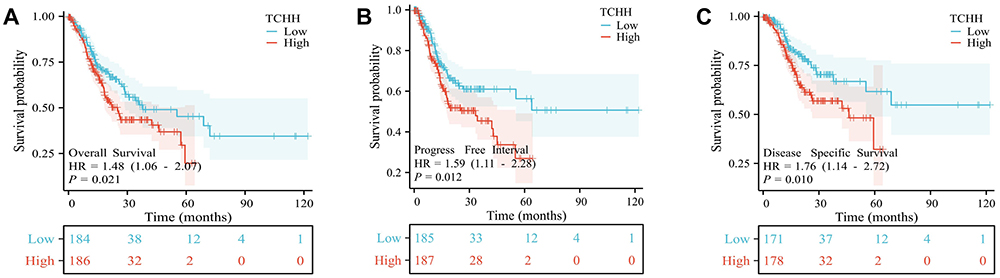 |
Figure 3 Survival analyses of OS, PFI, and DSS based on the expression of TCHH mRNA in the TCGA-STAD datasets. OS (A), PFI (B), and DSS (C) curve of patients with gastric cancer based on TCHH mRNA expression. |
Moreover, the univariate analysis showed a strong correlation between the OS of gastric cancer patients and the following factors: age, residual tumor, pathologic T, pathologic N, pathologic M, and pathologic stage, primary therapy result, and the expression of TCHH. (all P<0.05, Table 2) DSS of individuals with gastric cancer was found to be substantially correlated with residual tumor, pathologic T, pathologic N, pathologic M, and pathologic stage, as well as primary therapeutic result TCHH, according to the univariate analysis. (all P<0.05, Table 3) The univariate analysis showed a significant relationship between PFI of gastric cancer patients and residual tumor, histologic grade, pathologic T stage, pathologic N stage, pathologic M stage, and main therapeutic outcome (all P<0.05, Table 4).
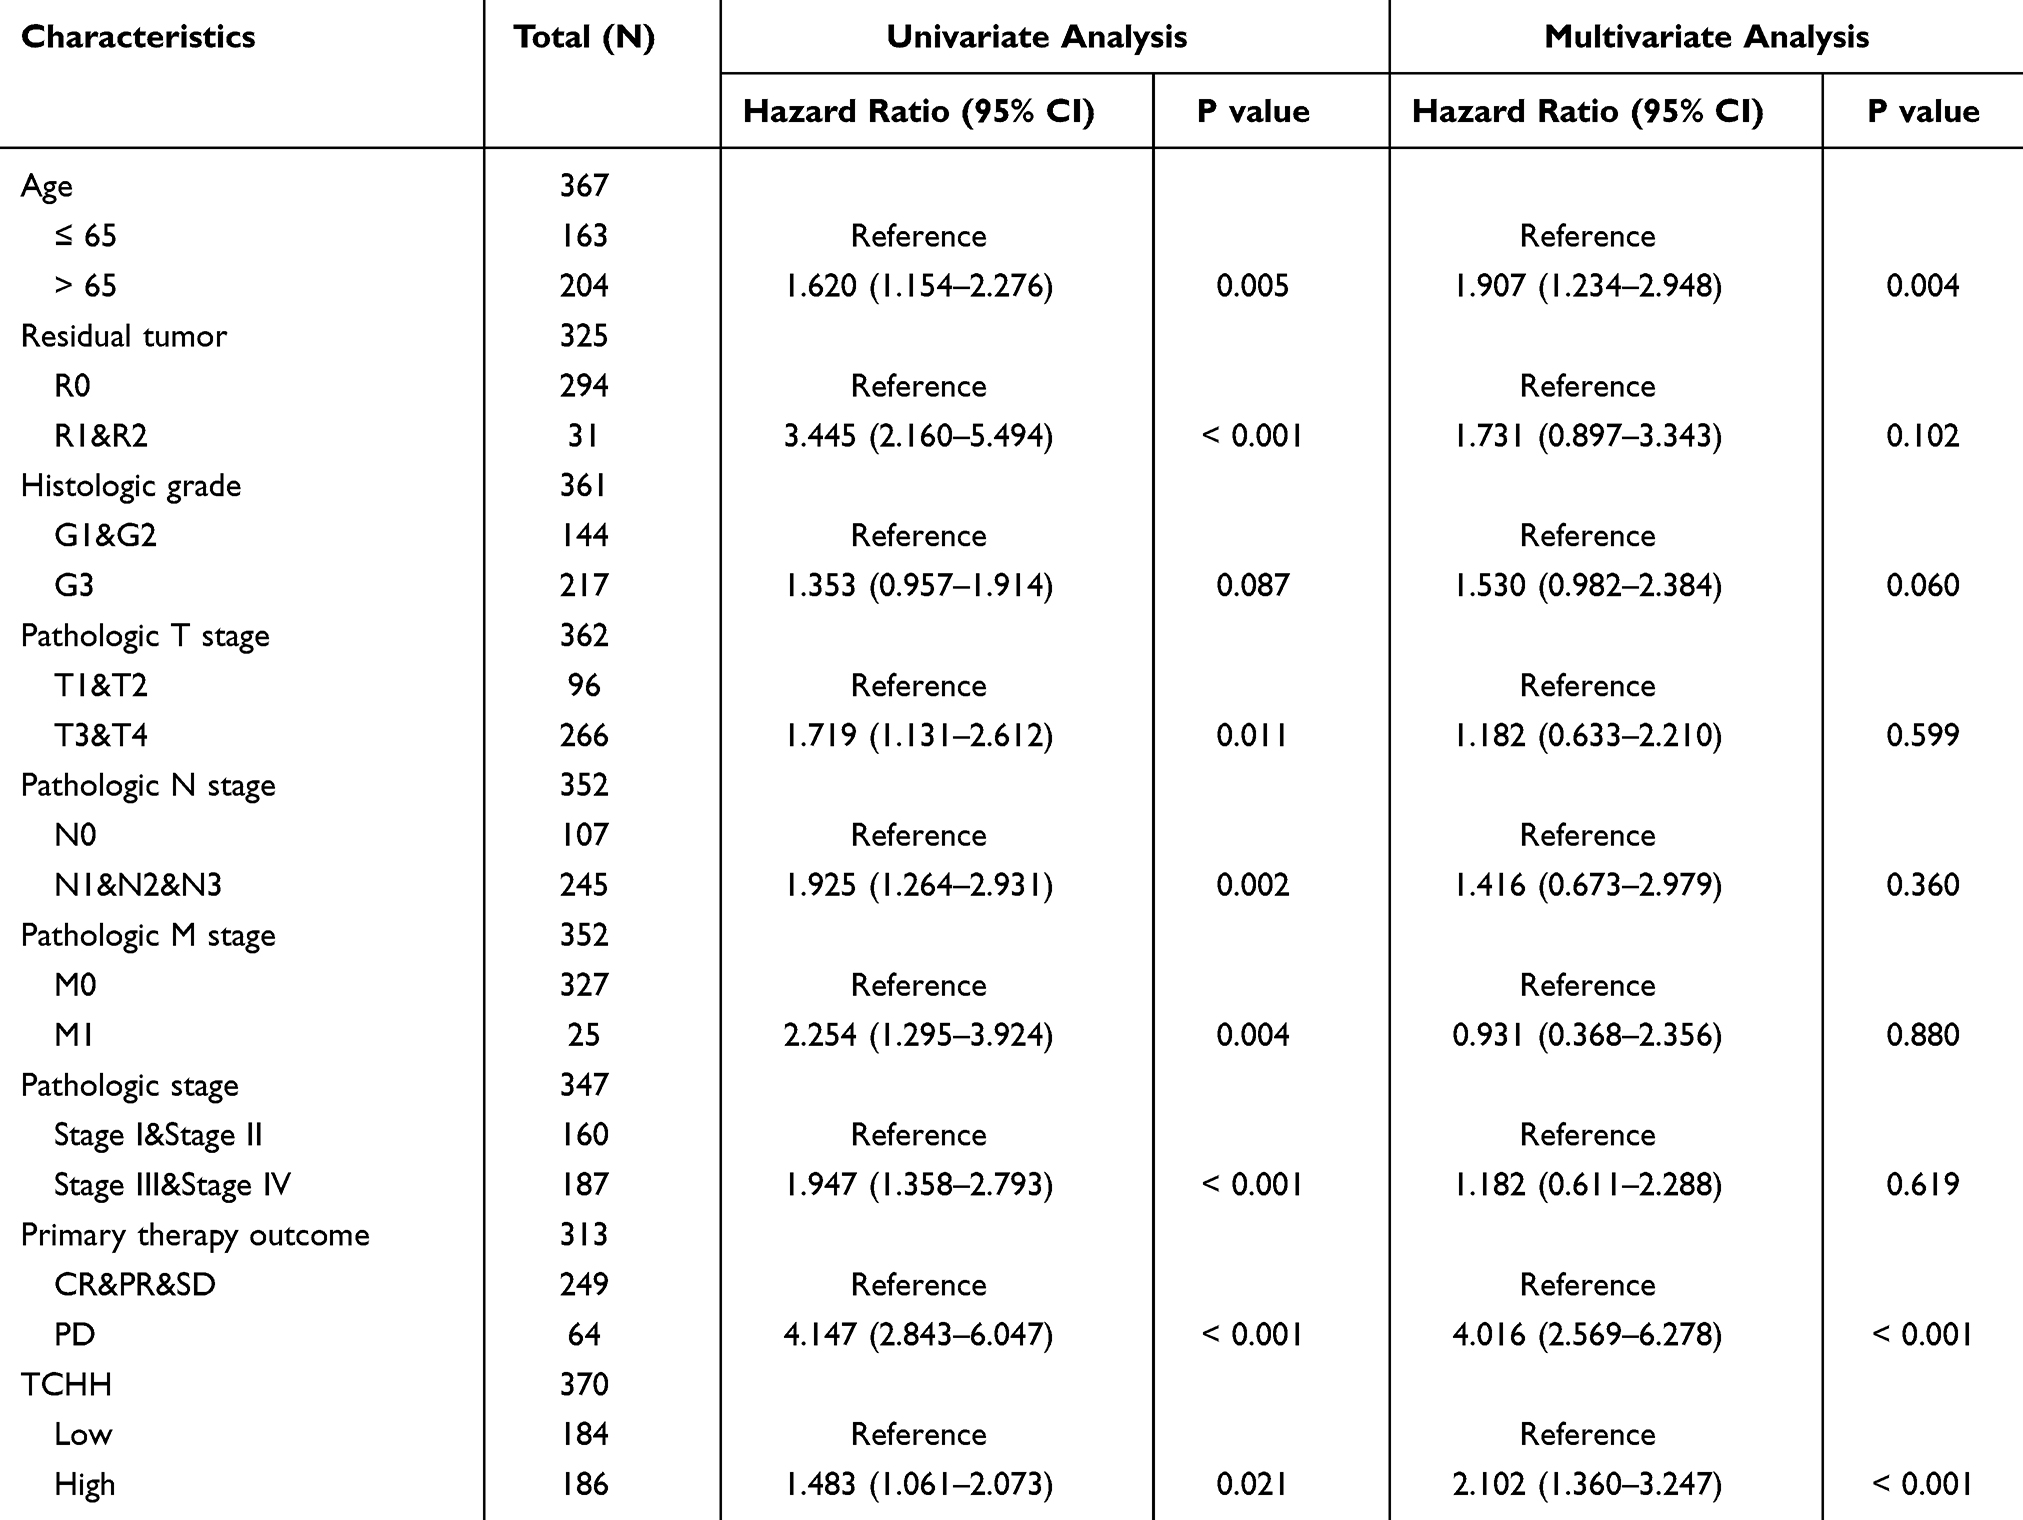 |
Table 2 Univariate and Multivariate Analysis of Clinicopathologic Features Associated with OS |
 |
Table 3 Univariate and Multivariate Analysis of Clinicopathologic Features Associated with DSS |
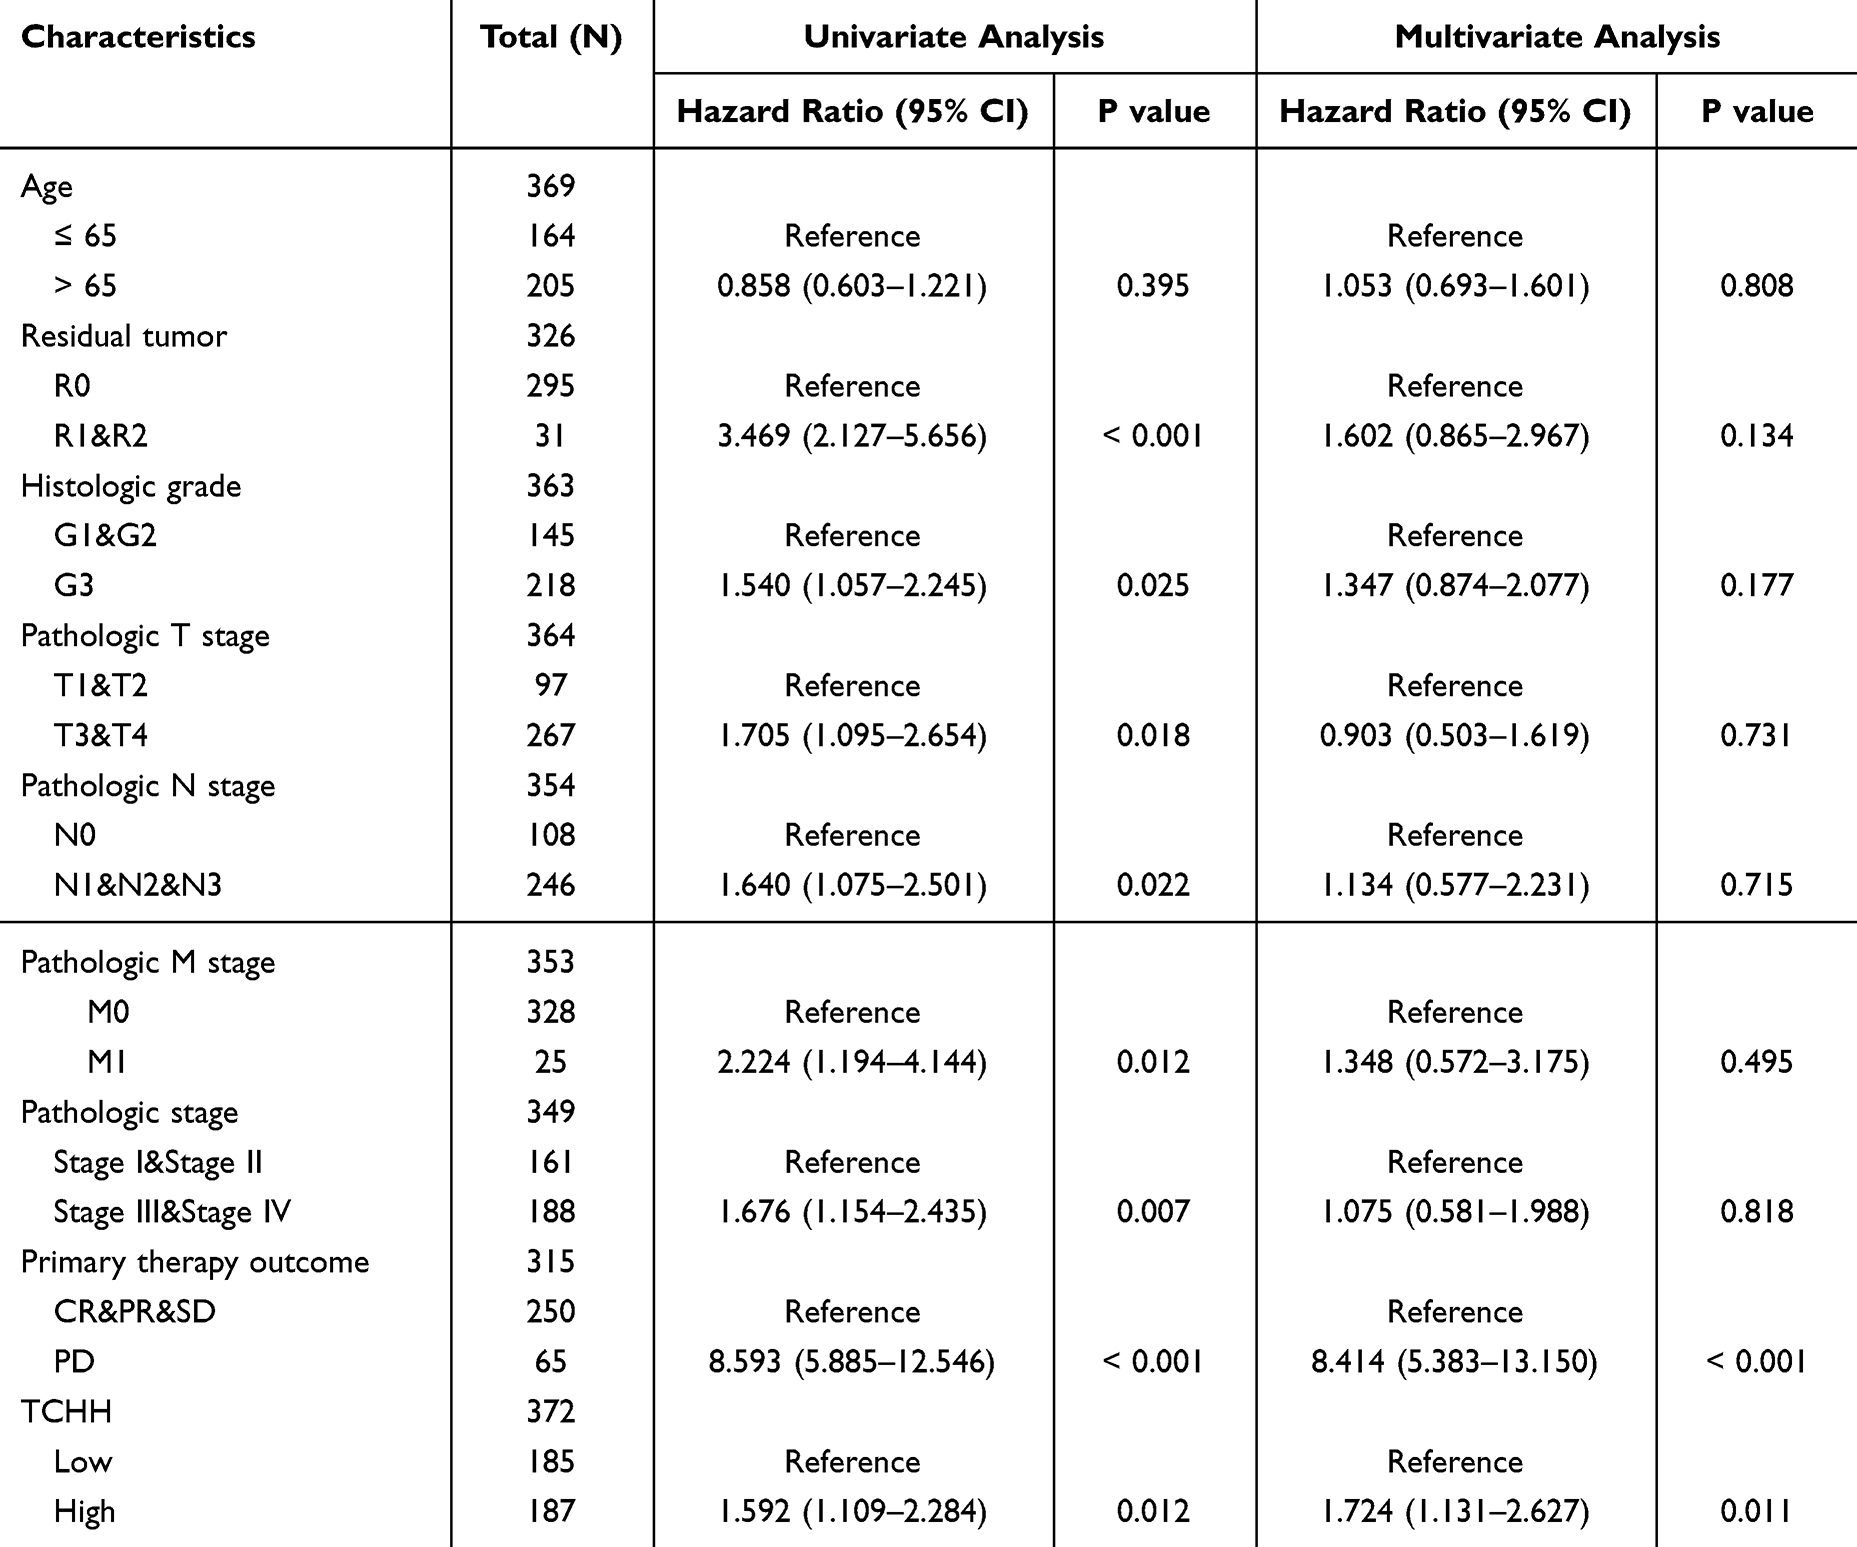 |
Table 4 Univariate and Multivariate Analysis of Clinicopathologic Features Associated with PFI |
Additionally, the TCHH expression level showed independent correlations with OS, DSS, and PFI in multivariate analysis, with an HR of 2.102 (95% CI: 1.360 −3.247, P = 2.102, Table 2), 1.967 (95% CI: 1.174–3.294, P = 0.010, Table 3) and 1.724 (95% CI: 1.131–2.627, P = 0.011, Table 4), respectively.
Co-Expression Gene Analysis of TCHH in Gastric Cancer
We investigated the top 15 positively expressed genes in the heatmap as well as all co-expression genes that were either positively or negatively linked with TCHH expression in gastric cancer. We identified the top nine genes in the heatmap of positive correlation (Figure 4A), which are MY01H (r = 0.504, Figure 4B), HEATR4 (r = 0.482, Figure 4C), CALCR (r = 0.480, Figure 4D), CRLF2 (r = 0.473, Figure 4E), HAP1 (r = 0.467, Figure 4F), CDH26 (r = 0.466, Figure 4G), ACP7 (r = 0.464, Figure 4H), DLGAP2 (r = 0.464, Figure 4I), and CCDC62 (r = 0.464, Figure 4J).
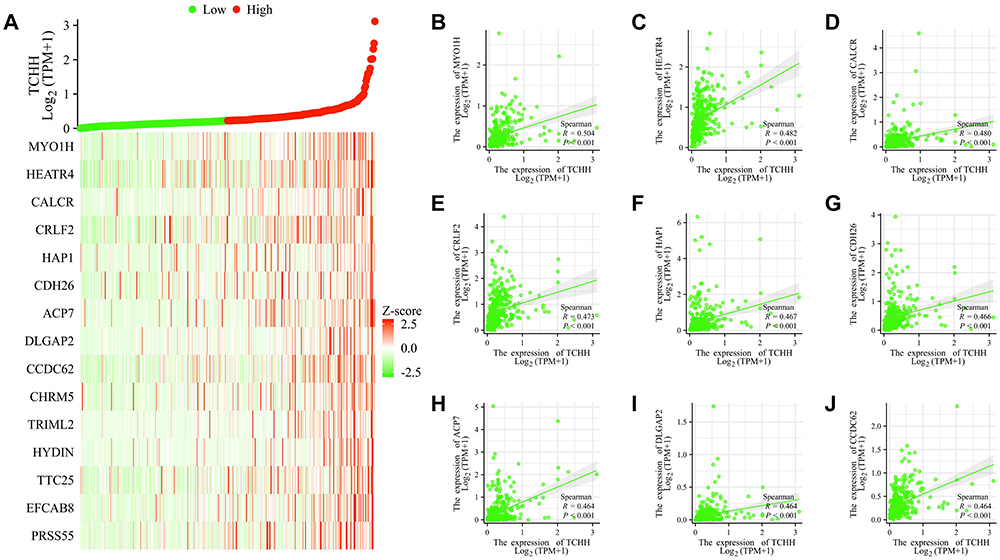 |
Figure 4 Top 15 genes positively correlated with TCHH expression in gastric cancer. (A)The gene co-expression heatmap of the top 15 genes positively correlated with TCHH in gastric cancer. (B–J) Correlation analysis of the top 9 genes and TCHH in the heatmap. |
We also obtained the top 9 genes in the heatmap of negative correlation (Figure 5A), which are as follows: CHCHD10 (r = −0.325, Figure 5B), KRTCAP3 (r = −0.291, Figure 5C), ATP5FID (r = −0.282, Figure 5D), EIF5AL1 (r = −0.274, Figure 5E), TSPO (r = −0.268, Figure 5F), RPL29 (r = −0.266, Figure 5G), ATP5MC3 (r = −0.264, Figure 5H), NDUFB2 (r = −0.258, Figure 5I), and PRL26 (r = −0.256, Figure 5J).
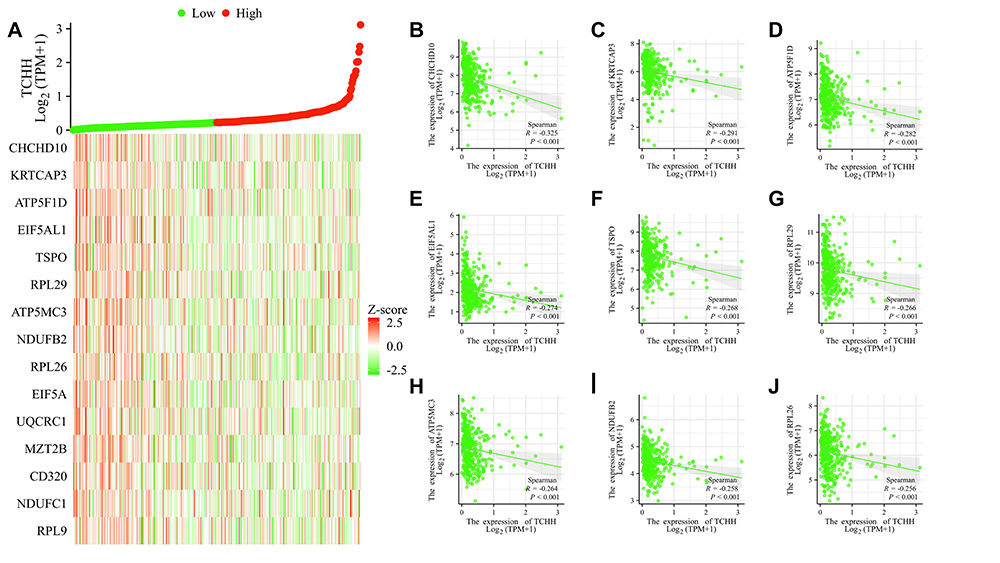 |
Figure 5 Top 15 genes negatively correlated with TCHH expression in gastric cancer. (A) The gene co-expression heatmap of the top 15 genes negatively correlated with TCHH in gastric cancer. (B–J) Correlation analysis of the top 9 genes and TCHH in the heatmap. |
Correlation Between TCHH Expression and Immune Infiltration in Gastric Cancer
In comparison to the TCH-low group, the NK CD56dim, Th17, and Th2 cell enrichment scores in the TCH-high group were significantly lower. Figure 6A illustrates that the Tgd enrichment scores in the TCH-high group were notably greater than those in the TCH-low group.
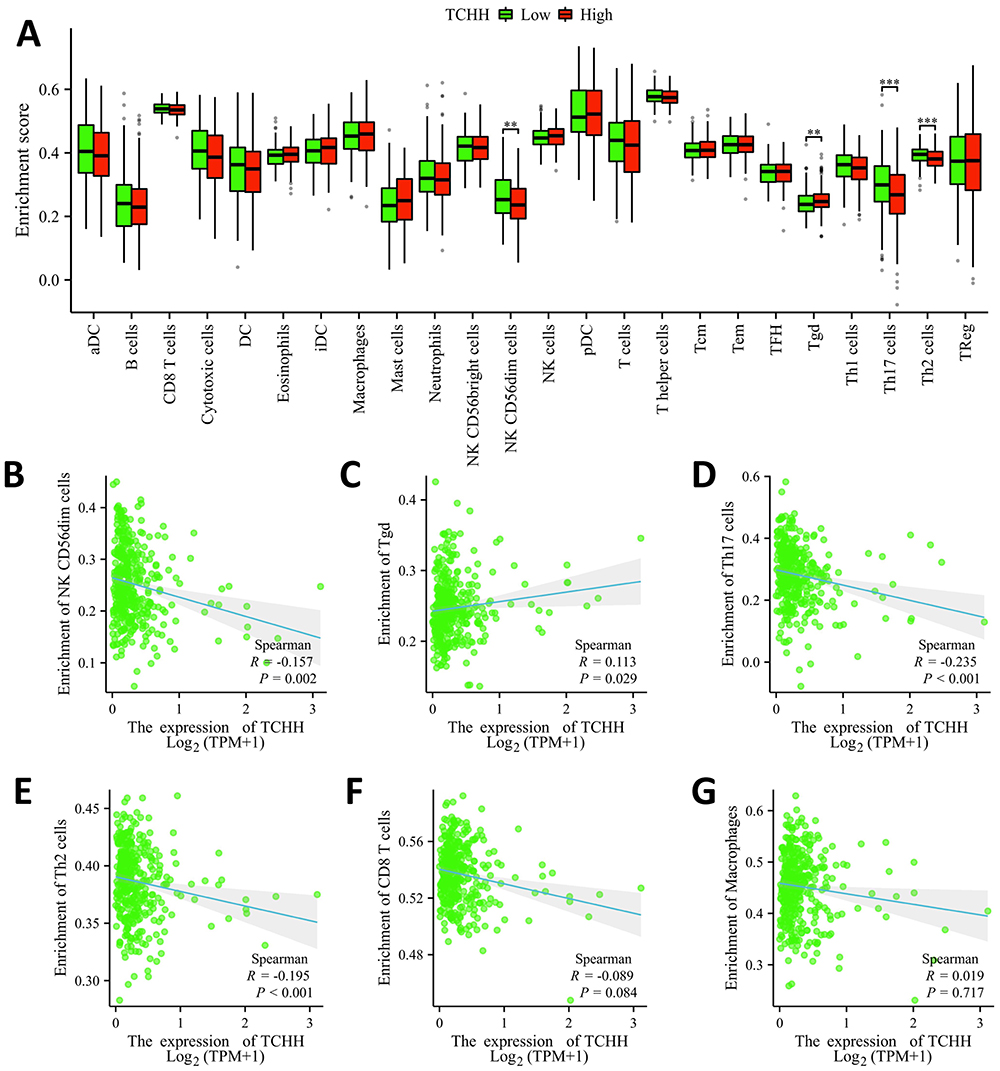 |
Figure 6 Correlation of TCHH expression with immune infiltration level in gastric cancer. (A) Correlation between infiltration levels of immune cells in the TCHH-high and TCHH-low expression groups. **p < 0.01; ***p < 0.001. (B–G) Correlations between the expression of TCHH and relative enrichment scores of immune cells, including CD56dim, Tgd, Th17, Th2, CD8T, and macrophages cells. |
On top of that, there was a strong negative correlation found between the expression of TCH and the infiltration levels of NK CD56dim (r = –0.157, P = 0.002), Th17 cells (r = −0.235, P < 0.001), and Th2 (r = −0.195, P < 0.001). There was a significant positive correlation (r = 0.113, P < 0.029) between the expression of Tch and the amounts of Tgd cell infiltration. Nevertheless, there was no significant correlation (P > 0.05) between the expression of TCH and the amounts of CD8T and macrophage cell infiltration (Figure 6B–G).
Enrichment Analysis
A total of 894 DEGs, comprising 878 upregulated genes and 16 downregulated genes, were obtained from 8230 DEGs using the threshold values of |log2 fold-change (FC)| > 1.5 and adjusted p-value < 0.05. A volcano map was created (Figure 7A). Next, we carried out the GO and KEGG enrichment analyses (Figure 7B) of DEGs, revealing that the primary BP contained intermediate filament cytoskeleton organization, cellular process involved in reproduction in multicellular organisms, adenylate cyclase-modulating G protein-coupled receptor signaling pathway, DNA methylation involved in gamete generation, and cell-cell recognition. The CC was mainly enriched in intermediate filament cytoskeleton, transmembrane transporter complex, GABA receptor complex, transporter complex, and voltage-gated calcium channel complex. The MF was mainly involved in G protein-coupled serotonin receptor activity, extracellular ligand-gated ion channel activity, G protein-coupled peptide receptor activity, cysteine-type endopeptidase inhibitor activity, and excitatory extracellular ligand-gated ion channel activity. The KEGG pathway enrichment was mainly related to neuroactive ligand-receptor interaction, GABAergic synapse, estrogen signaling pathway, retrograde endocannabinoid signaling, and steroid hormone biosynthesis (Figure 7C).
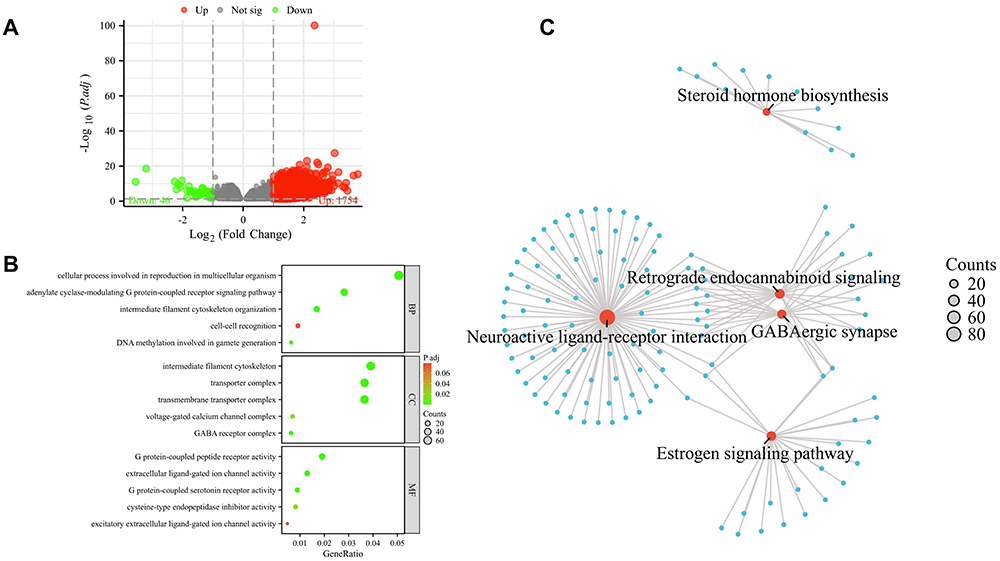 |
Figure 7 GO and KEGG analyses of DEGs between TCHH-high and TCHH-low expression in gastric cancer. (A) The volcano map of DEGs (red: upregulation; green: downregulation); (B) Enrichment analysis of Gene Ontology based on DEGs; (C) Enrichment analysis of KEGG pathway of DEGs. |
Construction of a Nomogram Based on the Clinical Factors
A nomogram has been generated based on some clinical indicators of OS so as to forecast the prognosis of patients with gastric cancer. A worse prognosis was linked to a higher total number of points on the nomogram (Figure 8A). The nomogram’s bootstrap-corrected C-index was 0.709 (95% CI = 0.683–0.735), showing that the model had a moderate predictive accuracy for OS of patients with gastric cancer. Calibration curves were additionally used to gauge the nomogram’s predictive utility (Figure 8B).
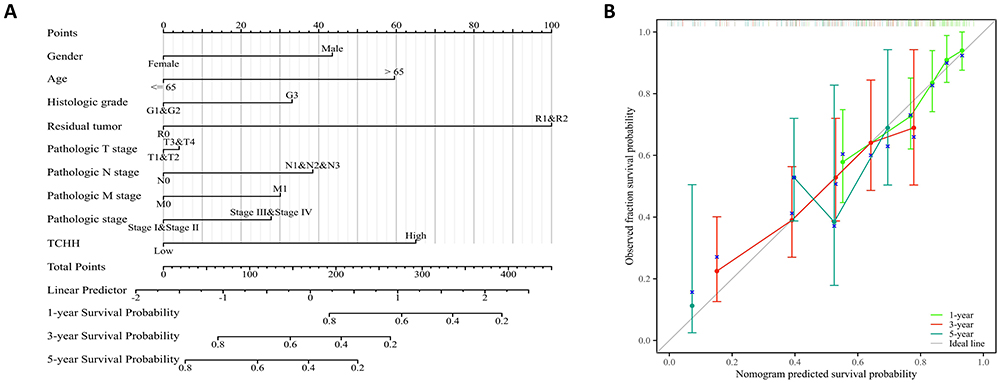 |
Figure 8 A nomogram and calibration curves for prediction of overall survival rates of patients with gastric cancer. (A) A nomogram for prediction of 1-, 3-, and 5-year overall survival rates of patients with gastric cancer. (B) Calibration curves of the nomogram prediction of 1-, 3-, and 5-year overall survival rates of patients with gastric cancer. |
Discussion
The prognosis for multiple malignancies has improved recently thanks to molecular target therapies to choose from. In contrast to non-small cell lung cancer and other cancers, target medical products for people with gastric cancer are just a few. Consequently, hunting for new pharmaceutical targets is crucial.
Numerous earlier investigations have concentrated on TCHH expression in human epithelial tissue, pig tongue epithelium, and wool follicles.6–9 TCHH is one of the genes involved in skin barrier expansion found in the epidermal differentiation complex, an area on chromosome 1 that is analyzed.20 Human hair growth and pigmentation are regulated by TCHH, which has been enhanced by dermal white adipose tissue-derived HGF.21 Concerning stomach cancer, there is not much data accessible addressing TCHH expression or possibly prognostic importance. In order to analyze the expression level of TCHH mRNA in gastric cancer and its possible prognostic significance, the bioinformatics method was applied.
It was just recently discovered that TCHH expression and functions have been identified in a number of malignant tumors.10–13 Different cancers in the pan-cancer analysis express TCHH in different ways. The expression of TCHH was down-regulated in oral squamous cell carcinomas (OSCC),22 and even in lung adenocarcinoma and liver hepatocellular carcinoma, according to our data. This was also the situation for neighboring normal tissue. Significant proof of increased TCHH methylation has been revealed during the colorectal cancer process of liver metastasis. A notable connection between TCHH methylation and the volume of the liver metastatic tumor was set up,10 which was somewhat similar to the role of TCHH in stomach cancer. The increased expression of TCHH was found to be significantly correlated with the pathologic M stage in the study that I conducted, demonstrating a connection between TCHH and metastasis; nevertheless, additional investigation needs to be conducted to identify the precise mechanism.
The elevated expression of TCHH in cancer tissue was identified in this research’s analysis of TCGA-STAD datasets when compared to normal tissues. It indicates that TCHH upregulation might be a common characteristic of gastric cancer and might act as an oncogene in the growth of tumors. On the other hand, patients with low TCHH expression suffer from prolonged PFI, DSS, and OS. It highlighted that TCHH might function as a novel therapeutic target as well as a potential prognostic marker for patients with gastric cancer. There have also been observations on the connection between TCHH and survival time in cases of colon glioma and adenocarcinoma.10,11 Meanwhile, TCHH mutational frequencies were more powerful in patients with defective mismatch repair/microsatellite instability-high colon cancer than in patients with microsatellite-stable colon cancer.23 In addition, in bladder and breast cancer, aberrant TCHH expression was a potential modulator of the chemotherapy response.12,24 Nevertheless, extra study is required to figure out whether TCHH might be useful as a target or predictive marker to predict the chemo-sensitization of gastric cancer.
Tumor prognosis with immune cells in the cancer microenvironment is closely correlated. Over 90% of NK cells are CD56dim, meaning they are primarily cytotoxic. In accordance with our research, the NK CD56dim enrichment scores in the TCHH-high group were considerably less than those in the TCHH-low group, which was somewhat comparable in bladder urothelial carcinoma.24 The decline of CD56dim in the TCHH high group may have been connected to a poor prognosis because of the absence of immunological response. Nonetheless, further investigation is still required to validate the involvement of immune cells connected to TCHH in gastric cancer.
Furthermore, 894 DEGs have been chosen for enrichment analysis, and the results suggested that these DEGs may be related to the organization of the intermediate filament cytoskeleton, gamete generation-related DNA methylation, cell-cell recognition, and G protein-coupled peptide receptor (GPCR) activity. A number of investigations demonstrate that DNA methylation might be an important variable in solid tumors.25,26 Activation of GPCRs on tumors can have prominent growth effects, and GPCRs are frequently over-/ectopically expressed on tumors and are increasingly being considered as possible therapeutic targets in cancers.27 As for gastric cancer, the possible molecular mechanism of TCHH will be verified and discussed in our upcoming studies.
Conclusion
Taken together, the current bioinformatic results indicate that TCHH may represent a new tumor oncogene and be involved in the pathogenesis of gastric cancer. Additionally, it functioned as an independent predictive biomarker for stomach cancer. This is an intriguing finding that should be further examined and confirmed in the future from the perspective of basic research and clinical trials.
Data Sharing Statement
The data in this paper came from TCGA public database. Our use of the data has passed the review of the Ethical Review Committee of the Nantong Haimen District People’s Hospital of China.
Disclosure
The authors report no conflicts of interest in this work.
References
1. Sung H, Ferlay J, Siegel RL, et al. Global cancer statistics 2020: GLOBOCAN estimates of incidence and mortality worldwide for 36 cancers in 185 countries. CA Cancer J Clin. 2021;71(3):209–249. doi:10.3322/caac.21660
2. Xia C, Dong X, Li H, et al. Cancer statistics in China and United States, 2022: profiles, trends, and determinants. Chin Med J. 2022;135(5):584–590. doi:10.1097/CM9.0000000000002108
3. Sekiguchi M, Oda I, Matsuda T, Saito Y. Epidemiological trends and future perspectives of gastric cancer in Eastern Asia. Digestion. 2022;103(1):22–28. doi:10.1159/000518483
4. Zhang K, Chen L. Chinese consensus on the diagnosis and treatment of gastric cancer with liver metastases. Ther Adv Med Oncol. 2020;12:1758835920904803. doi:10.1177/1758835920904803
5. Ferlay J, Colombet M, Soerjomataram I, et al. Estimating the global cancer incidence and mortality in 2018: GLOBOCAN sources and methods. Int J Cancer. 2019;144(8):1941–1953. doi:10.1002/ijc.31937
6. Rothnagel JA, Rogers GE. Trichohyalin, an intermediate filament-associated protein of the hair follicle. J Cell Biol. 1986;102(4):1419–1429. doi:10.1083/jcb.102.4.1419
7. Lee SC, Kim IG, Marekov LN, O’Keefe EJ, Parry DA, Steinert PM. The structure of human trichohyalin. Potential multiple roles as a functional EF-hand-like calcium-binding protein, a cornified cell envelope precursor, and an intermediate filament-associated (cross-linking) protein. J Biol Chem. 1993;268(16):12164–12176. doi:10.1016/S0021-9258(19)50322-2
8. Basmanav FB, Cau L, Tafazzoli A, et al. Mutations in three genes encoding proteins involved in hair shaft formation cause uncombable hair syndrome. Am J Hum Genet. 2016;99(6):1292–1304. doi:10.1016/j.ajhg.2016.10.004
9. Winget JM, Finlay D, Mills KJ, et al. Quantitative proteomic analysis of stratum corneum dysfunction in adult chronic atopic dermatitis. J Invest Dermatol. 2016;136(8):1732–1735. doi:10.1016/j.jid.2016.03.037
10. Chen S, Liu T, Bu D, et al. Methylome profiling identifies TCHH methylation in CfDNA as a noninvasive marker of liver metastasis in colorectal cancer. FASEB J. 2021;35(7):e21720. doi:10.1096/fj.202100266R
11. Wang Y, Liu Y, Zhang C, Zhang C, Guan X, Jia W. Differences of macrophages in the tumor microenvironment as an underlying key factor in glioma patients. Front Immunol. 2022;13:1028937. doi:10.3389/fimmu.2022.1028937
12. Al Amri WS, Baxter DE, Hanby AM, et al. Identification of candidate mediators of chemoresponse in breast cancer through therapy-driven selection of somatic variants. Breast Cancer Res Treat. 2020;183(3):607–616. doi:10.1007/s10549-020-05836-7
13. Tamura S, Wang Y, Veeneman B, et al. Molecular correlates of in vitro responses to dacomitinib and afatinib in bladder cancer. Bladder Cancer. 2018;4(1):77–90. doi:10.3233/BLC-170144
14. Song X, Du R, Gui H, et al. Identification of potential hub genes related to the progression and prognosis of hepatocellular carcinoma through integrated bioinformatics analysis. Oncol Rep. 2020;43(1):133–146. doi:10.3892/or.2019.7400
15. Asplund A, Edqvist PH, Schwenk JM, Pontén F. Antibodies for profiling the human proteome-the human protein atlas as a resource for cancer research. Proteomics. 2012;12:2067–2077. doi:10.1002/pmic.201100504
16. Hänzelmann S, Castelo R, Guinney J. GSVA: gene set variation analysis for microarray and RNA-seq data. BMC Bioinf. 2013;14:7. doi:10.1186/1471-2105-14-7
17. Bindea G, Mlecnik B, Tosolini M, et al. Spatiotemporal dynamics of intratumoral immune cells reveal the immune landscape in human cancer. Immunity. 2013;39(4):782–795. doi:10.1016/j.immuni.2013.10.003
18. Love MI, Huber W, Anders S. Moderated estimation of fold change and dispersion for RNA-seq data with DESeq2. Genome Biol. 2014;15(12):550. doi:10.1186/s13059-014-0550-8
19. Yu G, Wang LG, Han Y, He QY. clusterProfiler: an R package for comparing biological themes among gene clusters. OMICS. 2012;16(5):284–287. doi:10.1089/omi.2011.0118
20. Petrova A, Capalbo A, Jacquet L, et al. Induced pluripotent stem cell differentiation and three-dimensional tissue formation attenuate clonal epigenetic differences in trichohyalin. Stem Cells Dev. 2016;25(18):1366–1375. doi:10.1089/scd.2016.0156
21. Nicu C, O’Sullivan JDB, Ramos R, et al. Dermal adipose tissue secretes HGF to promote human hair growth and pigmentation. J Invest Dermatol. 2021;141(7):1633–1645.e13. doi:10.1016/j.jid.2020.12.019
22. Ge L, Liu S, Xie L, Sang L, Ma C, Li H. Differential mRNA expression profiling of oral squamous cell carcinoma by high-throughput RNA sequencing. J Biomed Res. 2015;29(5):397–404. doi:10.7555/JBR.29.20140088
23. Lv J, Li W, Wang X, et al. Identification of MKI67, TPR, and TCHH mutations as prognostic biomarkers for patients with defective mismatch repair colon cancer stage II/III. Dis Colon Rectum. 2023;66(11):1481–1491. doi:10.1097/DCR.0000000000002734
24. Yang YJ, Xu XQ, Zhang YC, Hu PC, Yang WX. Establishment of a prognostic model related to tregs and natural killer cells infiltration in bladder cancer. World J Clin Cases. 2023;11(15):3444–3456. doi:10.12998/wjcc.v11.i15.3444
25. Nishiyama A, Nakanishi M. Navigating the DNA methylation landscape of cancer. Trends Genet. 2021;37(11):1012–1027. doi:10.1016/j.tig.2021.05.002
26. Pan Y, Liu G, Zhou F, Su B, Li Y. DNA methylation profiles in cancer diagnosis and therapeutics. Clin Exp Med. 2018;18(1):1–14. doi:10.1007/s10238-017-0467-0
27. Moody TW, Lee L, Ramos-Alvarez I, Iordanskaia T, Mantey SA, Jensen RT. Bombesin receptor family activation and CNS/neural tumors: review of evidence supporting possible role for novel targeted therapy. Front Endocrinol. 2021;12:728088. doi:10.3389/fendo.2021.728088
 © 2024 The Author(s). This work is published and licensed by Dove Medical Press Limited. The full terms of this license are available at https://www.dovepress.com/terms.php and incorporate the Creative Commons Attribution - Non Commercial (unported, v3.0) License.
By accessing the work you hereby accept the Terms. Non-commercial uses of the work are permitted without any further permission from Dove Medical Press Limited, provided the work is properly attributed. For permission for commercial use of this work, please see paragraphs 4.2 and 5 of our Terms.
© 2024 The Author(s). This work is published and licensed by Dove Medical Press Limited. The full terms of this license are available at https://www.dovepress.com/terms.php and incorporate the Creative Commons Attribution - Non Commercial (unported, v3.0) License.
By accessing the work you hereby accept the Terms. Non-commercial uses of the work are permitted without any further permission from Dove Medical Press Limited, provided the work is properly attributed. For permission for commercial use of this work, please see paragraphs 4.2 and 5 of our Terms.