")
Back to Journals » Clinical, Cosmetic and Investigational Dentistry » Volume 16
Stress Analysis on Mesiolingual Cavity of Endodontically Treated Molar Restored Using Bidirectional Fiber-Reinforced Composite (Wallpapering Technique)
Authors Neri H , Aripin D, Muryani A , Dharsono HDA , Yolanda Y , Mahyuddin AI
Received 18 December 2023
Accepted for publication 27 March 2024
Published 13 April 2024 Volume 2024:16 Pages 75—89
DOI https://doi.org/10.2147/CCIDE.S450325
Checked for plagiarism Yes
Review by Single anonymous peer review
Peer reviewer comments 2
Editor who approved publication: Professor Christopher E. Okunseri
Harnia Neri,1 Dudi Aripin,1 Anna Muryani,1 Hendra Dian Adhita Dharsono,1 Yolanda Yolanda,1 Andi Isra Mahyuddin2
1Department of Conservative Dentistry, Faculty of Dentistry, Universitas Padjadjaran, Bandung, Indonesia; 2Faculty of Mechanical and Aerospace Engineering, Bandung Institute of Technology, Bandung, Indonesia
Correspondence: Anna Muryani; Harnia Neri, Department of Conservative Dentistry, Faculty of Dentistry, Universitas Padjadjaran, Jl. Sekeloa Selatan no. 1, Bandung, 40123, Indonesia, Tel +62 896 19972132, Email [email protected]; [email protected]
Introduction: Endodontically treated teeth (ETT) undergo extensive structure change and experience high stress during biomechanical function. Stress distribution is influenced by the restoration material and the type of bond between material and tooth structure. The selection of materials that can distribute stress will affect the resistance and retention of ETT to mastication forces, thus biomechanical functions were achieved. Composite has mechanical properties similar to dentin, it can transmit and distribute stresses throughout the tooth surface. The disadvantage of composites in large cavities is their lack of toughness. The addition of fiber to composites can increase their toughness.
Purpose: This research is to determine the stress distribution of a fiber-reinforced composite made of polyethylene and e-glass on the mesiolingual cavity of ETT.
Materials and Methods: A three-dimensional model of the mandibular molar was prepared for cavity preparation and the formation of restorations using SolidWorks 2021. The models were analyzed with Abaqus 2020 to determine stress concentrations after given vertical and oblique loading.
Results: The maximum and minimum principal stress data were obtained to assess material resistance and interfacial damage criterion. Polyethylene fiber shows a more homogeneous stress distribution because the modulus of elasticity is close to the dentin and has a thickness that can reduce the volume of the composite. The E-glass shows the stress concentration on the circumferential fiber and cavity floor.
Conclusion: The stress distribution of fiber-reinforced composite on the buccolingual cavity of ETT using the finite element method did not show structural failure in the polyethylene group because the maximum and minimum principal stresses were lower than the strength of the material. Interfacial bond failure occurs at the enamel portion. The maximum and minimum principal values of e-glass indicate structural failure in the circumferential fiber and the base fiber because the stress exceeds the strength of the material. Interfacial bond failure occurred on the circumferential and the cavity floor.
Keywords: stress distribution, bidirectional polyethylene fiber, bidirectional e-glass fiber, finite element method, wallpapering technique
Introduction
Molar ETT lost marginal ridge and hard tissue due to caries and endodontic procedures. Enamel, dentin, and marginal ridge influenced resistance and retention to achieve longevity of treatment.1,2 Minimally invasive endodontics is an endodontic procedure that has the concept of preserving and reducing the removal of enamel and dentin to prevent fractures from occlusal forces especially tensile forces.3 Enamel is the outer part of a tooth that is hard and brittle, it serves to protect the inner dentin from occlusal forces especially tensile forces.2 Tooth after root canal treatment have low hard tissue density, so the tooth’s ability to withstand tensile forces is reduced and fracture resistance decreases.1,3
The causes of post-endodontic tooth extraction were vertical root fracture (50.2%), crown fracture (12.4%) and restoration failure (7.2%).4 A retrospective study comparing the success rate of endodontic treatment of molars using indirect (full crown) and direct restoration (composite) showed a value of 87.8% and 79.5% after 24 months. In the long term, the success rate of indirect restorations is higher than that of direct composite restorations, but the failure mode in indirect restorations causes teeth to be extracted, while direct composite restorations have a greater chance of retreatment.5
Tanner et al investigated the success rate of posterior composite restorations between 65.2% and 92.5%. Composite is a material that has tooth-like properties, it can transmit and distribute functional stresses throughout the tooth surface. The disadvantage of composite in large cavities is the lack of toughness.6 Improved mechanical properties can increase the success of composite restorations, especially in large cavities with large occlusal force.7–9 Studies have been conducted to improve and strengthen the mechanical properties of composite resin with the addition of fiber. Research studies suggest that fiber-reinforced composites as structures under composite restorations can increase the load-bearing capacity and modify stresses by creating a monoblock effect, thereby helping to distribute and transfer stresses along the long axis of the teeth.7,8,10,11
Stress analysis due to masticatory forces can be performed by using the finite element method (FEM) to identify high-stress concentrations that result in restoration failure.12 The advantages of FEM are reduced research time and costs, as well as provide an overview of a new scientific concept to clinical application, by carrying out the virtual test under measured and conceivable loading conditions.13 This study aims to determine the stress distribution of fiber-reinforced composite by adding fiber bidirectional made of polyethylene and e-glass on ETT mandibular molar without mesial and lingual walls using the finite element method
Materials and Methods
Finite element analysis is conducted by using Abaqus 2020 to obtain the data. The research material was a three-dimensional (3D) solid model of the mandibular right first molar. A 3D Model was obtained by following several procedures. First, the tooth was scanned using the Micro-CT (computerized tomography) scanner. Then, the results were processed using software to create a proper 3D model. The processes include point cloud data reduction and imperfection cleaning to prevent misinterpretation. After the modifications were completed, the 3D solid model was generated from the point cloud data and imported into 3D Modeling Software for further preparation. The components of the 3D solid model of a molar tooth have been prepared for root canal treatment, consisting of enamel, dentin enamel junction (DEJ), dentin, cemento-enamel junction, cementum, gutta-percha, periodontal membrane, alveolar bone, and smart dentin replacement (SDR) flowable composite. The cavity was modified using SolidWorks 2021, and the criteria for cavity design on the lower molar were prepared without mesial and lingual walls listed in Table 1. The subject of research was divided into non-cuspal coverage (Figure 1A) and cuspal coverage (Figure 1B). The restoration was built using the wallpapering technique, and the materials used are listed in Table 2. The fiber-reinforced composite restoration that has been applied can be seen in Figure 2. The types of fiber materials used are polyethylene fiber and e-glass fiber.
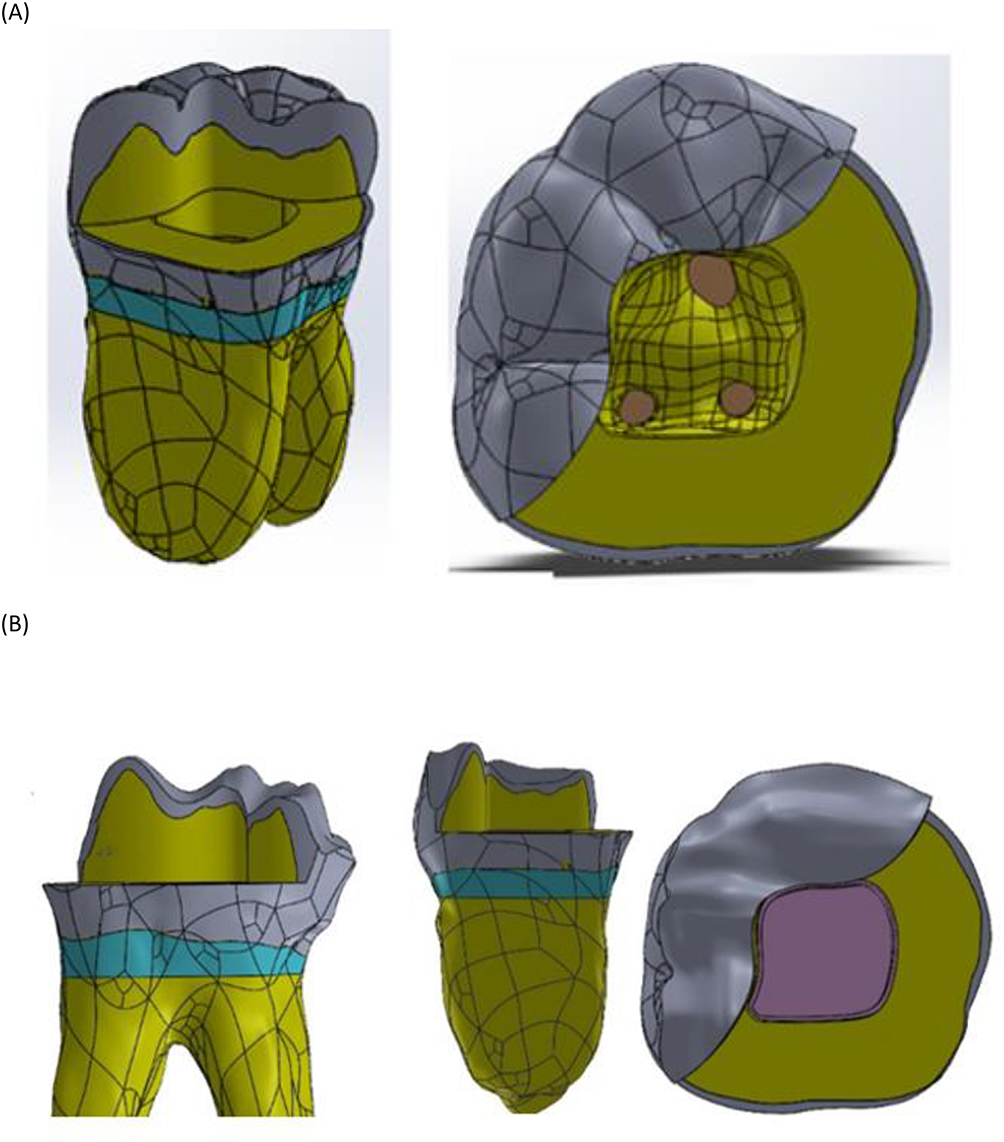 |
Figure 1 (A) Non cuspal coverage and (B) cuspal coverage cavity design. |
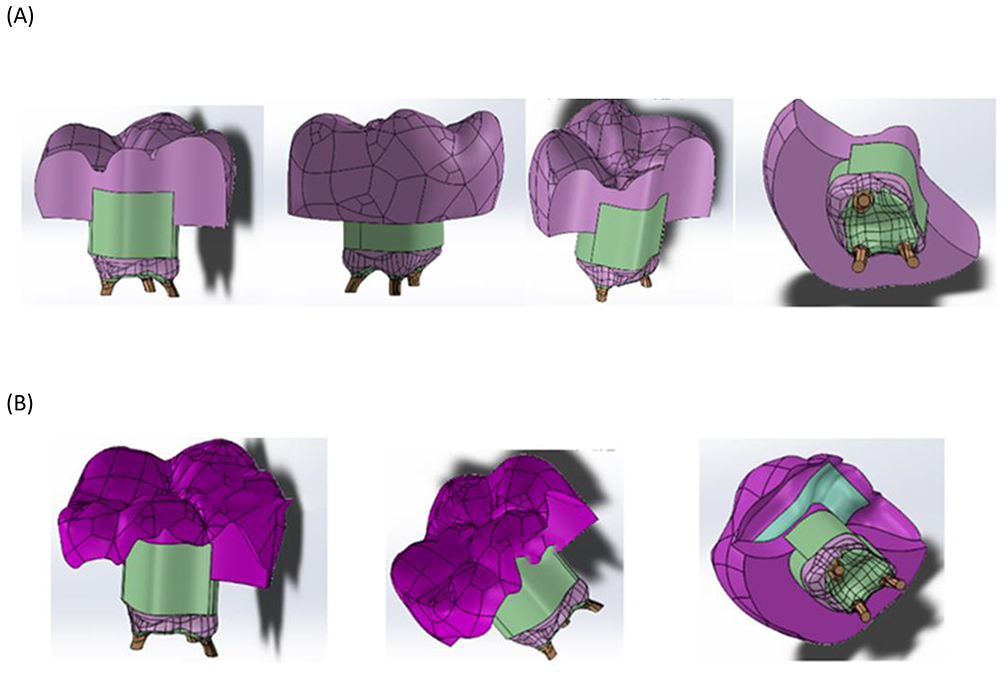 |
Figure 2 Components of 3D direct restoration reinforced fiber composite (A) non-cuspal coverage and (B) cuspal coverage. |
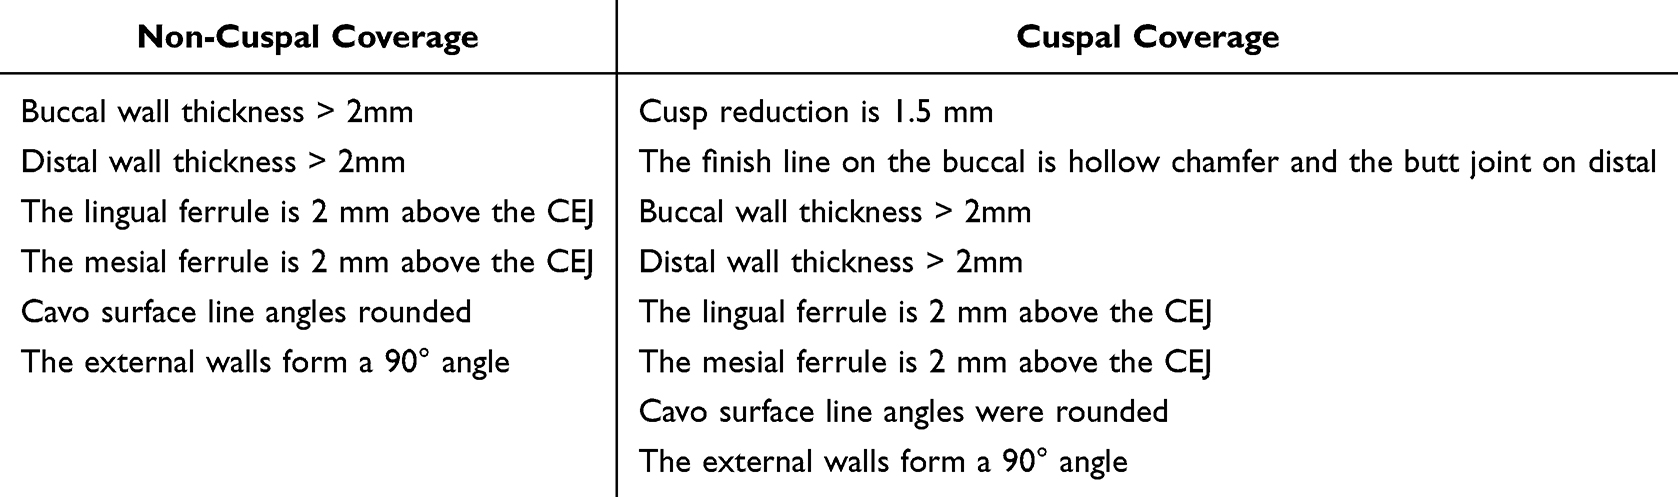 |
Table 1 The Criteria of Cavity Design |
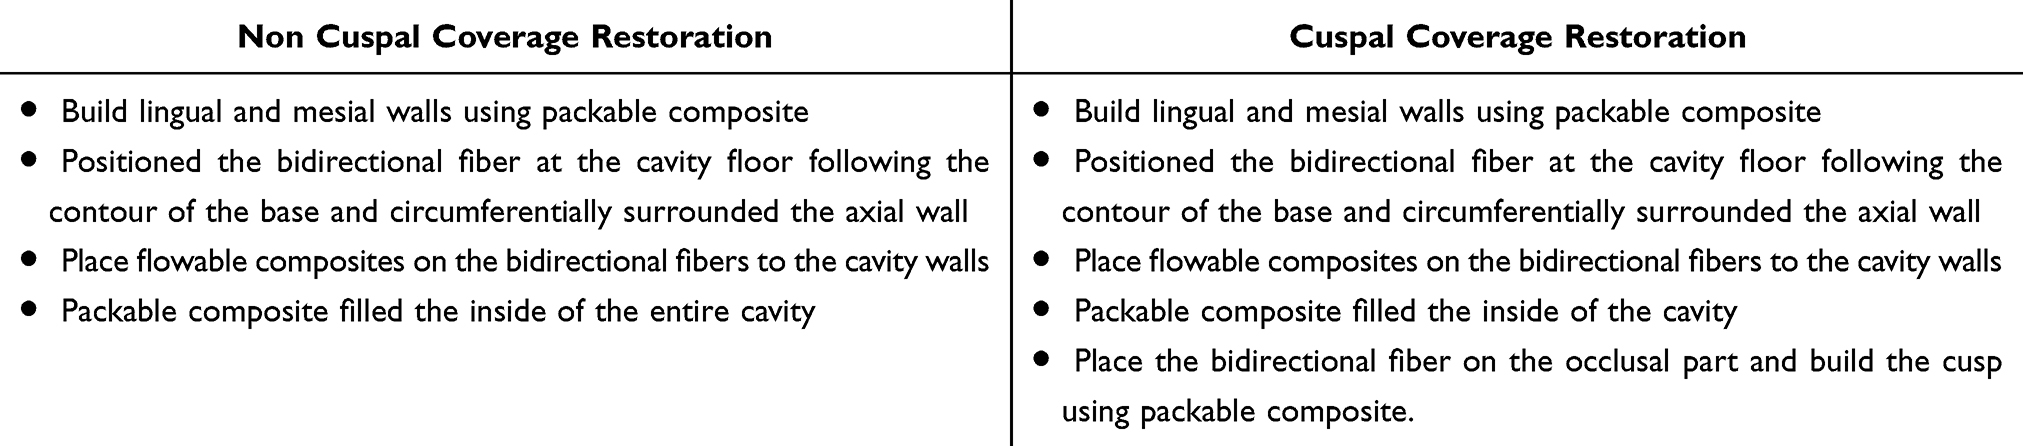 |
Table 2 Placement of the Restoration Materials on the Molar Cavity Without Mesiolingual Walls |
The analysis process consists of three stages are pre-processing, solving, and post-processing. Pre-processing is the stage of importing a three-dimensional model from CAD SolidWork, selecting elements, inputting the mechanical properties of the materials (Table 3) and the strength properties of adhesive material (Table 4), loading, and specifying boundary conditions. Solving is a numerical calculation process on the Abaqus 2020 software based on the given component specifications and forces. Post-processing is the result of finite element analysis, which presents the maximum and minimum principal stress to assess material resistance and the interfacial damage criterion to assess interfacial adhesion between tooth and restoration.
 |
Table 3 Mechanical Properties of Tooth and Materials Restoration |
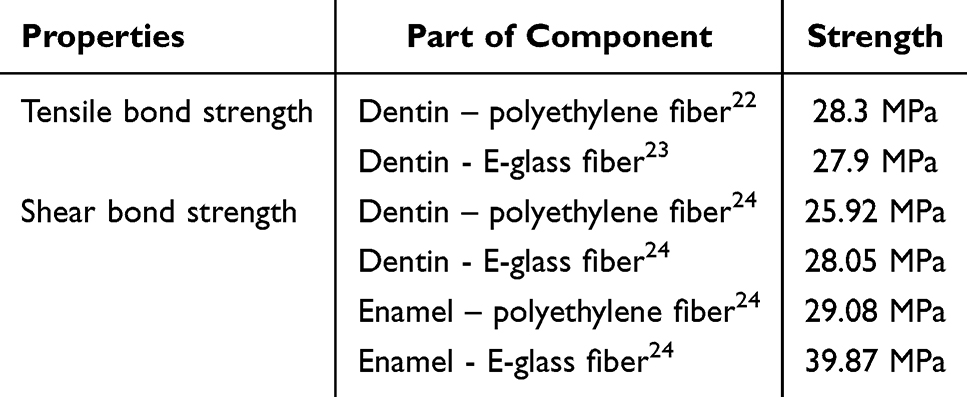 |
Table 4 The Strength Properties of Adhesive Material |
The tooth model was assumed to be homogeneous, linear elastic, and isotropic, while the fiber component was considered orthotropic. The surface-based cohesive interaction was given to the interaction between the tooth and the restoration. The interaction of layers that are not perfectly adhered was given material properties consisting of shear bond strength and tensile bond strength using a self-etch adhesive system. The modulus elasticity of the hybrid layer model was 11,765 MPa and thickness was 5 µm.25 Two loading conditions applied to the occlusal surface were 720 Newton (N) of vertical force and 200 N of oblique force at a 45° angle (Figure 3).
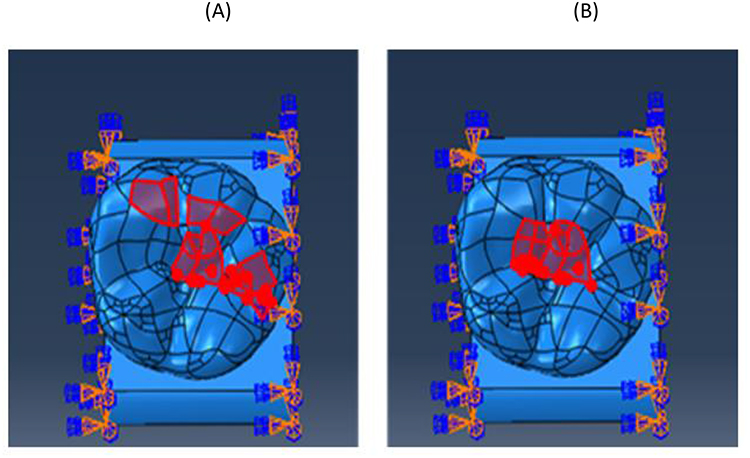 |
Figure 3 The loading zone (A) vertical force and (B) oblique force are represented by the red region. |
Results
The stress distribution is obtained from finite element analysis by the Abaqus 2021 software. The stress value is represented in the picture of the element model both qualitatively and quantitatively. The qualitative data is represented by the color spectrum of red, orange, yellow, green, and blue. Each color spectrum represents a stress value, which is positive for tensile stress (red color) and negative for compressive stress (blue color).
Quantitative data is the number that represents the maximum principal stress and the minimum principal stress in MPa (Mega Pascal) units. The maximum principal stress that occurs on part of the model is compared to tensile strength, and the minimum principal stress is compared to compressive strength. A component failure occurs when the stress value exceeds the strength of the material. The maximum and minimum principal stress values are tabulated in Tables 5–8.
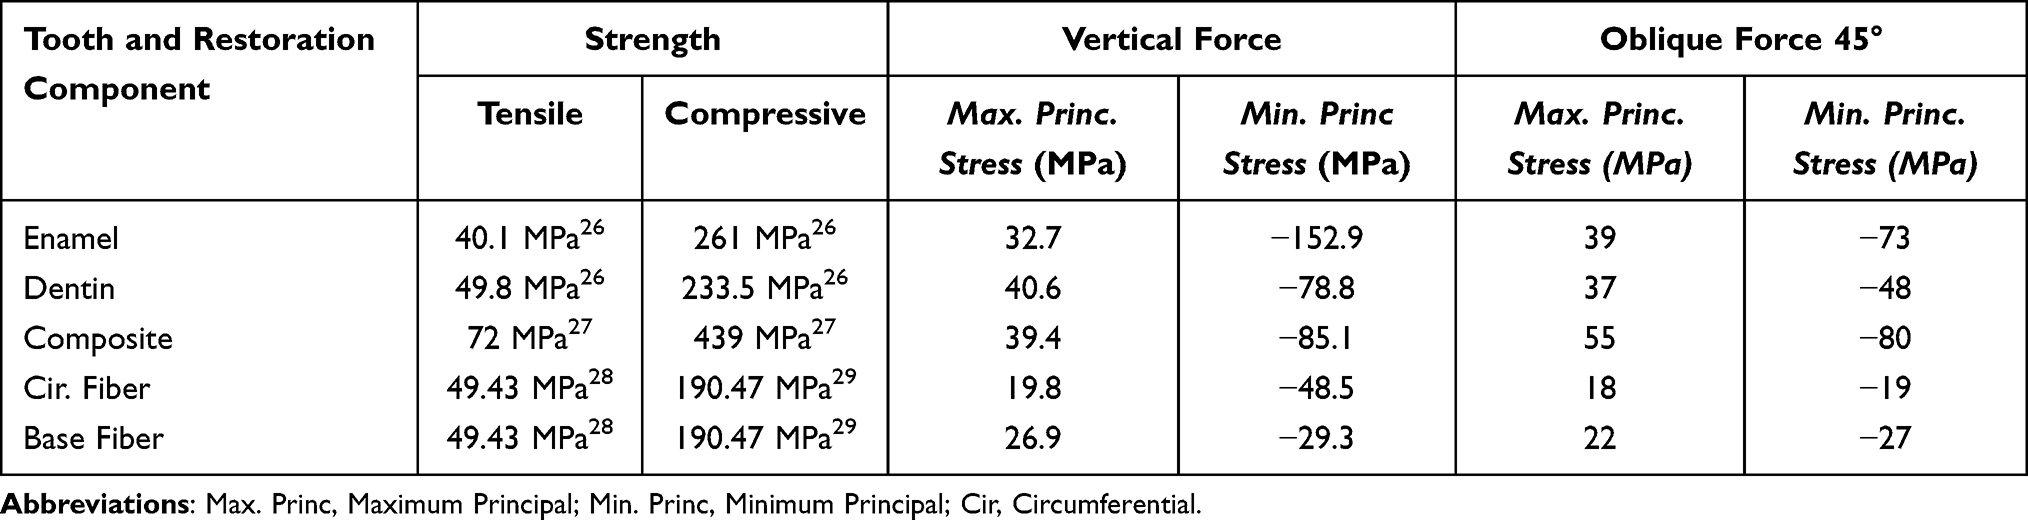 |
Table 5 Maximum and Minimum Principal Stress on Non-Cuspal Coverage Restoration Used Polyethylene Fiber |
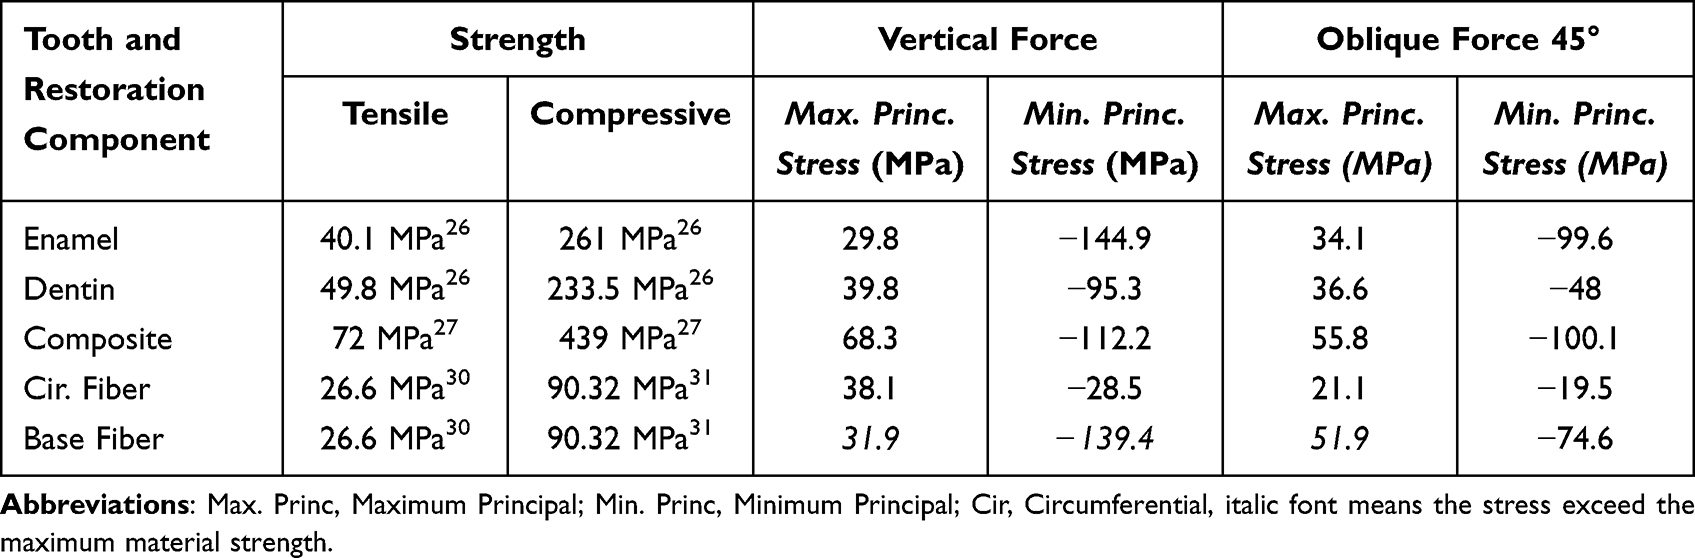 |
Table 6 Maximum and Minimum Principal Stress on Non-Cuspal Coverage Restoration Using e-Glass Fiber |
 |
Table 7 Maximum and Minimum Principal Stress on Cuspal Coverage Restoration Used Polyethylene Fiber |
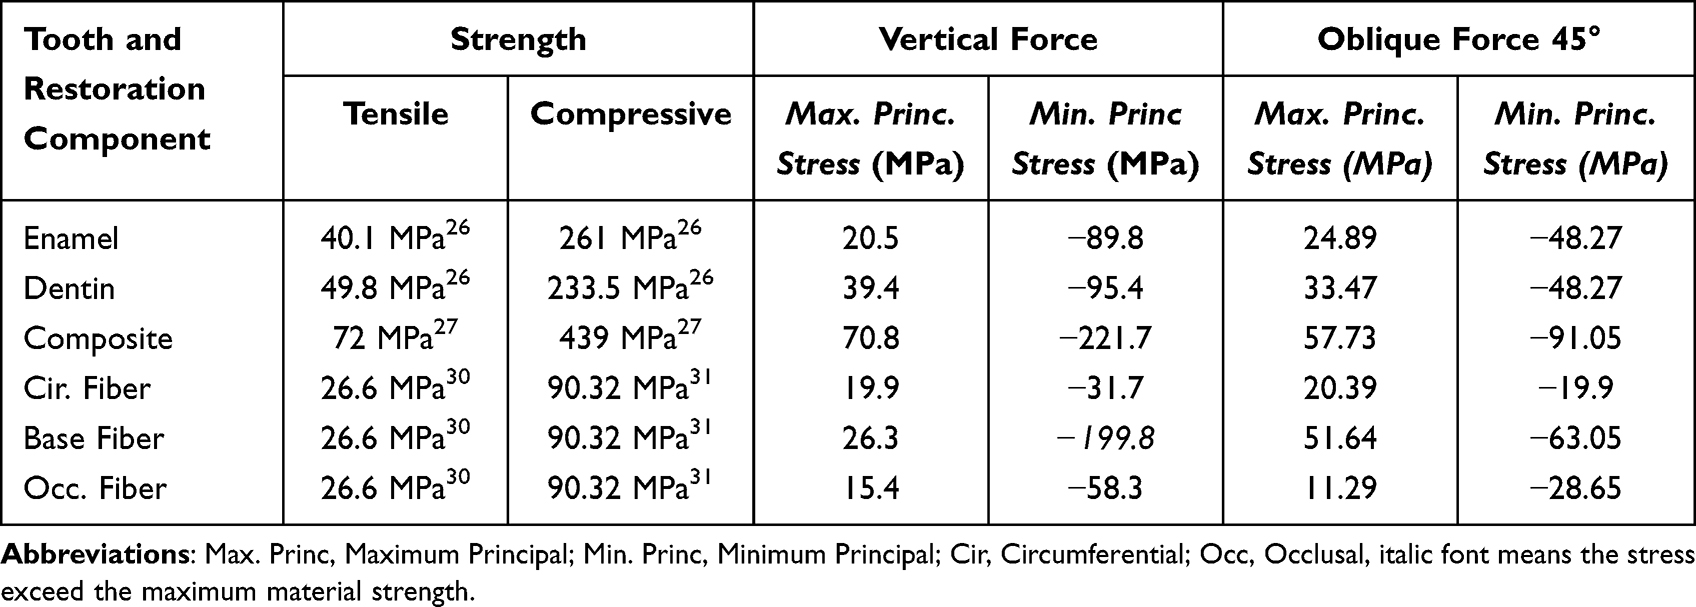 |
Table 8 Maximum and Minimum Principal Stress on Cuspal Coverage Restoration Using e-Glass Fiber |
Stress distribution on tooth structure and restoration when vertical and lateral forces were applied are shown in Figures 4–7. Stress concentrations of restoration occurred on the distolingual cusp, marginal ridge distal, occlusal groove, and CEJ. However, in this area, there is no failure because the strength of the material is greater than the maximum principal stress and minimum principal stress. Structural failure was seen in e-glass fiber. Failure occurred on the base and circumferential fiber, whereas on the cuspal coverage group occurred at the base fiber because of compressive stress.
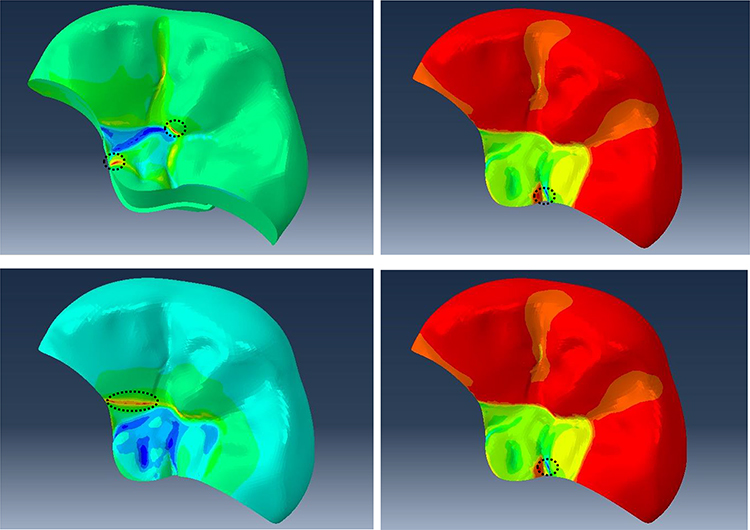 |
Figure 4 The black dashed circles is the location of high-stress concentration on a fiber-reinforced composite of polyethylene non-cuspal coverage (PNCC). The red area is the maximum principal stress on the surface of the restoration when a vertical force (above) and an oblique force (below). The blue area is the minimum principal stress on the surface of the restoration when a vertical (above) and an oblique force (below). |
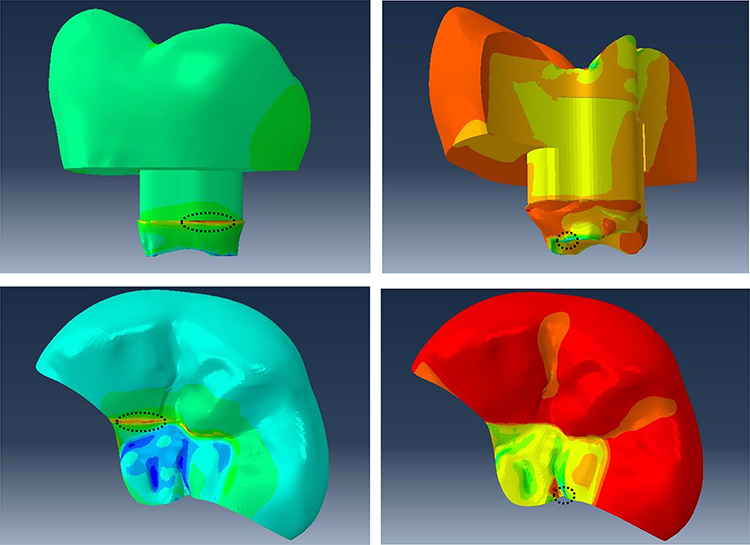 |
Figure 5 The black dashed circles is the location of high-stress concentration on a fiber-reinforced composite of e-glass fiber non-cuspal coverage (ENCC). The red area is the maximum principal stress on the surface of the restoration when a vertical force (above) and an oblique force (below). The blue area is the minimum principal stress on the surface of the restoration when a vertical (above) and an oblique force (below). |
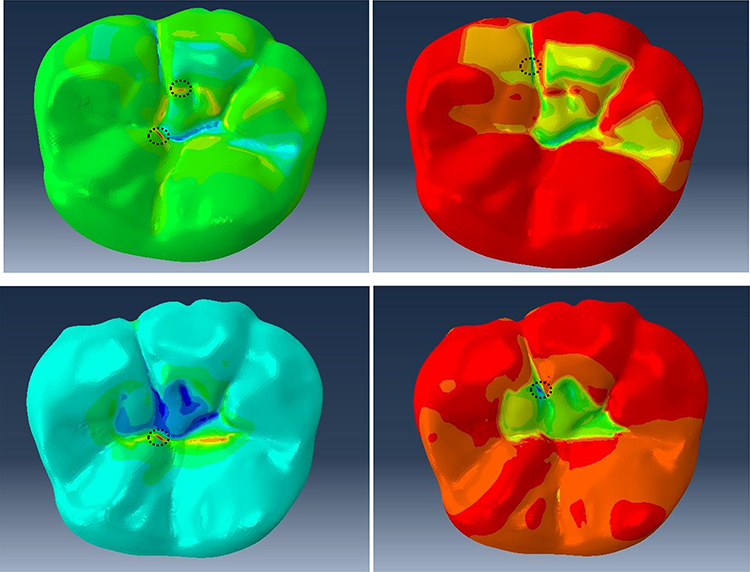 |
Figure 6 The black dashed circles is the location of high-stress concentration on a fiber-reinforced composite of polyethylene cuspal coverage (PCC). The red area is the maximum principal stress on the surface of the restoration when a vertical force (above) and an oblique force (below). The blue area is the minimum principal stress on the surface of the restoration when a vertical (above) and an oblique force (below). |
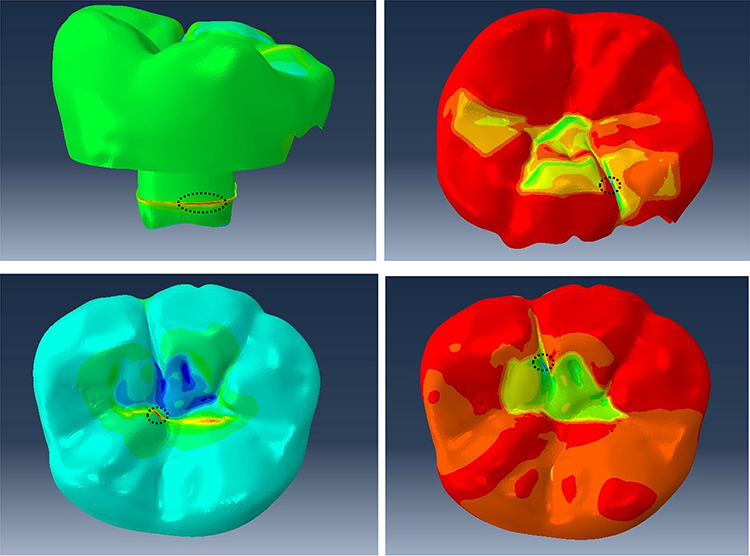 |
Figure 7 The black dashed circles is the location of high-stress concentration on a fiber reinforced composite of e-glass fiber cuspal coverage (ECC). The red area is the maximum principal stress on the surface of the restoration when a vertical force (above) and an oblique force (below). The blue area is the minimum principal stress on the surface of the restoration when a vertical (above) and an oblique force (below). |
Figure 4 shows the location of high stress on a fiber-reinforced composite of polyethylene non-cuspal coverage (PNCC). The maximum principal stress and minimum principal stress occur on the fissure when vertical loading (upper) and oblique loading (below) are applied. Sharp angles and narrow curvatures within fissure systems have the potential to produce stress concentration and crack initiation. Figure 6 illustrates this as well. On a fiber-reinforced composite with polyethylene cuspal coverage (PCC), the high-stress concentration was located on the fissure; nonetheless, failure has not occurred because the maximum and minimum principal stress do not exceed the material strength (Table 7).
Figure 5 shows the location of high-stress concentration on a fiber-reinforced composite of e-glass fiber non-cuspal coverage (ENCC). The stress location occurs on the circumferential fiber, base fiber, and fissure. A failure occurred on the circumferential fiber due to the maximum principal stress exceeding the tensile strength of the fiber component (Table 6) when vertical force was applied. A failure also occurred on base fiber due to the maximum and minimum principal stress exceeding the material strength when vertical force was applied, and when oblique forces were applied, failure occurred due to the maximum principal stress exceeding the tensile strength of e-glass fiber (Table 6).
Figure 7 shows the location of high-stress concentration on a fiber-reinforced composite of e-glass fiber cuspal coverage (ECC) occurs on the fissure and base fiber. The failure occurred on the base fiber when vertical force was applied due to the minimum principal stress exceeding the compressive strength of the fiber (Table 8).
Stress analysis in the adhesive layer between the tooth structure and the restoration is shown in Figures 8–11. The data obtained showed initiation damage and growth criteria in the cohesive zone. Cohesive zone models have been used for the strength prediction of adhesive joints as an add-in to finite element analysis that allow simulation of damage growth by consideration of the energetic principle. The initiation damage criteria indicate the initial value of damage at the interface surface if the value is greater or equal to one.32 The quadratic nominal stress criterion, based on contact stress ratios, states that damage initiates upon fulfillment of equation (1).
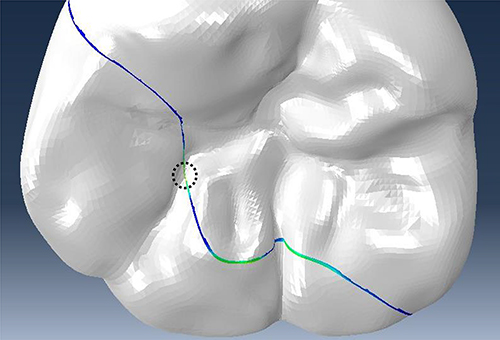 |
Figure 8 Shows where high-stress concentrations are found on the PNCC interfacial surface. The restoration underwent a debonding initiation, as indicated by the dashed black circle, wherein the contact stress ratio reached a value of 1 at the enamel fissure. |
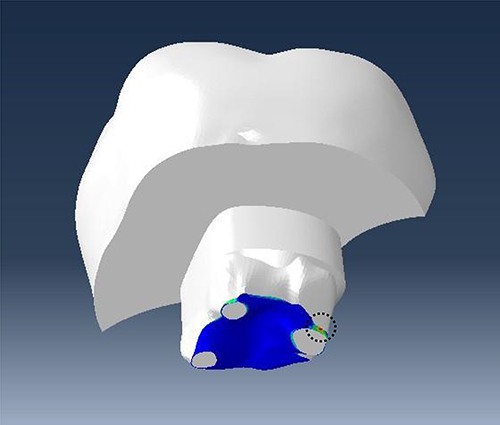 |
Figure 9 Shows where high-stress concentrations are found on the ENCC interfacial surface. The restoration underwent a debonding initiation, as indicated with the dashed black circle, wherein the contact stress ratio reached a value of 1 at the distal region on the base fiber. |
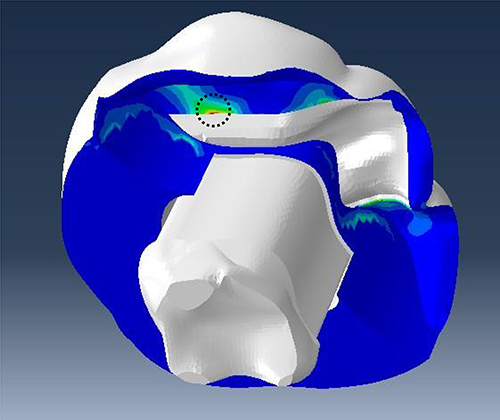 |
Figure 10 Shows where high-stress concentrations are found on the PCC interfacial surface. The restoration underwent a debonding initiation, as indicated with the dashed black circle, wherein the contact stress ratio reached a value of 1 at the fiber occlusal between the enamel and the restoration. |
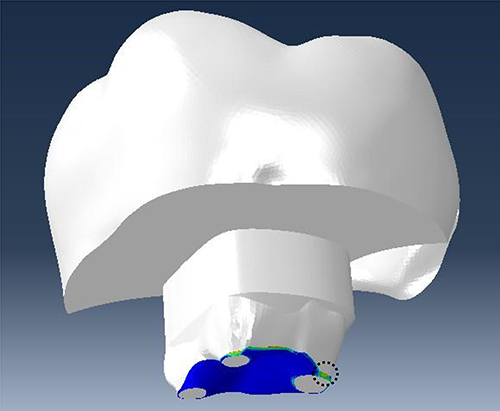 |
Figure 11 Shows where high-stress concentrations are found on the ECC interfacial surface. The restoration underwent a debonding initiation, as indicated with the dashed black circle, wherein the contact stress ratio reached a value of 1 at the distal region on the base fiber. |
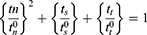
where,
t = generated contact stress (n: normal; s and t: shear) [MPa]
t0 = bond strength (n: normal; s and t: shear) [MPa]
Based on Equation (1), debonding initiation will occur if the contact stress ratio reaches a value of 1. Figure 8 shows the location of high-stress concentrations in the interfacial surface of PNCC. The failure occurred on the enamel surface when vertical force was applied (Table 9), thus debonding between tooth and restoration. Figure 9 shows the location of high-stress concentrations in the interfacial surface of ENCC, debonding between teeth and restoration occurred on the base fiber when oblique force was applied (Table 9). Figure 10 shows the stress location on the interfacial surface of PCC. Debonding occurred on the enamel surface when vertical loading was applied (Table 9). Figure 11 shows the stress location on the interfacial surface of ECC. Debonding occurs on the base surface when vertical and oblique forces are applied.
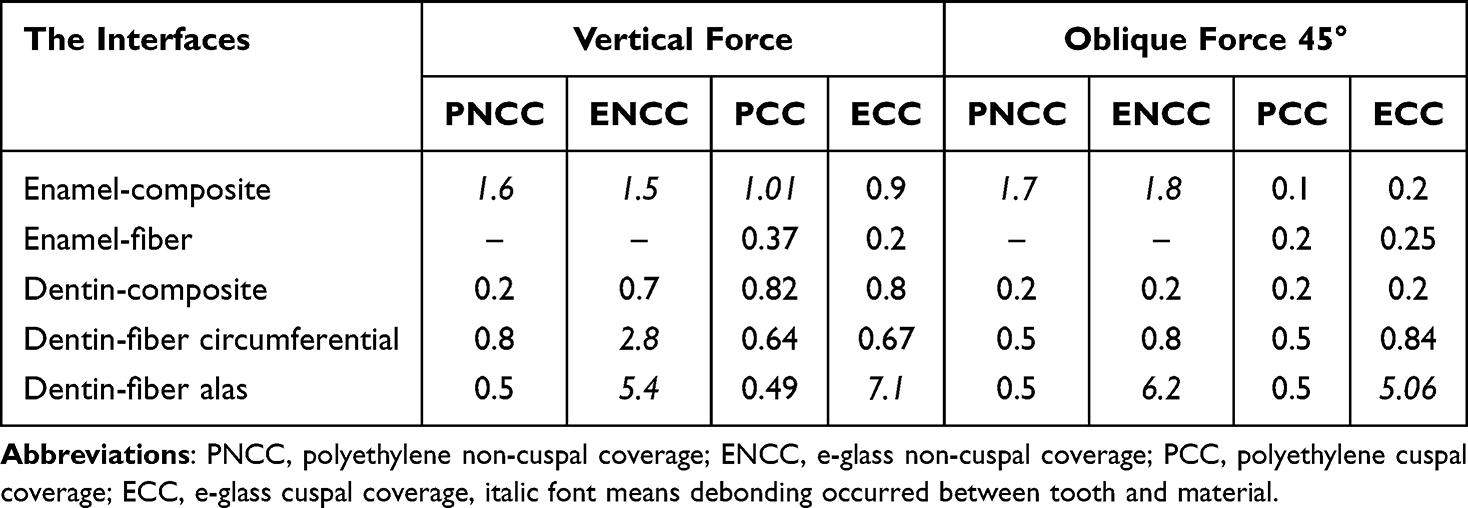 |
Table 9 The Initiation Damage Criterion |
Discussion
The biomechanical function of the tooth is based on the transfer of masticatory force which is influenced by the hard tissue of the tooth, the mechanical properties of the restorative material and the interfacial bond.33 ETT undergoes structural changes due to loss of enamel, dentin and marginal ridge resulting in high-stress concentrations during biomechanical function. The selection of restorative materials that can distribute stress will affect the resistance and retention of teeth after root canal treatment against chewing forces so that biomechanical functions are achieved.34
The stress location occurred on the central groove/fissure, marginal ridge distal and margin restoration of the non-cuspal coverage group using polyethylene and e-glass. The stress location of the cuspal coverage group occurred on the buccal groove which is the margin of the restoration, marginal ridge distal and on the base of the restoration at the occlusal portion of the enamel-composite. The location of the high-stress concentration on the enamel is the stress-bearing area of the posterior teeth.33
The modulus elasticity of Enamel is 50.2 GPa.14 Enamel was a brittle material thus prone to mechanical failure in the central groove. The thickness of the enamel on the fissure is thinner than the cusp region, the sharp angles and narrow curvatures within the fissure system have the potential to provide stress concentration and crack initiation. The posterior cusp is subjected to flexural forces during occlusal movements. Flexural forces produce resultant horizontal forces that cause space formation and create concentrations of tensile stresses and cracks at the base of the fissures. The type of fissure anatomy, cusp angulation and material properties influence the stress distribution that can cause fracture.35
Finite element analysis suggests that stress concentration is influenced by the material used (95.49%) on the restorative material and the cavity design (>80%) of the remaining tooth structure.36 Cusp reduction is required when the isthmus width is greater than two-thirds of the intercuspal distance or a half buccolingual distance.37 ETT restored with cuspal coverage restorations can distribute the functional stress on the remaining tooth structure and protect against fracture.38,39 Cusp reduction reduced stress concentration on the enamel part at the cuspal coverage models shown in Tables 7 and 8.
Cusp reduction promotes more hard tissue reduction but can reduce stress by minimizing angular differences and curvature at the occlusal surface. This procedure moves the margin restoration to the buccal and palatal surfaces thus protecting the interfacial bond away from the loading area. Cusp built up with composite should be an option for restored endodontically treated teeth. In vitro studies have shown that cusp reduction can be considered by reducing the height of the cusp at least 1.5 mm to significantly reduce stress and improve fracture resistance.36,39
The failure occurred on the base and circumferential structure of e-glass fiber reinforced composite (Figures 5 and 7) when vertical force was due to tensile and compressive stress, while oblique force was applied due to tensile forces. In circumferential fiber failure occurs when vertical force due to tensile force results in stress concentration that exceeds the strength of the material. Restoration materials should have a modulus of elasticity similar to dentin (17.8 GPa) to create a homogeneous stress distribution and reduce the incidence of root fracture.7,12,40,41 The results showed the stress concentration on polyethylene fiber-reinforced composite restorations did not exceed the strength of the materials. E-glass fiber has an elastic modulus of 8.87 GPa. Composite and polyethylene fiber has elastic modulus close to dentin 20.4 GPa and 23.6 GPa. Yamanel et al investigated the materials that had a high modulus of elasticity which tended to concentrate more stress within the restoration, whereas materials that had a low modulus of elasticity tended to transfer more stress to the tooth structure affected a greater risk of fracture.42–44 Materials had a lower modulus of elasticity experienced greater strain when a force was applied.33
Mechanical and bonding properties of FRC are influenced by fiber type and polymer matrix, quantity, orientation, volume, and geometry. The most effective fiber geometry and orientation is placed on the part that is affected by the tensile force, when the fiber position is horizontal (perpendicular to the force), it is more efficient than the vertical position (parallel to the force).26,45,46 The thickness of fiber would impact the resistance and durability of the restoration.46 The thickness of polyethylene and e-glass fibers is 0.18 mm and 0.1 mm, the difference in thickness will have an impact on the volume and affect the stress of the restoration. Tables 5–8 show the polyethylene stress is lower than e-glass, the thickness of the material will reduce volume and minimize stress.
Bonding of composites and dental hard tissues is based on micromechanical interlocking of the adhesive resin at dentin and enamel surfaces. Adhesive joint in enamel depends on micromechanical retention due to microporosity and hybridization on exposed collagen dentin. The interfacial bond is the weakest area of composite restorations due to the stress concentration at the interfacial bond.46 Ilday et al investigated shear bond strength on FRC and found the fiber could transfer stress to a wider surface, thereby reducing stress at the interface. FRC had an elastic modulus similar to dentin and showed lower failure and improved success.24
Enamel bonding failure was seen in all models except ECC under vertical force and on PCC, ECC under oblique forces (Table 9). FRC used e-glass fiber which showed failure on the enamel and dentin. Tiu et al investigated the strength of the adhesive interface between two different materials influenced by the modulus of elasticity.47 Modulus elasticity of enamel and composite are 50.2 GPa and 20.4 GPa, while e-glass and dentin are 8.87 GPa and 17.8 GPa. These materials have a considerable difference in elastic modulus ratio that causes high-stress concentration and debonding when force is applied.
Ilday et al investigated that the shear bond strength of e-glass fiber was higher than polyethylene on both the enamel and dentin surfaces (Table 4). The interfacial bond between fiber and composite plays a role in fracture. If the interfacial bond is too strong, the composite will act as a rigid and brittle material, and when force is applied, it will cause a fracture in the fiber. If the interfacial bond is too weak, the fiber will be easily attracted, and the composite will exhibit low strength and low toughness, resulting in the fracture of the composite. In addition, the difference in thickness between polyethylene and e-glass fiber will affect the interfacial bond, the thicker fiber will increase the friction resistance so that the optimal interfacial bond can be achieved.24
Conclusion
Stress distribution in the polyethylene non-cuspal coverage group, No failure occurred on FRC when 720 N of vertical force and 200 N of oblique force were applied due to the maximum and minimum principal stress being lower than the strength of the materials. Failure occurs at the interface on the enamel surface when the vertical and oblique loadings cause debonding.
Stress distribution in the polyethylene cuspal coverage group. No failure occurred on FRC when 720 N of vertical force and 200 N of oblique force were applied due to the maximum and minimum principal stress being lower than the strength of the material. The failure occurred in the interface on the enamel surface when vertical loading was applied, so there was debonding.
Stress distribution in the e-glass non-cuspal coverage group. The failure occurred on FRC when 720 N of vertical force and 200 N of oblique force were applied due to the maximum and minimum principal stress on the circumferential fiber and fiber base section exceeding the material strength. The interface bonding failure occurs in the dentin fiber when the vertical tension due to the concentration of stress in this area is higher, so there is debonding.
Stress distribution in the e-glass cuspal coverage group. The failure occurred on FRC when 720 N of vertical force and 200 N of oblique force were applied due to the maximum principal stress in the fiber circumferential exceeding the strength of the material. Interface bonding failure occurs in the circumferential fiber when vertical loading is applied. Then, the interface bonding failure occurs in the base fiber when the vertical and lateral forces are applied because the stress in this area is higher, so there is debonding.
Funding
The work was self-funded, and the study did not receive any financial support from any company or organization.
Disclosure
The authors report no conflicts of interest in this study.
References
1. Berman LH, Hargreaves KM. Cohen’s Pathways of the Pulp.
2. Baruah S, Nair C, Kanaujia S, Joshi R. Review article the advent of the compression dome concept. World J Pediatr Congenital Heart Surg. 2020;11(2):NP226–NP228. doi:10.1177/2150135118825158
3. Marvaniya J, Agarwal K, Mehta DN, Parmar N, Shyamal R, Patel J. Minimal invasive endodontics: a comprehensive narrative review. Cureus. 2022;14(6). doi:10.7759/cureus.25984
4. Sadaf D. Survival rates of endodontically treated teeth after placement of definitive coronal restoration: 8-year retrospective study. Ther Clin Risk Manag. 2020;16:125–131. doi:10.2147/TCRM.S223233
5. Chotvorrarak K, Suksaphar W, Banomyong D. Retrospective study of fracture survival in endodontically treated molars: the effect of single-unit crowns versus direct-resin composite restorations. Restor Dent Endod. 2021;46(2):1–11. doi:10.5395/rde.2021.46.e29
6. Tanner J, Tolvanen M, Garoushi S, Säilynoja E. Clinical evaluation of fiber-reinforced composite restorations in posterior teeth - results of 2.5 year follow-up. Open Dent J. 2018;12(1):476–485. doi:10.2174/1874210601812010476
7. Deliperi S, Alleman D, Rudo D. Stress-reduced direct composites for the restoration of structurally compromised teeth: fiber design according to the “wallpapering” technique. Oper Dent. 2017;42(3):233–243. doi:10.2341/15-289-T
8. Gaintantzopoulou MD, Farmakis ET, Eliades GC. Effect of load cycling on the fracture strength/mode of teeth restored with FRC posts or a FRC liner and a resin composite. Biomed Res Int. 2018;2018:1–10. doi:10.1155/2018/9054301
9. Lukarcanin J, Sadikoǧlu İS, Yaşa B, Türkün LŞ, Türkün M. Comparison of different restoration techniques for endodontically treated teeth. Int J Biomater. 2022;2022. doi:10.1155/2022/6643825
10. Visser HJ, Brandt PD. Fracture behaviour patterns of cusp-replacing fibre strengthened composite restorations. S Afr Dent J. 2015;70(9):390–395.
11. Shah EH, Shetty P, Aggarwal S, Sawant S, Shinde R, Bhol R. Effect of fibre-reinforced composite as a post-obturation restorative material on fracture resistance of endodontically treated teeth: a systematic review. Saudi Dent J. 2021;33(7):363–369. doi:10.1016/j.sdentj.2021.07.006
12. Zheng Z, Sun J, Jiang L, et al. Influence of margin design and restorative material on the stress distribution of endocrowns: a 3D finite element analysis. BMC Oral Health. 2022;22(1):1–12. doi:10.1186/s12903-022-02063-y
13. Magne P. Efficient 3D finite element analysis of dental restorative procedures using micro-CT data. Dent Mater. 2007;23(5):539–548. doi:10.1016/j.dental.2006.03.013
14. Barcelos LM, Bicalho AA, Veríssimo C, Rodrigues MP, Soares CJ. Stress distribution, tooth remaining strain, and fracture resistance of endodontically treated molars restored without or with one or two fiberglass posts and direct composite resin. Oper Dent. 2017;42(6):646–657. doi:10.2341/16-224-L
15. Cheron RA, Marshall SJ, Goodis HE, Peters OA. Nanomechanical properties of endodontically treated teeth. J Endod. 2011;37(11):1562–1565. doi:10.1016/j.joen.2011.08.006
16. Elkholy MMA, Nawar NN, Ha WN, Saber SM, Kim HC. Impact of canal taper and access cavity design on the life span of an endodontically treated mandibular molar: a finite element analysis. J Endod. 2021;47(9):1472–1480. doi:10.1016/j.joen.2021.06.009
17. Navimipour EJ, Firouzmandi M, Mirhashemi FS. Finite element analysis of the endodontically-treated maxillary premolars restored with composite resin along with glass fiber insertion in various positions. J Contemp Dent Pract. 2015;16(4):284–290. doi:10.5005/jp-journals-10024-1677
18. Asopa S, Mandava J, Chalasani U, Anwarullah A, Ravi R. Fracture resistance of endodontically treated molars restored with resin composites. Indian J Conserv Endod. 2017;2(3):89–97.
19. Halaçoglu DM, Yamanel K. The effects of different base materials on the stress distribution of the endodontically treated teeth: 3D FEA. Cumhur Dent J. 2019;22(1):56–65. doi:10.7126/cumudj.453467
20. Prabhakar A, Shrikant L, Nadig B. Stress analysis in maxillary incisor following fragment reattachment: a finite element analysis. J Dent Allied Sci. 2016;5(1):7. doi:10.4103/2277-4696.185188
21. Rizzante FAP, Mondelli RFL, Furuse AY, Borges AFS, Mendonça G, Ishikiriama SK. Shrinkage stress and elastic modulus assessment of bulk-fill composites. J Appl Oral Sci. 2019;27:1–9. doi:10.1590/1678-7757-2018-0132
22. Sadr A, Bakhtiari B, Hayashi J, et al. Effects of fiber reinforcement on adaptation and bond strength of a bulk-fill composite in deep preparations. Dent Mater. 2020;36(4):527–534. doi:10.1016/j.dental.2020.01.007
23. Tezvergil-Mutluay A, Lassila LVJ, Vallittu PK. Microtensile bond strength of fiber-reinforced composite with semi-interpenetrating polymer matrix to dentin using various bonding systems. Dent Mater J. 2008;27(6):821–826. doi:10.4012/dmj.27.821
24. Ilday N, Seven N. The influence of different fiber-reinforced composites on shear bond strengths when bonded to enamel and dentin structures. J Dent Sci. 2011;6(2):107–115. doi:10.1016/j.jds.2011.03.008
25. Anatavara S, Sitthiseripratip K, Senawongse P. Stress relieving behaviour of flowable composite liners: a finite element analysis. Dent Mater J. 2016;35(3):369–378. doi:10.4012/dmj.2015-204
26. Perdigão J. Restoration of root canal-treated teeth; 2016.
27. GrandioSo, Voco.Scientific compendium. 2017.
28. Hasanah, Prihashinta Uswatun, Purwanto Agustiono, Widjijono Widgijono. Comparison of traction strength between fiber and braided fiber on fiber reinforced composite type ultrahigh molecular weight polyethelene (uhmwpe). 2018;3(1):18–21.
29. Afifa Zahratu Firda D. Impact of fiber braided polyethylene application on composite nanofil resin pressure strength. PhD Thesis. Muhammadiyah University Surakarta. 2016.
30. Rosyida NF, Sunarintyas S, Pudyani PS. The effect of silanated and impregnated fiber on the tensile strength of E-glass fiber reinforced composite retainer. Dent J. 2015;48(1):22. doi:10.20473/j.djmkg.v48.i1.p22-25
31. Mangoush E, Säilynoja E, Prinssi R, Lassila L, Vallittu PK, Garoushi S. Comparative evaluation between glass and polyethylene fiber reinforced composites: a review of the current literature. J Clin Exp Dent. 2017;9(12):1408–1417.
32. Zou Z, Hameed M. Combining interface damage and friction in cohesive interface models using an energy based approach. Compos Part a Appl Sci Manuf. 2018;112:290–298. doi:10.1016/j.compositesa.2018.06.017
33. Kaladevi M, Balasubramaniam R. Biomechanics in restorative dentistry. Int J Appl Dent. 2020;6(2):251–256.
34. Soares CJ, Rodrigues M, Faria-E-Silva AL, et al. How biomechanics can affect the endodontic treated teeth and their restorative procedures. Braz Oral Res. 2018;32:169–183. doi:10.1590/1807-3107bor-2018.vol32.0076
35. Wan B, Shahmoradi M, Zhang Z, et al. Modelling of stress distribution and fracture in dental occlusal fissures. Sci Rep. 2019;9(1):1–10. doi:10.1038/s41598-019-41304-z
36. Lia Mondelli RF, Ishikiriama SK, De Oliveira Filho O, Mondelli J. Fracture resistance of weakened teeth restored with condensable resin with and without cusp coverage. J Appl Oral Sci. 2009;17(3):161–165. doi:10.1590/S1678-77572009000300006
37. Serin Kalay T, Yildirim T, Ulker M. Effects of different cusp coverage restorations on the fracture resistance of endodontically treated maxillary premolars. J Prosthet Dent. 2016;116(3):404–410. doi:10.1016/j.prosdent.2016.02.007
38. Daneshkazemi A, Mehdi M, Bahabad J, Hosein M, Iranaq A, Karimian E. Stress distribution in four restorative methods in endodontically treated maxillary premolar: a 3D finite element analysis; 2019.
39. Maravić T, Vasiljević D, Kantardžić I, Lainović T, Lužanin O, Blažić L. Influence of restorative procedures on endodontically treated premolars: finite element analysis of a CT-scan based three-dimensional model. Dent Mater J. 2018;37(3):493–500. doi:10.4012/dmj.2017-064
40. Valizadeh S, Ranjbar Omrani L, Deliperi S, Sadeghi Mahounak F. Restoration of a nonvital tooth with fiber reinforce composite (wallpapering technique). Case Rep Dent. 2020;2020. doi:10.1155/2020/9619787
41. Macedo VC, Faria e Silva AL, Marcondes Martins LR, et al. Effect of cement type, relining procedure, and length of cementation on pull-out bond strength of fiber posts. J Endod. 2010;36(9):1543–1546. doi:10.1016/j.joen.2010.04.014
42. Yamanel K, Çaǧlar A, Gülşahi K, Özden UA. Effects of different ceramic and composite materials on stress distribution in inlay and onlay cavities: 3-D finite element analysis. Dent Mater J. 2009;28(6):661–670. doi:10.4012/dmj.28.661
43. Haralur SB, Alamri AA, Alshehri SA, Alzahrani DS, Alfarsi M. Influence of occlusal thickness and radicular extension on the fracture resistance of premolar endocrowns from different all-ceramic materials. Appl Sci. 2020;10(8):2696. doi:10.3390/app10082696
44. Chen Y, Chen D, Ding H, Chen Q, Meng X. Fatigue behavior of endodontically treated maxillary premolars with MOD defects under different minimally invasive restorations. Clin Oral Investig. 2022;26(1):197–206. doi:10.1007/s00784-021-03991-9
45. Dyer SR, Lassila LVJ, Jokinen M, Vallittu PK. Effect of fiber position and orientation on fracture load of fiber-reinforced composite. Dent Mater. 2004;20(10):947–955. doi:10.1016/j.dental.2003.12.003
46. Ensaff H, O’Doherty DM, Jacobsen PH. The influence of the restoration-tooth interface in light cured composite restorations: a finite element analysis. Biomaterials. 2001;22(23):3097–3103. doi:10.1016/S0142-9612(01)00058-8
47. Tiu J, Belli R, Lohbauer U. Thickness influence of veneering composites on fiber-reinforced systems. Dent Mater. 2021;37(3):477–485. doi:10.1016/j.dental.2020.12.002
 © 2024 The Author(s). This work is published and licensed by Dove Medical Press Limited. The full terms of this license are available at https://www.dovepress.com/terms.php and incorporate the Creative Commons Attribution - Non Commercial (unported, v3.0) License.
By accessing the work you hereby accept the Terms. Non-commercial uses of the work are permitted without any further permission from Dove Medical Press Limited, provided the work is properly attributed. For permission for commercial use of this work, please see paragraphs 4.2 and 5 of our Terms.
© 2024 The Author(s). This work is published and licensed by Dove Medical Press Limited. The full terms of this license are available at https://www.dovepress.com/terms.php and incorporate the Creative Commons Attribution - Non Commercial (unported, v3.0) License.
By accessing the work you hereby accept the Terms. Non-commercial uses of the work are permitted without any further permission from Dove Medical Press Limited, provided the work is properly attributed. For permission for commercial use of this work, please see paragraphs 4.2 and 5 of our Terms.