")
Back to Journals » HIV/AIDS - Research and Palliative Care » Volume 16
Serum Lipid Profiles, Blood Glucose, and High-Sensitivity C-Reactive Protein Levels Among People Living with HIV Taking Dolutegravir and Ritonavir-Boosted Atazanavir-Based Antiretroviral Therapy at Jimma University Medical Center, Southwest Ethiopia, 2021
Authors Waritu NC , Nair SKP, Birhan B, Adugna T , Awgichew GB, Jemal M
Received 29 September 2023
Accepted for publication 5 February 2024
Published 12 February 2024 Volume 2024:16 Pages 17—32
DOI https://doi.org/10.2147/HIV.S430310
Checked for plagiarism Yes
Review by Single anonymous peer review
Peer reviewer comments 2
Editor who approved publication: Prof. Dr. Olubunmi Akindele Ogunrin
Nuredin Chura Waritu,1 Suresh Kumar P Nair,2 Bihonegn Birhan2 ,† Tesfaye Adugna,2 Gesese Bogale Awgichew,2 Mohammed Jemal3
1Department of Biomedical Sciences, School of Medicine, Wolaita Sodo University, Wolaita Sodo, Ethiopia; 2Department of Biomedical Sciences, School of Medicine, Jimma University, Jimma, Ethiopia; 3Department of Biomedical Sciences, School of Medicine, Debre Markos University, Debre Markos, Ethiopia
†Bihonegn Birhan passed away on [September 19, 2023]
Correspondence: Mohammed Jemal, Email [email protected]
Background: Long-term use of antiretroviral therapy, especially dolutegravir and boosted-atazanavir, raises concerns about cardiovascular disease. Thus, this study aimed to assess lipid profiles, blood glucose, and high-sensitivity C-reactive protein levels among people living with HIV on dolutegravir and ritonavir-boosted atazanavir-based therapy.
Methods: An institutional-based comparative cross-sectional study was conducted from November 4, 2021, to January 4, 2022. An equal number of dolutegravir- and ritonavir-boosted atazanavir-treated patients (n = 64 each) was enrolled. A consecutive sampling was used to select participants. The Chi-square, Student’s t-test, Mann–Whitney U-test, and logistic regression were used as appropriate statistical tests using SPSS Version 25.0. Statistical significance was set at p < 0.05.
Results: Dyslipidemia was found in 67.2% (43/64) of ritonavir-boosted atazanavir group and 48.4% (31/64) of dolutegravir group. The dolutegravir group had significantly higher mean and median values of high-density lipoprotein and random blood sugar, respectively, as well as lower median triglyceride and high-sensitivity C-reactive protein levels than the ritonavir-boosted atazanavir group. Ritonavir-boosted atazanavir-based regimens (AOR=3.4, 95% CI: 1.5, 8) and age > 40 years were predictors of dyslipidemia, while BMI ≥ 25 kg/m2 (AOR=3.7, 95% CI: 1.3, 10.8) and dolutegravir-based regimens (AOR=4.6, 95% CI: 1.5, 14) were predictors of hyperglycemia. Ritonavir-boosted atazanavir-based regimens (ARR=3, 95% CI: 1.3, 8) and BMI ≥ 25 kg/m2 (ARR=2.5, 95% CI: 1.1, 6) were associated with increased high-sensitivity C-reactive protein by 1– 3 mg/L. The risk of increased high-sensitivity C-reactive protein by > 3 mg/L was greater in those patients with a CD4 cell count of < 500 cells/mm3 (ARR=5, 95% CI: 1.1, 24).
Conclusion: When compared to ritonavir-boosted atazanavir-based regimens, dolutegravir had favorable lipid profiles and high-sensitivity C-reactive protein but unfavorable blood glucose levels. Therefore, baseline blood glucose, lipid profiles, and high-sensitivity C-reactive protein levels should be routinely measured in patients on these regimens.
Keywords: high-sensitivity C-reactive protein, dolutegravir, dyslipidemia, hyperglycemia, antiretroviral therapy
Introduction
Since the introduction of antiretroviral therapy (ART), the mortality and morbidity of people living with HIV have been reduced.1 Even if ART improves and prolongs life, it presents additional burden for people living with HIV from which atherosclerotic cardiovascular disease (ASCVD) accounts for 46% of all fatalities.2 The prevalence of cardiovascular disease (CVD) has increased over the past 20 years, with sub-Saharan Africa presenting the greatest effects.3 An elevated risk of ASCVD was observed in 71.1% of people living with HIV in Ethiopia taking highly active antiretroviral therapy (HAART).4
People living with HIV present with higher levels of dyslipidemia and hyperglycemia and increased high-sensitivity C-reactive protein (hsCRP) levels compared with general populations, which make them a group at higher risk of developing ASCVD.5–10
According to studies, using dolutegravir (DTG) and ritonavir-boosted atazanavir (ATV/r) for HIV treatment has been linked with abnormal lipid profile levels.11,12 Basically, patients who were switched to DTG-based therapy observed with significant decrease in total cholesterol (TC), triglyceride (TG), and TC/HDL-C ratio (total cholesterol/high density lipoprotein-cholesterol) than protease inhibitors (PI), which makes it the best drug in reducing the risk of having CVD.13,14 However, study from Zambia showed a higher prevalence of low HDL-C was found in patient treated by DTG (59%) than ATV/r (44%) containing ART regimens, which is the likely contributing factor for CVD.15 From study in Ethiopia, higher median values of TG and lower mean values of HDL-C were found among patients treated with ATV/r compared with the efavirenz (EFV)-based regimen of ART.12
Protease and integrase inhibitors induce insulin resistance, resulting in hyperglycemia through inhibition of glucose transporter 4 (GLUT4) and chelation of magnesium ions, respectively.16–23 Case presentations support these concepts by explaining that patients who shift from EFV to DTG-based ART develop abnormal laboratory findings suggestive of diabetes mellitus and higher mean levels of blood glucose, respectively.24,25 Based on reports from studies, an increase in blood glucose level was seen in patients with DTG-containing therapy.26–28 Conversely, another study showed higher mean levels of blood glucose were found among patients treated with ART containing protease inhibitors, and significant improvement was seen after switching from boosted-protease inhibitors (PI/r) to ART containing DTG.29,30
Moreover, HIV- and ART-induced inflammation and persistent immune activation with pro-inflammatory molecules persistently increase serum hsCRP levels in people living with HIV.31,32 It has been shown that increased serum hsCRP levels were independently associated with non-AIDS comorbidities like ASCVD.33 One study from Ethiopia indicated a higher level of hsCRP in ART-experienced people than ART-naïve people living with HIV.34 The use of DTG and ATV/r is associated with raised serum hsCRP levels.30 However, multiple studies have shown a favourable decrease in the mean hsCRP level in patients received DTG than boosted-protease inhibitors.35–38 Several studies have found that a low CD4 cell count, duration of HIV and HAART, higher body mass index (BMI), older age, and deranged anthropometric parameters all contribute to metabolic abnormalities, inflammation, and an increased risk of CVD.39–43
As a result of improved coverage of free ART services, thousands of people living with HIV receive ART, with an overall-free ART coverage of 97.1%.44 Dolutegravir is a relatively new integrase inhibitor recommended by the World Health Organization (WHO) as well as by the national guidelines of Ethiopia as the preferred first-line regimen that is effective, has a high antiviral potency, and can be used without pharmacological enhancements for people living with HIV.45–48 Even though ATV/r in combination with 3TC (lamivudine) plus TDF (tenofovir) can be used as first-line therapy for patients not eligible for DTG and EFV, it is widely used as second-line therapy in Ethiopia.45 Most of the patients were exposed to these regimens of ART.
Routine care currently provided to people living with HIV on DTG and ATV/r-based ART does not include measuring baseline levels of lipid profile, blood glucose, and hsCRP, which are important parameters for improving treatment outcomes and for the early detection and prevention of CVD. To the best of our knowledge, there is no well-documented evidence supporting dyslipidemia, hyperglycemia, and elevated hsCRP levels in relation to DTG and ATV/r-based ART in sub-Saharan African countries, including Ethiopia. Therefore, the present study was designed to assess lipid profiles, blood glucose levels, hsCRP levels, and their associated factors among adult HIV patients receiving DTG and ATV/r-based antiretroviral therapy at Jimma University Medical Center, Southwest Ethiopia.
Methods and Materials
Study Area and Setting
The study was conducted at the ART clinic of the Jimma University Medical Center (JUMC). Jimma Town is located 360 km south-west of Addis Ababa, Ethiopia’s capital city. JUMC has a separate ART clinic that provides services for people living with HIV/AIDS. The total number of adult patients who received ART was 3079 (until October 1, 2021). Of these, 1500 were on first-line ART containing TDF+3TC+DTG, and 167 were on second-line ART containing ATV/r+3TC+TDF. Currently, the JUMC ART clinic provides comprehensive health services in the following areas: voluntary counselling and testing (VCT), prevention of mother-to-child transmission of HIV, follow-up services for HIV-infected patients on ART therapy, and treatment of opportunistic infections. The clinic also provides services to patients from surrounding villages and nearby towns.
Study Design and Period
An institutional-based comparative cross-sectional study was conducted from November 4, 2021, to January 4, 2022.
Study Populations
All adults living with HIV receiving DTG and ATV/r-based ART at the ART clinic of JUMC were the source population. All selected adults living with HIV who received DTG and ATV/r-based ART at the JUMC ART clinic during the study period were included in the study population.
Eligibility Criteria
Patients aged ≥18 years who had received DTG-based and ATV/r-based regimens for at least 6 months (because serum lipid profiles were more likely affected after 6 months of taking ART49) and who volunteered to participate in the study were included. Patients taking DTG-based and ATV/r-based ART regimens for less than 6 months, patients with known diabetes mellitus and pregnancy due to metabolic changes such as dyslipidemia and hyperglycemia,50,51 pre-existing liver and renal problems, active cancer, and patients on anti-tuberculosis drugs due to the presence of changes in serum levels of hsCRP,52–55 patients taking lipid-lowering drugs, and those who did not volunteer to participate in the study were excluded.
Sample Size Determinations and Sampling procedure
The number of participants included in the study was calculated using the G* power statistical power analysis version 3.1 software. The sample size was calculated by considering α = 0.05, power (1–β) = 80%, with a DTG to ATV/r ratio of 1:1, two independent groups mean t-test, and an effect size = 0.5. The computed sample size was 128. Of these, 64 were in the DTG-based group and 64 were in the ATV/r-based group. A consecutive sampling technique was applied. All participants who fulfilled the inclusion criteria and were ready to participate were included in the study until the required sample size of 128 was achieved.
Data Collection Procedures
Before data collection, training was provided to the data collectors for 1 day by the principal investigator. Data collectors introduced themselves to make connections with patients. Training was provided to two nurses regarding the objective, methodology, and ethical issues of the study, as well as on interview approach and how to measure anthropometric parameters. Trained nurses collected sociodemographic and related clinical data using a checklist prepared in English and then translated into Afan Oromo and Amharic languages. The questionnaire was back-translated into English to check for consistency. The time of initiation of HAART, medical history, WHO clinical stage, and viral load values were recorded using a structured questionnaire from the medical record card. A 5 mL sample of venous blood was collected from each study participant for laboratory testing by laboratory technologists.
Anthropometric Measurements
Anthropometric measurements such as height, weight, waist circumference, and hip circumference were collected by ART-trained nurses using a standard balance and an SECA meter. After the weight and height were measured, the BMI was calculated by dividing the individual’s weight in kilograms by the square of their height in meters (kg/m2). BMI was categorized as obese if BMI ≥25 kg/m2 and normal if BMI <25 kg/m2. The range of abnormal waist circumference for males and females was >102 cm and >88 cm, respectively. The cut-off for the waist–hip ratio was ≥0.9 for males and ≥0.85 for females, according to the criteria of the WHO guidelines.56,57
Blood Sample Collection
To determine the serum lipid profiles, hsCRP, random blood sugar (RBS), and CD4 cell count, 5 mL of blood was collected from study participants using plain yellow-topped tubes by qualified professionals under aseptic conditions. Before centrifugation, whole blood was applied to the test strip and pipetted for the RBS and CD4 cell count measurements, respectively. The remaining blood was centrifuged at 3000 rpm for 5 min. The serum obtained was stored at 4 °C until the analysis of lipid profiles and hsCRP levels.58 Lipid profiles and hsCRP levels were determined using a Roche Cobas 6000 analyzer. Blood glucose was determined using a glucometer, and the CD4 cell count was determined using a BD FACSPrestoTM near the patient CD4 count system, which consisted of a FACSPresto counter machine and a BD FACSPresto TM Cartridge kit.
Operational and Standard Definitions
Dyslipidemia: abnormally elevated levels of any type of lipoprotein in the blood of an individual. TC, LDL-C, TG, and HDL-C levels ≥200 mg/dL, ≥130 mg/dL and ≥150 mg/dL, and <40 mg/dL, respectively, were considered abnormal.59
Hyperglycemia: Elevated random blood glucose levels of ≥200 mg/dl according to the American Diabetes Association (ADA) criteria.60
hsCRP levels: hsCRP protein classified based on the risk of CVD, <1 mg/L being low risk, 1–3 mg/L being moderate risk, and >3 mg/L being high risk, based on the American Heart Association (AHA) and Centers for Disease Control and Prevention (CDC).61
CD4 cell count ≥500 cells/mm3: level indicating normal range and a competent immune system.62
CD4 cell count <500 cells/mm3: level indicating a compromised immune system.62
Viral loads above 1000 copies/mL: level indicating virological failure and high viral loads in the blood.63
Viral loads below 1000 copies/mL: level indicating suppressed viral loads.63
Data Analysis Procedures
The data were checked, cleaned, entered into Epi-data software version 3.1, and exported to SPSS version 25.0. Simple descriptive statistics were used to present the participants’ sociodemographic characteristics. Categorical variables were presented as numbers and percentages, computed using the chi-square test to detect differences between the groups, while continuous variables were presented as mean ± standard deviation and median (IQR); the Student’s t-test for variables showing normality and the Mann–Whitney U-test for variables that did not show normality were then used to detect differences between the groups. Binary and multivariable logistic regression analyses were performed to identify the factors associated with dyslipidemia and hyperglycemia. Variables with p-values <0.25 in bivariable logistic regression were fitted into the multivariable logistic regression model for the final analysis. Multinomial logistic regression was performed to detect the predictor variables with increased hsCRP levels. Statistical significance was set at p<0.05 for all analyses of variables. Hosmer Lemeshow and Pseudo R square tests were checked, and problems were not found. Finally, the data were presented in the form of text, tables, and figures.
Data Quality Management
Data collection was controlled by the principal investigator, and the collected data were checked for completeness, consistency, and clarity. Blood samples for biochemical assays were collected with adherence to the standard operating procedure (SOP). Following quality control measures that meet established acceptance criteria, the patient’s sample was run by the laboratory machine.
Ethical Consideration
Before data collection, ethical clearance was obtained from the Institutional Review Board of Jimma University (ref. No.: IHRPG1/5/2021). After it was given to JUMC and a permission letter had been obtained from the hospital, data collection had started. Written informed consent was obtained from all patients before the interviews after providing information about the purpose and method of the study. Participants were coded to ensure confidentiality, and their information was kept confidential during data analysis. COVID-19 infection prevention measures recommended by the WHO were strictly followed during data collection to reduce the risk of infection transmission. This study was conducted in accordance with Declaration of Helsinki.
Results
Sociodemographic Characteristics of the Study Participants
Of the total 128 participants, 64 were DTG-treated, and 64 were ATV/r-treated. Among patients on DTG-based and ATV/r-based regimens, 48.4% (31/64) and 37.5% (24/64), respectively, were older than age 40 years, with an insignificant difference between them. Among our study groups, an insignificant difference was detected for most of the participants’ sociodemographic characteristics (see Table 1).
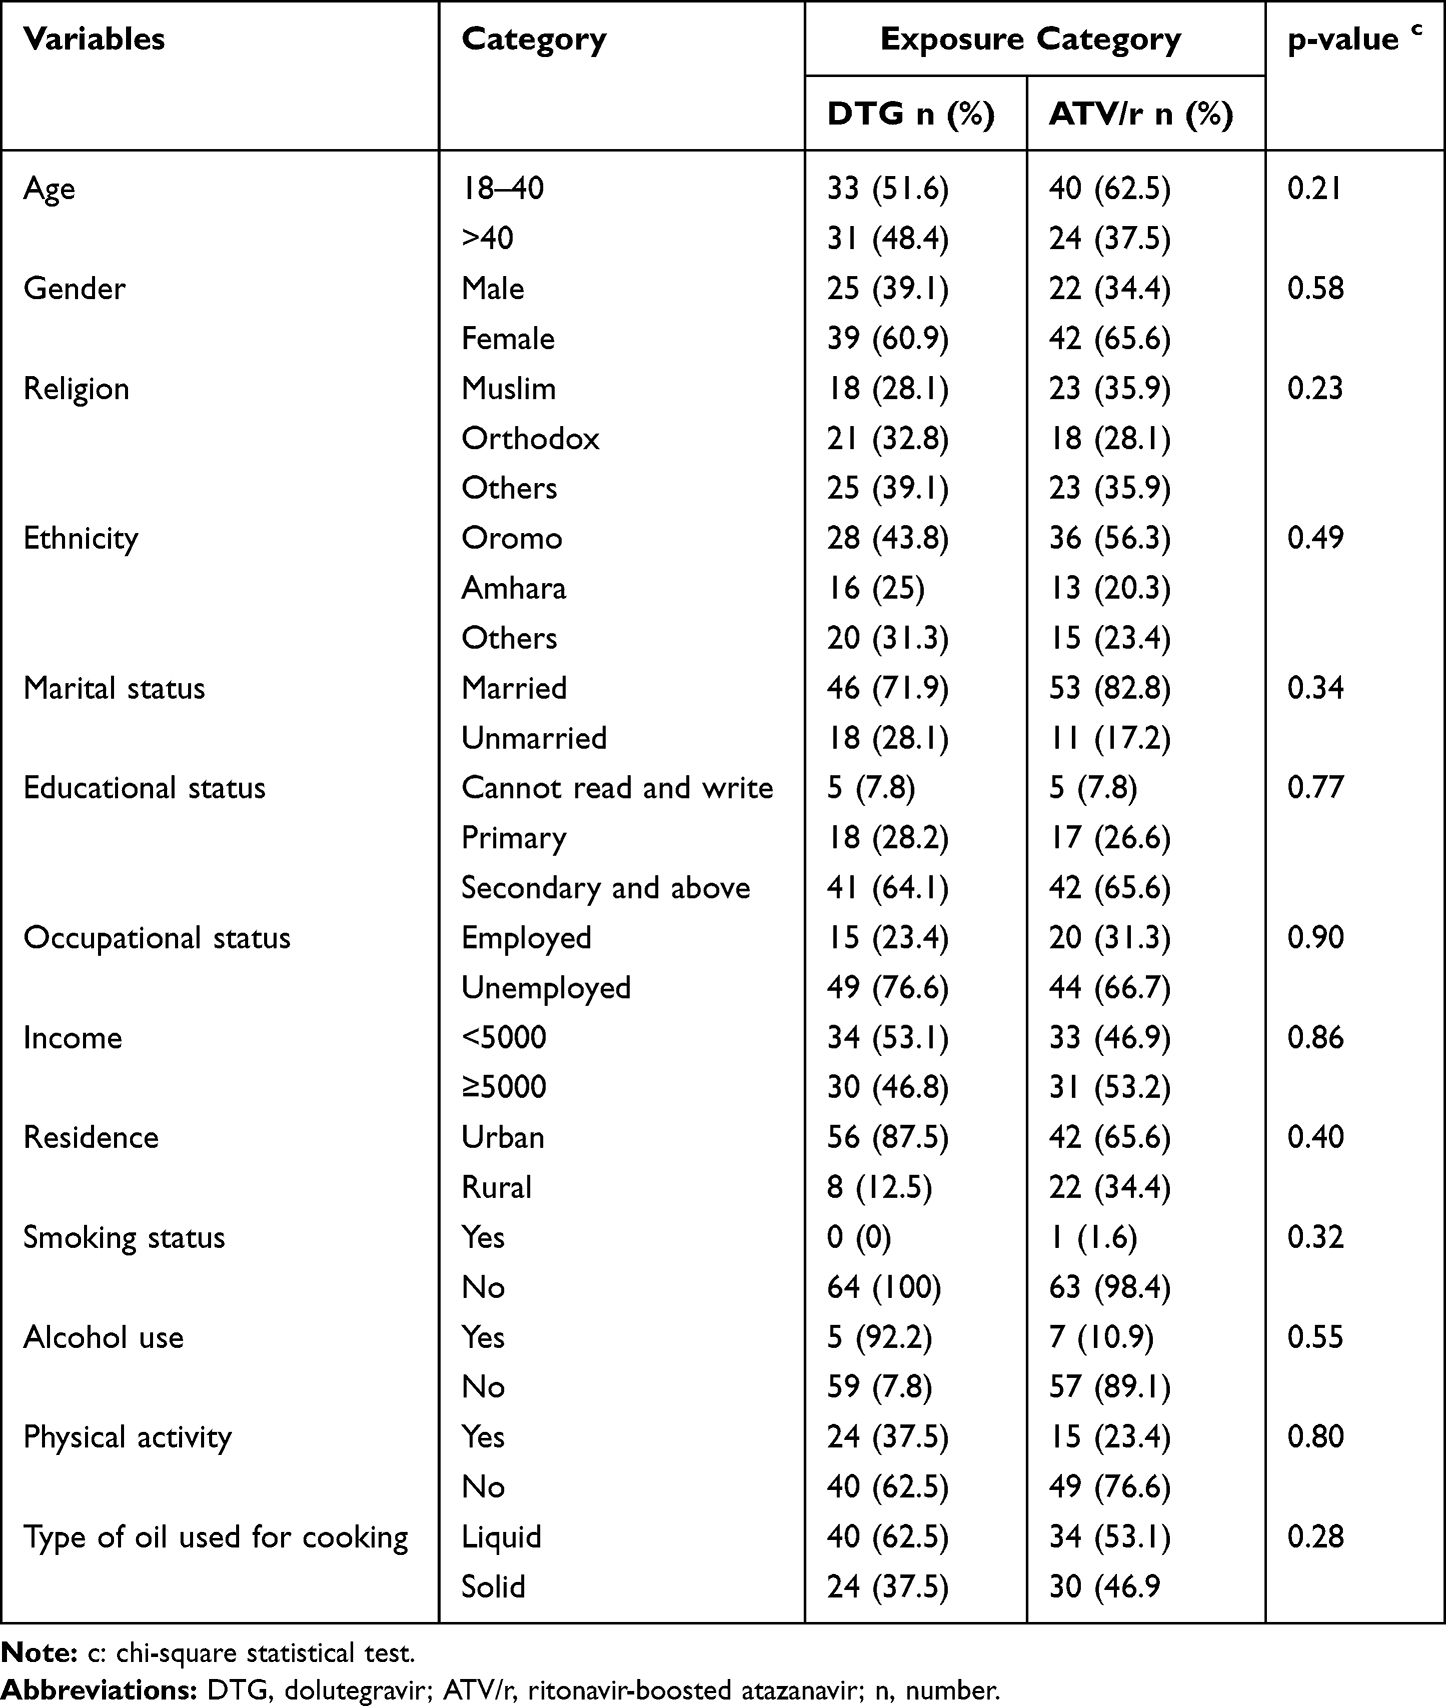 |
Table 1 Sociodemographic Characteristics of People Living with HIV Taking DTG-Based and ATV/r-Based ART at JUMC, Southwest Ethiopia from November 4, 2021, to January 4, 2022 (n=128) |
Clinical and Anthropometric Characteristics of the Study Participants
This study revealed that 35.9% (23/64) and 57.8% (37/64) of patients treated with DTG-based and ATV/r-based ART (p-value=0.013), respectively, were taking HAART for >24 months. In addition, approximately 54.7% (35/64) of DTG-treated and 53.1% (34/64) of ATV/r-treated patients had a BMI ≥ 25 kg/m2 (p=0.9) (Table 2).
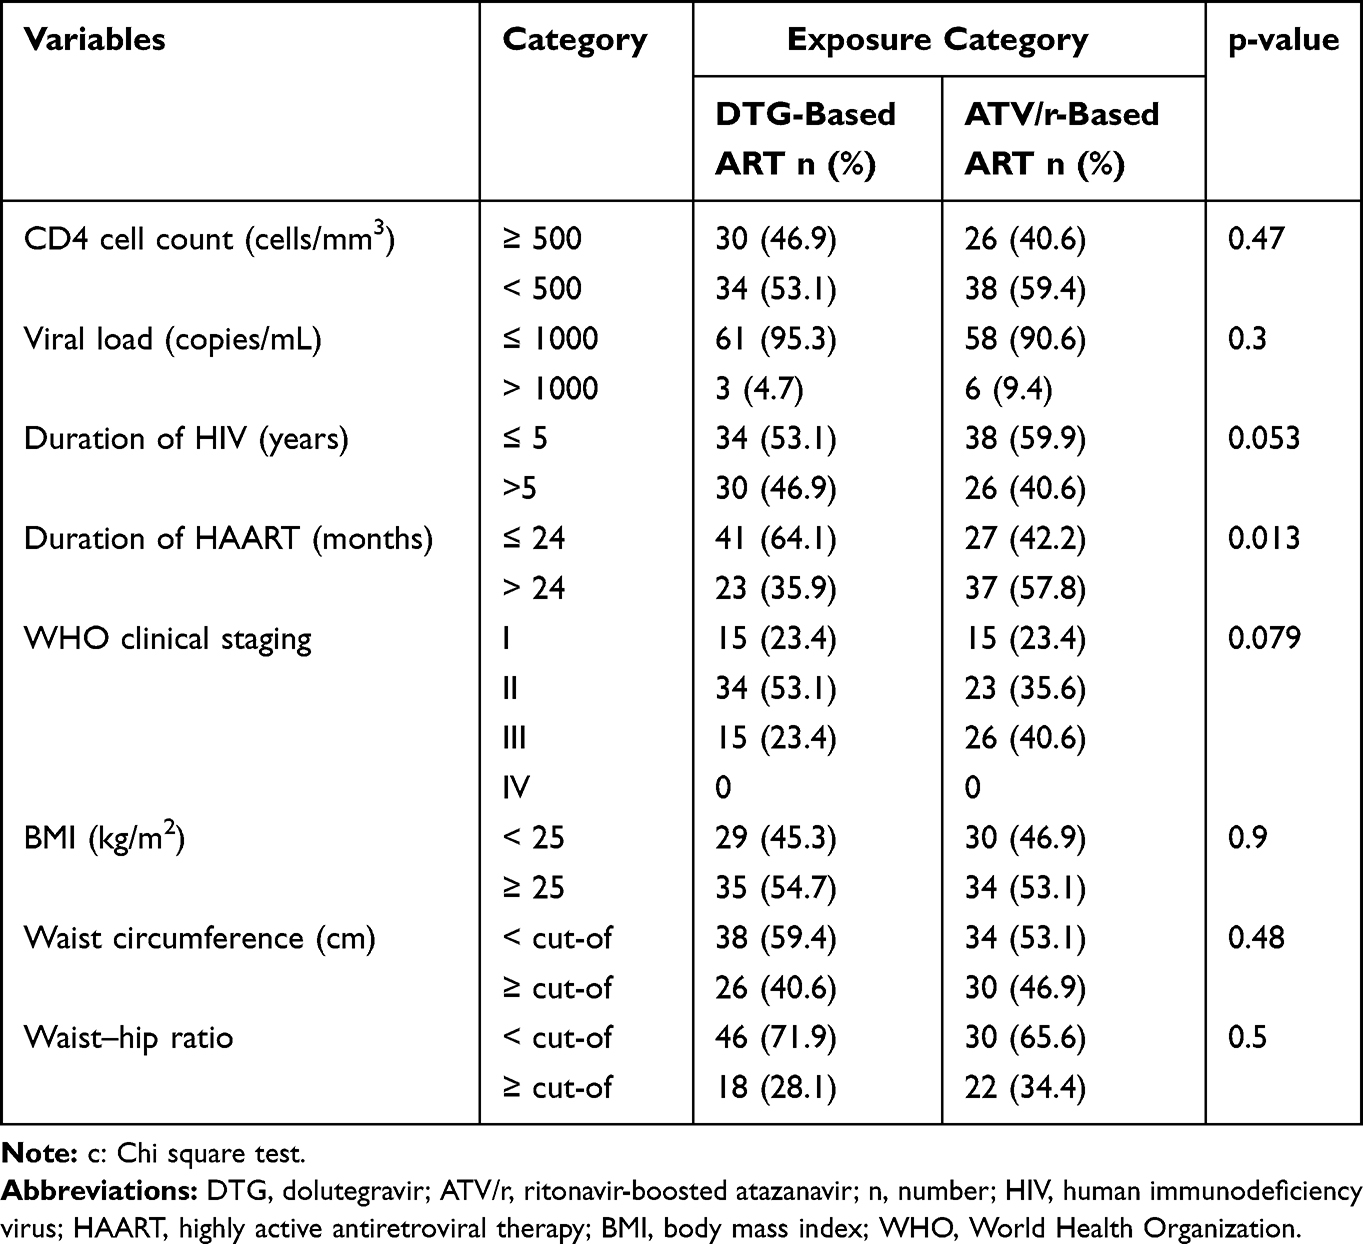 |
Table 2 Clinical and Anthropometric Characteristics of People Living with HIV Taking DTG and ATV/r-Based ART at JUMC, Southwest Ethiopia from November 4, 2021, to January 4, 2022 (n=128) |
Prevalence of Serum Lipid Profiles Among Study Participants
Among all persons involved in the study, 48.4% (31/64) of the DTG-treated patients and 67.2% (43/64) of the ATV/r-treated patients had at least one lipid abnormality (p = 0.03). The results of the current study also showed that the proportion of TG ≥ 150 mg/dl was 40.6% (26/64) among patients on DTG-based ART and 62.5% (40/64) among patients on ATV/r-based ART (p = 0.01) (Table 3).
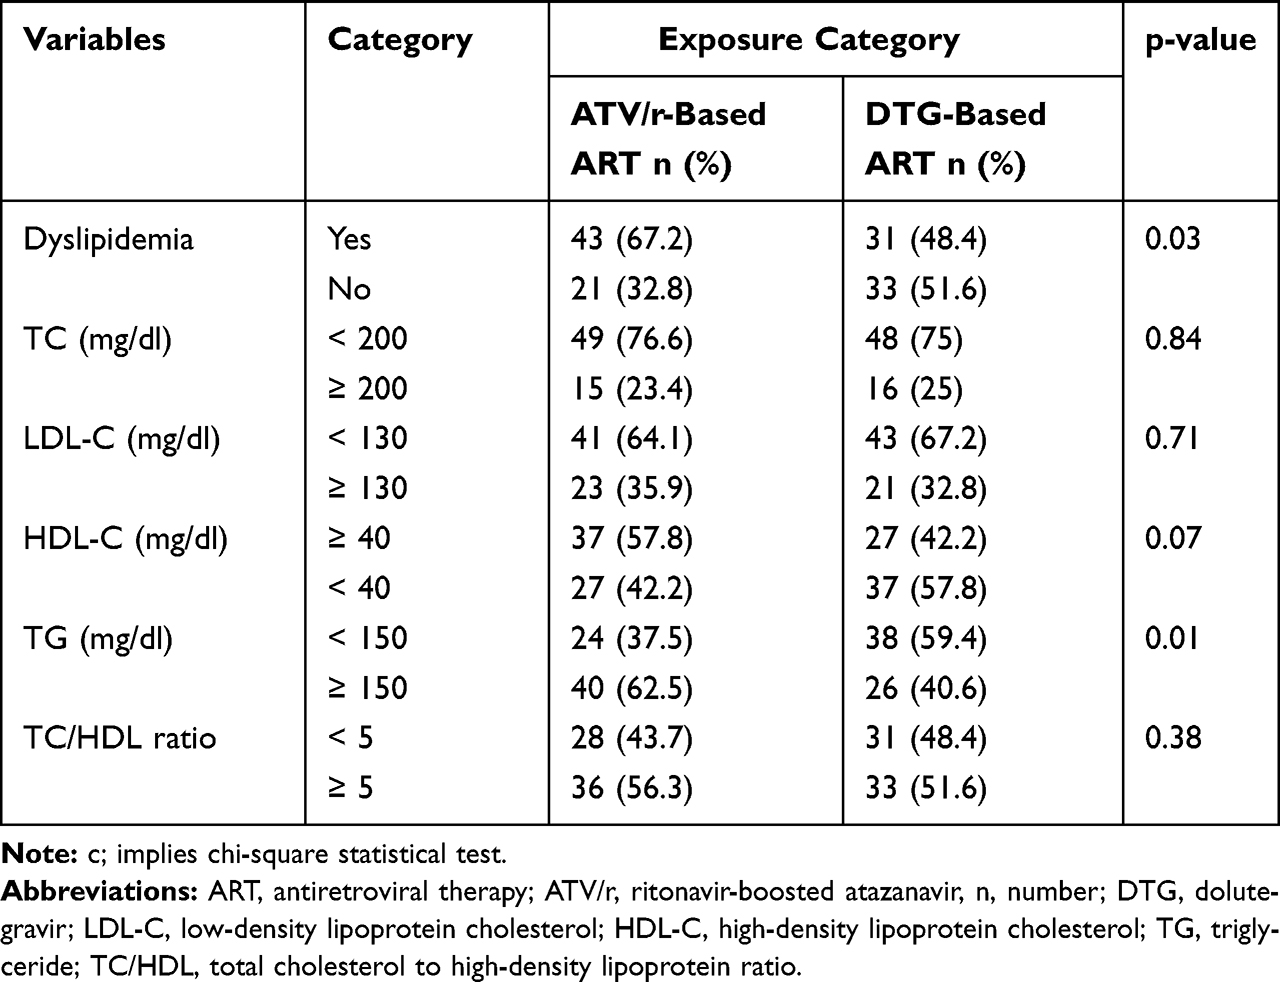 |
Table 3 Prevalence of Lipid Profiles Among People Living with HIV Taking DTG-Based and ATV/r-Based ART at JUMC, Southwest Ethiopia from November 4, 2021, to January 4, 2022 (n=128) |
Prevalence of Serum Blood Sugar Among Study Participants
Regarding the RBS level, a higher proportion of hyperglycemia was found in patients treated with DTG-based ART (35.9%, 23/64) than in those treated with ATV/r-based ART (10.9%, 7/64) (p = 0.001) (Figure 1).
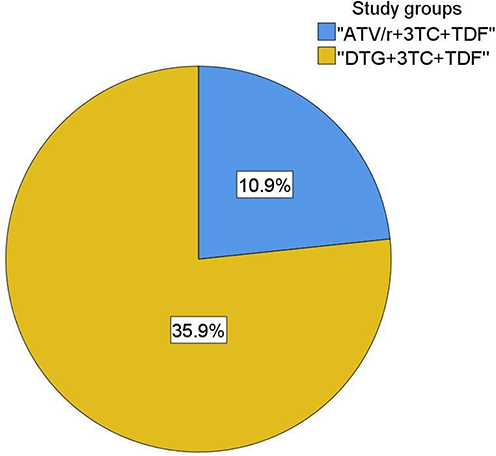 |
Figure 1 Prevalence of RBS among people living with HIV taking DTG and ATV/r based ART at JUMC, Southwest Ethiopia, 2021. Abbreviations: NB: c, implies chi-square statistical test; RBS, random blood sugar; ATV/r, ritonavir-boosted atazanavir; 3TC, lamivudine; TDF, tenofovir; DTG, dolutegravir. |
Prevalence of Serum hsCRP Levels Among Study Participants
Concerning the prevalence of hsCRP (Figure 2), the present study showed that the prevalence of hsCRP > 3 mg/L and hsCRP of 1–3 mg/L was lower in patients treated with DTG-based ART (12.5%, 8/64, and 37.5%, 24/64), respectively, than in those treated with ATV/r-based ART (17.2%, 11/64, and 51.6%, 33/64), respectively. However, the prevalence of hsCRP levels <1 mg/L was higher among patients treated with DTG (50%, 32/64) than among those treated with ATV/r (31.3%, 20/64) (p = 0.013).
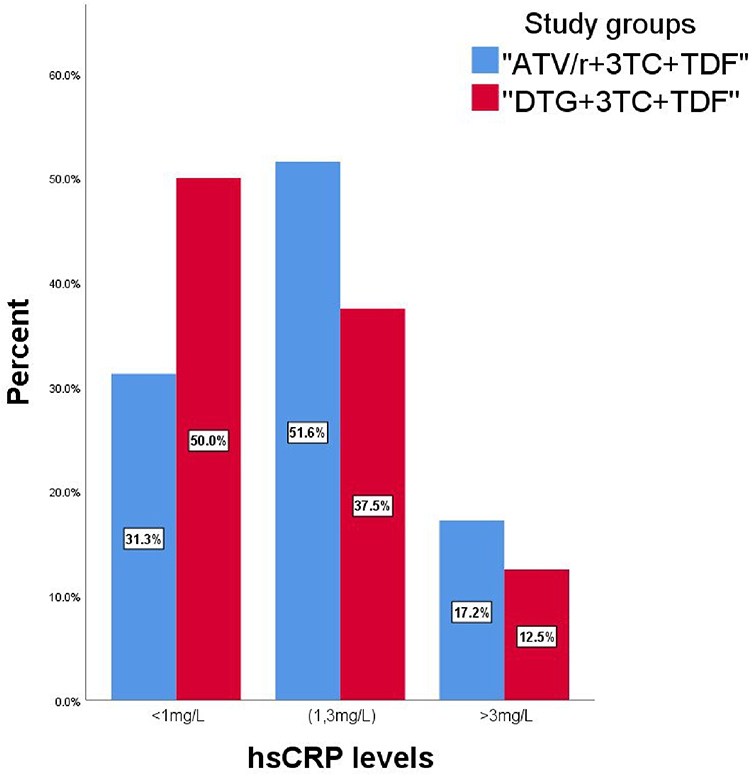 |
Figure 2 Prevalence of hsCRP among people living with HIV taking DTG and ATV/r-based ART at JUMC, Southwest Ethiopia, 2021. Abbreviations: NB: c, implies chi-square statistical test; hsCRP, highly sensitive c-reactive protein; ATV/r, ritonavir-boosted atazanavir; 3TC, lamivudine; TDF, tenofovir; DTG, dolutegravir. |
Mean and Median Values of Serum Lipid Profiles, RBS, and hsCRP Levels Among Study Participants
A higher mean HDL-C level (41.3±10.3 vs 32.7±11.3 mg/dl) was observed among patients taking DTG-based ART than among those receiving ATV/r-based ART (p = 0.01). A lower median level of TG was observed among patients on DTG-based regimens, 131.8 mg/dl, IQR (102–202), than those on ATV/r-based regimens of ART, 165.35 mg/dl, IQR (132–238) (p-value = 0.01). The results of the present study also revealed that the median level of RBS detected for DTG was 156 mg/dl, IQR (123–217), and for ATV/r was 138 mg/dl, IQR (123–156) (p = 0.04). The median level of hsCRP for DTG-based ART was 0.85 mg/L, IQR (0.5–1.5), and for ATV/r-based ART was 1.8 mg/L, IQR (0.9–3.6) (p-value = 0.01) (Table 4).
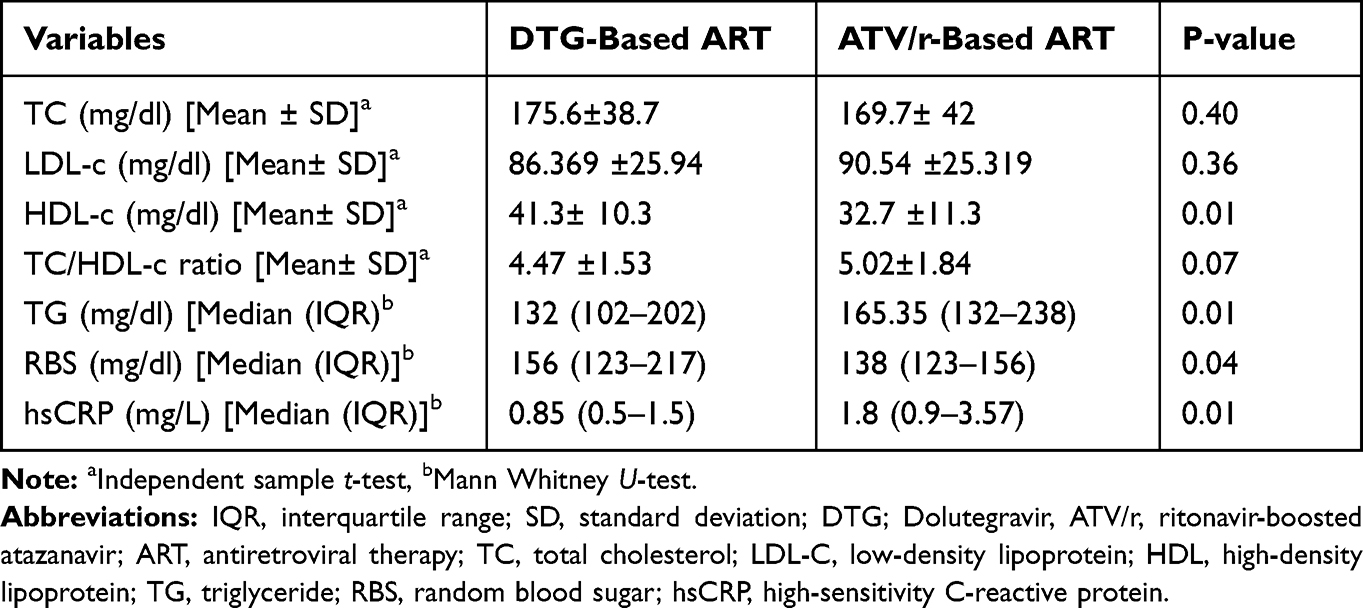 |
Table 4 Comparison of Lipid Profiles, RBS, and hsCRP Levels Among People Living with HIV Taking DTG and ATV/r-Based ART at JUMC, Southwest Ethiopia from November 4, 2021, to January 4, 2022 (n=128) |
Factors Associated with Dyslipidemia in PLWH on DTG and ATV/r-Based ART
Binary and multiple logistic regression analyses of the factors associated with dyslipidemia are presented in Table 5. All variables with p < 0.25 (age, gender, type of oil, regimen type, CD4 cell count, BMI, WC, WHR, and duration of taking HAART) were included in the multivariate analysis. After adjusting for all these variables in multiple logistic regressions, ATV/r-based ART (AOR = 3.4; 95% CI: 1.5, 7.8; p = 0.04) and age >40 years (AOR = 2.85; 95% CI: 1.3, 6.3; p = 0.03) were identified as significant predictors of dyslipidemia.
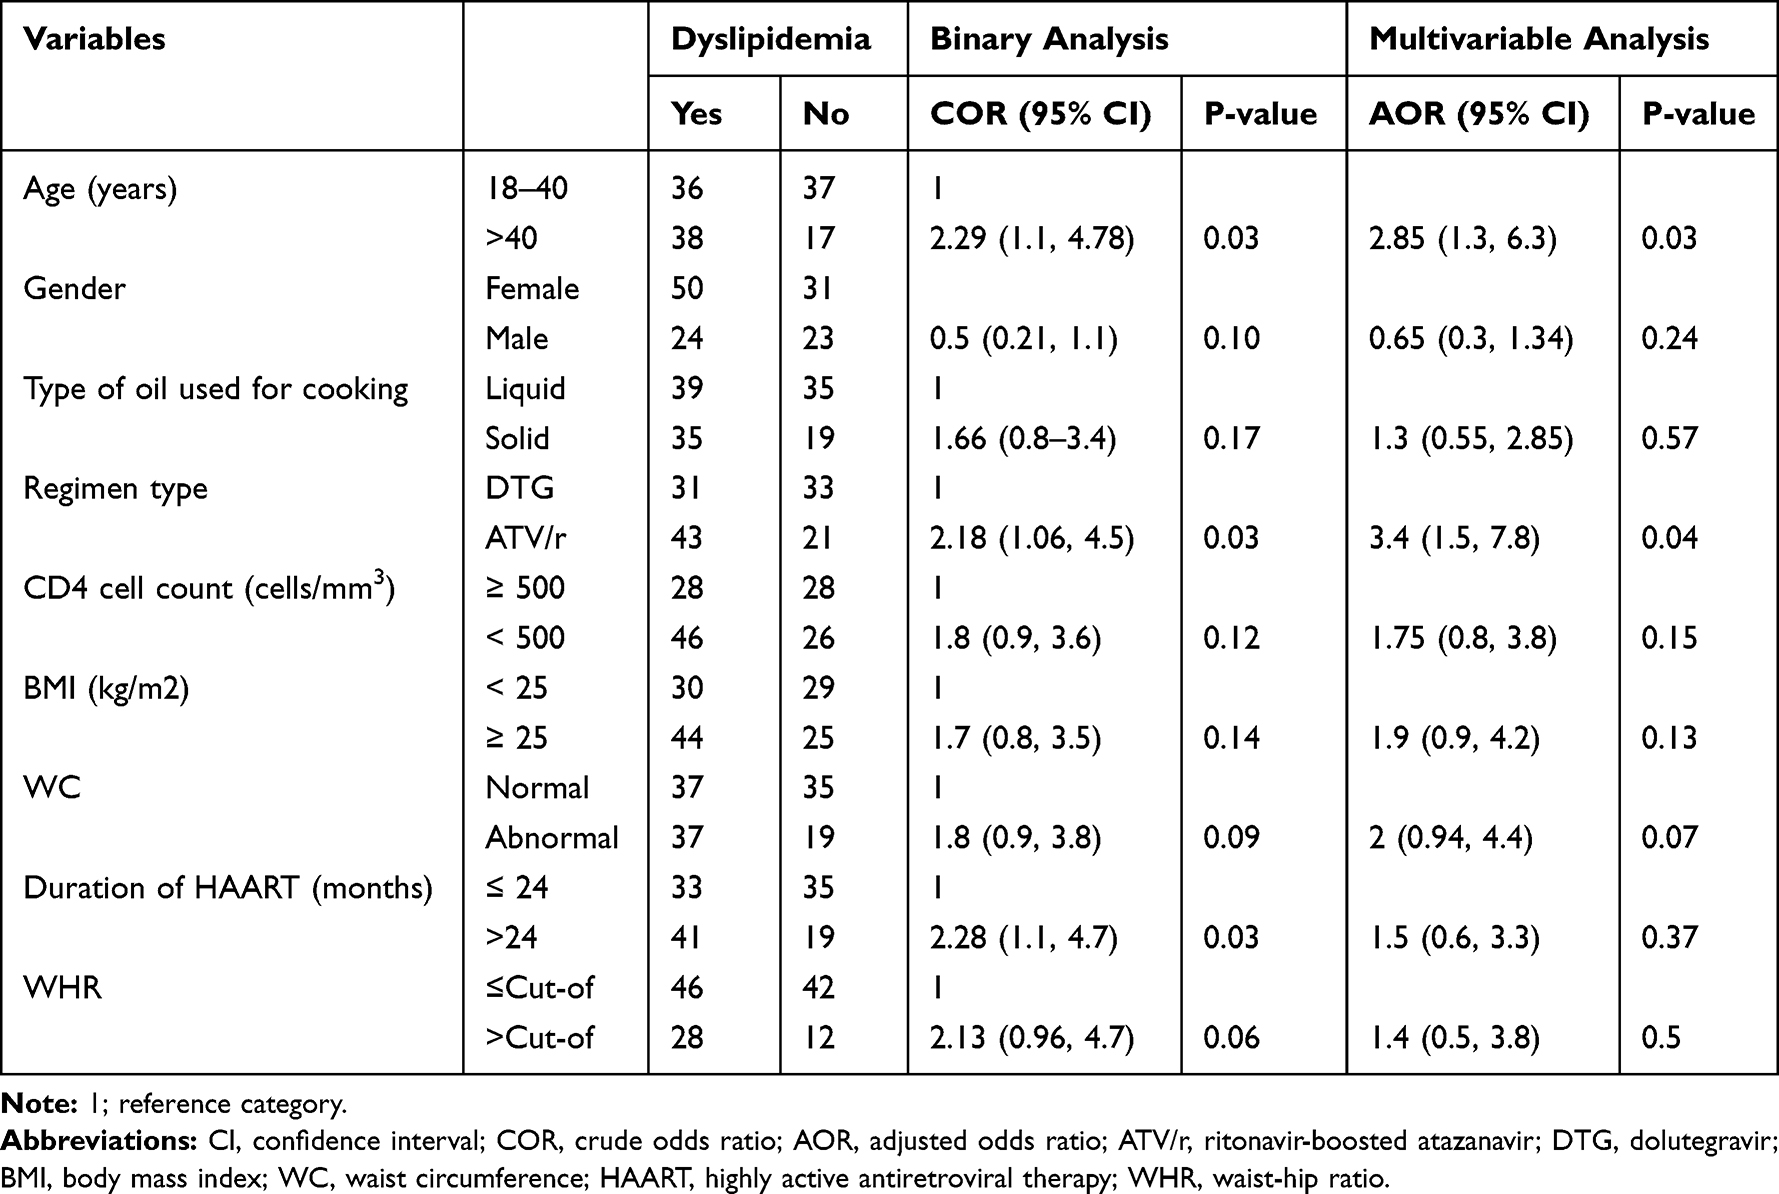 |
Table 5 Factors Associated with Dyslipidemia Among People Living with HIV Taking DTG-Based and ATV/r-Based ART at JUMC, Southwest Ethiopia from November 4, 2021, to January 4, 2022 (n=128) |
Factors Associated with Hyperglycemia in PLWH on DTG-Based and ATV/r-Based ART
Multivariable logistic regression was performed for all explanatory variables (age, gender, CD4 cell count, BMI, physical activity, type of regimen, and duration of HIV infection since the first diagnosis) with p < 0.25 in the binary logistic regression (Table 6). In multiple logistic regression analyses, BMI and DTG-based ART were identified as the determinants of hyperglycemia. It was observed that the odds of developing hyperglycemia was four times (AOR = 3.7; 95% CI: 1.27, 10.8; p-values = 0.02) greater in patients with a BMI ≥ 25 kg/m2 than in patients with BMI <25 kg/m2. Our study also indicated that patients receiving DTG-based ART were five times (AOR=4.61; 95% CI: 1.47, 14.4; p-value=0.01) more likely to have hyperglycemia than those receiving ATV/r-based ART.
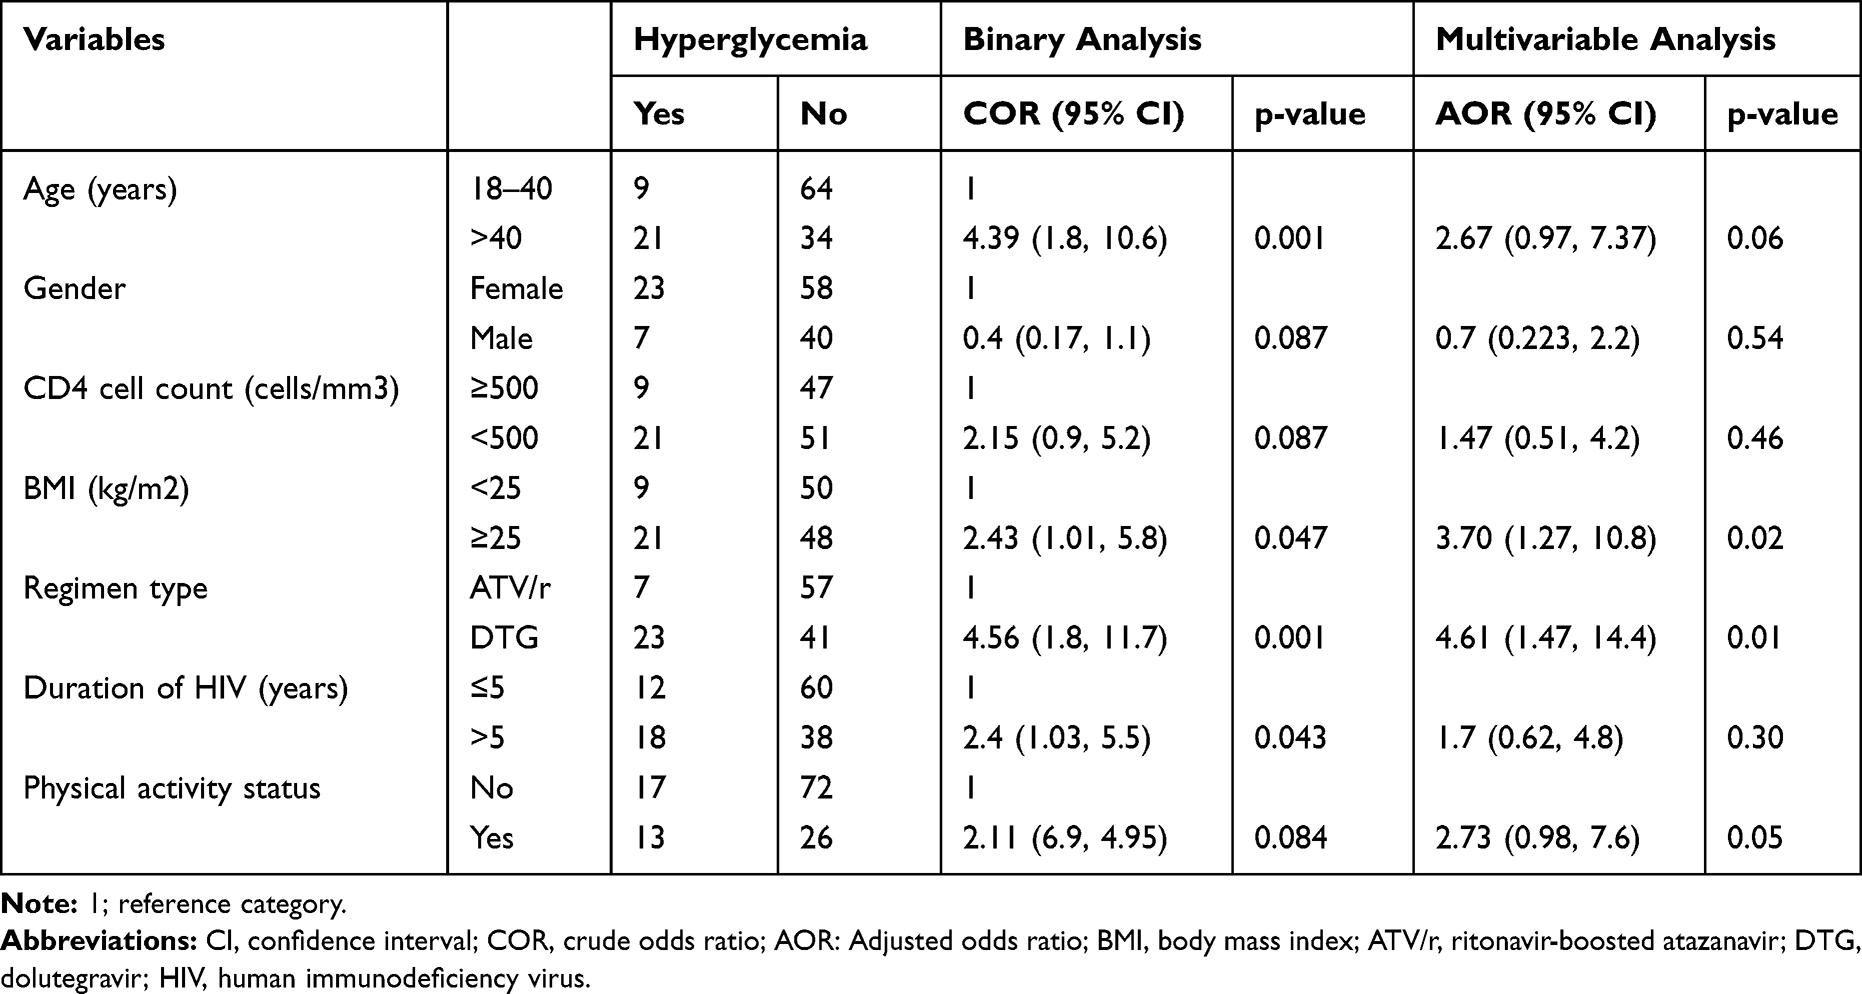 |
Table 6 Factors Associated with Hyperglycemia Among People Living with HIV Taking DTG and ATV/r-Based ART at JUMC, Jimma, Southwest Ethiopia from November 4, 2021, to January 4, 2022 (n=128) |
Factors Associated with Raise hsCRP Level in PLWH on DTG-Based and ATV/r-Based ART
Table 7 presents the factors associated with hsCRP levels compared to the reference category of <1 mg/L. Variables with p < 0.25 in the bivariate analysis were included in the multinomial logistic regression. In the adjusted analysis, the risk of patients with BMI ≥ 25 kg/m2 developing hsCRP levels of 1–3 mg/L rather than <1 mg/L was two times (ARR = 2.5; 95% CI: 1.1, 5.8; p-value = 0.03) higher than those with BMI < 25 kg/m2. The risk of patients on ATV/r-based ART having an hsCRP level of 1–3 mg/L rather than <1 mg/L was three times higher (ARR = 3.3; 95% CI: 1.3, 8.4; p = 0.013) than those on DTG-based ART. In patients with CD4 cell counts < 500 cells/mm3, the risk of a having hsCRP level >3 mg/L rather than <1 mg/L was five times more likely than for patients with CD4 cell counts ≥500 cells/mm3.
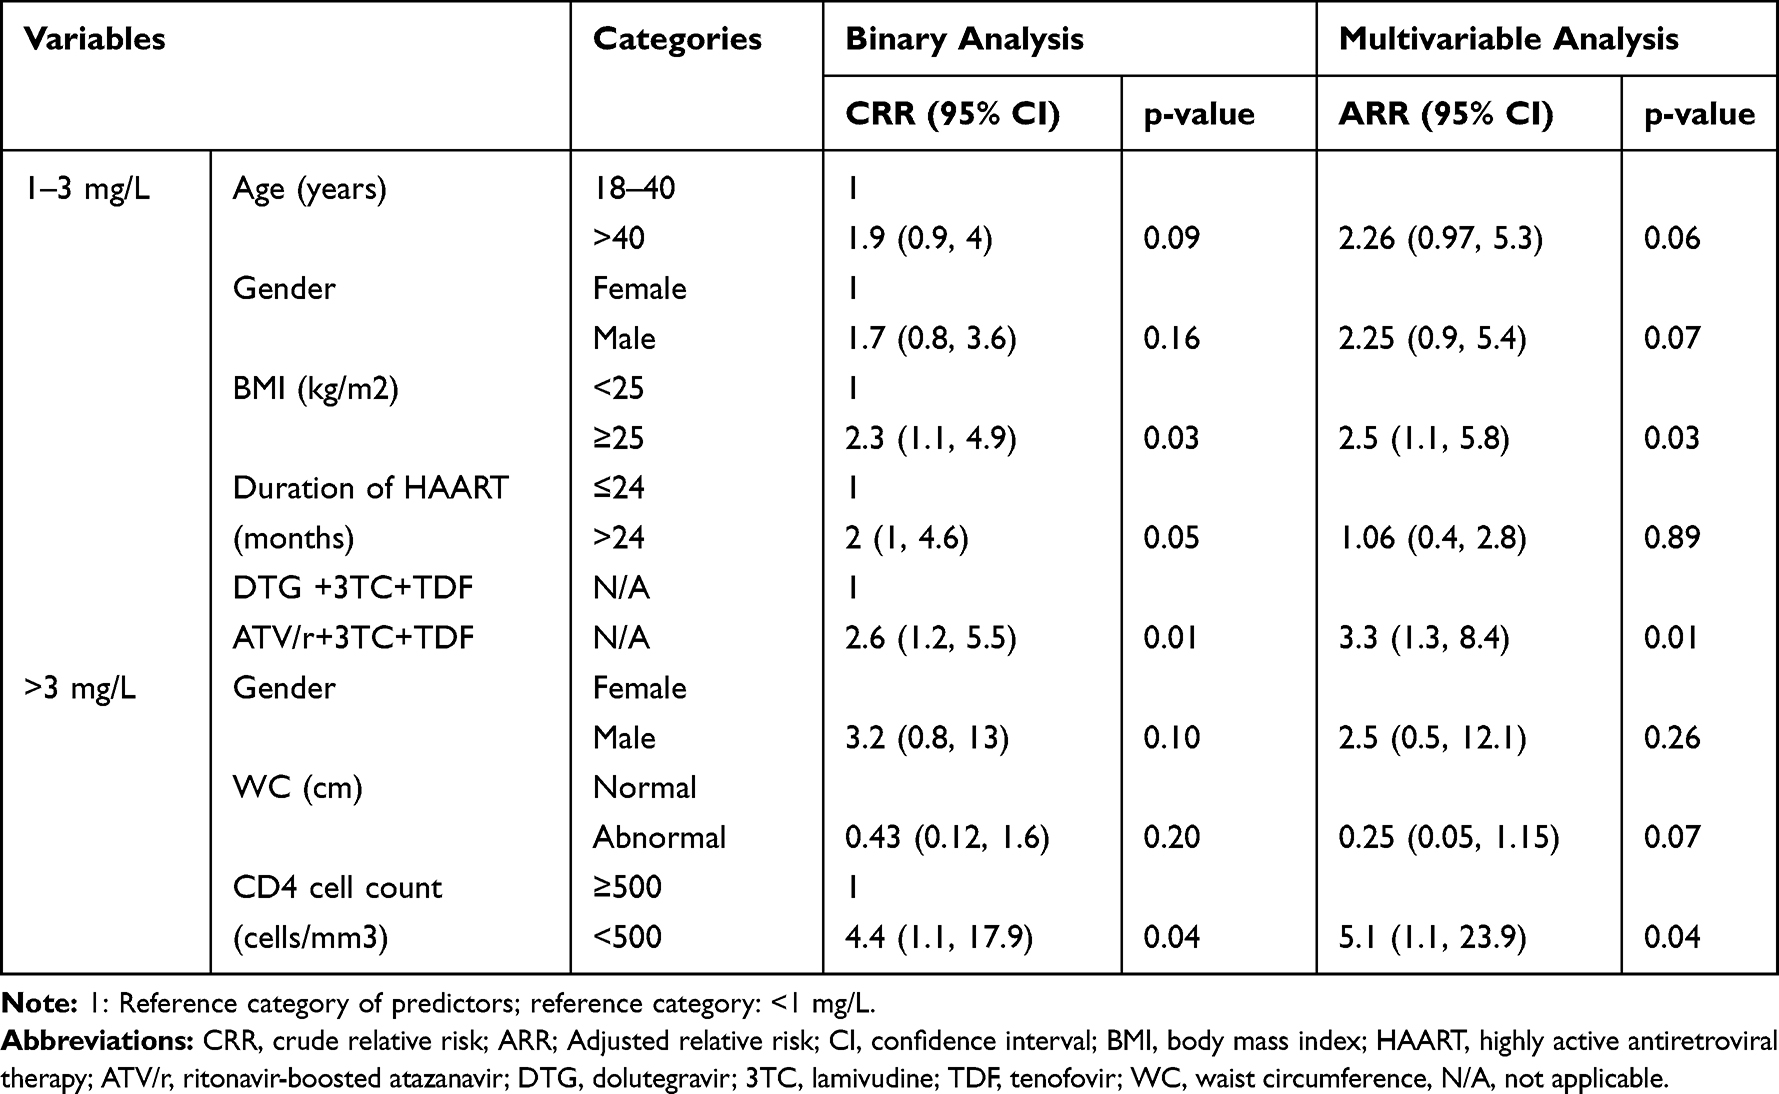 |
Table 7 Factors Associated with the Levels of hsCRP Among People Living with HIV Taking DTG-Based and ATV/r-Based ART at JUMC, Southwest Ethiopia from November 4, 2021, to January 4, 2022 (n=128) |
Discussion
This study was designed to assess serum lipid profiles, blood glucose, and hsCRP levels and their associated factors among people living with HIV receiving DTG-based ART and ATV/r-based ART. The result of this study showed that higher median values of TG were found among ATV/r- than DTG-treated patients, which was in line with an observational cohort study conducted in Italy,64 a trial study from six European65 countries, a cohort study from Taiwan,13 and a study from Ethiopia.66 Similarly, a study conducted in Italy11 and a cross-sectional study in Ethiopia12 also strengthened our findings. However, our result was in conflict with a study from Germany. A possible reason for this conflict of results might be differences in taking boosted atazanavir (in the German study, atazanavir was unboosted, whereas it was ritonavir-boosted in the current study) and duration of ART (most of them take for 6 months and for more than 24 months in Germany and the present study, respectively), in addition to study design and sociodemographic differences.67
In the present study, the higher proportion of TG ≥150 mg/dl found among ATV/r- (62.5%) than DTG-treated patients (40.5%) was comparable with the cross-sectional study conducted in Addis Ababa, Ethiopia.12 However, our finding was lower than that of a randomized study conducted in Spain68 that showed a higher prevalence of TG ≥150 mg/dl in patients treated with ATV/r-based ART (37.82%). Differences in state of taking sample (fasting in Spain versus random in our study), ART exposure of the participants (ART-naïve for Spain versus ART experienced in our study), sample size (large and small sample size in Spain and current study, respectively), study design, and sociodemographic characteristics of the participants might be contributing to these incomparable findings.
The current study also found a statistically significantly higher mean level of HDL-C in DTG compared to ATV-r treated patients, which was in agreement with studies carried out in Italy.69,70 Similarly, our study was supported by a trial conducted in Italy11 and a cross-sectional study from Ethiopia,12 which claimed that there was a significantly lower mean value of HDL-C in patients treated with the ATV/r-based ART regimen. On the contrary, our study result was in disagreement with the study result from Spain.14 Duration of ART (all of them were less than 6 months and 35.9% of them were taking DTG for greater than 6 months in Spain and our study, respectively), sample size (33 versus 128 in Spain and current study, respectively), along with lifestyle and study design variability, might be playing a role in this disagreement of findings.
Regarding blood glucose levels, a significantly higher median value of RBS was detected in DTG (156 mg/dl) than in ATV/r-treated patients (138 mg/dl). In the current study, a higher prevalence of RBS was also observed in patients treated with DTG (35.9%) than in those treated with ATV/r-based regimen (10.9%). These findings were in line with studies conducted in Uganda,24 Saudi Arabia,28 and USA,27 but not in line with study from Italy.30 This conflicting result might be more likely due to the difference in duration of ART and the proportion of male participants (85.6% in Italy versus 36.7% in our study). Furthermore, the current study was designed to assess the serum hsCRP levels in patients taking DTG-based and ATV/r-based antiretroviral therapy. We found a significant difference and a lower median hsCRP level among DTG patients as compared to patients treated with ATV/r-based ART. The proportion of patients with hsCRP levels >3 mg/L and 1–3 mg/L, respectively, were 12.5% and 37.5% for DTG- and 17.5% and 51.6% for ATV/r-based regimens. Studies carried out in France,36,71 Spain,14 and Italy30 all strengthen our findings by showing a significant decrease from the baseline mean of hsCRP level in HIV patients who switched from ATV/r-based to DTG-based regimens of ART. In contrast, our finding was incomparable to a study done in USA.72 This inconsistency might be because of differences in ART exposure of the participants involved (ART-naïve in their study, while ART experienced in our study), proportion of male participants (90% in USA study versus 34.4% in our study), duration of ART (2 years versus 57.8% of them had above 2 years), in addition to study design and genetic variations.
In the present study, patients with a BMI ≥25 kg/m2 were more likely to have hyperglycemia than patients with a BMI <25 kg/m2. This is consistent with a study from Kampala, Uganda73 and USA,74 and Ethiopia.75,76 Hyperglycemia in obese patients is due to increased release of free fatty acids to activate protein kinases and pro-inflammatory cytokines like interleukin-6 (IL-6) and tumor necrosis factor-α (TNF-α) released from adipose tissue impair insulin signalling and causes insulin resistance.77,78 In addition, our study demonstrated that patients on the DTG-based ART regimen were 4.6 times more likely to have hyperglycemia than patients on the ATV/r-based ART regimen. Studies done in India26 and Brazil79 reported results that are in line with our study findings. DTG-induced hyperglycemia is hypothesized to be due to the induction of low levels of intracellular Mg2+ by chelation. Mg2+ is important for insulin signalling and its chelation thus affects insulin signalling that end with insulin resistance.23
Likewise, the current study found that age >40 years was significantly associated with dyslipidemia. This is consistent with studies done in Tanzania29 and Ethiopia.78,79 A change in the hepatic sinusoidal endothelium with reduced endocytosis of lipoproteins and delayed clearance of chylomicrons as a result of decreased activity of the lipoprotein lipase enzyme might explain older age-induced dyslipidemia.80,81 According to our study, a significant association was also found between ATV/r-based regimens and dyslipidemia, which is in agreement with a study carried out in Tanzania29 and Brazil.5 A possible mechanism for ATV/r-induced dyslipidemia was through binding with and inhibition of cytoplasmic retinoic acid-binding protein-1 (CRABP-1) and sterol regulatory element-binding protein (SREBP).7,82 SREBP-1 and CRABP-1 are regulatory proteins involved in the stimulation of adipocyte differentiation, thus their inhibition leads to decreased triacylglycerol storage, increased free fatty acid release, and ended up with an increase in dyslipidemia.83
Moreover, this study attempted to identify the factors associated with increased hsCRP levels. Accordingly, there is 2.5 times more risk of having an increased hsCRP level by 1–3mg/L rather than <1 mg/L for patients with a BMI ≥25 kg/m2. This is in line with.84,85 In addition, ATV/r-based regimens were significant predictors of elevated hsCRP by 1–3 mg/L rather than hsCRP <1 mg/L, which is in line with.86 Furthermore, a CD4 cell count of <500 cells/mm3 was identified as a predictor of increased hsCRP levels by >3 mg/L rather than <1 mg/L. This finding is in agreement with a study conducted in India.87 The observed association of obesity with increased hsCRP was described partly by obesity-induced hyperplasia and hypertrophy of adipocytes with increased secretion of pro-inflammatory cytokines especially IL-6, which intern results in secretion of CRP by the liver.88 ATV/r inhibits USP18 (Ubiquitin-specific peptidase 18), which is the repressor of interferons involved in the activation of nuclear factor kappa B (NF-kB) (the main driver of IL-6 and other cytokine production flowed by raised level of CRP).36
Strength and Limitation of the Study
As a strength, to the best of our knowledge, this was the first study in Ethiopia that attempted to assess the effects of DTG and ATV/r-based regimen on serum lipid profiles, blood glucose, and high-sensitivity C-reactive protein levels among people living with HIV, hence ultimately adding to the limited data. Despite the aforementioned strength, this study has several weaknesses. This is a comparative cross-sectional study; thus, we cannot associate causal relationships between the factors and outcomes under study. In addition, the study sample size was small; thus, it is difficult to generalize the findings to larger populations. The laboratory determination of lipid profiles and blood glucose was done at random, which may affect our study result. Moreover, there was a baseline difference in HAART duration between the two groups, which may have affected the outcome variables. Moreover, HIV-positive ART-naïve controls were not included, which may remove the effect of ART taken before starting DTG and ATV/r-based regimens.
Conclusion and Recommendation
In general, our findings indicated that patients treated with ATV/r had atherogenic lipid profiles and higher hsCRP levels than those treated with DTG. However, hyperglycemia was observed in patients treated with DTG-based regimens. This study also demonstrated that dyslipidemia was predicted by older age and ATV/r-containing regimens, hyperglycemia was predicted by BMI ≥25 kg/m2 and DTG-containing regimens, and the risk of increased hsCRP levels of 1–3 mg/L was significantly predicted by ATV/r-based regimens and BMI ≥25 kg/m2, while increased hsCRP levels >3 mg/L were predicted by a CD4 cell count <500 cells/mm3. Therefore, measuring baseline lipid profiles and hsCRP levels for HIV patients on ATV/r-based regimens, particularly those with a higher BMI, older age, and lower CD4 cell count, should be part of routine care. In addition, routine monitoring of blood glucose in HIV patients on DTG-based regimens and those with a higher BMI should be an important element of care to prevent and predict the early risk of CVD. To achieve this, policymakers should take these factors into account when developing public health initiatives on ART side effects management and when strengthening ongoing non-communicable disease reduction programs. Awareness should also be created for patients at every visit to the ART clinic by health-care providers regarding the possible side effects of ART. We propose that researchers conduct a prospective cohort study with a larger sample size to draw an exact conclusion regarding the effects of DTG and ATV/r on serum lipid profiles, blood glucose, and hsCRP levels. Finally, we suggest performing a comparative analysis of DTG-containing and ATV/r-containing ART in ART-naïve, HIV-positive patients.
Abbreviations
ART, antiretroviral therapy; ASCVD, atherosclerotic cardiovascular disease; ATV/r, ritonavir-boosted atazanavir; AZT; Zidovudine, BMI, body mass index; CD4, cluster of differentiation 4; CVD, cardiovascular disease; DTG, dolutegravir; EFV, efavirenz; HDL-C, high-density lipoprotein cholesterol; hsCRP, high-sensitivity C-reactive protein; IL-6, interleukin-6; JUMC, Jimma University Medical Centre; LDL-C, low-density lipoprotein cholesterol; NF-kB; nuclear factor kappa B; RBS, random blood sugar; SPSS, statistical package for social sciences; TDF, tenofovir; TC, total cholesterol.
Data Sharing Statement
All the necessary materials can be found in the text. Due to the privacy policy, confidential data materials could be obtained from the corresponding author upon request.
Acknowledgments
The authors acknowledge the data collectors, Jimma University, Jimma University Medical Center, and Wolaita Sodo University for their unreserved contributions.
Author Contributions
All authors made a significant contribution to the work reported, whether that is in the conception, study design, execution, acquisition of data, analysis, and interpretation, or in all these areas; took part in drafting, revising, or critically reviewing the article; gave final approval of the version to be published; have agreed on the journal to which the article has been submitted; and agree to be accountable for all aspects of the work.
Disclosure
The authors declare that they have no competing interests in this work.
References
1. Barak T, Neo DT, Tapela N, et al. HIV-associated morbidity and mortality in a setting of high ART coverage: prospective surveillance results from a district hospital in Botswana. J Int AIDS Soc. 2019;22(12):1–8. doi:10.1002/jia2.25428
2. Bloom GS, Khazanie P, Morris A, et al. HIV and noncommunicable cardiovascular and pulmonary diseases in low- and middle-income countries in the ART era: what we know and best directions for future research. J Acquired Immune Deficiency Syndromes. 2014;67:S1. doi:10.1097/QAI.0000000000000266
3. Shah ASV, Stelzle D, Lee KK, et al. Europe PMC funders group global burden of atherosclerotic cardiovascular disease in people living with the human immunodeficiency virus: a systematic review and meta-analysis. Circulation. 2019;138(11):1100–1112. doi:10.1161/CIRCULATIONAHA.117.033369
4. Woldu M, Minzi O, Shibeshi W, Shewaamare A. Predicting the risk of atherosclerotic cardiovascular disease among adults living with HIV / AIDS in Addis Ababa, Ethiopia: a. PLoS One. 2021;16(11):1–19. doi:10.1371/journal.pone.0260109
5. Sérgio P, De Araújo R, Arraes R, et al. Antiretroviral treatment for HIV infection / AIDS and the risk of developing hyperglycemia and hyperlipidemia. Rev Inst Med trop S Paulo. 2007;49(2):73–78. doi:10.1590/S0036-46652007000200002
6. Womack J, Tien PC. Mechanisms of HIV-related dyslipidemia. Future Med. 2009;3:283–292.
7. Miserez AR, Muller PY, Spaniol V. Indinavir inhibits sterol-regulatory element-binding protein-1c-dependent lipoprotein lipase and fatty acid synthase gene activations. Aids. 2002;16(12):1587–1594. doi:10.1097/00002030-200208160-00003
8. Liang JS, Distler O, Cooper DA, et al. HIV protease inhibitors protect apolipoprotein B from degradation by the proteasome: a potential mechanism for protease inhibitor-induced hyperlipidemia. Nat Med. 2001;7(12):1327–1331. doi:10.1038/nm1201-1327
9. Rader DJ. Molecular regulation of HDL metabolism and function: implications for novel therapies. J Clin Invest. 2006;116(12):3090–3100. doi:10.1172/JCI30163
10. Oh J, Hegele RA. HIV-associated dyslipidaemia: pathogenesis and treatment. Lancet Infect Dis. 2013;7:1.
11. Gotti D, Cesana BM, Albini L, et al. Efavirenz Compared to Atazanavir / Ritonavir. HIV Clin Trials. 2015;13(5):245–255. doi:10.1310/hct1305-245
12. Ababa A, Menon M. Serum lipid profiles of patients taking efavirenz-based antiretroviral regimen compared to ritonavir-boosted atazanavir with an optimized background at zewditu memorial. Sci Med Res. 2021;13(2):217–227.
13. Chen G, Sun H, Chang S, Cheng A, Huang Y. Effectiveness of switching from protease inhibitors to dolutegravir in combination with nucleoside reverse transcriptase inhibitors as maintenance antiretroviral therapy among HIV-positive patients. Int J Antimicrob Agents. 2019;54(1):35–42. doi:10.1016/j.ijantimicag.2019.03.016
14. Blanco L, Marcos A, Tricas A, et al. Dolutegravir monotherapy in HIV-infected patients with sustained viral suppression. J Antimicrob Chemother. 2016;71(7):1975–1981. doi:10.1093/jac/dkw078
15. Id BMH, Musonda P, Mutale W, et al. Prevalence of low high-density lipoprotein among young adults receiving antiretroviral therapy in Zambia: an opportunity to consider non-communicable diseases in resource- limited settings. PLoS One. 2021;16(2):1–15.
16. Saadatmand S, Vos JR, Hooning MJ, et al. Aging and inflammation in patients with HIV infection M. Laryngoscope. 2014;2:2–31.
17. Lee JC. Altered glucose metabolism in HIV-infected patients treated with HAART. J Pharm Pract. 2013;17(1):80–86. doi:10.1177/0897190003261313
18. Hruz PW. HIV protease inhibitors and insulin resistance: lessons from in-vitro, rodent and healthy human volunteer models. Curr Opin HIV AIDS. 2008;3(6):660–665. doi:10.1097/COH.0b013e3283139134
19. Murata H, Hruz PW, Mueckler M. The mechanism of insulin resistance caused by HIV protease inhibitor therapy. J Biol Chem. 2000;275(27):20251–20254. doi:10.1074/jbc.C000228200
20. Caron M, Vigouroux C, Bastard JP, Capeau J. Antiretroviral-related adipocyte dysfunction and lipodystrophy in HIV-infected patients: alteration of the PPARγ-dependent pathways. PPAR Res. 2008;2009(507):20–26.
21. Hruz PW. Molecular mechanisms for insulin resistance in treated HIV-infection. Best Pract Res Clin Endocrinol Metab. 2011;25(3):459–468. doi:10.1016/j.beem.2010.10.017
22. Cunha J, Morganti L, Maselli F, et al. Impact of antiretroviral therapy on lipid metabolism of human immunodeficiency virus-infected patients: old and new drugs. World J Virol. 2015;4(2):56–77. doi:10.5501/wjv.v4.i2.56
23. Fong PS, Flynn DM, Evans CD, Korthuis PT. Integrase strand transfer inhibitor-associated diabetes mellitus: a case report. STD AIDS. 2016;28(6):1–3.
24. Lamorde M, Atwiine M, Owarwo NC, et al. patients with HIV. Lancet HIV. 2020;7(7):4–5. doi:10.1016/S2352-3018(20)30042-4
25. Hailu W, Tsebaot Tesfaye A. Hyperglycemia after dolutegravir-based antiretroviral therapy. Int Med Case. 2021;14(3):503–507.
26. Mahale PR, Patel BS, Kasmani N. Treatment outcomes of dolutegravir- versus efavirenz-based highly active antiretroviral therapy regimens among treatment-naive people living with HIV. Open acces. 2023;15:6.
27. Cahn P, Pozniak AL, Mingrone H, et al. Dolutegravir versus raltegravir in antiretroviral-experienced, integrase-inhibitor-naive adults with HIV: week 48 results from the randomised, double-blind, non-inferiority SAILING study. Lancet. 2013;9893(382):700–708. doi:10.1016/S0140-6736(13)61221-0
28. Bahamdain F. Effect of dolutegravir on plasma glucose among human immunodeficiency virus patients in a community health center setting. Cureus. 2022;2(10):8–13.
29. Gimeno-Gilles C, Lelièvre E, Viau L, et al. Magnitude of hyperlipidaemia and hyperglycemia in HIV infected patients receiving lopinavir/r and atazanavir/r based antiretroviral drugs in Dar es Salaam. Euphytica. 2016;18(2):280–296.
30. Calza L, Colangeli V, Borderi M, et al. Improvement in insulin sensitivity and serum leptin concentration after the switch from a ritonavir-boosted PI to raltegravir or dolutegravir in non-diabetic HIV-infected patients. Antimicrob Chemothe. 2019;74(3):731–738. doi:10.1093/jac/dky507
31. Wadgera NY, Yadhav ML, Nagaraja BS. C-reactive protein as a guide for the treatment response of opportunistic. Int J Pharm Med Bio Sc. 2012;1(2):159–165.
32. Wadgera NY, Yadhav ML, Nagaraja BS. ISSN C-reactive protein as an early marker of opportunistic infections in HIV. Int J Pharma Bio Sci Microbiol. 2012;3(4):1194–1203.
33. Grund B, Baker JV, Deeks SG, et al. Relevance of interleukin-6 and D-dimer for serious non-AIDS morbidity and death among HIV-positive adults on suppressive antiretroviral therapy. PLoS One. 2016;11(5):1–16. doi:10.1371/journal.pone.0155100
34. Gleason RL, Caulk AW, Seifu D, Parker I. Current efavirenz (EFV) or ritonavir-boosted lopinavir (LPV / r) use correlates with elevate markers of atherosclerosis in HIV-infected subjects in Addis Ababa, Ethiopia. PLoS One. 2015;10(4):1–18. doi:10.1371/journal.pone.0117125
35. González-Cordón A, Assoumou L, Moyle G, et al. Switching from boosted PIs to dolutegravir decreases soluble CD14 and adiponectin in high cardiovascular risk people living with HIV. J Antimicrob Chemother. 2021;76(9):2380–2393. doi:10.1093/jac/dkab158
36. Auclair M, Guénantin AC, Fellahi S, Garcia M, Capeau J. HIV antiretroviral drugs, dolutegravir, maraviroc and ritonavir-boosted atazanavir use different pathways to affect inflammation, senescence and insulin sensitivity in human coronary endothelial cells. PLoS One. 2020;15(1):1–23. doi:10.1371/journal.pone.0226924
37. Lombardi F, Belmonti S, Borghetti A, et al. Reduced soluble CD14 levels after switching from a dual regimen with lamivudine plus boosted protease inhibitors to lamivudine plus dolutegravir in virologically suppressed HIV- infected patients Reduced soluble CD14 levels after switching from a dual reg. HIV Res Clin Pract. 2019;20(3):92–98. doi:10.1080/25787489.2019.1653512
38. Llibre JM, Martı E, Gutierrez F, Podzamczer D, Antela A. Changes in cardiovascular biomarkers in HIV-infected patients switching from ritonavir-boosted protease inhibitors. patients switching from ritonavir-boosted protease. Academia. 2012;26(18):2315–2326.
39. Opoku S, Gan Y, Fu W, et al. Prevalence and risk factors for dyslipidemia among adults in rural and urban China: findings from the China National Stroke Screening and prevention project (CNSSPP). BMC Public Health. 2019;19(13):1–15. doi:10.1186/s12889-019-7827-5
40. Emelia J, Mozaffarian D, Benjamin EJ, et al. AHA statistical update executive summary: heart disease and stroke statistics — 2016 update A report from the American heart association. Circulation. 2016;133(4):38–360.
41. Ceccato MGB, Bonolo PF, Neto AIS, Araújo FS, Freitas MIF. Antiretroviral therapy-associated dyslipidemia in patients from a reference center in Brazil Antiretroviral therapy-associated dyslipidemia in patients from a reference center in Brazil. Med Biomed Res. 2011;44(11):1177–1183.
42. Shen Y, Wang Z, Liu L, Zhang R, Zheng Y, Lu H. Prevalence of hyperglycemia among adults with newly diagnosed HIV/AIDS in China. BMC Infect Dis. 2013;13:1. doi:10.1186/1471-2334-13-79
43. Gahlot A, Gahlot P, Acharya J, Cross Sectional A. Study on correlation of quantitative C - reactive protein With CD4 count in patients of HIV on art. Acad J Med. 2019;2(2):14–17. doi:10.21276/ajm.2019.2.2.5
44. Report F. Ethiopia population-based HIV impact assessment; 2020.
45. Health F democratic republic of EM of. Implementation manual for DTG rollout and ART optimization in Ethiopia; 2019.
46. Brief P. Treatment HI V. Update of first- and second-line antiretroviral regimens; 2019.
47. Shah BM, Schafer JJ, Desimone JA. Dolutegravir: a new integrase strand transfer inhibitor for the treatment of HIV. Pharmacotherapy. 2014;34(5):506–520. doi:10.1002/phar.1386
48. Zamora F, Ogbuagu O, Barakat L, Ogbuagu O. Dolutegravir / rilpivirine for the treatment of HIV-1 infection. HIV/AIDS-Research Pall Care. 2018;10(2):215–224. doi:10.2147/HIV.S157855
49. Liu E, Armstrong C, Spiegelman D, et al. First-line antiretroviral therapy and changes in lipid levels over 3 years among HIV-infected adults in Tanzania. HIV/AIDS Maj Article. 2013;56(12):1820–1828.
50. Piero MN. Diabetes mellitus – a devastating metabolic disorder. Asian J Biomed Pharm Sci. 2015;4(40):1–7. doi:10.15272/ajbps.v4i40.645
51. Cecilie M, Roland P, Lekva T, Godang K, Bollerslev J, Henriksen T. Changes in maternal blood glucose and lipid concentrations during pregnancy differ by maternal body mass index and are related to birth weight: a prospective, longitudinal study of healthy pregnancies. PLoS One. 2020;15(6):1–12. doi:10.1371/journal.pone.0232749
52. Moura TCF, Amoras ESG, Queiroz MAF, et al. Association of serum levels of c-reactive protein with CRP-717 T/c polymorphism and viremia in HCV and HBV carriers. Rev Soc Bras Med Trop. 2019;52(5):1–6. doi:10.1590/0037-8682-0455-2018
53. Hart PC, Rajab IM, Alebraheem M, Potempa LA. C-reactive protein and cancer — diagnostic and therapeutic insights. Front Immunol. 2020;11:1–17. doi:10.3389/fimmu.2020.595835
54. Lalramenga PC, Gupta S, Naveen P. Section: medicine study of C-reactive protein significance in chronic kidney disease section: medicine. Int J Contemp Med Res. 2019;6(6):10–13.
55. Brown J, Clark K, Smith C, et al. Variation in C - reactive protein response according to host and mycobacterial characteristics in active tuberculosis. BMC Infect Dis. 2016;265(16):1–8. doi:10.1186/s12879-016-1612-1
56. Consultation WHOE. Waist circumference and waist-hip ratio report of a WHO expert consultation; 2008.
57. Diane M, Becker D. Guide identification, evaluation, and treatment of overweight and obesity in adults. The Johns Hopkins University Claude Bouchard PDLUR; 2000.
58. Centers AL. Manual 8 Laboratory methods visit 5 table of contents; 2012:6. Available from: http://drupal.cscc.unc.edu/aric/1.
59. Iii ATP, Quick GA, Reference D. ATP III guidelines at-A-glance quick desk reference. Natl Cholest Educ Progr ATP. 2001;2001:1–33.
60. American Diabetes Association. Standard medical care in diabetes 2018. J Clin Appl Res Educ. 2018;41:S1.
61. Myers GL, Rifai N, Tracy RP, et al. CDC / AHA workshop on markers of inflammation and application to clinical and public health practice report from the laboratory science discussion group. Circulation. 2004;110(25):545–549. doi:10.1161/01.CIR.0000148980.87579.5E
62. Moncivaiz A, Alexander D. CD4 vs. Viral Load: what’s in a Number? 2019:1–15. Available from: https://www.healthline.com/health/hiv-aids/cd4-viral-count#cd-count.
63. Doherty M. WHO guidelines on the use of CD4, Viral Load and EID tests for initiation and monitoring of ART The 2013 Consolidated ARV Guidelines; 2014. Available from: https://www.healthline.com/health/hiv-aids/cd4-viral-count#cd-count.
64. Squillace N, Taramasso L, Menzaghi B. Lipid pro fi le improvement in virologically suppressed HIV-1-infected patients switched to dolutegravir / Abacavir / lamivudine: data from the SCOLTA project. Infect Drug Resist. 2019;12(4):1385–1391. doi:10.2147/IDR.S203813
65. Gatell JM, Assoumou L, Moyle G, et al. Immediate versus deferred switching from a boosted protease inhibitor – based regimen to a dolutegravir-based regimen in virologically suppressed patients with high cardiovascular risk or age ≥ 50 years: final 96-week results of the NEAT022 study. Clin Infect Dis. 2019;68(4):597–606. doi:10.1093/cid/ciy505
66. Belete AM, Seifu D, Menon M, et al. serum lipid profiles of patients taking efavirenz- based antiretroviral regimen compared to ritonavir-boosted atazanavir with an optimized serum lipid profiles of patients taking efavirenz-based antiretroviral regimen compared to ritonavir-boosted atazanavir. HIV/AIDS. Res Palliat Care. 2021;13(3):217–227.
67. Mo U, Lubach-ruitman M, Castro-frenzel B, Christensen S, Behrens GMN, Schmidt RE. Switching to atazanavir improves metabolic disorders in antiretroviral-experienced patients with severe hyperlipidemia. Clin Sci. 2005;39(2):174–180.
68. Podzamczer D, Clotet B, Taylor S, et al. Lipid profiles for nevirapine vs. atazanavir / ritonavir, both combined with tenofovir disoproxil fumarate and emtricitabine over 48 weeks, in treatment-naı HIV-1-infected patients (the ARTEN study). HIV Med. 2011;12(3):374–382. doi:10.1111/j.1468-1293.2011.00917.x
69. Taramasso L, Tatarelli P, Ricci E, et al. Improvement of lipid profile after switching from efavirenz or ritonavir-boosted protease inhibitors to rilpivirine or once-daily integrase inhibitors: results from a large observational cohort study (SCOLTA). BMC Infect Dis. 2018;18(1):1–8. doi:10.1186/s12879-018-3268-5
70. Giacomelli A, Conti F, Pezzati L, et al. Impact of switching to TAF / FTC / RPV, TAF / FTC / EVG / cobi and ABC / 3TC / DTG on cardiovascular risk and lipid profile in people living with HIV: a retrospective cohort study. BMC Infect Dis. 2021;21(6):1–9. doi:10.1186/s12879-021-06304-3
71. Afonso P, Auclair M, Caron-debarle M, Capeau J. Original article Impact of CCR5, integrase and protease inhibitors on human endothelial cell function, stress, inflammation and senescence. Int Med Press. 2017;22(8):645–657.
72. Kelesidis T, Tran TTT, Stein JH, et al. Changes in Inflammation and immune activation with atazanavir-, raltegravir-, darunavir-based initial antiviral therapy: ACTG 5260s. Clin Infect Dis. 2015;61(4):651–660. doi:10.1093/cid/civ327
73. Namara D, Schwartz JI, Tusubira AK, et al. The risk of hyperglycemia associated with use of dolutegravir among adults living with HIV in Kampala, Uganda: a case-control study. Int J STD AIDS. 2022;33(14):1158–1164. doi:10.1177/09564624221129410
74. Duga AL, Magongo S, Nhlabatsi S, Ladwar DO, Härmark L, Rolfes L. An evaluation of postmarketing reports of hyperglycaemia associated with dolutegravir for treatment of HIV in Eswatini. AIDS Res Ther. 2022;19(54):1–5. doi:10.1186/s12981-022-00481-0
75. Jemal M, Molla TS, Tiruneh G, Abebe EC, Dejenie TA. Annals of medicine blood glucose level and serum lipid profiles among people living with HIV on dolutegravir-based versus efavirenz-based cART; a comparative cross- sectional study. Ann Med. 2023;55(2). doi:10.1080/07853890.2023.2295435
76. Care P. diabetes mellitus and associated factors among adult hiv patients on highly active anti-retroviral treatment diabetes mellitus and associated factors among adult hiv patients on highly active anti-retroviral treatment. Taylor Fr. 2020;12(2):657–665.
77. Ferna M, Ricart W. Inflammatory Syndrome. Endocr Rev. 2003;24(3):278–301. doi:10.1210/er.2002-0010
78. Shulman GI, Shulman GI. Cellular mechanisms of insulin resistance Find the latest version: on diabetes: insulin resistance Cellular mechanisms of insulin resistance. Clin Investig. 2020;106(2):171–176. doi:10.1172/JCI10583
79. Cesar JJ, Silveira MR, Cristina A, Penido HPDA, Fernandes ACDS, Ceccato MDGB. Glucose, urea, and creatinine laboratory tests in people starting antiretroviral therapy with dolutegravir or efavirenz: a cohort study in Belo Horizonte, Brazil Exames laboratoriais de glicose, ureia e creatinina em pessoas iniciando a terapia antir. Res Soc Dev. 2022;11(5):1–12. doi:10.33448/rsd-v11i5.28541
80. Issa JS, Diament J, Forti N. Postprandial Lipemia: influence of Aging. Arq Bras Cardiol. 2005;85(1):1–4.
81. Le Couteur DG, Fraser R, Cogger VC, Mclean AJ. Hepatic pseudocapillarisation and atherosclerosis in ageing. Lancet. 2002;359(9317):1612–1615. doi:10.1016/S0140-6736(02)08524-0
82. Calza L, Manfredi R, Chiodo F. Hyperlipidaemia in patients with HIV-1 infection receiving highly active antiretroviral therapy: epidemiology, pathogenesis, clinical course and management. Int J Antimicrob Agents. 2003;22(5):89–99. doi:10.1016/S0924-8579(03)00115-8
83. Alipour F, Hassanabadi A. Effects of sterol regulatory element-binding protein (SREBP) in chickens. Lipids Health Dis. 2012;11(2003):1–7. doi:10.1186/1476-511X-11-20
84. Persons H, Koethe JR, Bian A, et al. Serum leptin level mediates the association of body composition and serum C-reactive protein. AIDS Res Hum Retroviruses. 2012;28(6):552–557. doi:10.1089/aid.2011.0232
85. Mave V, Erlandson KM, Gupte N, et al. Inflammation and change in body weight with antiretroviral therapy initiation in a multinational cohort of HIV-infected adults. J Infect Dis. 2016;214(65):65–72. doi:10.1093/infdis/jiw096
86. Arenas-pinto A, Milinkovic A, Peppa D, Mckendry A, Maini M, Gilson R. Systemic inflammation and residual viraemia in HIV-positive adults on protease inhibitor monotherapy: a cross-sectional study. BMC Infect Dis. 2015;138(15):1–5.
87. Pate GP, Khunte P, Khunte S, Rangari P. Lipoproteins and C- reactive protein abnormalities in HIV positive patients and their correlation with CD4 cell counts original research. Adv Med Dent Sci Res. 2020;8(1):45–51.
88. Ellulu MS, Patimah I, Khaza H, Rahmat A, Abed Y. State of the art paper Obesity and inflammation: the linking mechanism and the complications. Arch Med Sci. 2017;13(4):851–863. doi:10.5114/aoms.2016.58928
 © 2024 The Author(s). This work is published and licensed by Dove Medical Press Limited. The full terms of this license are available at https://www.dovepress.com/terms.php and incorporate the Creative Commons Attribution - Non Commercial (unported, v3.0) License.
By accessing the work you hereby accept the Terms. Non-commercial uses of the work are permitted without any further permission from Dove Medical Press Limited, provided the work is properly attributed. For permission for commercial use of this work, please see paragraphs 4.2 and 5 of our Terms.
© 2024 The Author(s). This work is published and licensed by Dove Medical Press Limited. The full terms of this license are available at https://www.dovepress.com/terms.php and incorporate the Creative Commons Attribution - Non Commercial (unported, v3.0) License.
By accessing the work you hereby accept the Terms. Non-commercial uses of the work are permitted without any further permission from Dove Medical Press Limited, provided the work is properly attributed. For permission for commercial use of this work, please see paragraphs 4.2 and 5 of our Terms.