")
Back to Journals » Diabetes, Metabolic Syndrome and Obesity » Volume 17
Relationship Between Asymptomatic Hyperuricemia and the Hypertriglyceridemic-Waist Phenotype in Korean Adults: A Cross-Sectional Study
Authors Oh JE , Yu SR, Yoo JY , Shin KA
Received 10 October 2023
Accepted for publication 1 April 2024
Published 16 April 2024 Volume 2024:17 Pages 1727—1738
DOI https://doi.org/10.2147/DMSO.S444084
Checked for plagiarism Yes
Review by Single anonymous peer review
Peer reviewer comments 3
Editor who approved publication: Prof. Dr. Juei-Tang Cheng
Ji-Eun Oh,1 Sung Ryul Yu,2 Jung-Yoon Yoo,3,* Kyung-A Shin4,*
1Department of Biomedical Laboratory Science, Far East University, Eumseong, Republic of Korea; 2Department of Clinical Laboratory Science, Semyung University, Jecheon, Republic of Korea; 3Department of Biomedical Laboratory Science, Yonsei University MIRAE Campus, Wonju-si, Republic of Korea; 4Department of Clinical Laboratory Science, Shinsung University, Dangjin, Republic of Korea
*These authors contributed equally to this work
Correspondence: Kyung-A Shin, Department of Clinical Laboratory Science, Shinsung University, Daehak-ro 1, Jeongmi-myeon, Dangjin, Chungnam, 31801, Republic of Korea, Tel +82-41-350-1408, Fax +82-41-350-1045, Email [email protected] Jung-Yoon Yoo, Department of Biomedical Laboratory Science, Yonsei University MIRAE Campus, 1 Yonseidae-gil, Wonju-si, Gangwon-do, 26493, Republic of Korea, Tel +82-33-760-2861, Fax +82-33-760-2561, Email [email protected]
Purpose: Visceral fat accumulation can negatively affect uric acid metabolism in healthy adults. The hypertriglyceridemic-waist (HTGW) phenotype is a predictor of diabetes and cardiometabolic risk. This study aimed to investigate the association between the HTGW phenotype and asymptomatic hyperuricemia in Korean adults.
Patients and Methods: The study included 23,240 adults, aged 20– 80 years who underwent comprehensive health examinations at a general hospital in Gyeonggi Province, Korea, from January 2020 to December 2022. The HTGW phenotype was defined as the simultaneous presence of elevated serum triglyceride (TG) levels and increased waist circumference (WC). The diagnostic capability of the HTGW phenotype for hyperuricemia and its association with the condition were assessed using the receiver operating characteristic (ROC) curve and logistic regression analysis.
Results: The prevalence of hyperuricemia in the HTGW phenotype was 3.44 times higher than that in the normal TG normal waist (NTNW) phenotype. Compared with those in the NTNW group, the hazard ratios for developing hyperuricemia in the HTGW group were 2.887 (2.566– 3.249, P < 0.001) for men and 7.341 (5.139– 10.487, P < 0.001) for women, and these values remained significant after adjusting for potential confounders. The stratified analysis revealed that the HTGW phenotype, coupled with diabetes, had the highest probability of developing asymptomatic hyperuricemia (2.55 times). ROC curve analysis revealed that the area under the curve values of the WC*TG index for hyperuricemia diagnosis were 0.702, 0.627, and 0.685 for all participants, men, and women, respectively.
Conclusion: Among Korean adults, the HTGW phenotype was closely related to hyperuricemia in both men and women and showed a particularly strong association in patients with diabetes. It may be used in combination with an indicator that can complement its accuracy for identifying individuals at high risk of hyperuricemia.
Keywords: triglyceride, abdominal obesity, uric acid, metabolic syndrome
Introduction
Serum uric acid is produced in humans through oxidation of hypoxanthine and xanthine by xanthine oxidase and xanthine dehydrogenase, and it is the final metabolite of purine bases (adenine and guanine). Hyperuricemia is a metabolic disease caused by excessive production of uric acid or decreased excretion through the kidneys, and it is defined as a condition in which the uric acid level in the blood exceeds the reference range.1 Traditionally, hyperuricemia is a known cause of gout and is a risk factor for obesity, diabetes, stroke, chronic kidney disease, and cardiovascular disease.2–5 Purines in foods affect the blood uric acid levels, and purine-restricted diets are known to reduce these levels. Large-scale epidemiological studies have also revealed a correlation between consumption of purine-rich foods and the risk of hyperuricemia and gout development.6 Prevalence of hyperuricemia is rapidly increasing worldwide due to lifestyle changes; thus, hyperuricemia is emerging as a public health concern.7 In Korea, the prevalence of hyperuricemia in adults aged 19 years or older was reported to be 11.4% based on data from the 2016 Korea National Health and Nutrition Examination Survey.8
Visceral fat accumulation is reported to have a negative impact on uric acid metabolism in clinically healthy adults.9 As visceral fat increases, the levels of inflammatory substances increase; this negatively affects blood vessels and insulin activity. Furthermore, elevated blood uric acid levels are associated with inflammatory markers, such as interleukin 6, C-reactive protein, and tumor necrosis factor-α.10 Therefore, visceral fat accumulation is related to hyperuricemia and adiponectin, and hyperuricemia is reported to be one of the factors associated with obesity.11 As a potentially related mechanism, insulin resistance caused by visceral obesity increases the risk of hyperuricemia by reducing renal uric acid excretion.12 As a measure of abdominal obesity, waist circumference (WC) is a known predictor of cardiovascular disease, but alone, it is limited when distinguishing between visceral fat and abdominal subcutaneous fat.13,14 The hypertriglyceridemic-waist (HTGW) phenotype, first proposed by Lemieux et al in 2000, is defined as the simultaneous presence of elevated serum triglyceride (TG) levels and increased WC.15 The HTGW phenotype has been proposed as a simple but sensitive indicator for predicting pre-diabetes, diabetes, atherosclerosis, and cardiovascular metabolic risk.15,16 In addition, the HTGW phenotype was reported to be a reliable indicator for predicting abdominal visceral fat accumulation in Chinese adults, with a sensitivity of 81.08% and a specificity of 90.91%.17 In a 4-year follow-up of 5562 people aged 45 years or older without hyperuricemia, the HTGW phenotype was reportedly associated with a risk of hyperuricemia, especially in women.18 Moreover, in a rural population in China, individuals with HTGW were 4.54 times more likely to develop hyperuricemia than those with normal TG normal waist (NTNW) levels.19 Another study targeting patients with rheumatoid arthritis revealed a close relationship between hyperuricemia and the HTGW phenotype.20 However, these previous studies targeted people of specific ages and diseases, and some studies classified phenotypes into three groups for comparison. Thus, limitations remain in reaching a final conclusion regarding the relationship between the HTGW phenotype and hyperuricemia.
Therefore, this study investigated the association between the HTGW phenotype and asymptomatic hyperuricemia based on four phenotypes in Korean adults aged 20–80 years.
Additionally, the diagnostic capability for asymptomatic hyperuricemia was compared between individual measures of triglyceride and waist circumference and the combined indicator of TG-WC.
Materials and Methods
Study Population
This was a cross-sectional study targeting adults aged 20–80 years who underwent comprehensive health examinations from January 2020 to December 2022 at the health examination center of a general hospital in the Gyeonggi area. The total number of study participants was 23,240 comprising 14,229 men and 9011 women. Missing values, patients with cardiovascular, liver, kidney, and thyroid disease, and patients receiving treatment for malignant tumors were excluded. To collect data on past medical history and treatment for malignant tumors, questionnaires were distributed during health checkups, and participants were asked to complete them. Prior to receiving the data for analyses, the patients’ IDs and names were coded for anonymity to ensure that the individuals could not be identified. Therefore, the anonymity and confidentiality of the research participants were guaranteed. This study was approved by the Research Ethics Review Committee of Bundang Jesaeng Hospital (IRB Approval No: DMC 2023-06-003) and was conducted in compliance with the ethical principles of the Declaration of Helsinki. The agency committee granted an exemption from obtaining written consent in advance. In addition, this study received approval for exemption from written consent because the risk to research subjects was extremely low even if consent was waived.
Clinical Measurements
The height was measured using HC1500 (Juntech Co., Seoul, Korea), and the values were entered manually. The weight was measured with the patients in the upright position using the bio-electrical impedance analyzer, Inbody 720 (Biospace Co. Ltd., Seoul, Korea), which was also used for body composition measurements. Body mass index (BMI) was calculated as weight (kg) divided by height squared (m2). WC was measured using a tape measure while standing with feet 25–30 cm apart, distributing body weight evenly, and exhaling comfortably. Measurements were made to the nearest 0.1 cm with a tape measure at the midpoint between the lowest ribs and the highest pelvis (iliac crest). Blood pressure was measured with the automatic blood pressure monitor HBP-9020 (OMRON, Kyoto, Japan) after resting for 30 min in a sitting position by placing the arm to be measured on a desk, with the height of the arm aligned with that of the heart. In addition, blood pressure was measured at least thrice at 1–2 min intervals, and the average value was calculated and presented. Blood tests were performed by collecting blood samples in a serum separator and EDTA (ethylene-diamine-tetraacetic acid) tubes in the morning after fasting for >8 h. Among the biochemical measurement items, levels of serum total cholesterol (TC), TG, high-density lipoprotein cholesterol (HDL-C), low-density lipoprotein cholesterol (LDL-C), blood urea nitrogen (BUN), creatinine, fasting blood glucose (FBG), and uric acid were analyzed using the TBA-2000FR NEO automatic biochemical analyzer (Toshiba, Tokyo, Japan). TC and TG levels were tested using the enzymatic colorimetric test, HDL-C level was tested using the enzymatic method, LDL-C level was tested using the liquid selective detergent assay, FBG level was tested by the hexokinase/glucose-6-phosphate dehydrogenase method, and uric acid level was tested using the uricase-method. In addition, uric acid level was measured using the peroxidase method, BUN level using the urease glutamate dehydrogenase method, and creatinine level using the Jaffe reaction method. Glycated hemoglobin A1c (HbA1c) was measured using Variant II (Bio Rad, CA, USA) equipment according to the principles of high-performance liquid chromatography. Insulin level was measured using Roche Modular Analytics E170 (Roche, Mannheim, Germany) equipment based on the principle of electrochemiluminescence immunoassay. The coefficient of variation of each biochemical test was ≤5%.
Definitions
High blood pressure follows the hypertension criteria presented in the revised United States hypertension guidelines (Seventh Report of the Joint National Committee on Prevention, Detection, and Treatment of High Blood Pressure [JNC-7]). Accordingly, patients were defined as hypertensive if they received antihypertensive treatment, if their systolic blood pressure was ≥140 mmHg, or if their diastolic blood pressure was ≥90 mmHg.21 Diabetes was defined as having an FBG level ≥126 mg/dL or receiving diabetes treatment based on the standards of the World Health Organization (WHO).22 The reference values for high LDL-C, TC, and low HDL-C were defined according to the Adult Treatment Panel III (ATP III) report of the National Cholesterol Education Program (NCEP). High LDL-C was defined as >160 mg/dL, high TC was defined as >240 mg/dL, and low HDL-C was defined as <40 mg/dL for men and <50 mg/dL for women.23 Metabolic syndrome was defined according to the NCEP-ATP III criteria if three or more of the five criteria were met.23 In addition, obesity was defined as having a BMI of ≥25 kg/m2, as suggested by the International Association for the Study of Obesity and the WHO Western Pacific Region of the International Obesity Task Force.24 The participants were classified into the following four phenotypes according to the cutoff values for TG and WC:15,25 (1) NTNW, TG level <150 mg/dL and WC <90 cm for men or <85 cm for women; (2) normal TG with enlarged waist (NTGW), TG level <150 mg/dL and WC ≥90 cm for men or ≥85 cm for women; (3) high TG with normal waist (HTNW), TG level ≥150 mg/dL and WC <90 cm for men or <85 cm for women; and (4) HTGW, TG level ≥150 mg/dL and WC ≥90 cm for men or ≥85 cm for women.
The WC*TG index was calculated as [WC (cm) * TG (mg/dL)].26 Furthermore, asymptomatic hyperuricemia was diagnosed when no symptoms were present, and the uric acid level was >7.0 mg/dL (420 μmol/L) in men or >6.0 mg/dL (360 μmol/L) in women.27
Statistical Analysis
The data in this study are presented as means and standard deviations for continuous variables, while categorical variables are presented as numbers and percentages. One-way analysis of variance was performed to analyze differences in anthropometric and biochemical variables of study participants according to each hypertriglyceridemia-waist phenotype, and in case of significant differences between groups, the Scheffe post-hoc test for multiple comparisons was applied. In addition, a chi-squared test was performed to compare categorical variables, such as the prevalence of asymptomatic hyperuricemia according to the HTGW phenotype. To confirm the association between the HTGW phenotype and hyperuricemia, after controlling for related factors, logistic regression was performed to calculate the odds ratios (ORs) and 95% confidence intervals (CIs). To confirm the ability to accurately distinguish asymptomatic hyperuricemia from the individual indicators of TG and WC and the composite indicator of the WC*TG index, a receiver operating characteristic (ROC) curve was used to measure the area under the ROC curve (AUC). In addition, TG, WC, and the sensitivity and specificity of the WC*TG index were calculated using the ROC curve. All statistical analyses were performed using IBM SPSS Statistics 24.0 (IBM, NY, USA), and statistical significance was set at two-tailed P<0.05.
Results
Clinical Characteristics of Study Participants
The results of comparing the clinical characteristics of the study participants by classifying them into four groups according to the TG waist phenotype are presented in Table 1. The NTNW, NTGW, HTNW, and HTGW groups comprised 15,243 (65.5%), 1920 (8.3%), 4222 (18.2%), and 1855 (8.0%) people, respectively. The average age of the participants was 45.28±11.11 years, and the NTGW group participants had the highest age. BMI, WC, systolic and diastolic blood pressures (P = 0.001), HbA1c, insulin, and BUN levels were higher in the HTNW group than in the NTNW group, higher in the NTGW group than in the HTNW group, and higher in the HTGW group than in the NTGW group (all P <0.001). TG and uric acid levels were higher in the NTGW group than in the NTNW group, higher in the HTNW group than in the NTGW group, and higher in the HTGW group than in the HTNW group (all P <0.001). TC, LDL-C, and creatinine levels were higher in the NTGW group than in the NTNW group and higher in the HTNW and HTGW groups than in the NTGW group (all P <0.001). Additionally, FBG level was higher in the NTGW and HTNW groups than in the NTNW group, and it was higher in the HTGW group than in the NTNW, NTGW, and HTNW groups (P <0.001). HDL-C level was lower in the NTGW group than in the NTNW group, lower in the HTNW group than in the NTGW group, and lower in the HTGW group than in the HTNW group (P <0.001). The prevalence of hypertension, diabetes, and metabolic syndrome according to the TG waist phenotype differed among the groups, with the HTGW group showing the highest prevalence (P<0.001).
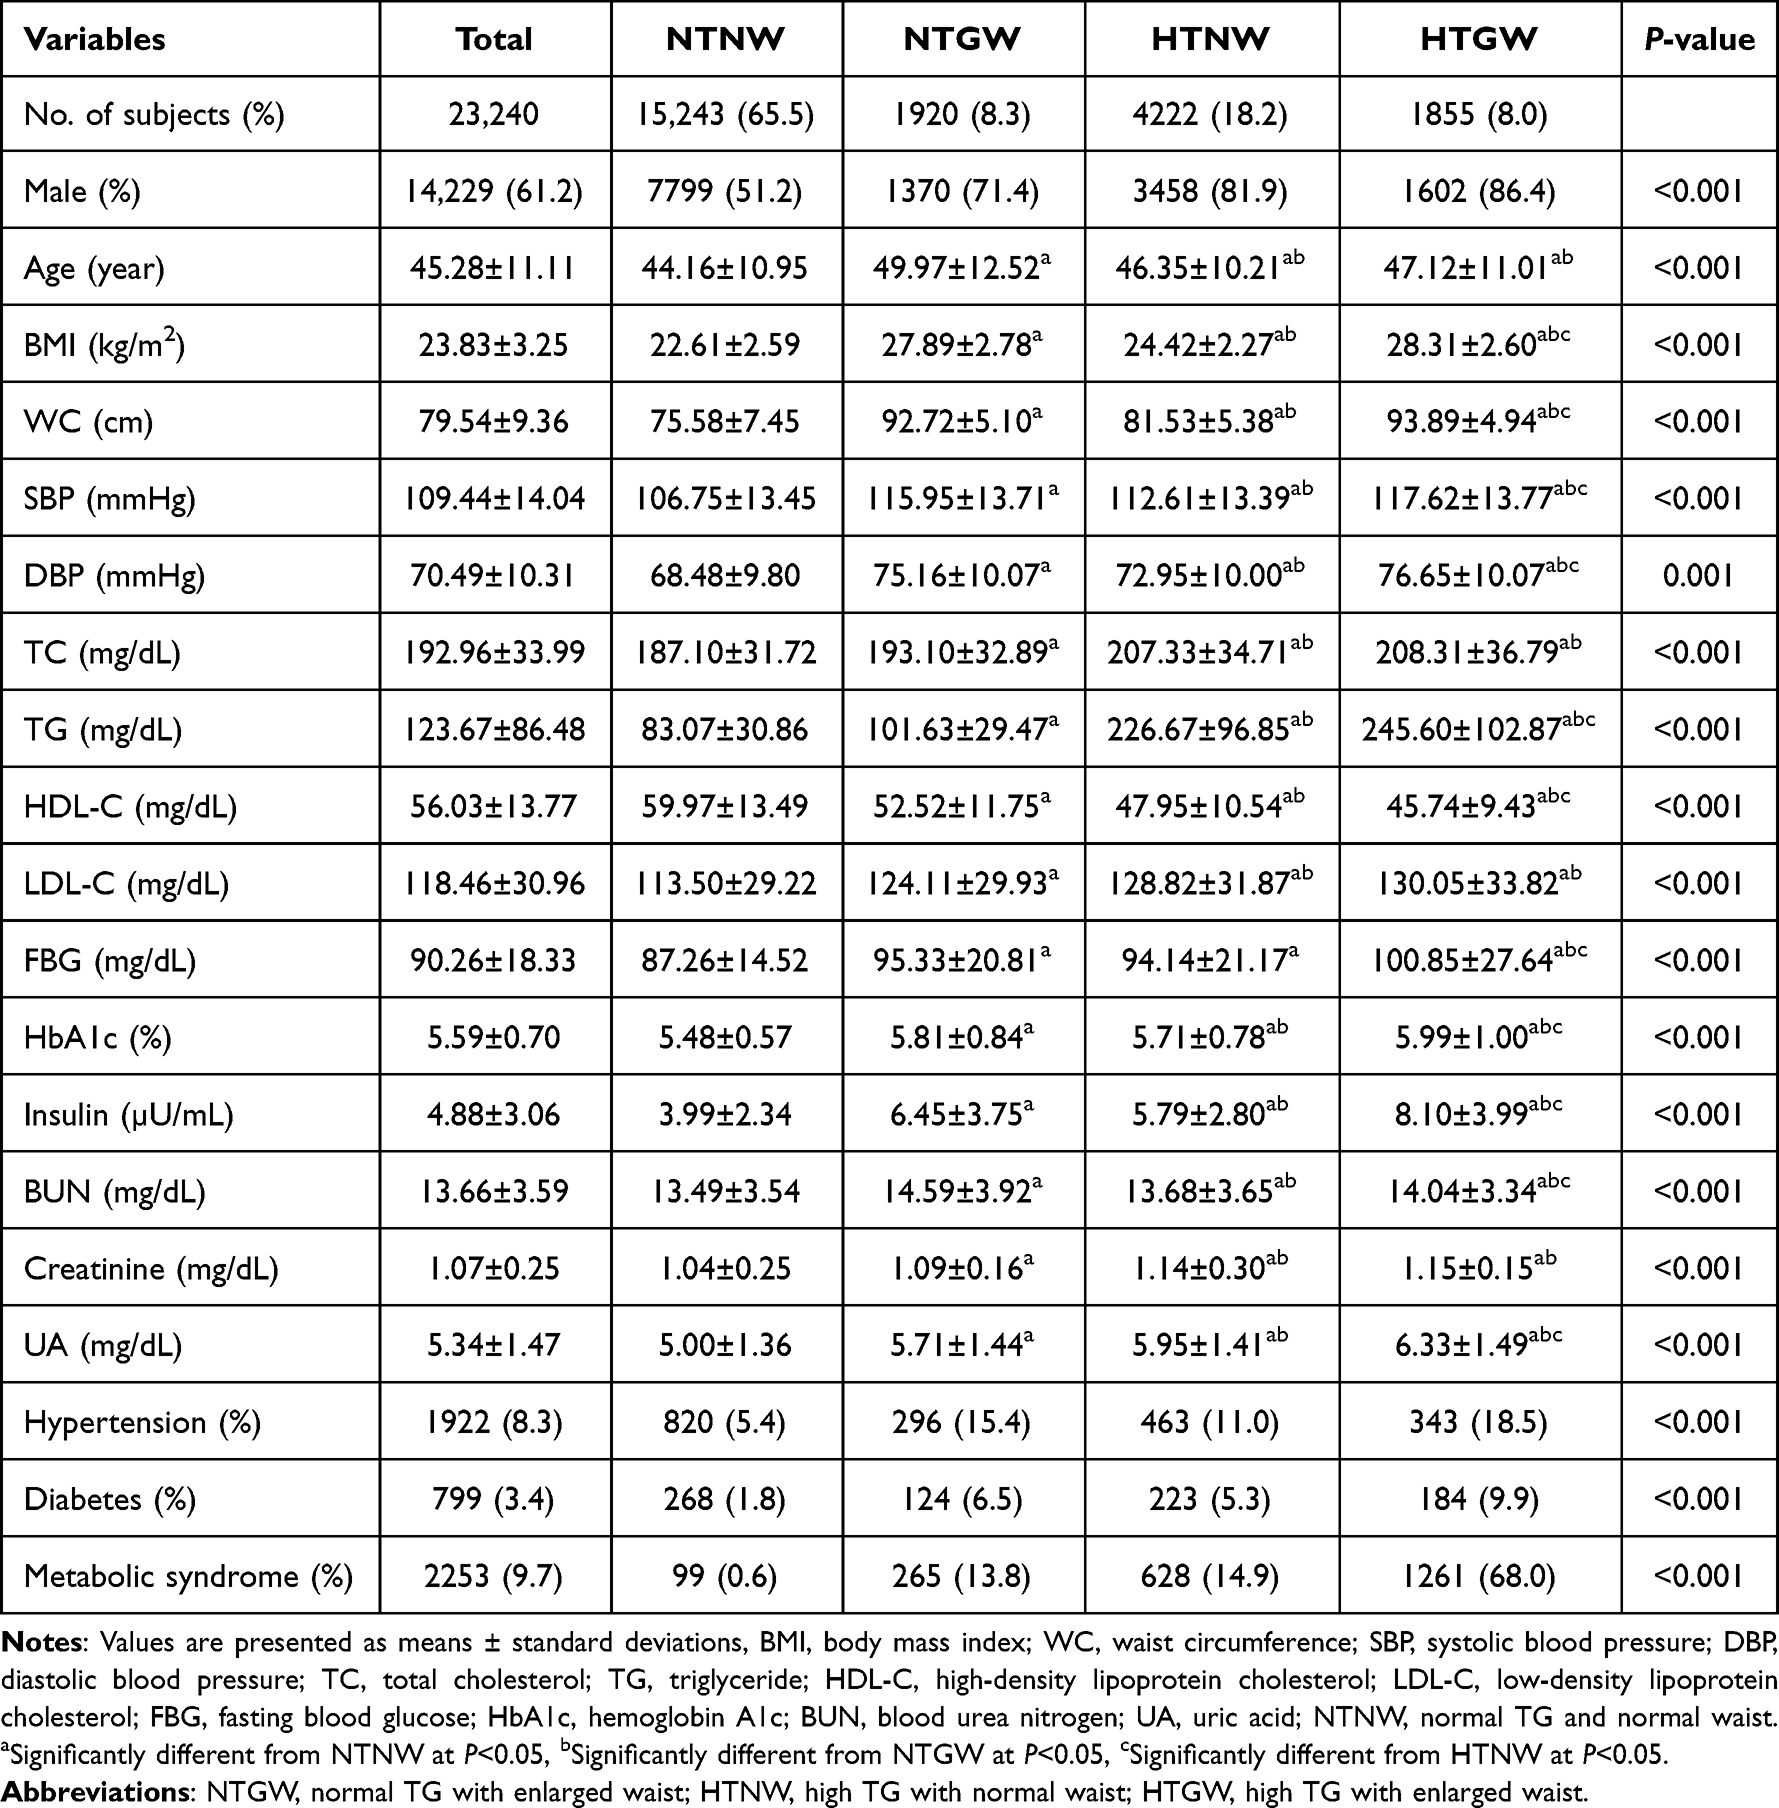 |
Table 1 Characteristics of the Subjects in Each Triglyceride-Waist Phenotypes |
Differences in the Prevalence of Asymptomatic Hyperuricemia According to the TG Waist Phenotype
The prevalence of asymptomatic hyperuricemia for all participants in the NTNW, NTGW, HTNW, and HTGW groups, according to the TG waist phenotype, was 9.8%, 21.8%, 24.7%, and 33.7%, respectively, with a significant difference between groups (P <0.001; Figure 1a).
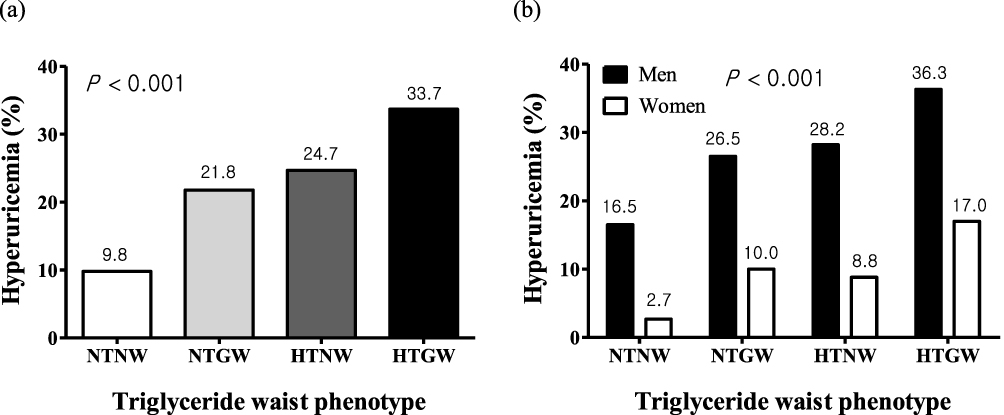 |
Figure 1 Prevalence of hyperuricemia by sex and triglyceride waist phenotypes; (a) All subjects, (b) Gender classification. Abbreviations: NTNW, normal TG and normal waist; NTGW, normal TG with enlarged waist; HTNW, high TG with normal waist; HTGW, high TG with enlarged waist. |
After categorizing by sex to determine differences in hyperuricemia prevalence based on the TG waist phenotype, the prevalence rates for men in the NTNW, NTGW, HTNW, and HTGW groups were 16.5%, 26.5%, 28.2%, and 36.3%, respectively. Significant differences were observed between these groups. The prevalence of hyperuricemia gradually increased as the groups progressed from the NTNW group to the HTGW group (P <0.001). In women, the prevalence of hyperuricemia among the NTNW, NTGW, HTNW, and HTGW groups was 2.7%, 10.0%, 8.8%, and 17.0%, respectively, with a significant difference identified between the groups (P <0.001). Moreover, the prevalence of hyperuricemia was highest in the HTGW group for both men and women (Figure 1b).
Risk Ratio for Developing Hyperuricemia According to the TG Waist Phenotype
The adjusted ORs and 95% CIs of hyperuricemia for the TG waist phenotype are presented in Table 2.
 |
Table 2 Odds Ratios for Hyperuricemia at Different Levels of Triglyceride Waist Phenotypes |
In men, compared with that in the NTNW group, the risk ratios for developing hyperuricemia were 1.990 (1.809–2.188, P <0.001) and 2.887 (2.566–3.249, P <0.001) in the HTNW and HTGW groups respectively. The differences appeared significant even after adjusting for potential confounders. In women, compared with that of the NTNW group, the risk ratios of the HTNW and HTGW groups were 3.446 (2.586–4.592, P <0.001) and 7.341 (5.139–10.487, P <0.001), respectively, indicating a high risk of developing hyperuricemia. The differences were significant even after adjusting for potential confounders. After comparing the risk ratio of hyperuricemia in the HTGW group with that of the non-HTGW group, the risks of developing hyperuricemia in the HTGW group after controlling for age, sex, and BMI in all participants, men, and women were 1.294 (1.146–1.460, P <0.001), 1.295 (1.140–1.470, P <0.001), and 1.888 (1.284–2.776, P <0.001), respectively. However, after additional control for systolic and diastolic blood pressures, TC, HDL-C, LDL-C, and FBG, no significant difference was identified in the risk ratio of developing hyperuricemia in the HTGW group, compared with that of the non-HTGW group (Table 3).
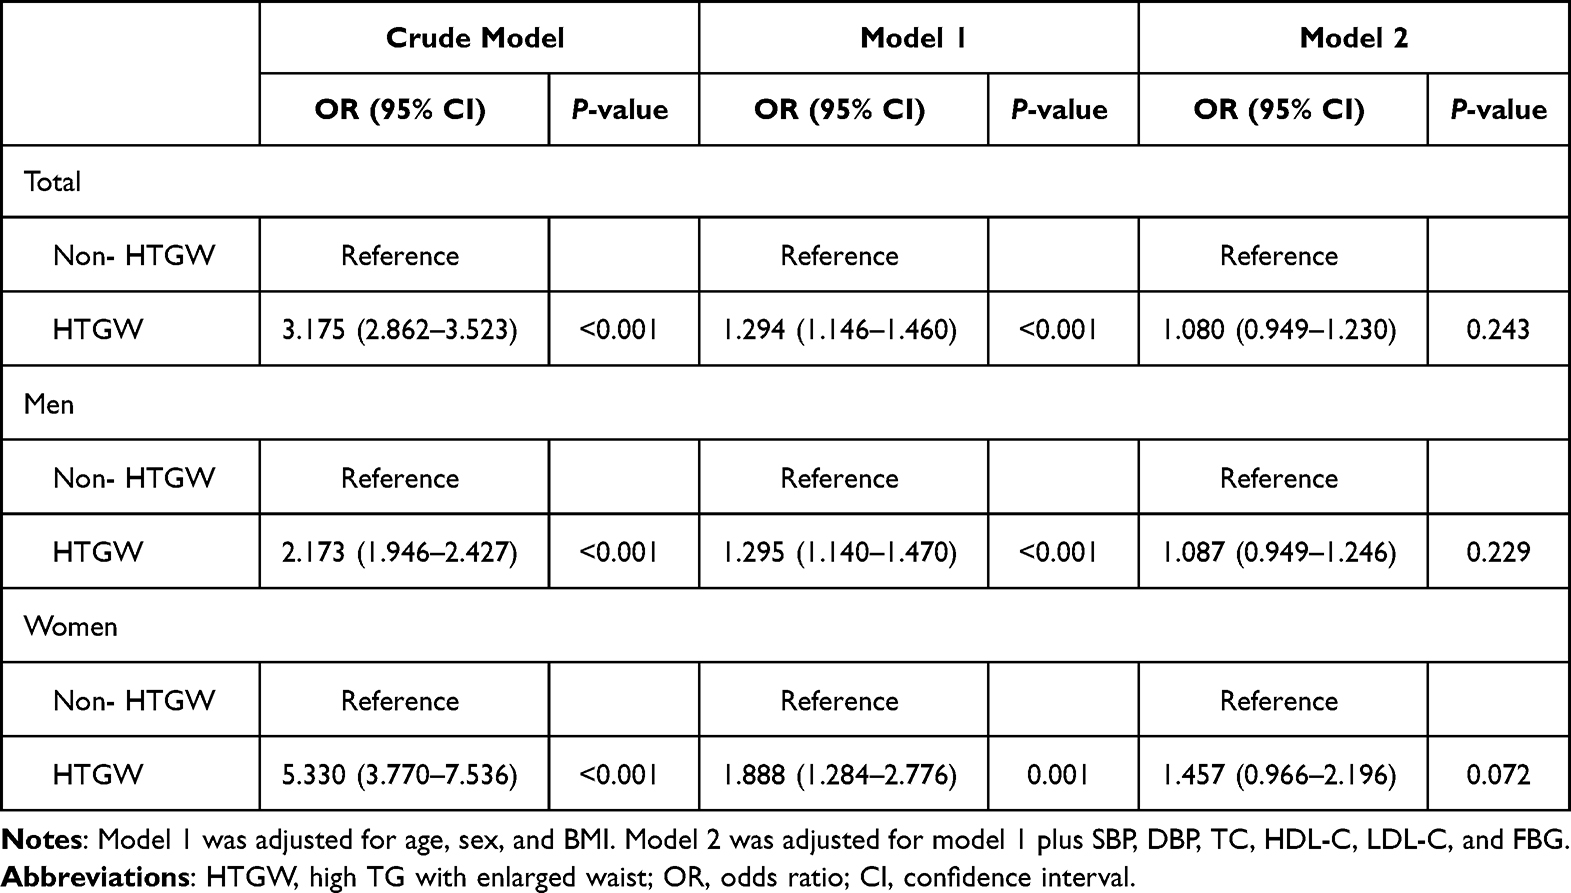 |
Table 3 Association of HTGW Phenotype and Hyperuricemia |
Risk Ratio of Hyperuricemia by the TG Waist Phenotype in Various Risk Factors
After adjusting for potential confounding factors in various risk factors, the risk ratios of hyperuricemia according to the TG waist phenotype are presented in Table 4. In participants aged <60 years, the risk ratios for hyperuricemia in the NTGW, HTNW, and HTGW groups were 1.215 (1.031–1.430, P = 0.020), 1.463 (1.298–1.650, P <0.001), and 1.396 (1.184–1.646, P <0.001), respectively. The risk ratio significantly increased, and the HTNW group had the highest risk ratio for hyperuricemia. However, in participants aged >60 years, no significant relationship was identified in the development of hyperuricemia according to the TG waist phenotype. In individuals with obesity with BMI values ≥25 kg/m2, the risk ratio for hyperuricemia in the NTGW group was 1.204 (1.020–1.422, P=0.029), that in the HTNW group was 1.495 (1.278–1.748, P<0.001), and that in the HTGW group was the highest at 1.518 (1.273–1.811, P<0.001). In participants without high LDL-C, high TC, and diabetes, the risk ratio of hyperuricemia was higher in the NTGW, HTNW and HTGW groups than that in the NTNW group, with the risk ratio in the HTNW group being the highest (1.477 [1.304–1.672, P<0.001], 1.411 [1.244–1.600, P<0.001], 1.384 [1.232–1.555, P<0.001], respectively). In participants without low HDL-C, the risk ratios for hyperuricemia in the NTGW, HTNW, and HTGW groups were 1.296 (1.101–1.526, P = 0.002), 1.388 (1.220–1.578, P <0.001), and 1.423 (1.192–1.698, P <0.001), respectively. Thus, the risk ratio increased significantly.
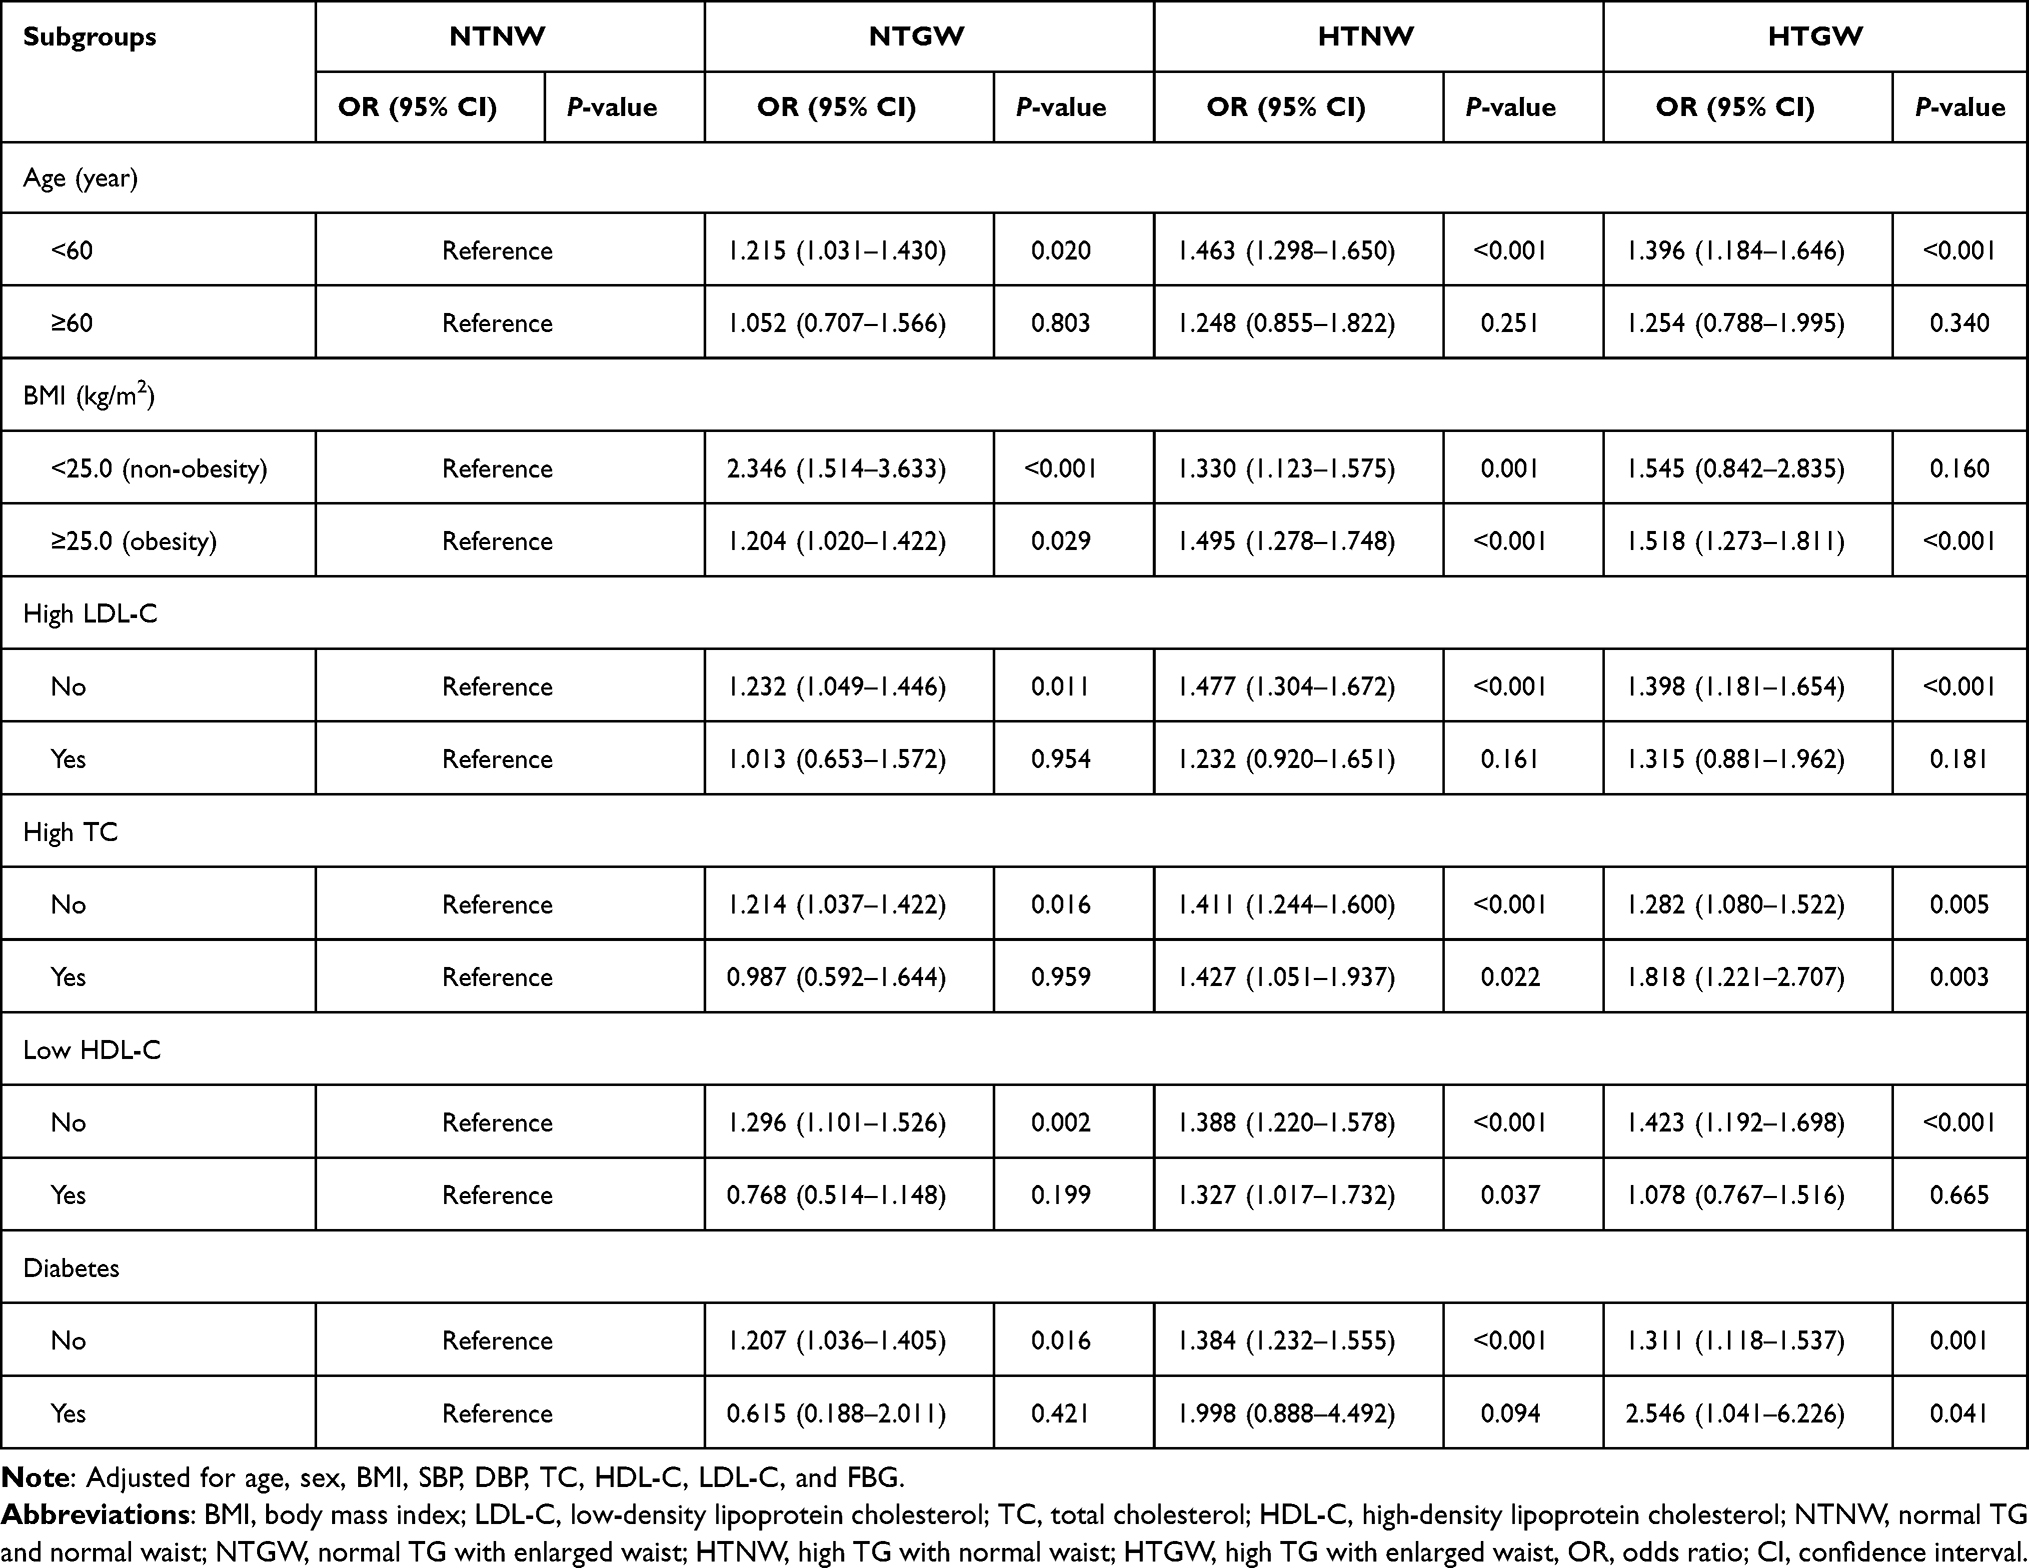 |
Table 4 Odds Ratios for Hyperuricemia According to Triglyceride Waist Phenotypes by Various Risk Factors |
Usefulness of HTGW Measurement Variables for Predicting Hyperuricemia
The usefulness of HTGW measurement variables for identifying hyperuricemia through the ROC curve is presented in Table 5. For WC, the AUC values with their 95% CIs were 0.712 (0.704–0.721, P <0.001), 0.614 (0.603–0.625, P <0.001), and 0.693 (0.664–0.721, P <0.001) for all participants, men, and women, respectively. For TGs, used to identify hyperuricemia, the AUC values with 95% CIs were 0.682 (0.673–0.691, P <0.001), 0.617 (0.606–0.628, P <0.001), and 0.666 (0.637–0.696, P <0.001) for all participants, men, and women, respectively. The AUC values for the WC*TG index with their 95% CIs were 0.702 (0.693–0.711, P <0.001), 0.627 (0.617–0.638, P <0.001), and 0.685 (0.656–0.715, P <0.001) for all participants, men, and women, respectively.
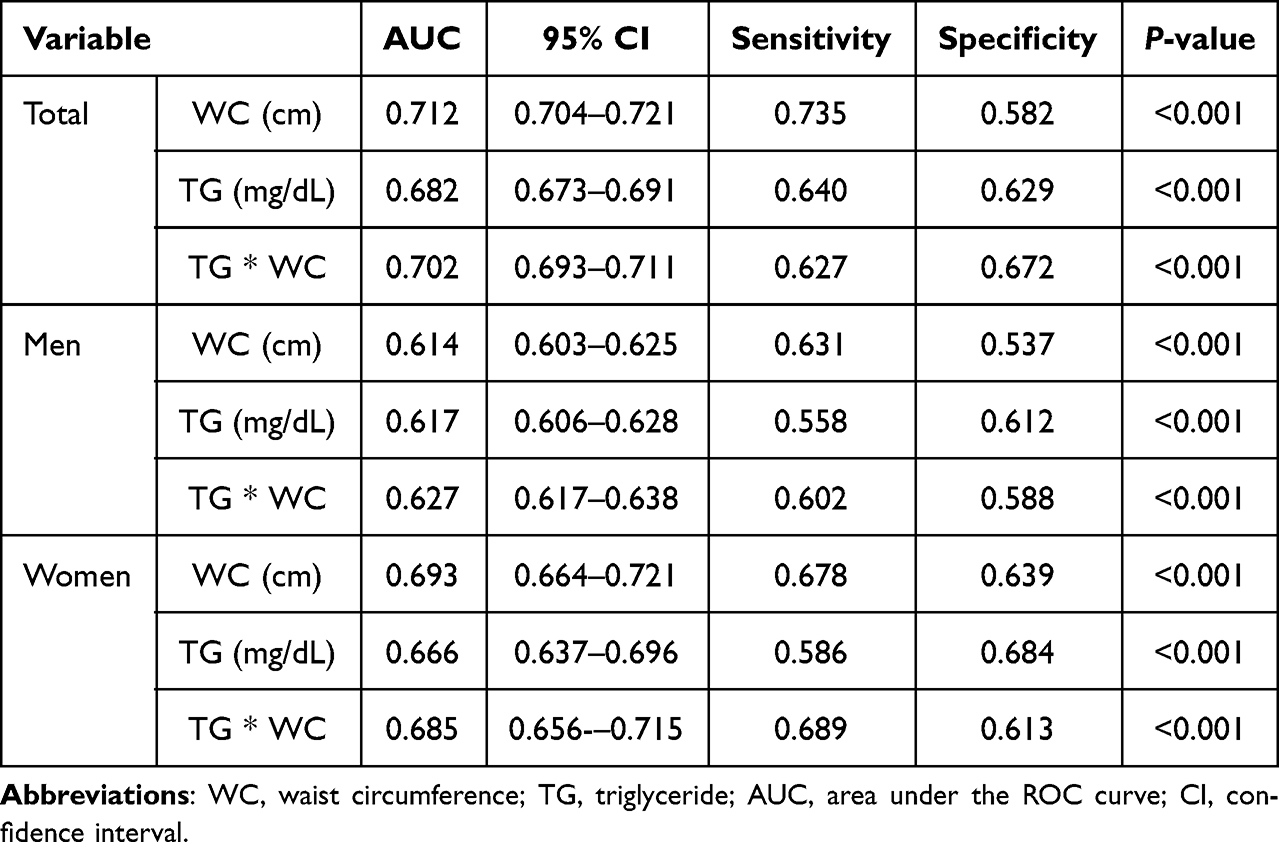 |
Table 5 Areas Under the Receiver Operating Characteristic Curve (AUC) of the Indicators to Detect Hyperuricemia |
Discussion
In this study, the likelihood of developing asymptomatic hyperuricemia was 1.39 times higher in participants with the HTGW phenotype than in Korean adults with the NTNW phenotype. Specifically, the HTGW phenotype with diabetes had a 2.55 times higher probability of developing asymptomatic hyperuricemia than did the NTNW phenotype. Furthermore, among the HTGW measurement variables, the WC*TG index for men and the WC for women had the highest predictive ability for hyperuricemia. However, the AUC value of the HTGW phenotype was less than 0.7; this indicates limitations to its effective application in Korean adults. WC is a predictive indicator of insulin resistance and cardiovascular risk, and it has been suggested as a surrogate marker for measuring abdominal visceral fat.28 However, because WC alone is not sufficient to distinguish between visceral fat and subcutaneous fat, TG levels were adopted as an additional indicator to measure visceral obesity.29,30 The HTGW phenotype was proposed based on the roles of dyslipidemia and abdominal obesity as sensitive markers of cardiometabolic risk.15,31 Therefore, the HTGW phenotype is presented as an index to more comprehensively evaluate visceral fat accumulation.29 People with visceral obesity have high blood uric acid levels, and men with visceral obesity are especially known to have a high risk of developing gout.14 Based on the results of this study, the prevalence of hyperuricemia in the HTGW phenotype was the highest among the four phenotypes, and the prevalence of hyperuricemia in the HTGW phenotype was 3.44 times higher than that in the NTNW phenotype. In addition, similar results were obtained in both men and women, which is consistent with the findings of Amadi et al14 in Nigerian patients with hypertension, which showed that the prevalence of hyperuricemia was significantly higher in the HTGW phenotype than in the NTNW phenotype. The HTGW phenotype is associated with hyperuricemia and has been suggested to be a strong risk factor for hyperuricemia.19,20 Chen et al19 reported that the HTGW phenotype was significantly associated with hyperuricemia in the Chinese population. In addition, the likelihood of developing hyperuricemia in the HTGW phenotype was 4.59 times in men and 3.55 times in women, indicating a stronger association in men.19 Another study discovered that the HTGW phenotype had a higher risk of hyperuricemia than did the NTNW phenotype, and this association was more pronounced in women than in men.18
The results of this study indicate that men with the HTGW phenotype were 1.38 times more likely to develop asymptomatic hyperuricemia than those with the NTNW phenotype, and women with the HTGW phenotype were 2.08 times more likely to develop asymptomatic hyperuricemia. This association was independent of age, sex, and other potential confounders. Increased visceral fat in postmenopausal women indicates a strong association between the HTGW phenotype and hyperuricemia.32 However, as this study did not evaluate pre- and post-menopausal women to investigate the relationship, future research on this relationship is necessary. Additionally, compared with that in the NTNW phenotype, the risk of developing hyperuricemia in the HTNW phenotype was the highest at 1.44 times, followed by the HTGW phenotype at 1.39 times. The higher risk may be attributed to the relationship between hyperuricemia and TG, which is stronger than that between hyperuricemia and abdominal obesity.
The balance between the production and excretion of uric acid is a determining factor in maintaining a constant concentration of uric acid in the blood.19 Elevated TG levels can cause fat to accumulate in the ectopic tissue, causing fatty liver and pressure on the kidneys due to excessive fatty tissue.33,34 Abnormal uric acid reabsorption and production of uricase in the kidneys are reported to be the causes of hyperuricemia.35 In addition, xanthine oxidase, which is involved in uric acid production, shows a positive correlation with TGs, and in the Fredrickson classification, type IV hyperlipoproteinemia is reported to have a high frequency of hyperuricemia.36–38 Therefore, this mechanism could explain the high risk of hyperuricemia in the HTGW and HTNW phenotypes.
The results of this study, based on stratified analysis, suggest that the HTGW phenotype, coupled with diabetes, had the highest probability of developing asymptomatic hyperuricemia (2.55 times). Three main causes of diabetes are associated with uric acid. First, inflammatory responses and diabetes are closely related, and an increase in uric acid levels produces interleukin, tumor necrosis factor, and C-reactive protein, causing an inflammatory response. A recent study revealed that in people with obesity, the uric acid-to-HDL-C ratio is related to the visceral fat area rather than the subcutaneous fat area.39 Excessive visceral fat accumulation causes metabolic disorders, such as insulin resistance, by hyperexciting the sympathetic nerves and inducing the secretion of inflammatory cytokines.40,41 Second, though uric acid acts as an antioxidant within the cells, it promotes oxidation through the production of reactive oxygen species, which cause lipid peroxidation and DNA and cell damage.42 Third, uric acid reduces the proliferation of vascular endothelial cells and the secretion of nitric oxide, causing vascular endothelial dysfunction and insulin resistance.43
Previous research suggests that the HTGW phenotype can be used as an indicator to identify individuals at high risk of hyperuricemia.17 Our study revealed that the AUCs were the highest for the WC*TG index in men (0.627) and for the WC in women (0.693); however, the AUC value of the WC*TG index was less than 0.7, indicating that it is not an optimal index for identifying individuals at a risk for hyperuricemia. Therefore, we suggest that the HTGW phenotype be combined with another index for higher predictive accuracy.
This study has value as a large-scale study that includes extensive adjustment for anthropometric variables and clinical factors. However, several potential limitations must be considered. First, due to the cross-sectional study design, the causal relationship between the HTGW phenotype and asymptomatic hyperuricemia could not be determined. Second, all study participants were limited to one region in Korea, which limits the generalization of the results. Third, although many confounders were adjusted in the analysis, potential influences such as diet, exercise, smoking and drinking, drug use, and genetic factors were not taken into consideration. Therefore, additional research is needed to understand the metabolic mechanism of the relationship between asymptomatic hyperuricemia and the HTGW phenotype.
Conclusion
This study investigated the association between the HTGW phenotype and asymptomatic hyperuricemia in Korean adults. The prevalence of hyperuricemia was the highest in the HTGW phenotype, and the likelihood of developing asymptomatic hyperuricemia was 1.39 times higher in participants with the HTGW phenotype than in those with the NTNW phenotype. In particular, a strong association was observed between the HTGW phenotype and asymptomatic hyperuricemia in participants with diabetes. Additionally, the AUCs for the HTGW phenotype for identifying individuals at a high risk of hyperuricemia were 0.627 for men and 0.685 for women. Therefore, in individuals with the HTGW phenotype, the blood uric acid levels should be monitored to prevent hyperuricemia. We also suggest combining the HTGW phenotype with an indicator that can complement its accuracy for identifying individuals at a high risk of hyperuricemia development.
Abbreviations
AUC, area under the receiver operating characteristic curve; BMI, body mass index; BUN, blood urea nitrogen; CI, confidence interval; FBG, fasting blood glucose; HbA1c, glycated hemoglobin A1c; HDL-C, high-density lipoprotein cholesterol; HTGW, hypertriglyceridemic-waist; HTNW, high triglyceride with normal waist; LDL-C, low-density lipoprotein cholesterol; NTGW, normal triglyceride with enlarged waist; NTNW, normal triglyceride normal waist; OR, odds ratio; ROC, receiver operating characteristic; TC, total cholesterol; TG, triglyceride; WC, waist circumference.
Ethics Approval and Informed Consent
This study was approved by the Research Ethics Review Committee of Bundang Jesaeng Hospital (IRB Approval No: DMC 2023-06-003) and was conducted in compliance with the ethical principles of the Declaration of Helsinki. The agency committee granted an exemption from written consent beforehand.
Acknowledgments
The authors are highly grateful to all those who provided their assistance in this study. The authors also acknowledge Myung Shin Kang for his assistance with data collection and analysis.
Author Contributions
All authors made a significant contribution to the work reported, whether that is in the conception, study design, execution, acquisition of data, analysis and interpretation, or in all these areas; took part in drafting, revising or critically reviewing the article; gave final approval of the version to be published; have agreed on the journal to which the article has been submitted; and agree to be accountable for all aspects of the work.
Funding
No funding was received for this study.
Disclosure
Kyung-A Shin worked at Bundang Jesaeng Hospital while planning the study but is no longer affiliated with the institution. The authors report no conflicts of interest in this work.
References
1. Feig DI, Madero M, Jalal DI, Sanchez-Lozada LG, Johnson RJ. Uric acid and the origins of hypertension. J Pediatr. 2013;162(5):896–902. doi:10.1016/j.jpeds.2012.12.078
2. Heinig M, Johnson RJ. Role of uric acid in hypertension, renal disease, and metabolic syndrome. Cleve Clin J Med. 2006;73(12):1059–1064. doi:10.3949/ccjm.73.12.1059
3. Kim SY, Guevara JP, Kim KM, Choi HK, Heitjan DF, Albert DA. Hyperuricemia and risk of stroke: a systematic review and meta-analysis. Arthritis Rheum. 2009;61(7):885–892. doi:10.1002/art.24612
4. Mangge H, Zelzer S, Puerstner P, et al. Uric acid best predicts metabolically unhealthy obesity with increased cardiovascular risk in youth and adults. Obesity. 2013;21(1):E71–E77. doi:10.1002/oby.20061
5. Xu Y, Zhu J, Gao L, et al. Hyperuricemia as an independent predictor of vascular complications and mortality in type 2 diabetes patients: a meta-analysis. PLoS One. 2013;8(10):e78206. doi:10.1371/journal.pone.0078206
6. Choi HK, Atkinson K, Karlson EW, Willett W, Curhan G. Purine-rich foods, dairy and protein intake, and the risk of gout in men. N Engl J Med. 2004;350(11):1093–1103. doi:10.1056/NEJMoa035700
7. Wallace KL, Riedel AA, Joseph-Ridge N, Wortmann R. Increasing prevalence of gout and hyperuricemia over 10 years among older adults in a managed care population. J Rheumatol. 2004;31(8):1582–1587.
8. Kim Y, Kang J, Kim GT. Prevalence of hyperuricemia and its associated factors in the general Korean population: an analysis of a population-based nationally representative sample. Clin Rheumatol. 2018;37(9):2529–2538. doi:10.1007/s10067-018-4130-2
9. Takahashi S, Yamamoto T, Tsutsumi Z, Moriwaki Y, Yamakita J, Higashino K. Close correlation between visceral fat accumulation and uric acid metabolism in healthy men. Metabolism. 1997;46(10):1162–1165. doi:10.1016/s0026-0495(97)90210-9
10. Kanellis J, Watanabe S, Li JH, et al. Uric acid stimulates monocyte chemoattractant protein-1 production in vascular smooth muscle cells via mitogen-activated protein kinase and cyclooxygenase-2. Hypertension. 2003;41(6):1287–1293. doi:10.1161/01.HYP.0000072820.07472.3B
11. Tamba S, Nishizawa H, Funahashi T, et al. Relationship between the serum uric acid level, visceral fat accumulation and serum adiponectin concentration in Japanese men. Intern Med. 2008;47(13):1175–1180. doi:10.2169/internalmedicine.47.0603
12. Rathmann W, Funkhouser E, Dyer AR, Roseman JM. Relations of hyperuricemia with the various components of the insulin resistance syndrome in young black and white adults: the CARDIA study. Coronary Artery Risk Development in Young Adults. Ann Epidemiol. 1998;8(4):250–261. doi:10.1016/s1047-2797(97)00204-4
13. Klein S, Allison DB, Heymsfield SB, et al. Waist circumference and cardiometabolic risk: a consensus statement from shaping America’s health: Association for Weight Management and Obesity Prevention; NAASO, the Obesity Society; the American Society for Nutrition; and the American Diabetes Association. Diabetes Care. 2007;30(6):1647–1652. doi:10.2337/dc07-9921
14. Amadi CE, Mbakwem AC, Duro DC, et al. Prevalence, patterns and predictors of metabolic abnormalities in Nigerian hypertensives with hypertriglyceridemic waist phenotype: a cross sectional study. PLOS Glob Public Health. 2022;2(12):e0001203. doi:10.1371/journal.pgph.0001203
15. Lemieux I, Pascot A, Couillard C, et al. Hypertriglyceridemic waist: a marker of the atherogenic metabolic triad (hyperinsulinemia; hyperapolipoprotein B; small, dense LDL) in men? Circulation. 2000;102(2):179–184. doi:10.1161/01.cir.102.2.179
16. Ren Y, Zhang M, Zhao J, et al. Association of the hypertriglyceridemic waist phenotype and type 2 diabetes mellitus among adults in China. J Diabetes Investig. 2016;7(5):689–694. doi:10.1111/jdi.12489
17. Tian YM, Ma N, Jia XJ, Lu Q. The ”hyper-triglyceridemic waist phenotype” is a reliable marker for prediction of accumulation of abdominal visceral fat in Chinese adults. Eat Weight Disord. 2020;25(3):719–726. doi:10.1007/s40519-019-00677-w
18. He H, Wang S, Xu T, et al. Sex-related differences in the hypertriglyceridemic-waist phenotype in association with hyperuricemia: a longitudinal cohort study. Lipids Health Dis. 2023;22(1):38. doi:10.1186/s12944-023-01795-2
19. Chen S, Guo X, Dong S, et al. Association between the hypertriglyceridemic waist phenotype and hyperuricemia: a cross-sectional study. Clin Rheumatol. 2017;36(5):1111–1119. doi:10.1007/s10067-017-3559-z
20. Zaragoza-García O, Navarro-Zarza JE, Maldonado-Anicacio JY, Castro-Alarcón N, Rojas IP, Guzmán-Guzmán IP. Hypertriglyceridaemic waist is associated with hyperuricaemia and metabolic syndrome in rheumatoid arthritis patients. Diabetes Metab Syndr. 2019;13(1):722–729. doi:10.1016/j.dsx.2018.11.053
21. Chobanian AV, Bakris GL, Black HR, et al. Seventh report of the Joint National Committee on prevention, detection, evaluation, and treatment of high blood pressure. Hypertension. 2003;42(6):1206–1252. doi:10.1161/01.HYP.0000107251.49515.c2
22. Alberti KG, Zimmet PZ. Definition, diagnosis and classification of diabetes mellitus and its complications. Part 1: diagnosis and classification of diabetes mellitus provisional report of a WHO consultation. Diabet Med. 1998;15(7):539–553. doi:10.1002/(SICI)1096-9136(199807)15:7<539::AID-DIA668>3.0.CO;2-S
23. Expert Panel on Detection, Evaluation, and Treatment of High Blood Cholesterol in Adults. Executive summary of the third report of the national cholesterol education program (NCEP) expert panel on detection, evaluation, and treatment of high blood cholesterol in adults (Adult Treatment Panel III). JAMA. 2001;285(19):2486–2497. doi:10.1001/jama.285.19.2486
24. WHO Expert Consultation. Appropriate body-mass index for Asian populations and its implications for policy and intervention strategies. Lancet. 2004;363(9403):157–163. doi:10.1016/S0140-6736(03)15268-3
25. Lee SY, Park HS, Kim DJ, et al. Appropriate waist circumference cutoff points for central obesity in Korean adults. Diabet Res Clin Pract. 2007;75(1):72–80. doi:10.1016/j.diabres.2006.04.013
26. de Cuevillas B, Alvarez-Alvarez I, Riezu-Boj JI, Navas-Carretero S, Martinez JA. The hypertriglyceridemic-waist phenotype as a valuable and integrative mirror of metabolic syndrome traits. Sci Rep. 2021;11(1):21859. doi:10.1038/s41598-021-01343-x
27. Bardin T, Richette P. Definition of hyperuricemia and gouty conditions. Curr Opin Rheumatol. 2014;26(2):186–191. doi:10.1097/BOR.0000000000000028
28. Borruel S, Moltó JF, Alpañés M, et al. Surrogate markers of visceral adiposity in young adults: waist circumference and body mass index are more accurate than waist Hip ratio, model of adipose distribution and visceral adiposity index. PLoS One. 2014;9(12):e114112. doi:10.1371/journal.pone.0114112
29. Sam S, Haffner S, Davidson MH, et al. Hypertriglyceridemic waist phenotype predicts increased visceral fat in subjects with type 2 diabetes. Diabetes Care. 2009;32(10):1916–1920. doi:10.2337/dc09-0412
30. LeBlanc S, Coulombe F, Bertrand OF, et al. Hypertriglyceridemic waist: a simple marker of high-risk atherosclerosis features associated with excess visceral adiposity/ectopic fat. J Am Heart Assoc. 2018;7(8):e008139. doi:10.1161/JAHA.117.008139
31. Arsenault BJ, Lemieux I, Després JP, et al. The hypertriglyceridemic-waist phenotype and the risk of coronary artery disease: results from the EPIC-Norfolk prospective population study. CMAJ. 2010;182(13):1427–1432. doi:10.1503/cmaj.091276
32. Bao Q, Li Y, Ma S, et al. Hypertriglyceridemic waist phenotype is associated with left ventricular hypertrophy in Chinese hypertension patients. J Clin Hypertens. 2023;25(2):191–198. doi:10.1111/jch.14604
33. Després JP, Lemieux I, Bergeron J, et al. Abdominal obesity and the metabolic syndrome: contribution to global cardiometabolic risk. Arterioscler Thromb Vasc Biol. 2008;28(6):1039–1049. doi:10.1161/ATVBAHA.107.159228
34. Weinberg JM. Lipotoxicity. Kidney Int. 2006;70(9):1560–1566. doi:10.1038/sj.ki.5001834
35. Matsubara K, Matsuzawa Y, Jiao S, Takama T, Kubo M, Tarui S. Relationship between hypertriglyceridemia and uric acid production in primary gout. Metabolism. 1989;38(7):698–701. doi:10.1016/0026-0495(89)90110-8
36. Povoa H, Sa LD, Lessa VM. Xanthine oxidase and triglycerides in serum of patients with hyperlipoproteinemia, type IV. Biomed Biochim Acta. 1984;43(10):1201–1203.
37. Saviola G, Benucci M, Abdi-Ali L, Sacco S, Cera I, Rossini M. Can febuxostat reduce triglyceride and cholesterol serum levels in gouty patients? J Clin Rheumatol. 2014;20(7):394–395. doi:10.1097/RHU.0000000000000168
38. Sezai A, Soma M, Nakata K, et al. Comparison of febuxostat and allopurinol for hyperuricemia in cardiac surgery patients (NU-FLASH Trial). Circ J. 2013;77(8):2043–2049. doi:10.1253/circj.cj-13-0082
39. Wang Y, Xu Y, Hu T, et al. Associations of serum uric acid to high-density lipoprotein cholesterol ratio with trunk fat mass and visceral fat accumulation. Diabetes Metab Syndr Obes. 2024;17:121–129. doi:10.2147/DMSO.S444142
40. Kahn CR, Wang G, Lee KY. Altered adipose tissue and adipocyte function in the pathogenesis of metabolic syndrome. J Clin Invest. 2019;129(10):3990–4000. doi:10.1172/JCI129187
41. Lee MJ, Wu Y, Fried SK. Adipose tissue heterogeneity: implication of depot differences in adipose tissue for obesity complications. Mol Aspects Med. 2013;34(1):1–11. doi:10.1016/j.mam.2012.10.001
42. Kimura Y, Tsukui D, Kono H. Uric acid in inflammation and the pathogenesis of atherosclerosis. Int J Mol Sci. 2021;22(22):12394. doi:10.3390/ijms222212394
43. Xiong Q, Liu J, Xu Y. Effects of uric acid on diabetes mellitus and its chronic complications. Int J Endocrinol. 2019;2019:9691345. doi:10.1155/2019/9691345
 © 2024 The Author(s). This work is published and licensed by Dove Medical Press Limited. The full terms of this license are available at https://www.dovepress.com/terms.php and incorporate the Creative Commons Attribution - Non Commercial (unported, v3.0) License.
By accessing the work you hereby accept the Terms. Non-commercial uses of the work are permitted without any further permission from Dove Medical Press Limited, provided the work is properly attributed. For permission for commercial use of this work, please see paragraphs 4.2 and 5 of our Terms.
© 2024 The Author(s). This work is published and licensed by Dove Medical Press Limited. The full terms of this license are available at https://www.dovepress.com/terms.php and incorporate the Creative Commons Attribution - Non Commercial (unported, v3.0) License.
By accessing the work you hereby accept the Terms. Non-commercial uses of the work are permitted without any further permission from Dove Medical Press Limited, provided the work is properly attributed. For permission for commercial use of this work, please see paragraphs 4.2 and 5 of our Terms.