")
Back to Journals » Clinical Optometry » Volume 16
Prevalence of Visual Impairment and Associated Factors Among Older Adults in Southern Ethiopia, 2022
Authors Getachew T , Mengistu M, Getahun F
Received 13 October 2023
Accepted for publication 29 December 2023
Published 4 January 2024 Volume 2024:16 Pages 1—16
DOI https://doi.org/10.2147/OPTO.S440423
Checked for plagiarism Yes
Review by Single anonymous peer review
Peer reviewer comments 2
Editor who approved publication: Mr Simon Berry
Tamiru Getachew,1 Masresha Mengistu,2 Firdawek Getahun3
1Department of Human Anatomy, School of Medicine, Arba Minch University, Arba Minch, Ethiopia; 2Department of Ophthalmology, Arba Minch General Hospital, Arba Minch, Ethiopia; 3School of Public Health, Arba Minch University, Arba Minch, Ethiopia
Correspondence: Tamiru Getachew, Department of Human Anatomy, School of Medicine, Arba Minch University, Arba Minch, Ethiopia, Email [email protected]
Background: Visual impairment is a functional limitation of the eye brought on by a disorder or disease that can make it more difficult to carry out daily tasks. Visual impairment causes a wide range of public health, social, and economic issues, particularly in developing nations, where more than 90% of the world’s visually impaired people reside. Although many studies conducted in Ethiopia related with the topic, there were focused on childhood visual impairments.
Objectives: To assess the prevalence and factors associated with visual impairment among older adults.
Methodology: A community-based cross-sectional study design was conducted in Arba Minch Zuria District. Systematic sampling technique was employed to select 655 adults aged 40 and above. Data were gathered through face-to-face interviews and visual acuity measurements, and SPSS version 25 was used for analysis. Bivariate and multivariate logistic regression analyses were performed to identify factors associated with visual impairment.
Results: The overall prevalence of visual impairment was found to be 36.95% (95% CI=33.2– 40.8%). Factors associated with a higher odds of visual impairment included aged 51– 60 years (AOR=2.37,95%CI=1.29– 4.44), aged 61 and above (AOR=8.9, 95%CI=4.86– 16.3), low wealth index ((AOR=1.81, 95%CI: 1.14– 3.2), divorced and widowed (AOR=4.67, 95%CI:2.77– 7.86), no formal education (AOR=14.28, 95%CI: 2.82– 71.46), not utilizing eyeglass (AOR=3.94, 95%CI (1.65– 9.40). The most possible causes of visual impairment were found to be refractive error and cataract.
Conclusions and Recommendations: The prevalence of visual impairment among study population was relatively high, and more than three-fifths of participants had unilateral visual impairment. Age, marital status, occupation, educational status, wealth index, and not wearing of prescribed eyeglasses were significantly associated with visual impairment. Refractive error is the leading cause of visual impairment. Awareness of spectacle use and expanding cataract surgery coverage are urgently needed in this area.
Keywords: older adults, eye, visual system, visual impairment
Introduction
Visual impairment (VI) is a functional limitation of the eye brought on by a disorder or disease that can make it more difficult to carry out daily tasks.1 According to World Health Organization (WHO) definition, VI refers to a presenting distance visual acuity (PVA) that is worse than 6/18 in worst eye.2 The Snellen “E” chart is typically used to measure visual acuity at a distance of 6 m.3
Visual impairment causes disabilities by significantly interfering with one’s ability to function independently. These disabilities limit personal and socioeconomic independence, and a visual handicap exists.4 Visually impaired elderly individuals are at increased risk of falls, fractures, and depression.5 Hence, their ability to find employment, support themselves, and provide for their families is diminished.6 More than two-thirds of visual impairment and blindness can be avoided by either prevention or treatment.7
The burden of VI is not distributed uniformly throughout the world, with the least developed regions having the largest share. It is also unequally distributed across age groups.8 Most people with vision impairment and blindness are over the age of 50; however, vision loss can affect people of all ages.7 As populations continue to age, the prevalence of vision impairment and blindness is projected to more than double over the next 30 years.9
Previous studies have shown that several factors are associated with visual impairment, such as older age,10,11 rural residency,12 lower educational status, low monthly income,12,13 cataracts,10,14,15 glaucoma,14 macular degeneration,14 chronic comorbid illnesses,10 and smoking.16
According to a global WHO report, about 2.2 billion people have distance VI. Almost half of these cases have been prevented or are yet to be addressed. The leading causes of VI and blindness are found to be uncorrected refractive error and cataracts.7 The prevalence of VI among adults aged 40 years in the South Indian, State of Andhra Pradesh was 14.3%,17 and in East Delhi district on similar age category was 11.4%.18 Data on the prevalence of visual impairment in Africa vary. In Ghana among Farmers aged ≥ 40 years was 22.7%.19 In Upper Egypt, the number of adults aged ≥ 40 years was 38.8%.20
In Ethiopia, many studies were conducted previously on similar topics, however, most of them focused on childhood visual impairment.21,22 The studies also included participants aged a cut of point at 18 years and above. In a study conducted in Debre Markos, Ethiopia, the magnitude of VI was 36.52%,23 at St Paul’s Millennium Hospital Medical College, Ethiopia, low Vision and Blindness were found to be 10.3% and 7.3%, respectively,24 and a community-based study using worst eye seeing visual acuity in Debre Berhan town, Ethiopia among aged 18 and above the prevalence of visual impairment was found to be 16.8%.11
The high incidence of eye disease in Ethiopia is believed that it has brought significant economic and social consequences for individuals, society, and the nation.25 There are also impacts on caregivers, such as children who cannot go to school and adults who are out of work.26 Although multiple approaches and strategies to decrease the incidence of visual impairment conducted in Ethiopia by promoting the use of eye glasses, increasing public awareness, and free mass campaign service for cataract and trichiasis surgery, blinding factors are still on the rise due to the growing population and aging.27
Most visual impairments are caused by uncorrected refractive errors, which can be easily corrected by wearing eye glasses.14 Uncorrected visual problems may affect education, employment opportunities, productivity, and quality of life. Early detection and treatment of visual problems will reduce the dependency and burden of the disease on society. Understanding the prevalence and associated factors will help control and prevent visual impairment. To plan health services or for risk factor analysis, it is necessary to know the prevalence and distribution of visual impairment in community-dwelling populations.
To the best of our knowledge, no previous study has been conducted in Ethiopia in general or in a study area, in particular, by including older adults who are at high risk for developing visual problems.
Methods and Materials
Study Settings, Design, and Population
A community-based cross-sectional study was conducted among residents living in the Arba Minch Zuria District in Southern Ethiopia from October to November 2022 in nine kebeles (the lowest administrative unit of Ethiopia). The district has a total population of 164,529 as of the Ethiopian census of 2007, of which 82,199 are males and 82,330 are women. The highlands, midlands, and lowlands are the three distinct climate zones found in the 31 kebeles that make up the Arba Minch Zuria area. All adults aged ≥40 years who lived in the Arba Minch Zuria district and fulfilled the inclusion criteria were included. Respondents who were unable to speak in the absence of caregivers or relatives at the time of data collection, severely ill, or had recent ocular trauma or surgery were excluded.
Sample Size Determination and Sampling Procedure
The sample size was calculated using the single population proportion formula for cross-sectional study by considering the following assumptions: P (Prevalence) of VI among adults at Debre Berhan town was 16.8%11 α (level of significance) = 5%, Z value at 95% CI and 5% α = ±1.96 (two tailed), Margin of error (W) = 0.03 and “n” is the required sample size.
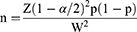

Then, by adding a 10% non-response rate, the final sample size was 655.
Nine kebeles in the Arba Minch Zuria Woreda were randomly selected. The total study population Households (HHs) with adults aged ≥ 40 and above were obtained from each kebeles. The total sample size is distributed to each of the selected kebeles using proportional allocation to sample size. Households were systematically selected depending on the total number of households required for each kebele by dividing the number of households in each kebele by the sample size. Each participant was randomly selected from each household. However, if there were no eligible subjects in the selected household, the next immediate neighbor’s household with eligible study subjects was included.
Study Variables
Dependent variable: Visual impairment.
Independent variables were sex, age, level of education, occupation, marital status, residence, and other relevant information related to visual impairment, such as eyeglasses, flashlight exposure, cigarette smoking, alcohol use, previous ophthalmic clinic visit, chronic comorbidity, history of eye trauma, family history of eye disease and history of eye disease.
Operational Definitions
Older adults: Participants aged 40 and above.
Presenting Visual Acuity: distance visual acuity without any correction in each eye.2
Normal vision: a presenting visual acuity > 6/18 in the better eye.2
VI: PVA less than 6/18 in the worst eye.2
Bilateral VI: visual acuity of <6/18 in the better eye.28
Bilateral Moderate VI: visual acuity of <6/18 and >6/60 in the better eye;28
Bilateral Severe VI: visual acuity <6/60 and >3/60 in the better eye.28
Bilateral Blindness: visual acuity <3/60 and NLP in the better eye.28
Unilateral VI: visual acuity is worse than 6/18 in one eye but better than or equal to 6/18 in the other eye.29
Monocular moderate VI: PVA <6/18 to ≤6/60 in one eye and 6/6 to ≤6/18 in the other eye.28
Monocular severe VI: PVA <6/60 to- ≤3/60 in one eye and 6/6 to 6/60 in the other eye.28
Monocular blindness: PVA <3/60 to NLP in one eye and PVA 6/6 to 3/60 in the other eye.28
Uncorrected refractive error: presenting visual acuity of less than 6/18 but improved to 6/18 or better with refraction.28
Cataract: Opacity of the crystalline lens in the pupillary area as observed with torchlight and loup.
Trachoma: characterized by instances with central corneal scarring and at least one of the entropion or trichiasis symptoms.18
Other causes of VI include all causes other than those mentioned above.
Eye trauma: self-reported past history of any eye injuries.
Eye checkup: If individuals underwent an eye examination at a healthcare establishment at least once in the previous 2 years.30
Ocular trauma: defined as physical and chemical damage to eye.
Ocular surgery: is surgery performed on the eye or its adnexa.
Family history of eye problems: Participants with a positive history of vision problems in their family members/near relatives (parents and grandparents).
Flashlight exposure: Occupational exposure to radiation reflected from metal welding.31,32
Substance use: Use of at least one substance (alcohol or cigarettes) in an individual’s lifetime.33
Current user: A person who consumed any substance at least once within the last 30 days.33
Ever use: Use of any substance at least once in an individual’s lifetime.33
Data Collection Procedure and Collection Instrument
Data were obtained using an interviewer-administered structured questionnaire and observational checklist developed in different studies. The questionnaire contained the following items: sociodemographic, behavioral, and environmental characteristics and previous medical history and comorbidities. The checklist contained an assessment of VI and clinical characteristics.
Data were collected using the Kobo toolbox (a free open-source tool for mobile data collection). Clinical examination was conducted using Snellen’s “E” optotype chart, pinhole, torch light, and a 2.5× magnifying loupe. The data collection teams included three optometrists, nine diploma-holding nurses, ophthalmologists, and four MSc/MPH holder supervisors. After getting written informed consent from the study individuals, optometrists measured the PVA using Snellen’s “E” optotype chart at 6 m for each eye separately. This measurement has a sensitivity of 0.73 and a specificity of 0.93 in previous studies.34 The procedure was conducted outdoors in the shade on both bright and sunny days. Adults with PVA of less than 6/18 in the worst eye underwent comprehensive eye examination by optometrists to determine the possible causes of VI.
Using a torch light and magnifying loupe, each eye was examined separately for in-turned lashes, the cornea was assessed for corneal opacities, and the lens was assessed for cataracts. An individual with PVA <6/18 and an improvement of PVA with pinholes were assessed as VI due to refractive error. If the participants wore spectacles, the pinhole was placed after letting them remove the spectacles.
The visually impaired participants who had undetermined eye problems were referred to an ophthalmologist for a detailed eye examination.
The causes of VI were recorded for each eye separately. If two potential causes of VI were provided, one for each eye, and the one that could be avoided or treated more easily was chosen.28 All participants with VI were linked to the Arba Minch General Hospital Ophthalmology Center for appropriate management and follow-up. Specifically, participants who developed cataracts were treated at Arba Minch General Hospital through mass-campaign-free cataract surgery.
Data Processing and Analysis
After checking the completeness and consistency of the data, it was entered into Excel and exported to SPSS version 25 for analysis. Descriptive statistics, frequency distributions, and percentages were calculated for categorical data and are shown using pie charts, bar graphs, and tables. Principal component analysis was performed to generate a wealth index.
Binary logistic regression was performed to identify candidate variables associated with visual impairment. In a multi-variant analysis, the variables with p<0.25 in the bivariate analysis were included and adjusted OR with 95% CI was computed. Variables with p<0.05 were considered significantly associated with visual impairment. The variance inflation factor (VIF) and tolerance test were checked for multicollinearity, with values ≥0.1 and <10, respectively, to control for confounders. Then, the Hosmer–Lemeshow goodness-of-fit test was performed to check for model fitness.
Data Quality Assurance
Data cleaning was performed to assess completeness, consistency, outliers, and missing values. Two days of training were provided to data collectors and supervisors on data collection tools, the purpose of the study, data collection skills, and ethical procedures. Pretests were performed on a 5% sample size from outside the study area, and necessary corrections were made. By taking 5% of the collected data randomly, the consistency was cross-checked. Any errors identified during the review were corrected accordingly by supervisors and investigators. Interobserver agreement among optometrists for distant visual acuity testing was determined, and Cohen’s kappa was found to be 0.95.
Results
Socio-Demographic Characteristics of the Participants
Of the respondents, 655 involved in the study, making a response rate of 100%. Of the respondents, 384 (58.63%) were male. The mean age of the participants was 58.81+0.34 (SD) and more than two-fifths (276; 42.114%) of them were in the age group between 60 and 69 years. The majority of them (555; 84.73% and 523; 79.85%) were married and had no formal education, respectively. Also, 417 (63.6%) of the participants were farmers. One-fifth of the respondents had the highest wealth indices (Table 1).
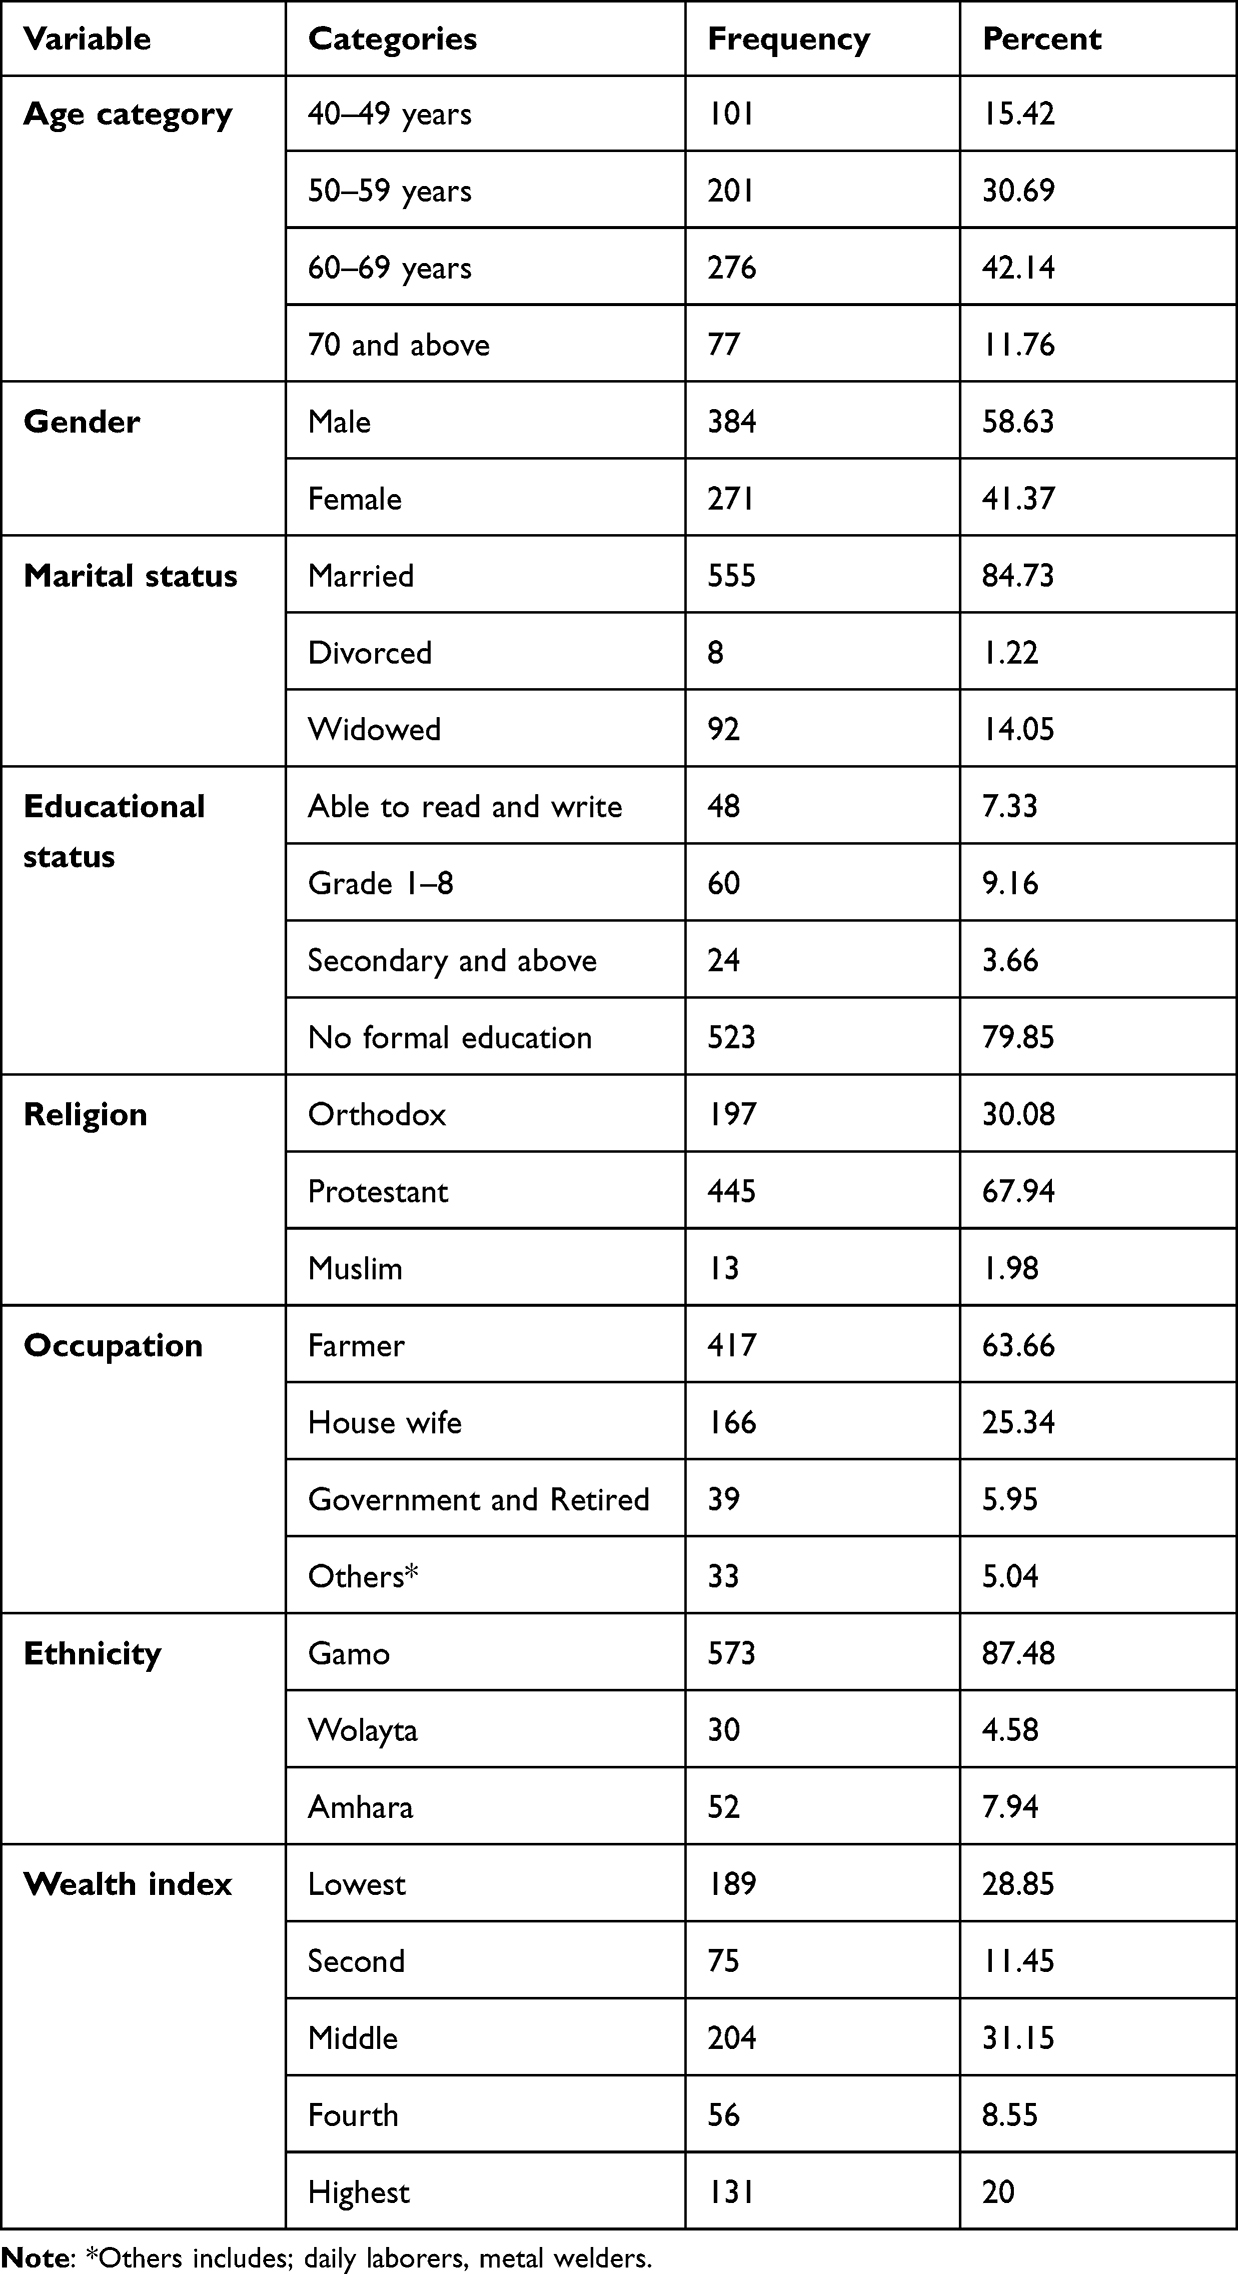 |
Table 1 Sociodemographic Characteristics of the Study Participants (n=655) in Southern Ethiopia, 2022 |
Previous Medical History and Comorbidities
One-eighth (82,12.52%) of the participants had a history of ocular problems. Among those with a history of ocular problems, 25 (30.48%) had a known history of cataracts. Twenty-five (3.82%) of the participants had a known history of hypertension (Table 2).
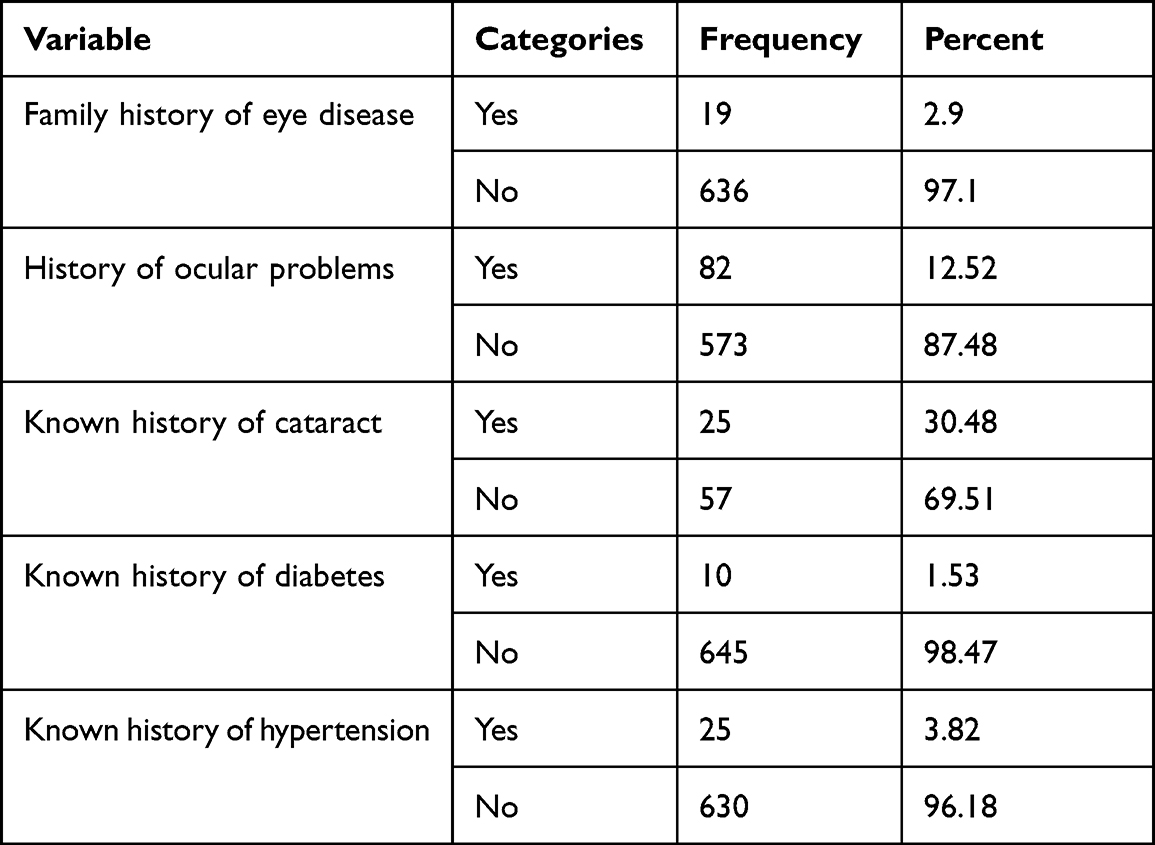 |
Table 2 Previous Medical History and Comorbidities of the Study Participants in Southern Ethiopia, 2022 |
Prevalence of Visual Impairment, Clinical Characteristics, and Possible Causes
The overall prevalence of visual impairment was found to be 36.95% (95% CI=33.2–40.8%). Among visually impaired participants, 151 (62.4%) and 91 (37.6%) had unilateral and bilateral visual impairment, respectively. Thirty-three (36.26%) and 60 (39.74%) had bilateral and unilateral severe visual impairments, respectively (Table 3).
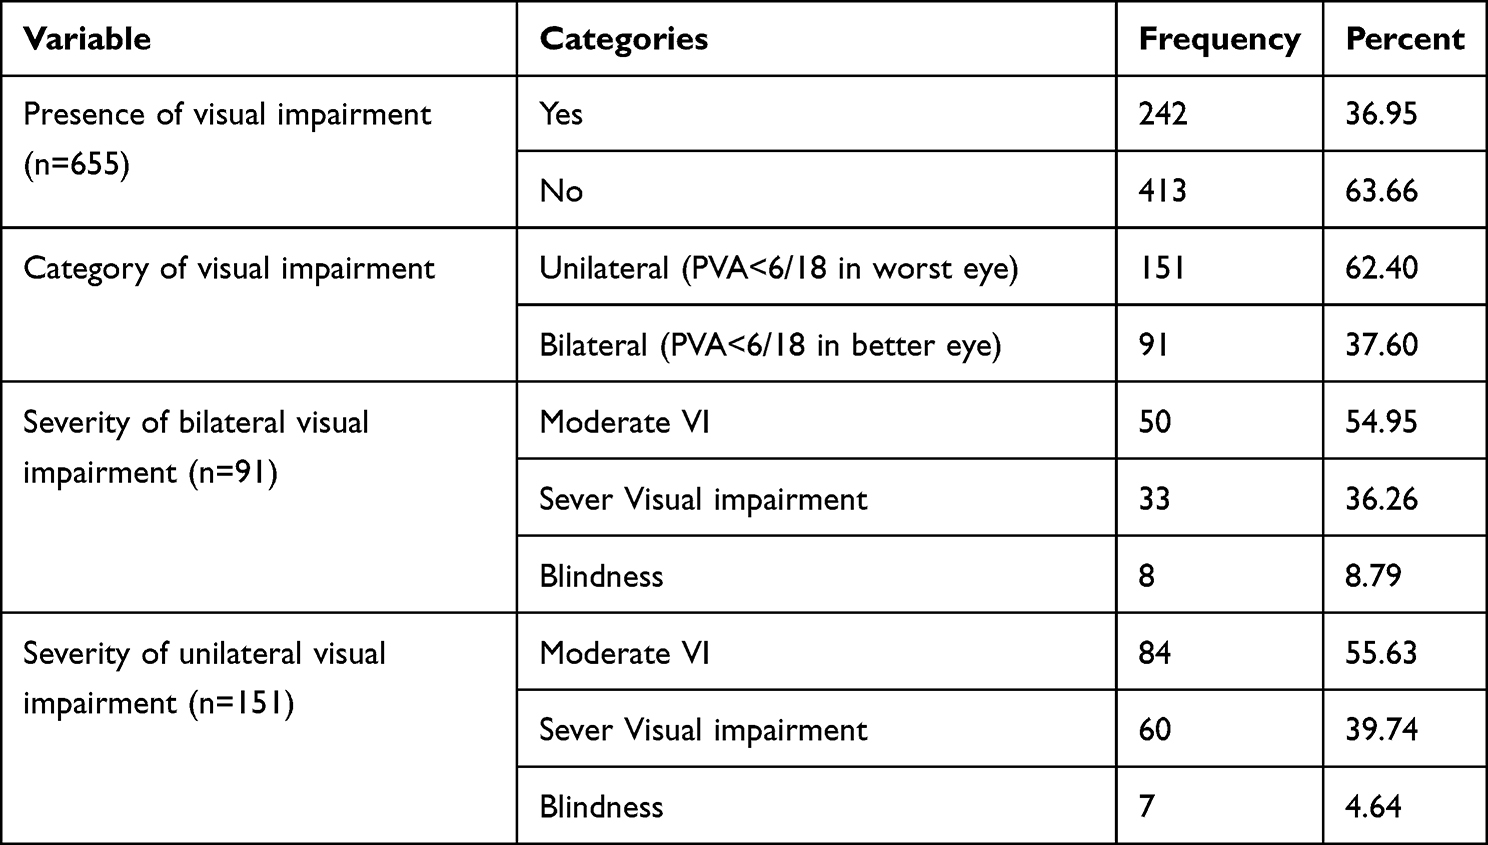 |
Table 3 Prevalence and Clinical Characteristics of Visual Impairment of the Study Participants, Southern Ethiopia, 2022 |
Among females who had VI, more than one-third (47/120, 38.5%) were in the age group between 60 and 69 years. Similarly, 54/122 (44.26%) of the males developed VI in a similar age category. Only 15% (18/120) and 15.57% (19/122) of females and males developed VI in the 40–49 age group, respectively (Figure 1).
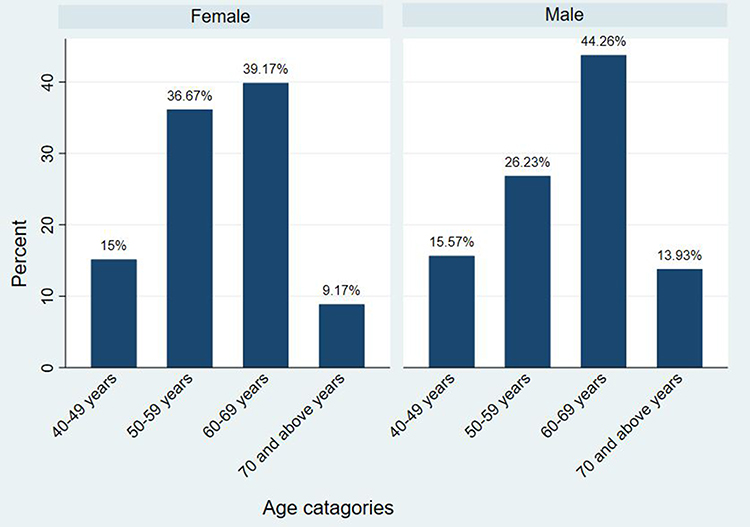 |
Figure 1 Prevalence of visual impairment by sex and age category of the study participants in Southern Ethiopia, 2022. |
The most common possible cause of visual impairment in this study was found to be refractive error (113, 46.69%), followed by unknown causes (59, 24.38%) and cataract (50, 20.6%) (Figure 2).
 |
Figure 2 Possible cause of visual impairment among older adults in Southern Ethiopia, 2022. |
Behavioral and Environmental Characteristics
About 131 (20%) of the participants had used a substance during their lifetime. Twenty-seven (4.12%) of the participants used prescribed eyeglasses. More than half of the study participants (14, 51.85%) utilized distant type eye glasses. About two-thirds (18, 66.67%) of the respondents had worn eye glasses for 1–5 years. Almost all (646, 98.63%) of the participants had no regular history of eye checkups. More than half (332, 50.69%) of the respondents had to walk more than 30 min to get water. In total, 588 (89.77%) of the participants were practicing throw-out method of garbage disposal (Table 4).
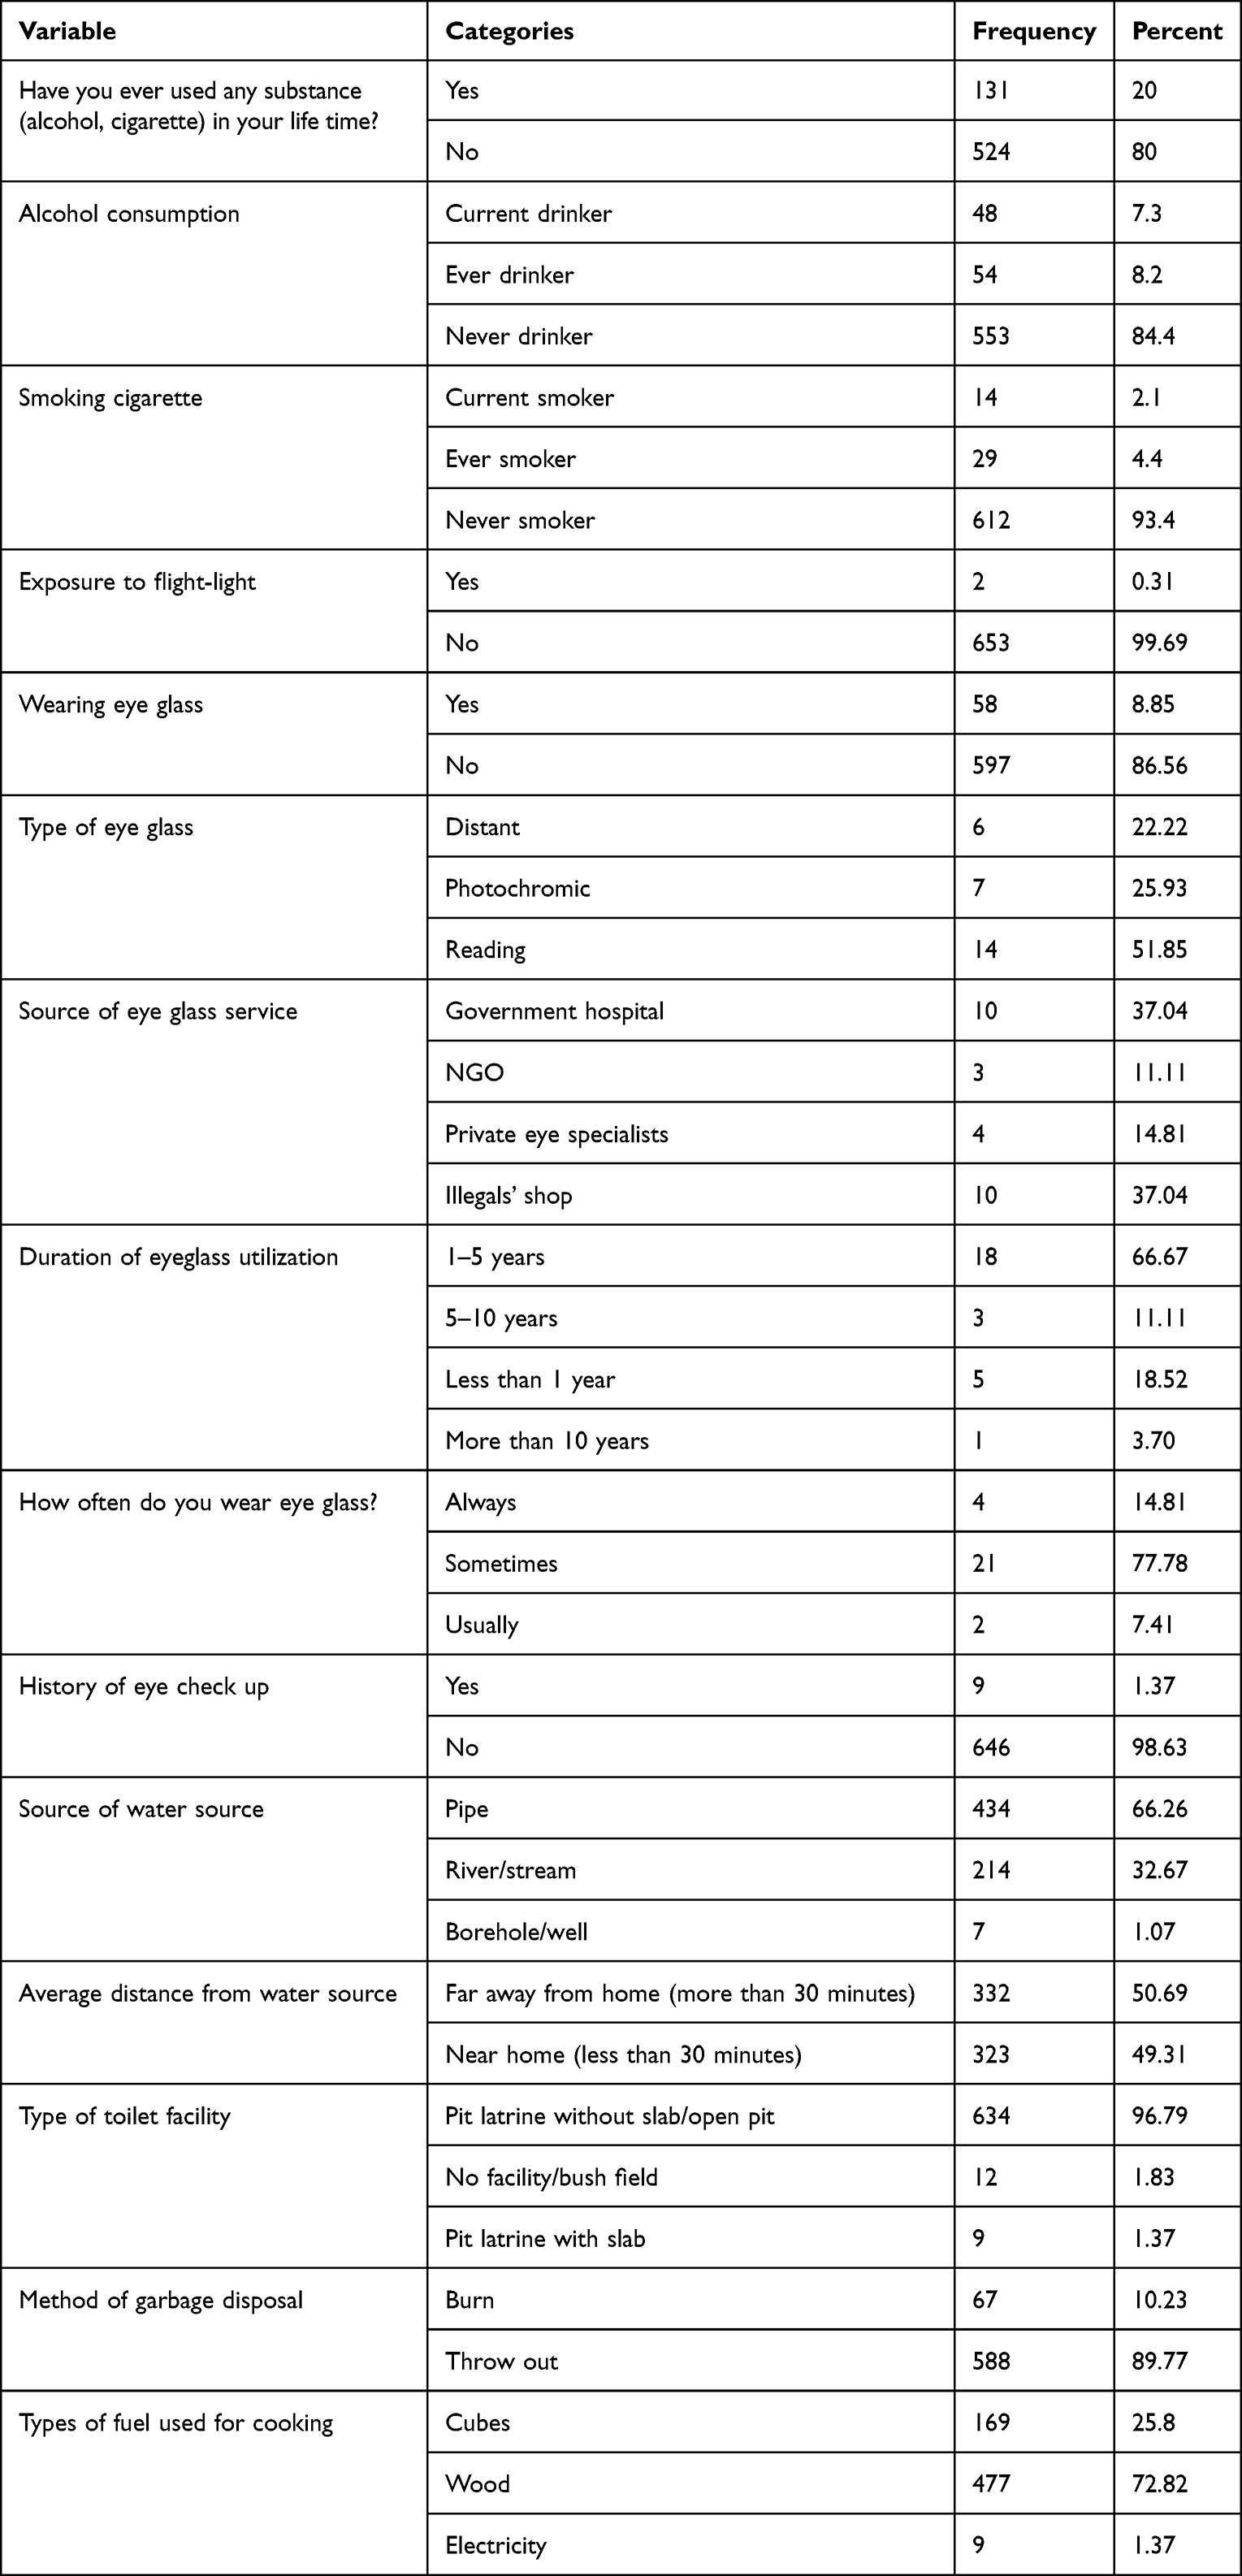 |
Table 4 Behavioral and Environmental Characteristics of the Study Participants in Southern Ethiopia, 2022 |
Factors Associated with Visual Impairment
Sex, age category, marital status, occupation, educational status, wealth index, substance use, a known history of hypertension, wearing eyeglasses, having regular eye checkups, and sources of water were found to be associated with visual impairment in bivariate analysis at p<0.25.
In the multivariate logistic regression analysis, age, marital status, occupation, educational status, wealth index, and wearing eyeglasses were significantly associated with visual impairment.
The odds of visual impairment were three times higher in adults aged 51–60 years and nine times higher in adults aged 61+ years (AOR=2.37, 95% CI=1.29–4.33; AOR=8.9, 95% CI=4.86–16.3), respectively, compared to adults aged 40–50 years. Those participants who were Farmers were 43% less likely to develop visual impairment than those who were government employees (AOR=0.57, 95% CI=0.38–0.86). The development of visual impairment among participants in lowest wealth index was more likely than those in the highest wealth index (AOR=1.81, 95% CI=1.14–3.2).
Participants who were divorced or widowed were nearly five times more likely to develop visual impairment than those who were married (AOR=4.67, 95% CI=2.77–7.86). The odds of developing visual impairment among respondents who had no formal education, were able to read and write, and had completed grades 1–8 were AOR=14.28 (95% CI=2.82–71.46), AOR=8.15 (95% CI=1.4–46.63), and AOR=6.95, 95% CI=0.287–37.6), compared to those who had secondary and above educational status, respectively. Visual impairment among participants who did not wear the prescribed eye glasses was four times more likely to have visual impairment than their counterparts (AOR=3.94, 95% CI=1.65–9.40) (Table 5).
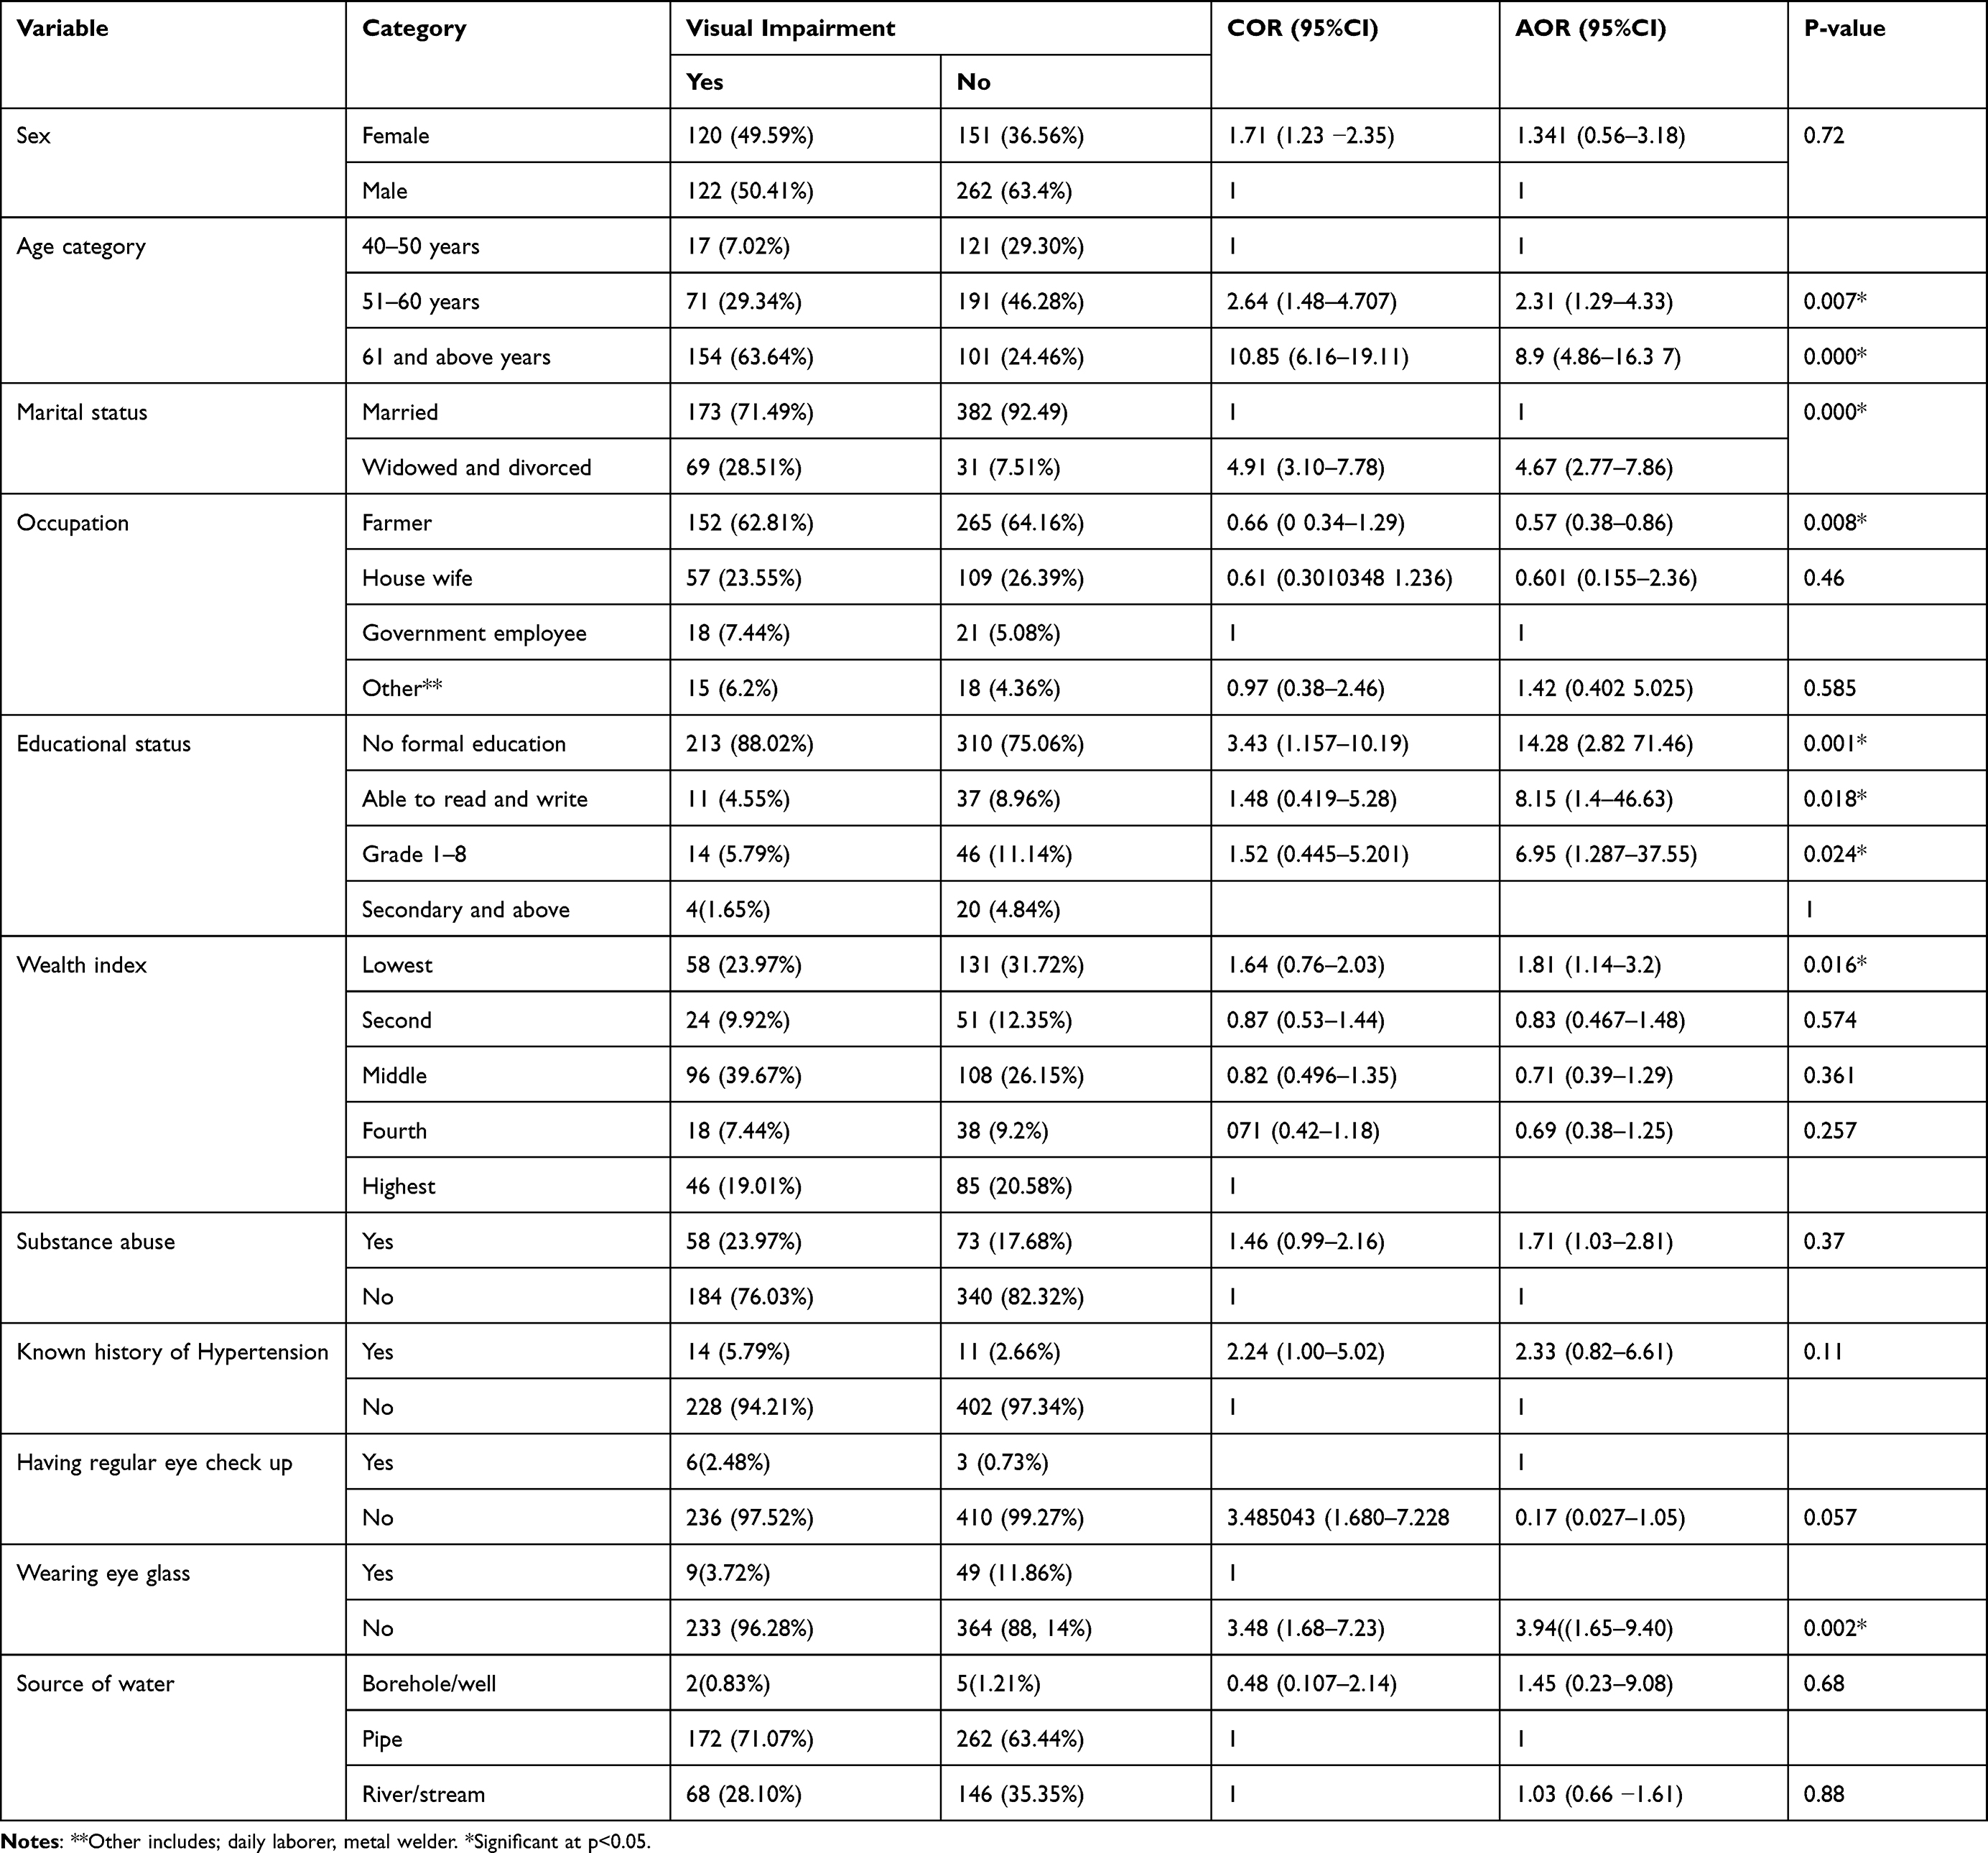 |
Table 5 Bivariate and Multivariate Logistic Regression for Factors Associated with Visual Impairment Among Older Adults in Southern Ethiopia, 2022 |
Discussion
This study was conducted to assess the prevalence and factors associated with VI among adults aged ≥40 years. To the best of our knowledge, this is the first study to assess VI among adults aged ≥40 years in Ethiopia.
The prevalence of visual impairment among adults aged 40 and above was found to be 36.95% (95% CI=33.2–40.8%). Among the overall prevalence of visually impaired participants, 151 (62.40%) and 91 (37.60%) had monocular and bilateral visual impairment, respectively.
The prevalence of visual impairment was higher than in studies conducted in Saudi Arabia (13.9%),10 South Korea (4.1%),35 India (8.4%),36 South Sudan (11.8%),37 South Africa (4.9%),38 Debre Berhan (16.8%)11 and Gondar, Ethiopia (15.3%).39 This discrepancy might be due to age differences: in the Saudi Arabia and Debre Berhan studiesthe participants were aged 18 years and above. As shown in this study, age was significantly associated with visual impairment. This difference could also be due to the study setting, for instance, the South Africa, Debre Berhan, and Debre Markos studies were conducted in urban areas, but the current study was conducted in rural areas. Rural dwellers are more likely to be exposed to visual impairment, which could be due to a lack of awareness of health-related issues and poor healthcare accessibility.23
In addition, the discrepancy might be due to the definition of visual impairment; for instance, the study in Debre Markos was conducted using better eye-presenting visual acuity, which means that it only considered bilateral visual impairment. This underestimates the prevalence of visual impairment compared to that in the present study, which considered the visual acuity of the worst eye (one eye). Studies conducted in Saudi Arabia and South Korea utilized best-corrected visual acuity, which underestimated the prevalence of VI as it excluded VI caused by refractive error. This discrepancy might also be due to differences in technological advancement, awareness, and health-care facilities.
The finding of this study is lower than the overall prevalence of studies conducted in China (49.7%) and Russia (64.7%).40 This difference could be due to the age difference of the study participants; in Russia, study participants were aged 85 years and above, and, in China, they were aged 70 and above, compared to 40 and above for the current study. In addition, the cutoff point for defining VI in both studies was <6/12. This might have overestimated the prevalence of VIs.
The prevalence of visual impairment in this study was in line with a study conducted in Debere Markos, Ethiopia (36.5%).23 This similarity might be due to the use of presenting visual acuity and a cutoff point of 6/18 for defining VI.
The odds of developing visual impairment among those aged 51–60 years and above 61 years were more likely to develop visual impairment than those aged 40–50 years. This finding is supported by previous studies in Saudi Arabia,10 South Africa,38 China,40 South Korea,35 Debere Markos,23 Debere Berhan11 and Gondar, Ethiopia (15.3%).39 A possible reason for the increased visual impairment in old age might be the increase in age-related eye diseases and degeneration.3,41 As age increases, the function of the entire body, including the visual system, becomes less efficient as a result of physiological deterioration as well as increased exposure to ocular infections due to deterioration of the eye structure, and people may suffer more eye diseases related to aging, such as macular degeneration, cataracts, and retinopathy, which leads to visual impairment.41 For instance, a study conducted in sub-Saharan Africa the proportion of total blindness due to age-related cataract ranged between 21% and 67%.42
Farmers were less likely to develop visual impairment than were government employees. A possible reason for this could be that government employees are more likely to utilize computers for their work-related activities for a longer time than farmers, this may cause computer vision syndrome. Computer vision syndrome is the leading occupational hazard,43 and it is a major public health problem and causes impaired visual abilities.44
Divorced and widowed participants were nearly five times more likely to develop visual impairments. This finding is consistent with the results of a study conducted in South Korea.35 A possible justification for this might be that divorced and widowed participants are less likely to be concerned about their health status and undergo regular health check-ups, as they might not have anyone who can consult or support them.
The odds of developing visual impairment among respondents who had no formal education, were able to read and write, and had completed grades 1–8 were more likely to develop visual impairment than those who had secondary or above educational status. Previous studies have reported similar findings.23,45,46 This is because those who are less educated are more likely to have poor health-seeking behavior and knowledge of risk factors for VI.
In this study, we did not find VI to be associated with self-reported history of hypertension and DM. A possible explanation is that we only assessed the presence or absence of DM and hypertension but did not examine their duration or severity. A study conducted in Taiwan showed that a disease duration >10 years for DM and hypertension was independently associated with VI.15
In contrast, respondents who did not wear prescribed eyeglasses were four times more likely to develop visual impairment than their counterparts. A possible explanation for this is that, as this study depicted, the leading cause of VI is refractive error, which needs to be corrected using eyeglasses. Besides, this study's findings showed that approximately 42.14% of the participants were aged between 60 and 69 years, which were vulnerable to acquire refractive error. The prevalence of refractive error increases with age.47
The odds of participants with a lower wealth index developing VI were higher than those with a higher wealth index. This finding is supported by those of previous studies.48,49 A possible justification is that low-income participants have poor access to health-care facilities; therefore, they are not treated early to restore their vision.
An Uncorrected Refractive Error is the leading cause of vision impairment. Despite the availability of cost-effective interventions in the form of spectacles, millions suffer from this worldwide.50 The current study showed that refractive error was the main cause of visual impairment. This finding is in line with those of previous studies in which cataract and refractive error were the common causes of visual impairment in the aged population.51 Another study in Saudi Arabia also showed that the main medical causes of visual impairment were refractive errors, followed by cataracts.10 This might be due to the improper utilization of prescribed spectacles and low cataract surgery service coverage in these areas.
According to the American Academy of Ophthalmology, comprehensive eye examination is recommended every 1–2 years for adults with risk factors for VI.30 In our study, only 1.37% of the participants had a history of eye checkups at least once in the past 2 years. In a study conducted in Hawassa, 23.8% of respondents had eye checkup examinations at least once within the past year.52 This difference may be because our study participants were from rural areas, which may have resulted in less accessibility to health facilities. Moreover, this difference might also be due to low incomes.
Strengths and Limitations of the Study
To the best of our knowledge, this study is the first in its kind in the area and utilized optometrist nurses as data collectors to obtain high-quality data. Nevertheless, the study is not without limitations. First, the diagnosis of possible causes of visual impairment was performed without ophthalmoscopy, which made us unable to assess some conditions.
Second, the assessment of near distance and visual field were not included in the definition of visual impairment, which might have underestimated the causes of VI like glaucoma, other optic atrophies, and uncorrected refractive error.
Third, given the cross-sectional nature of the study, our findings suggest an association between visual impairment and various factors but not a causative relationship.
Conclusion and Recommendations
In this cross-sectional study, the prevalence of visual impairment among older adults was relatively high, and more than three-fifths of participants had unilateral visual impairment. Age, marital status, occupation, educational status, wealth index, and wearing of prescribed eyeglasses were significantly associated with visual impairment. Refractive error was the leading cause of visual impairment. Enhancing the health-seeking behavior of the participants for the utilization of eye care services should focus on the health status of low economic status, low educational status, and the aged population. Awareness of spectacle use and increasing cataract surgery coverage are urgently needed. Further studies are recommended to assess the coverage of cataract surgery, spectacle utilization, and visual-related quality-of-life in individuals with visual impairment.
Data Availability
The corresponding author will provide the datasets used and/or analyzed during the current work upon reasonable request.
Ethical Approval and Consent to Participate
Ethical approval was obtained from the Arba Minch University Institutional Ethical Review Board (IRB/1221/2021). A letter of permission to undertake the study was secured from the Gamo Zone Health Department, respective woredas, and kebeles. Written consent was obtained from all the selected households and individual participants. Individuals with VI were referred to an ophthalmologist at the Arba Minch General Hospital for detailed eye examination. Individuals who had confirmed cases of cataracts were treated at the Arba Minch General Hospital during a free cataract surgery campaign held in February 2022. This study was conducted in accordance with the Declaration of Helsinki. COVID-19 preventive measures were ensured during the data collection. Confidentiality of participants’ information was secured.
Acknowledgments
We would like to extend our gratitude to Arba Minch University, College of Medicine and Health Science, for funding this research. We express our sincere gratitude to our data collectors and supervisors. Lastly, we would like to thank Mrs. Selam, Head of ORBIS International Ethiopia, Arba Minch branch, who helped us by providing data collection tools such as Loups, pinhole, and E-Snellen charts.
Author Contributions
All authors made a significant contribution to the research work, including in the conception and study design. Execution, data gathering, analysis, and interpretation. Moreover, all authors gave final approval for the version to be published; have agreed on the journal to which the article has been submitted; and agree to be accountable for all aspects of the work.
Funding
There is no funding to report.
Disclosure
The authors declare that they have no competing interests.
References
1. Pascolini D, Mariotti SP. Global estimates of visual impairment: 2010. Br J Ophthalmol. 2012;96(5):614–618. doi:10.1136/bjophthalmol-2011-300539
2. World Health Organization. ICD update and revision platform: change the definition of blindness; 2010. Avaliable from: https://www.who.int/blindness/Change%20the%%20Definition%of%Blindness.
3. Leitman MW. Manual for Eye Examination and Diagnosis. John Wiley & Sons; 2021.
4. Frick KD, Foster A. The magnitude and cost of global blindness: an increasing problem that can be alleviated. Am J Ophthalmol. 2003;135(4):471–476. doi:10.1016/S0002-9394(02)02110-4
5. World Health Organization. Facts about Blindness and Visual Impairment; 2013. Avaliable from: https://www.who.int/news-room/fact-sheets/detail/blindness-and-visual-impairment.
6. Harrabi H, Aubin M-J, Zunzunegui MV, Haddad S, Freeman EE, Zheng Y. Visual difficulty and employment status in the world. PloS one. 2014;9(2):e88306. doi:10.1371/journal.pone.0088306
7. World Health Organization. Eye care, vision impairment and blindness; 2023. Available from: https://www.who.int/health-topics/blindness-and-vision-loss#tab=tab_1.
8. Resnikoff S, Pascolini D, Etya’Ale D, et al. Global data on visual impairment in the year 2002. Bulletin of the World Health Organization. 2004;82(11):844–851.
9. Bourne R, Steinmetz JD, Flaxman S, et al. Trends in prevalence of blindness and distance and near vision impairment over 30 years: an analysis for the Global Burden of Disease Study. Lancet Glob Health. 2021;9(2):e130–e143. doi:10.1016/S2214-109X(20)30425-3
10. Al-Shaaln FF, Bakrman MA, Ibrahim AM, Aljoudi AS. Prevalence and causes of visual impairment among Saudi adults attending primary health care centers in northern Saudi Arabia. Ann Saudi Med. 2011;31(5):473–480. doi:10.4103/0256-4947.84624
11. Assefa NL, Admas AW, Adimasu NF. Prevalence and associated factors of visual impairment among adults at Debre Berhan town, North Shewa, Ethiopia. BMC Ophthalmol. 2020;20(1):1–8. doi:10.1186/s12886-020-01586-8
12. Guo C, Wang Z, He P, Chen G, Zheng X. Prevalence, causes and social factors of visual impairment among Chinese adults: based on a national survey. Int J Environ Res Public Health. 2017;14(9):1034. doi:10.3390/ijerph14091034
13. Nuertey BD, Amissah-Arthur KN, Addai J, et al. Prevalence, causes, and factors associated with visual impairment and blindness among registered pensioners in Ghana. J Ophthalmol. 2019;2019:1–10. doi:10.1155/2019/1717464
14. Flaxman SR, Bourne RR, Resnikoff S, et al. Global causes of blindness and distance vision impairment 1990–2020: a systematic review and meta-analysis. Lancet Glob Health. 2017;5(12):e1221–e34. doi:10.1016/S2214-109X(17)30393-5
15. Wang W-L, Chen N, Sheu -M-M, Wang J-H, Hsu W-L, Hu Y-J. The prevalence and risk factors of visual impairment among the elderly in Eastern Taiwan. Kaohsiung J Med Sci. 2016;32(9):475–481. doi:10.1016/j.kjms.2016.07.009
16. Chong EW, Lamoureux EL, Jenkins MA, Aung T, Saw S-M, Wong TY. Sociodemographic, lifestyle, and medical risk factors for visual impairment in an urban asian population: the Singapore Malay eye study. Archives of Ophthalmology. 2009;127(12):1640–1647. doi:10.1001/archophthalmol.2009.298
17. Marmamula S, Narsaiah S, Shekhar K, Khanna RC, Rao GN, Wedrich A. Visual impairment in the south Indian state of Andhra Pradesh: andhra Pradesh - rapid assessment of visual impairment (AP-RAVI) project. PLoS One. 2013;8(7):e70120. doi:10.1371/journal.pone.0070120
18. Gupta N, Vashist P, Malhotra S, Senjam SS, Misra V, Bhardwaj A. Rapid assessment of visual impairment in urban population of Delhi, India. PLoS One. 2015;10(4):e0124206. doi:10.1371/journal.pone.0124206
19. Boadi-Kusi SB, Hansraj R, Mashige KP, Osafo-Kwaako A, Ilechie AA, Abokyi S. Prevalence and causes of visual impairment and blindness among cocoa farmers in Ghana. Ophthalmic Epidemiol. 2017;24(1):17–23. doi:10.1080/09286586.2016.1254805
20. Mousa A, Courtright P, Kazanjian A, Bassett K. Prevalence of low vision and blindness in upper Egypt. Ophthalmic Epidemiol. 2014;21(3):190–196. doi:10.3109/09286586.2014.906629
21. Bezabih L, Abebe TW, Fite RO. Prevalence and factors associated with childhood visual impairment in Ethiopia. Clin Ophthalmol. 2017;11:1941. doi:10.2147/OPTH.S135011
22. Merrie YA, Tegegne MM, Munaw MB, Alemu HW. Prevalence and associated factors of visual impairment among school-age children in Bahir Dar City, Northwest Ethiopia. Clin Optom. 2019;11:135. doi:10.2147/OPTO.S213047
23. Abebe H, Wagnew F, Zeleke H, Tefera B, Tesfa S, Fetene T. Magnitude of visual impairment and associated factors among patients attending ophthalmic clinics of Debre Markos referral hospital, north West Ethiopia. BMC Ophthalmol. 2021;21(1):1–10. doi:10.1186/s12886-021-01863-0
24. Cherinet FM, Tekalign SY, Anbesse DH, Bizuneh ZY. Prevalence and associated factors of low vision and blindness among patients attending St. Paul’s hospital millennium medical college, Addis Ababa, Ethiopia. BMC Ophthalmol. 2018;18(1):1–6. doi:10.1186/s12886-018-0899-7
25. Berhane Y, Worku A, Bejiga A, et al. Prevalence and causes of blindness and low vision in Ethiopia. Ethiop J Health Dev. 2007;21(3):204–210.
26. Köberlein J, Beifus K, Schaffert C, Finger RP. The economic burden of visual impairment and blindness: a systematic review. BMJ open. 2013;3(11):e003471. doi:10.1136/bmjopen-2013-003471
27. Mehari ZA. A study of ocular morbidity of patients attending ophthalmic outreach services in rural Ethiopia. Int J Med Med Sci. 2013;3(4):450–454.
28. Malhotra S, Vashist P, Kalaivani M, et al. Prevalence and causes of visual impairment amongst older adults in a rural area of North India: a cross-sectional study. BMJ open. 2018;8(3):e018894. doi:10.1136/bmjopen-2017-018894
29. Marmamula S, Khanna RC, Rao GN. Unilateral visual impairment in rural south India–Andhra Pradesh Eye Disease Study (APEDS). Int J Ophthalmol. 2016;9(5):763. doi:10.18240/ijo.2016.05.23
30. Pulido JS, Flaxel CJ, Adelman RA, Hyman L, Folk JC, Olsen TW. Comprehensive adult medical eye evaluation. Ophthalmology. 2016;123(1):P209–P36. doi:10.1016/j.ophtha.2015.10.047
31. Kıvanç SA, Akova Budak B, Skrijelj E, et al.. Demographic characteristics and clinical outcome of work-related open globe injuries in the most industrialised region of Turkey. Turk J Ophthalmol. 2017;47(1):18. pmid:28182158. doi:10.4274/tjo.81598
32. Cajochen C. Evening exposure to a light-emitting diodes (LED)-backlit computer screen affects circadian physiology and cognitive performance. J Appl Physiol. 2011;110(5):1432–1438. pmid:21415172. doi:10.1152/japplphysiol.00165.2011
33. Getnet M, Akalu Y, Dagnew B, et al. Visual impairment and its associated factors among medical and health sciences students at the University of Gondar, Northwest Ethiopia. PLoS one. 2021;16(8):e0255369. doi:10.1371/journal.pone.0255369
34. Bertuzzi F, Orsoni JG, Porta MR, Paliaga GP, Miglior S. Sensitivity and specificity of a visual acuity screening protocol performed with the Lea Symbols 15‐line folding distance chart in preschool children. Acta Ophthalmologica Scandinavica. 2006;84(6):807–811. doi:10.1111/j.1600-0420.2006.00668.x
35. Rim TH, Nam JS, Choi M, Lee SC, Lee CS. Prevalence and risk factors of visual impairment and blindness in K Orea: the F ourth K Orea N ational H ealth and N utrition E xamination S urvey in 2008–2010. Acta ophthalmologica. 2014;92(4):e317–e25. doi:10.1111/aos.12355
36. Mactaggart I, Polack S, Murthy G, Kuper H. A population-based survey of visual impairment and its correlates in Mahabubnagar district, Telangana State, India. Ophthal Epidemiol. 2018;25(3):238–245. doi:10.1080/09286586.2017.1418386
37. Ngondi J, Ole-Sempele F, Onsarigo A, et al. Prevalence and causes of blindness and low vision in southern Sudan. PLoS Med. 2006;3(12):e477. doi:10.1371/journal.pmed.0030477
38. Cockburn N, Steven D, Lecuona K, et al. Prevalence, causes and socio-economic determinants of vision loss in Cape Town, South Africa. PloS one. 2012;7(2):e30718. doi:10.1371/journal.pone.0030718
39. Woretaw H, Shiferaw D. Prevalence and associated factors of visual impairment and blindness at university of Gondar teaching hospital, Gondar, northwest Ethiopia. IntJPharm Hcare. 2015;3(02):48–54.
40. Bikbov MM, Kazakbaeva GM, Rakhimova EM, et al. Prevalence factors associated with vision impairment and blindness among individuals 85 years and older in Russia. JAMA Network Open. 2021;4(8):e2121138. doi:10.1001/jamanetworkopen.2021.21138
41. Klein R, Klein BE. The prevalence of age-related eye diseases and visual impairment in aging: current estimates. Invest Ophthalmol Visual Sci. 2013;54:14.
42. Bastawrous A, Dean WH, Sherwin JC. Blindness and visual impairment due to age-related cataract in sub-Saharan Africa: a systematic review of recent population-based studies. Br J Ophthalmol. 2013;97(10):1237–1243. doi:10.1136/bjophthalmol-2013-303135
43. Charpe NA, Kaushik V. Computer vision syndrome (CVS): recognition and control in software professionals. J Human Ecol. 2009;28(1):67–69. doi:10.1080/09709274.2009.11906219
44. Wimalasundera S. Computer vision syndrome. Galle Med J. 2009;11(1):25. doi:10.4038/gmj.v11i1.1115
45. Iwano M, Nomura H, Ando F, Niino N, Miyake Y, Shimokata H. Visual acuity in a community-dwelling Japanese population and factors associated with visual impairment. Jpn J Ophthalmol. 2004;48(1):37–43. doi:10.1007/s10384-003-0013-3
46. Shen H, Zhang H, Gong W, et al. Prevalence, causes, and factors associated with visual impairment in a Chinese elderly population: the Rugao Longevity and Aging Study. Clin Interventions Aging. 2021;Volume 16:985–996. doi:10.2147/CIA.S304730
47. Fricke TR, Tahhan N, Resnikoff S, et al. Global prevalence of presbyopia and vision impairment from uncorrected presbyopia: systematic review, meta-analysis, and modelling. Ophthalmology. 2018;125(10):1492–1499. doi:10.1016/j.ophtha.2018.04.013
48. Freeman EE, Aljied R, Buhrmann R, Sabeti S, Aubin M-J. The prevalence and determinants of visual impairment in Canada: Cross-sectional data from the Canadian Longitudinal Study on Aging. Invest Ophthalmol Visual Sci. 2018;59(9):4099.
49. Jolley E, Buttan S, Engels T, et al. Prevalence of visual impairment and coverage of cataract surgical services: associations with sex, disability, and economic status in five diverse sites. Ophthal Epidemiol. 2020;27(6):429–437. doi:10.1080/09286586.2020.1768553
50. Bourne RR, Flaxman SR, Braithwaite T, et al. Magnitude, temporal trends, and projections of the global prevalence of blindness and distance and near vision impairment: a systematic review and meta-analysis. Lancet Glob Health. 2017;5(9):e888–e97. doi:10.1016/S2214-109X(17)30293-0
51. Wong PW-F, Lau JK-P, Choy BN-K, et al. Sociodemographic, behavioral, and medical risk factors associated with visual impairment among older adults: a community-based pilot survey in Southern District of Hong Kong. BMC Ophthalmol. 2020;20(1):1–12. doi:10.1186/s12886-020-01644-1
52. Morka ED, Yibekal BT, Tegegne MM, Zunzunegui MV. Eye care service utilization and associated factors among older adults in Hawassa city, South Ethiopia. PLoS One. 2020;15(4):e0231616. doi:10.1371/journal.pone.0231616
 © 2024 The Author(s). This work is published and licensed by Dove Medical Press Limited. The full terms of this license are available at https://www.dovepress.com/terms.php and incorporate the Creative Commons Attribution - Non Commercial (unported, v3.0) License.
By accessing the work you hereby accept the Terms. Non-commercial uses of the work are permitted without any further permission from Dove Medical Press Limited, provided the work is properly attributed. For permission for commercial use of this work, please see paragraphs 4.2 and 5 of our Terms.
© 2024 The Author(s). This work is published and licensed by Dove Medical Press Limited. The full terms of this license are available at https://www.dovepress.com/terms.php and incorporate the Creative Commons Attribution - Non Commercial (unported, v3.0) License.
By accessing the work you hereby accept the Terms. Non-commercial uses of the work are permitted without any further permission from Dove Medical Press Limited, provided the work is properly attributed. For permission for commercial use of this work, please see paragraphs 4.2 and 5 of our Terms.