")
Back to Journals » Integrated Blood Pressure Control » Volume 17
Prevalence of Risk Factors for Hypertension Among Faculty at an Urban University in Uganda
Authors Alinaitwe B , Amanya C, Muwanguzi PA , Ngabirano TD
Received 28 September 2023
Accepted for publication 23 December 2023
Published 4 January 2024 Volume 2024:17 Pages 1—11
DOI https://doi.org/10.2147/IBPC.S440972
Checked for plagiarism Yes
Review by Single anonymous peer review
Peer reviewer comments 2
Editor who approved publication: Dr Konstantinos Tziomalos
Businge Alinaitwe,1,2 Charles Amanya,1,3 Patience A Muwanguzi,1 Tom Denis Ngabirano1
1Department of Nursing, College of Health Sciences, Makerere University, Kampala, Uganda; 2School of Nursing, Mount Kenya University, Thika, Kenya; 3Department of Research, Hoima Regional Referral Hospital, Hoima, Uganda
Correspondence: Tom Denis Ngabirano, Department of Nursing, College of Health Sciences, Makerere University, P.O. Box 7072, Kampala, Uganda, Tel +256 772594720, Email [email protected]
Purpose: Hypertension is a major contributor to morbidity and mortality worldwide. Many people however are not aware of their possession of risk factors for hypertension. There is a paucity of literature in Uganda describing the risk profile of faculty at public universities. The purpose of this study was to determine the prevalence of hypertension risk factors among university teaching staff.
Methods: This study was conducted among faculty at Makerere University in Uganda. The modified World Health Organization STEP-wise approach for non-communicable disease surveillance was used in data collection. Hypertension was defined as having a systolic blood pressure of ≥ 140mmHg and/or a diastolic blood pressure of ≥ 90mmHg, or being on antihypertensive medications. Participants were enrolled from the faculty lists by proportionate to size systematic sampling until the sample size for each college was obtained. Data was collected from January to March 2018. Multivariate logistic regression was used to determine factors associated with hypertension.
Results: A total of 141 participants were recruited into the study. The prevalent risk factors for hypertension include physical inactivity (78.7%), overweight (46.8%), obesity (20.6%), addition of extra salt to food (46.8%), current alcohol consumption (33.3%), history of smoking (10.6%), inadequate fruit and vegetable servings per day (100%), family history of hypertension (40.4%) and a family history of diabetes (22.7%). Hypertension was prevalent at 26.2% (95% CI 18.94– 33.46%). The risk factors significantly associated with hypertension included a family history of hypertension (p=0.009), obesity (p=0.008) and male gender (p = 0.029).
Conclusion: The prevalence of known hypertension risk factors among university teaching staff in urban Uganda is high. Majority of these risk factors are modifiable highlighting the need for continuous screening as well as introduction of prevention and health promotion strategies to reduce the risk burden.
Keywords: hypertension risk profile, university faculty, urban Uganda, modifiable factors, risk burden
Two Letters to the Editor have been received and published for this article
Introduction
Hypertension is a disease of public health concern as a major contributor to increased global disease burden1 and mortality, resulting in over 7.8 million deaths globally.1 Hypertension affects more than a billion people worldwide with the burden greatly higher in low- and middle-income countries than in high-income countries.2
Sub-Saharan Africa is projected to have over 150 million people with hypertension by the year 2025,3 and the prevalence of hypertension in Uganda has been estimated to be between 26.4%4 and 31.5%.5 Worryingly, even though the condition is highly prevalent, a significant number of individuals are not aware that they are hypertensive, reinforcing the notion of the disease being a silent killer.6
It is a huge challenge as individuals may not be aware of their possession of risk factors for hypertension. For instance, although the knowledge of risk factors for hypertension can be low among teaching staff of universities,7 the prevalence of such risk factors can be overwhelmingly high depending on an individual’s occupation. A study in Nigeria found physical inactivity, obesity, smoking, and alcohol consumption highly prevalent among university employees.8
In Ethiopia, it was found that whereas 14.4% of university employees have hypertension, 31.4% have general obesity and 37% have truncal obesity.9 Another study conducted among staff of a tertiary teaching institution in Nigeria indicated that over one half of university staff are overweight with obesity prevalent at 23.5%.10
Whereas there are many reasons to explain the surge in hypertension, factors such as high body mass indices and obesity have been associated with increased risk for adverse cardiovascular events and decreased cardiac functioning.11 In Western Uganda and West Africa, a sedentary lifestyle is one of the risk factors for developing hypertension12,13 and it has been identified as a precursor for modifiable risk factors such as overweight and obesity.14
Lifestyle choices such as excessive dietary sodium consumption, inadequate physical exercise, low dietary composition of fruits and vegetables, as well as smoking and excessive alcohol consumption9,15–17 are factors that if identified early enough, can be acted upon through secondary prevention to reduce the risk of either developing hypertension or promoting optimal control of blood pressures among hypertensive patients.
Office workers such as teaching staff have been found to spend most of their time in a sedentary mode with minimal engagement in physical exercise.18 University teaching staff are likely to spend a great deal of time in their offices and given that most of them use vehicles to move to places, the result is inactivity, which, when combined with other factors, can significantly increase lecturers’ susceptibility to various hypertension risks.
To the best of our knowledge, no study has been conducted in any of the universities in Uganda to assess the risk profile for hypertension. As Uganda steps up the fight against non-communicable diseases (NCDs), it is important to target segments of the population and determine their risk burden for hypertension and guide targeted interventions. It is upon this background that this study was conceived to determine the burden of risk factors for developing hypertension among teaching staff at a university.
Materials and Methods
Study Design, Setting, and Study Population
This was a cross-sectional study with a quantitative approach to data collection. The study was conducted at Makerere University in Kampala Uganda, among faculty from different academic units/colleges. Makerere University is composed of 10 colleges which serve as academic administrative units with over 40,000 students and a total of about 1450 teaching staff. Five colleges out of ten were selected for inclusion in the study including; College of Health Sciences (CHS), College of Natural Sciences (CONAS), College of Computing and Information Sciences (COCIS), College of Veterinary Medicine and Animal Biodiversity (COVAB) as well as college of Education and External Studies (CEES). The study population comprised a range of different academic positions from the lowest rank of teaching assistants to the highest rank of professor.
Sampling Procedure
By simple random sampling, one-half of the academic administrative units (5 colleges) were selected out of ten colleges to form the study sites. To recruit participants from each college, proportionate to size systematic sampling was used. A list of teaching staff from each college was obtained from the principals’ offices. The names were then arranged in alphabetical order. The sampling interval was 4 and was determined by dividing the total number of teaching staff in each college by the number of lecturers to be recruited from that college. To determine the starting point on each list, the first four names on each list were written on four uniform pieces of paper and folded. One paper was picked randomly and the name on it was the starting point of sampling from that list and then every fourth participant from the starting point was enrolled until the required number of participants in that particular college was obtained.
Data Collection Tool and Procedures
Data were collected from the participants’ office of work using a semi-structured self-administered paper-based questionnaire. The questionnaires were in English language. The information collected included participants’ socio-demographic features, lifestyle characteristics, and bio-physical characteristics using a modified STEP-wise approach for NCD surveillance by WHO.19 The first two steps of the approach were adopted in this study.
In step one of data collection, information was collected on demographics to include age gender, and marital status. Behavioral characteristics included alcohol consumption, smoking, diet, and level of physical activity. As part of step one, we also collected self-reported information on family health history, a history of raised blood pressure, and a previous diagnosis of diabetes.
In step two, objective data were collected by measuring the participant’s blood pressure in millimeters of mercury (mmHg), body weight in kilograms (kg), and body height in centimeters (cm). Blood pressure was measured twice with a five-minute interval between the two measurements using a Welch Allyn-type digital sphygmomanometer. The average of the two measurements was used to classify individuals as either normal (those with a blood pressure of <140/90mmHg) or hypertensive (a systolic blood pressure of ≥140mmHg and/or a diastolic blood pressure of ≥90mmHg) and this was guided by the International Society of Hypertension, Global Hypertension Practice Guidelines20 Participants who reported being on antihypertensive treatment regardless of their level of blood pressure were also considered hypertensive. Body weight was measured using a calibrated seca type of weighing scale, and body height was measured using a calibrated and researcher-operated adjustable stadiometer. Weight and height were used to compute body mass indices, and these were used to classify the participants as either underweight (<18.5 kg/m2), normal weight (18.5–<25kg/m2), overweight 25kg/m2–29.9kg/m2) or obese (≥30kg/m2).
Data Management and Analysis Procedures
Data collected were checked for completeness on each data collection day before leaving the participant’s office. Data were entered into SPSS version 22 for analysis. Double entries were done on 10% of the data to check for accuracy and completeness. Following data cleaning, data transformations, and computations were made to generate groups using specified cut-offs. Body mass index (BMI) was computed by dividing weight in Kg by height in square meters. The generated BMI was then categorized as underweight (<18.5 kg/m2), normal (18.5 kg/m2-<25kg/m2), overweight 25kg/m2–29.9kg/m2), and obese (≥30kg/m2). Blood pressure was categorized as normal (<140/90mmHg) or high (≥140/90mmHg). We followed the WHO guidelines to categorize lifestyle and bio-physical characteristics that were elicited from the STEP-wise approach for NCD surveillance.19
Analyses were then conducted to generate descriptive statistics; frequencies, percentages, mean, median, and standard deviation. The prevalence of risk factors for hypertension was presented using frequencies and percentages. We conducted the bivariate analysis using binary logistic regression to analyze the factors associated with hypertension. We considered variables with p-values ≤0.2 in the multivariate logistic regression. All variables with a p-value ≤0.05 were considered to be significantly associated with hypertension.
Ethical Considerations
Ethical approval was sought and obtained from the Makerere University School of Health Sciences Research and Ethics Committee, approval number SHS REC: 2017-062. We sought administrative clearance from the college principals and head of departments. The research team informed the participants about the study and written informed consent was obtained from each participant. The confidentiality of each participant’s information was ensured as the participants’ names did not appear anywhere on the data collection tool. The information collected was only accessible to the research team for the purpose of answering the research questions.
Results
Participant Characteristics
Of the 190-teaching staff that were approached, 141 accepted to participate in the study (a response rate of 74.2%). From all five selected colleges, 43 (30.5%) participants were from the College of Health Sciences, 23(16.3%) from the College of Veterinary Medicine and Animal Biodiversity, 26(18.4%) from the College of Natural Sciences, 28(19.9%) from the College of Computing and Information Sciences, and 21(14.9%) from the College of Education and External Studies. The minimum age was 24 years, and the maximum was 73 years with a mean age of 43.29 years (SD± 8.5) and a median of 42 years. A larger proportion of the study participants 84(59.6%) were males, and most were married 125(88.7%). About three in four 103(73.0%) of the teaching staff usually use a personal vehicle to travel to and from work and other places. Almost all 134 (95%) reported to have ever been screened for hypertension.
Prevalence of Risk Factors for Hypertension
Almost one in four 27(19.1%) of the participants never engage in any form of physical exercise and based on the time of engagement in vigorous physical exercise, most of the participants are physically inactive 111(78.7%). With almost half (46.8%) of the participants being overweighed, one in four (20.6%) were found to be obese. A considerable number of participants (46.8%) add raw salt to food after serving. More than one-half 92(65.2%) have ever consumed alcohol and about one-half 47(51.1%) of those who have ever consumed alcohol are currently drinking alcohol. Although teaching staff eat a variety of fruits including bananas, mangoes, avocados, and watermelon, all the participants (100%) eat less than the recommended (five) fruit and vegetable servings per day (Table 1).
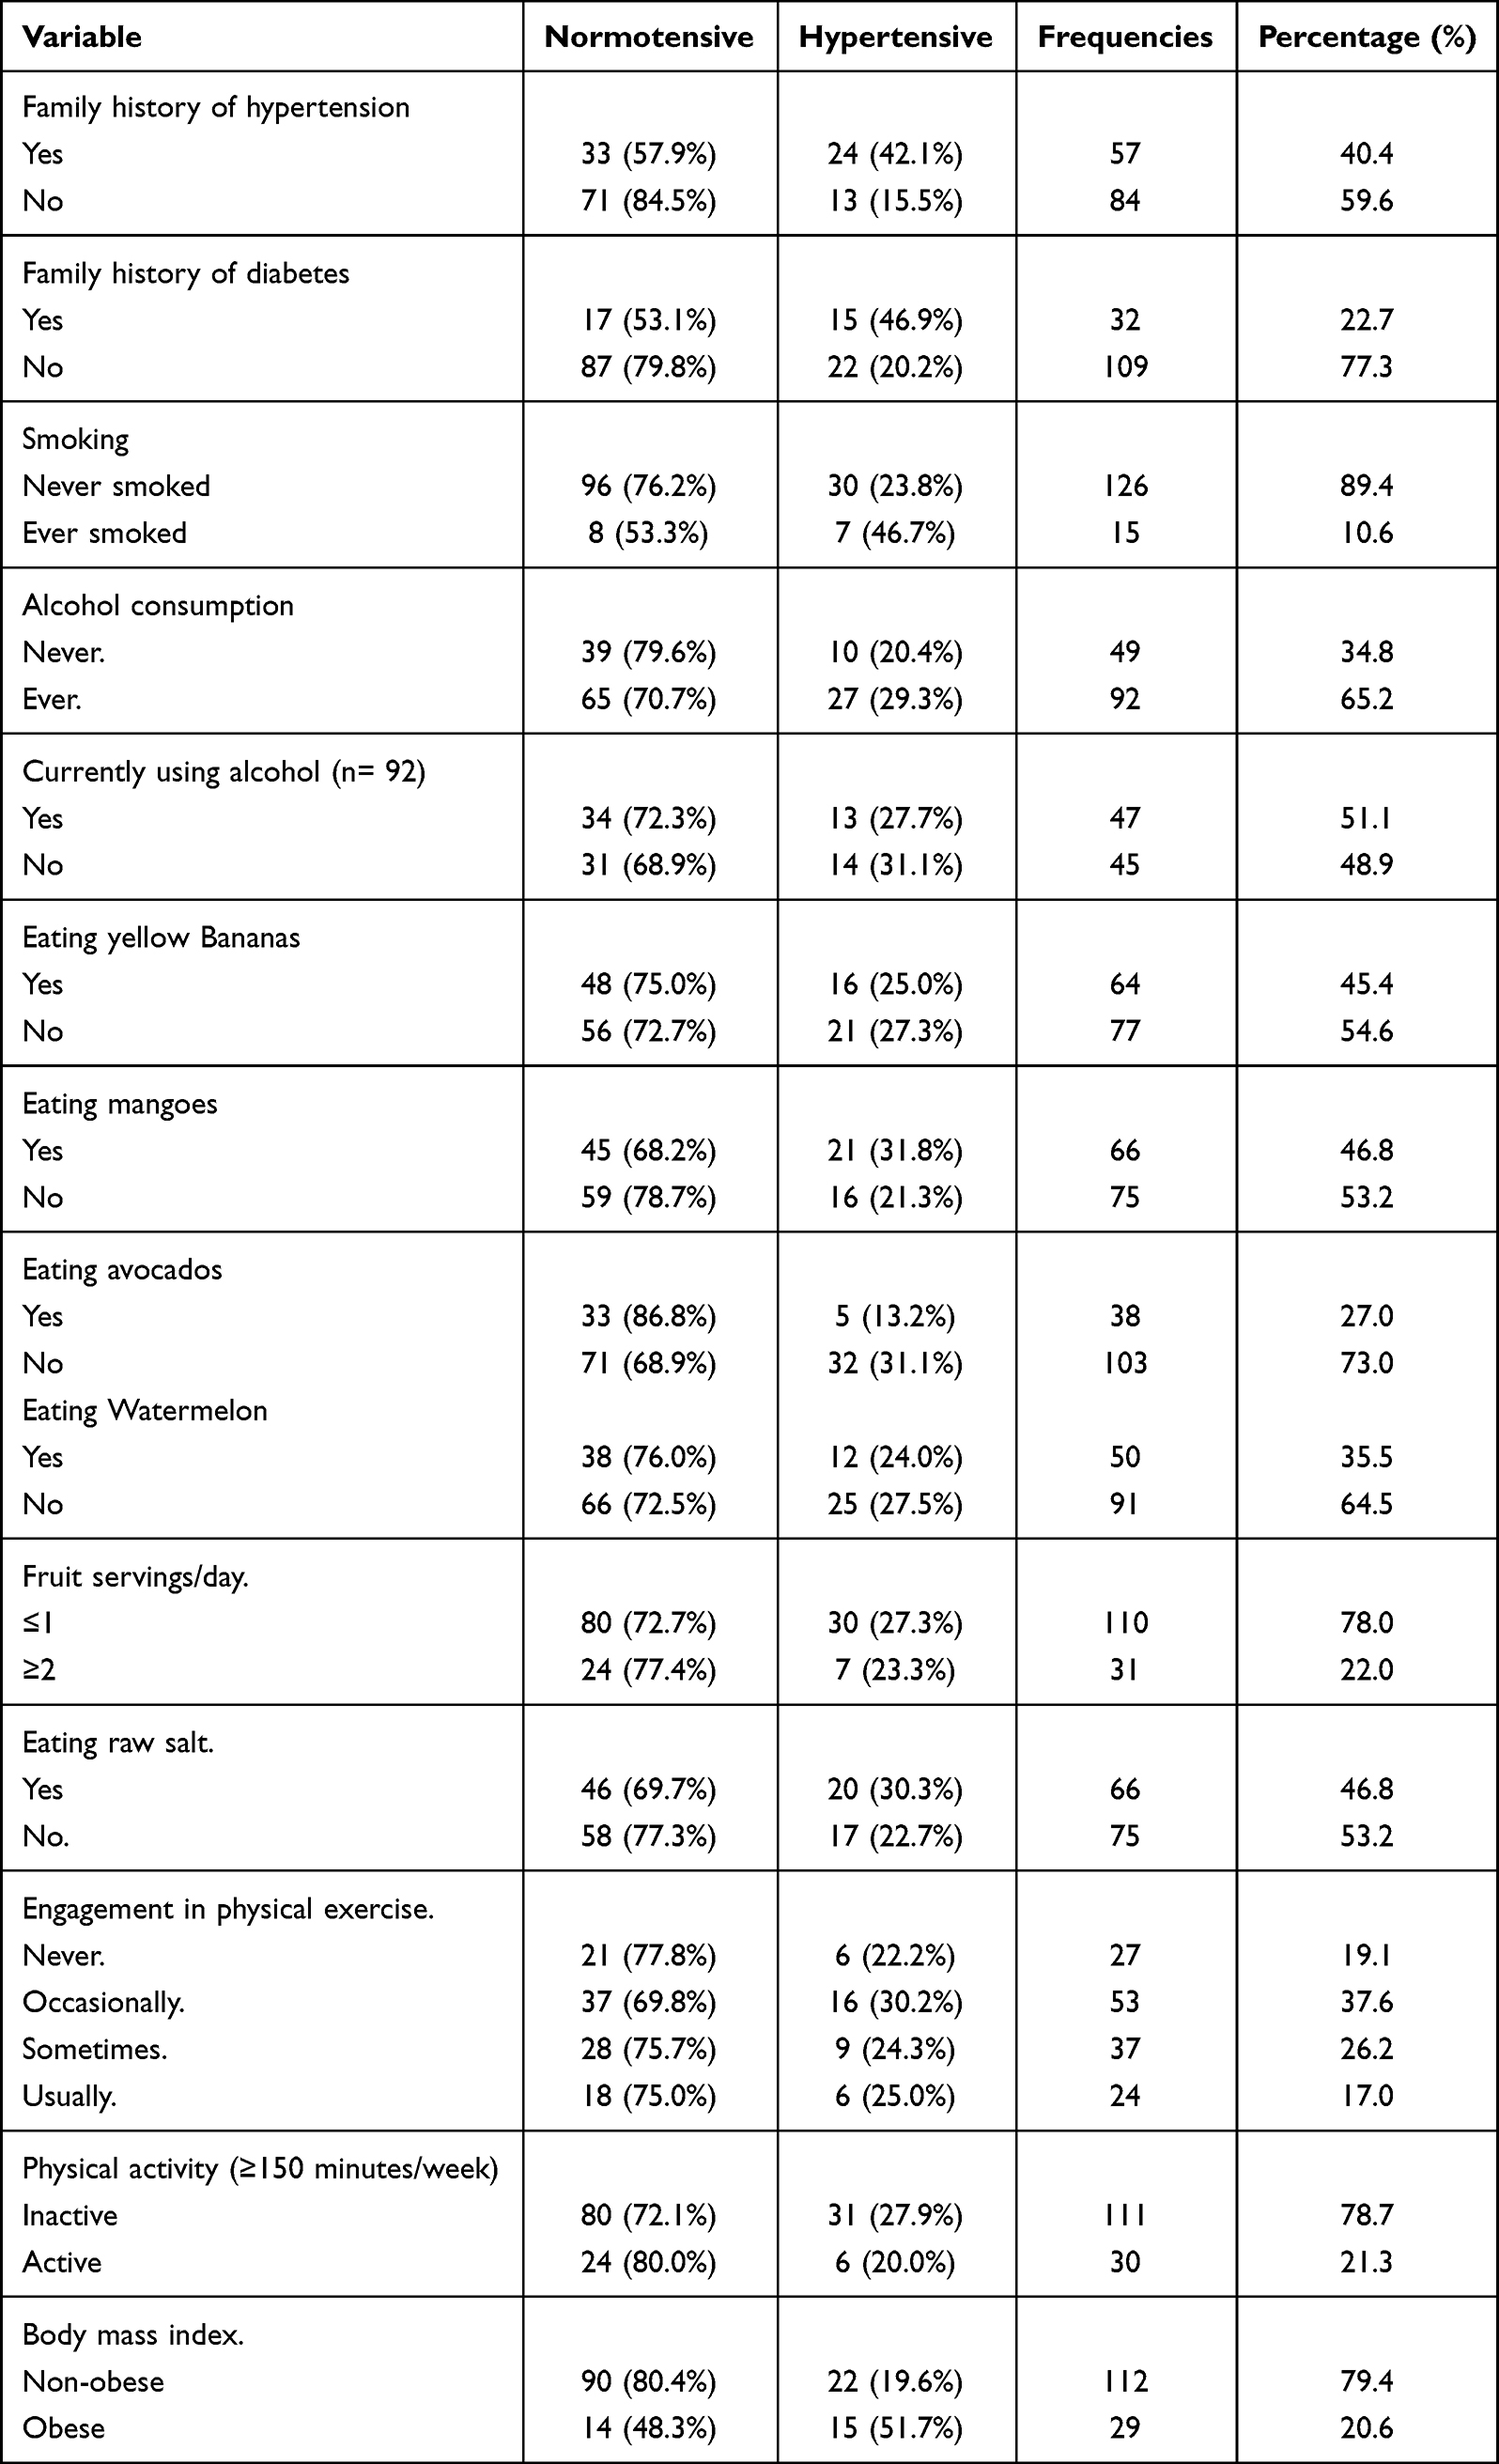 |
Table 1 Prevalence of Risk Factors for Hypertension Among Faculty at an Urban University in Uganda |
Prevalence of Hypertension
One in four, 29(20.6%) of our participants reported to have been diagnosed with hypertension before but in our assessment, the prevalence of hypertension was found at 37(26.2%) (95% CI 18.94–33.46%). Among the hypertensive participants, 21(56.8%) were on antihypertensive medication and among those on treatment, 7(33.3%) had their blood pressure uncontrolled.
Risk Factors Associated with Hypertension
After adjusting for age, family history of diabetes, alcohol consumption, physical exercise, use of a personal vehicle, eating raw salt, average fruit and vegetable servings per day, as well as eating avocados, obesity, male gender, and a family history of hypertension were found to be significantly associated with hypertension. The odds of having hypertension were almost four times higher among obese participants compared to non-obese participants (95% CI 1.403–10.135, p=0.008), Compared to females, male participants had an odds ratio of 2 for developing hypertension OR 2(95% CI 1.110–7.382, p = 0.029) and participants with a family history of hypertension had three times the odds of being hypertensive than those without a family history OR (95% CI 1.352–8.057, p = 0.009) (Table 2).
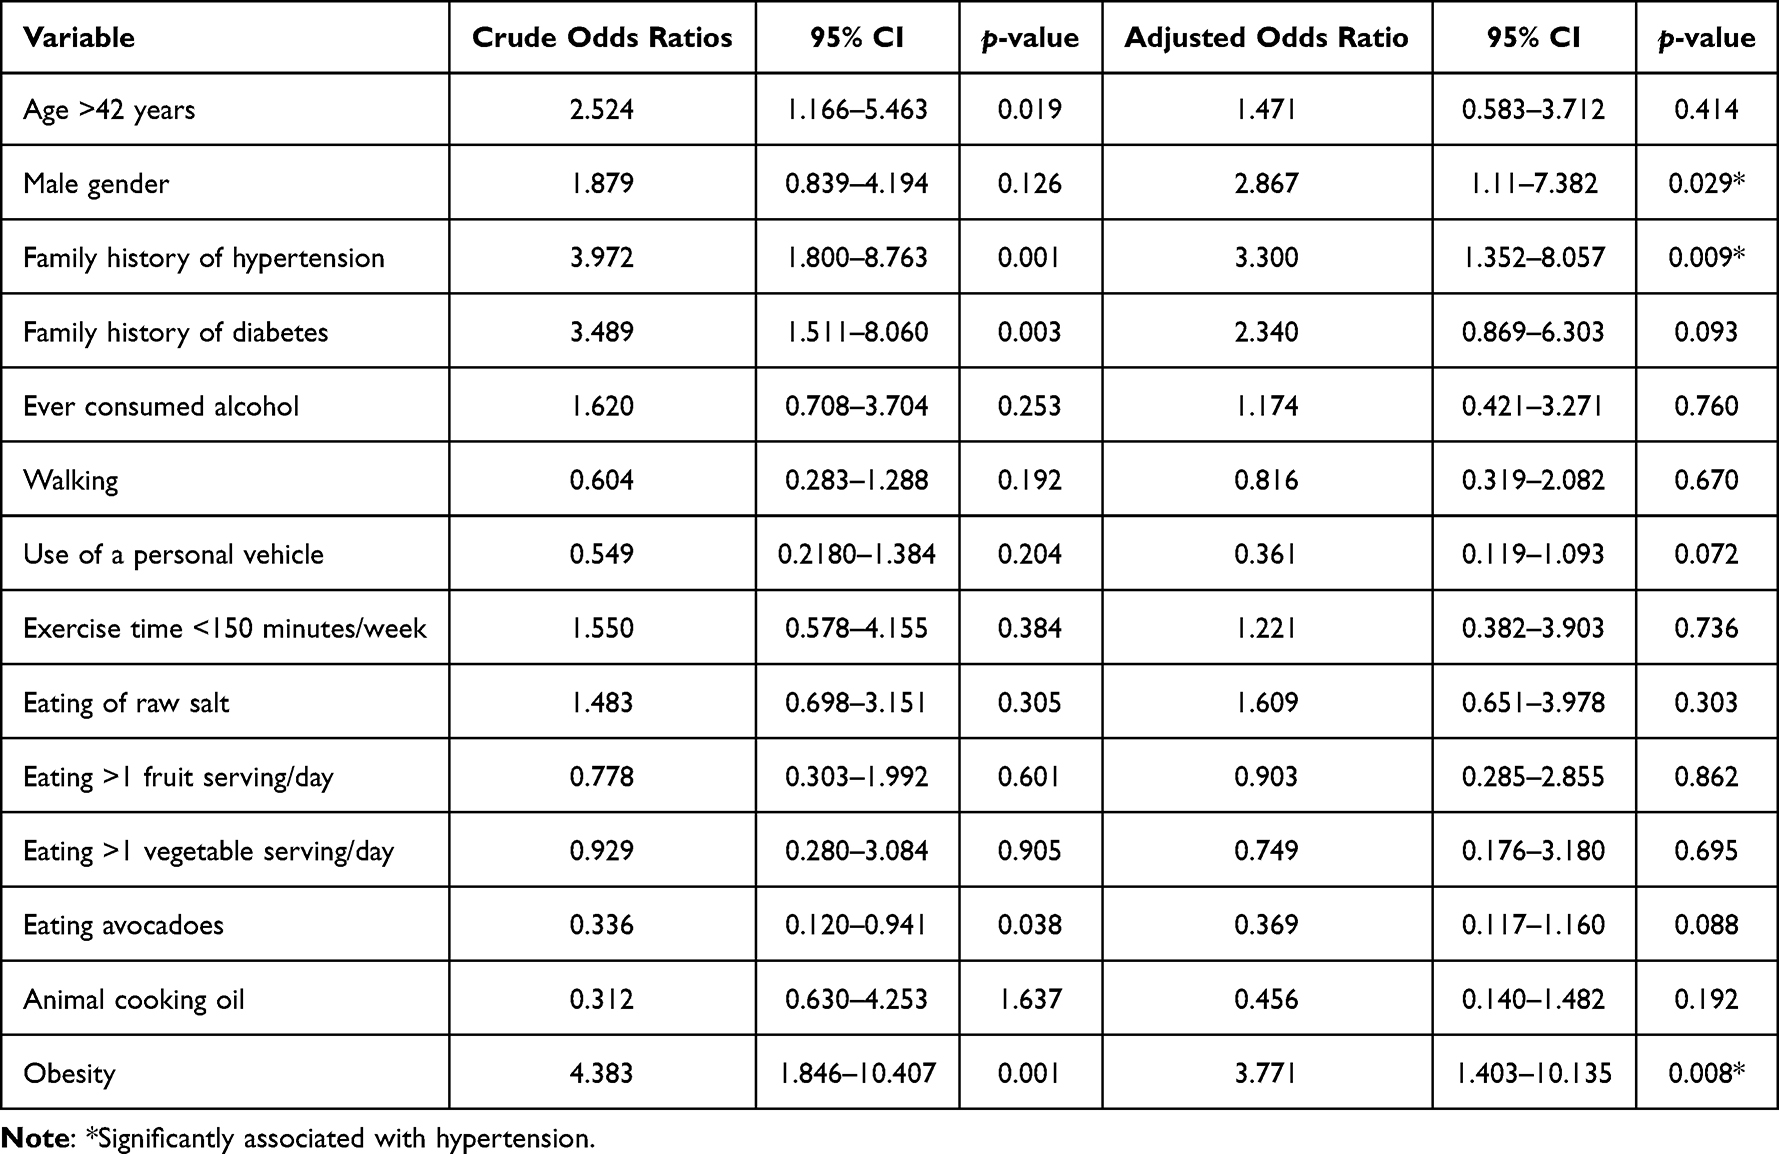 |
Table 2 Risk Factors Associated with Hypertension Among Faculty at an Urban University in Uganda |
Discussion
In this study, we screened for the prevalence of hypertension and several risk factors that have been known to be independent predictors of hypertension to establish the hypertension risk profile for teaching staff at Makerere University in Kampala Uganda. This is the first study to demonstrate the prevalence of risk factors for hypertension among teaching staff at a higher institution of learning in Uganda. Our study findings indicate that a notable proportion (26.2%) of faculty have hypertension. Among the faculty, both modifiable and non-modifiable risk factors for hypertension are prevalent.
The prevalence of hypertension in our study aligns closely with various regional studies: It is comparable with the 31.5% reported in the Uganda national epidemiological study,21 mirrors the 27% reported at the Uganda cancer institute,5 it is slightly higher than the 23.4% noted in central Uganda and the 22% in Western Kenya.22 Furthermore, a recent study among patients attending an HIV clinic in Kampala revealed a comparable prevalence of 24.4%.23
In rural Tanzania24 and rural Bangladesh,25 the prevalence of hypertension at 17% and 16% respectively is lower than that observed among the university faculty in our study. The high level of hypertension in our study underscores a possible high previous predisposition to hypertension risk factors among university faculty and further illustrates the influence of urban residence on the risk for increasing hypertension cases. Urban environments are often marked by dietary habits that contribute to weight gain and an increased susceptibility to obesity, factors closely linked to the risk of hypertension.
On the contrary, the prevalence of hypertension among patients with drug-resistant tuberculosis in Uganda was significantly higher, at 40.6%,26 almost double our observed prevalence. This considerable variability in hypertension levels highlights differences in risk exposures. It is plausible to posit that drug-resistant tuberculosis patients have higher levels of exposure to risk factors for hypertension. Such variabilities call for disaggregated risk reduction approaches.
Following a diagnosis of hypertension, initiation of treatment is the best way to control hypertension and prevent adverse cardiovascular events. Of the staff found to be hypertensive, more than half (56.8%) were on treatment giving a treatment rate slightly higher than that found in rural Uganda and Bangladesh, where 48.4%,27 and 52.3%28 respectively were found on treatment respectively. This could be due to the easy and regular access to medication by the university staff since they have a consistent and regular income. Additionally, the urban location is strategic to accessibility of best health facilities with continuous supply of antihypertensive drugs.
Among University faculty, the prevalence of risk factors for hypertension indicates presence of both modifiable and non-modifiable risk factors. The modifiable risk factors prevalent included eating less than the recommended daily servings of fruit and vegetables, addition of extra salt to food, physical inactivity, overweight, obesity and alcohol consumption.
The food we eat is a source of both energy and essential elements vital for cardiovascular health. Despite the well-known fact that fruits and vegetables are rich sources of potassium, none of the faculty members in our study reported consuming the recommended daily servings of these foods. This finding is particularly surprising, considering that faculty members are generally expected to possess greater dietary literacy. This lack of adequate fruit and vegetable consumption is particularly disadvantageous considering the findings of Ndong et al, who noted an inverse association between serum potassium levels and both systolic blood pressure and hypertension.29
Fruits and vegetables are key components in the Dietary Approaches to Stop Hypertension (DASH) strategy, as they are specifically recommended for managing and preventing hypertension.30 The level of serum potassium is largely dependent on dietary intake. Therefore, with sub-optimal consumption of fruits and vegetables, there is a potential risk of low serum potassium levels.
When compared to findings from central Uganda and Western Kenya, where suboptimal fruit and vegetable consumption was reported at 88.6%31 and 93%22 respectively, the potential for low serum potassium levels due to inadequate dietary intake becomes even more evident. In rural Tanzania, consuming less than one fruit serving per day was found at 40.1%24 reflecting a better dietary approach than in our study. This difference could be partly attributed to the potential scarcity of fruits and vegetables in urban compared to rural settings. The perishable nature of fruits and vegetables may pose a challenge in maintaining a steady supply of fresh produce in urban areas, as compared to rural settings, potentially limiting daily intake in these urban environments. As highlighted by Ndejjo et al in their qualitative exploration, the seasonality of fruits and vegetables is a great barrier towards consuming the recommended servings regularly.32
The World Health Organization in an effort to control non-communicable diseases has led campaigns against eating excessive salt.33 In the current study, over four out of ten participants add extra salt to their food after serving. Unfortunately, this is even higher among the hypertensive participants (54.1%). The practice of adding salt to food after serving is lower among Ghanaian adults at 12.8% and 9.9%,34 among urban residents in Benin, Guinea, Kenya, Mozambique, and Seychelles at 11%,35 as well as in South Africa at 32.9%.36 The variability could probably be due to lack of mass media campaigns against high salt consumption among our participants, but also frequent consumption of fast foods which require addition of extra salt before eating could be a common practice.
Salt is the biggest source of sodium which has been demonstrated to cause elevated blood pressures37 and increased urinary elimination of potassium.34 Because potassium is cardio-protective, excessive sodium intake with subsequent loss of potassium is potentially damaging. Dietary salt restrictions have been associated with reduced serum sodium, and reduction in blood pressure.38–40 It is therefore paramount that interventions for reducing salt consumption are implemented for both hypertension prevention and blood pressure control among faculty.
Physical inactivity depicts a sedentary lifestyle with a high risk of increased deposition of body fat, overweight and obesity with subsequent cardiometabolic complications.41 An individual’s decision and willingness to engage in physical exercise can be influenced by several factors., For instance, the physical environment including the presence of enough space has been found to be associated with engagement in physical exercise.42 A study by Ndejjo et al in central Uganda highlights that infrastructural challenges greatly hinder uptake of physical exercises as per recommendations.32
Our study revealed that about eight in ten faculty members are physically inactive. This rate is high when compared to rural Nigeria and Western Kenya, where the prevalence of inactivity was found at 19.2%15 and 43%,22 respectively. The high prevalence in our study could be due to the fact that seven in ten of faculty usually use vehicles to get to and from places. More so, unlike our participants, some individuals in rural settings engage in casual labor which increases their level of mobility and physical engagement. There is need to evaluate key barriers to physical activity among faculty and design targeted interventions to promote physical exercise as a preventive measure for hypertension.
The prevalence of overweight (46.8%) and obesity (20.6%) in our study is comparable to an urban population attending the HIV clinic at Mulago National Referral Hospital at 38.7% and 25.9%,43 respectively. Another study in England reported a prevalence of obesity among Nurses at 25%44 which is almost the same as the obesity in the current study.44 This could be due to the similarity in residence as both of the cohorts were obtained from an urban setting.
However, a peri-urban population in Uganda was found to have a prevalence of combined obesity and overweight of about three out of ten respondents (30.4%)31 which is lower than what we observed in our study. In Ghana, it was four times lower among public servants (4.8%),45 and this could be due to the congested nature of Kampala which does not favor walking or jogging. Additionally, the prevalence of obesity is four times higher than findings from university students,46 thus reflecting the effect of age and maintaining physical fitness. The high levels of obesity in our study could also be due to the fact that only one in five of the participants are physically active and the busy academic schedules interfere with optimal engagement in weight management programs.
It is worth noting that obesity increases the risk of developing hypertension and other cardiovascular disorders and this has been demonstrated in our study where obese participants are four times more likely to be hypertensive. Other studies elsewhere47,48 have demonstrated the same findings. Obesity results in excessive storage of fats which if not managed causes deposition of triglycerides in the arterial walls with resultant arteriosclerosis, atherosclerosis and increased vascular resistance.49 Zhang et al further elaborate that obesity is significantly associated with a high Global Longitudinal Strain21 which is a strong indicator of adverse cardiovascular outcomes.
Adoption of social behaviors such as excessive alcohol consumption and smoking is a common way of responding to stressful situations among many individuals. The prevalence of current alcohol consumption at 33.3% is comparable to the consumption among patients with active tuberculosis in Africa at 30.0%.50 However, the consumption prevalence is high when compared to findings from the Uganda national survey at 26.8%,51 central peri-urban Uganda at 23.0%,31 and in Western Kenya at 12%.22 The high prevalence could be due to high-stress levels related to academic schedules, but also the time difference between when the studies were conducted needs to be put into perspective.
It is a vital finding that none of the faculty were smoking at the time of the study, and this is contrary to findings from an urban Ugandan HIV clinic at 9.7%,43 among drug-resistant tuberculosis patients in Central, Western, Northern and Eastern Uganda at 36.3%26 and among patients in Western Kenya at 5%.22 Tobacco cessation information is readily available in Ugandan urban settings and given that Makerere University has a zero-smoking policy, it could be the explanation for no participants being current smokers relative to studies conducted among the general population.
Among non-modifiable risk factors for hypertension were a family history of hypertension and male gender. One in four of participants were found to have a family history of hypertension, similar to findings among Sri Lankan adults at 43.5%.52 Familial predisposition was found to be significantly associated with hypertension in our study. This finding is in agreement with results from other studies.48,53,54 Inheriting genes that code for malformations associated with hypertension is one possible explanation but also the social impact of family members on behaviors such as dietary lifestyles and choices, mobility and physical exercise, as well as behaviors such as smoking and alcohol consumption highlights the role of social interactions on hypertension.
Male participants were three times more likely to have hypertension than female participants. A similar finding has been demonstrated elsewhere.48,55,56 Additionally, Kirschbaum et al indicated that the female gender has a lower risk of hypertension than the male gender. From our study, the association between hypertension and male gender can be explained by the high-risk factor aggregation among men. For instance, relative to females, only males are previous smokers, more males add salt to food while eating, and more males are having a family history of hypertension than females. In addition, male participants were found to be two times more likely to have ever consumed alcohol and three times more likely to be currently drinking alcohol. These findings are in line with results established by Bjertness et al.57 This further elaborates the need for concerted efforts for male involvement towards the prevention and control of hypertension.
There are several limitations in this study. Most of the data collected on participant behaviors were by self-reported assessment and this could have been subject to response bias. The study team reduced this bias by utilizing a standard tool developed by WHO and allowing the respondents to answer the questions at their convenience. Several other indicators of increased risk factors for hypertension such as diabetes, blood cholesterol levels were not assessed in the current study limiting the aggregation of the total risk profile. To categorize participants as hypertensve, the two blood pressure measurements were performed on a single day which may not be definitive enough to diagnose hypertension. The study was cross-sectional in nature thus limiting the attribution of causality of several risk factors to hypertension. Additionally, the study population is specific and the findings may not be generalizable to the Ugandan general population.
Implications for Research
There is a need to develop and test the feasibility, acceptability, and efficacy of hypertension risk screening tools in the formal work sector in order to promote primary and secondary prevention of hypertension. Interventions that target to promote hypertension prevention and control through risk modification will be vital in combatting the high-risk burden.
Conclusion
In our study conducted at Makerere University, we observed a high prevalence of hypertension among teaching staff with over a quarter being hypertensive. Additionally, the prevalence of risk factors for hypertension is significantly high with an aggregation of several modifiable factors among faculty. Our findings contribute to the existing body of knowledge by affirming that obesity, male gender, and family history are strongly associated with hypertension. There is need for concerted efforts on continuous routine screening for hypertension and its risk factors, as well as implementing prevention and health promotion campaigns to reduce the risk burden.
Abbreviations
BMI, Body Mass Index; Cm, Centimeter; CVDs, Cardio-vascular diseases; NCDs, Non-communicable Diseases; DASH, Dietary Approaches to Stop Hypertension; Kg, kilogram; mmHg, millimeters of mercury.
Ethics Approval and Consent to Participate
The study sought and obtained ethical clearance from Makerere University School of Health Sciences Research and Ethics Committee (Approval number SHS REC: 2017-062). All prospective participants were provided with study information and those that agreed to participate provided written informed consent.
Acknowledgments
The Authors wish to appreciate all the participants who gave their time to take part in this study. Furthermore, we appreciate the principals of the colleges in which the study took place for their maximum support.
Author Contributions
All authors made substantial contributions to the conception, design, acquisition of data, analysis and interpretation of data, took part in the drafting and revising of the manuscript, agreed to submit to the current journal, gave final approval of the version to be published, and agree to be accountable for all aspects of the work.
Funding
There was no funding for this study.
Disclosure
The authors report no conflicts of interest in this work.
References
1. Lim SS, Vos T, Flaxman AD, et al. A comparative risk assessment of burden of disease and injury attributable to 67 risk factors and risk factor clusters in 21 regions, 1990–2010: a systematic analysis for the Global Burden of Disease Study 2010. Lancet. 2012;380(9859):2224–2260. doi:10.1016/S0140-6736(12)61766-8
2. Mills KT, Stefanescu A, He J. The global epidemiology of hypertension. Nat Rev Nephrol. 2020;16(4):223–237. doi:10.1038/s41581-019-0244-2
3. World Health Organization. The Health of the People: What Works: The African Regional Health Report, 2014. World Health Organization, Regional Office for Africa; 2014.
4. Guwatudde D, Mutungi G, Wesonga R, et al. The epidemiology of hypertension in Uganda: findings from the national non-communicable diseases risk factor survey. Kokubo Y, ed. PLoS One. 2015;10(9):e0138991. doi:10.1371/journal.pone.0138991
5. Lunyera J, Kirenga B, Stanifer JW, et al. Geographic differences in the prevalence of hypertension in Uganda: results of a national epidemiological study. Etyang AO, ed. PLoS One. 2018;13(8):e0201001. doi:10.1371/journal.pone.0201001
6. Ataklte F, Erqou S, Kaptoge S, Taye B, Echouffo-Tcheugui JB, Kengne AP. Burden of undiagnosed hypertension in Sub-Saharan Africa: a systematic review and meta-analysis. Hypertension. 2015;65(2):291–298. doi:10.1161/HYPERTENSIONAHA.114.04394
7. Abdullahi AA, Amzat J. Knowledge of Hypertension Among the Staff of University of Ibadan, Nigeria. J Public Health Epidemiol. 2011;3(5):204–209.
8. Agaba EI, Akanbi MO, Agaba PA, et al. A survey of non-communicable diseases and their risk factors among university employees: a single institutional study. Cardiovasc J Afr. 2017;28(6):377–384. doi:10.5830/CVJA-2017-021
9. Feyisa BR, Tamiru A, Debelo S, et al. Magnitude of hypertension and its association with obesity among employees of Wallaga University, Ethiopia: a cross-- sectional study. Open Access. 2023;13(7):e070656.
10. Nwoga HO, Ajuba MO, Igweagu CP. Prevalence of undiagnosed hypertension among staff of a tertiary institution in Enugu State, Nigeria. Ann Clin Biomed Res. 2023;4(2). doi:10.4081/acbr.2023.331
11. Lumori BAE, Nuwagira E, Abeya FC, et al. Association of body mass index with left ventricular diastolic dysfunction among ambulatory individuals with diabetes mellitus in rural Uganda: a cross-sectional study. BMC Cardiovasc Disord. 2022;22(1):279. doi:10.1186/s12872-022-02718-2
12. Twinamasiko B, Lukenge E, Nabawanga S, et al. Sedentary lifestyle and hypertension in a Periurban Area of Mbarara, South Western Uganda: a population based cross sectional survey. Int J Hypertens. 2018;2018:1–8. doi:10.1155/2018/8253948
13. Bosu WK. The prevalence, awareness, and control of hypertension among workers in West Africa: a systematic review. Glob Health Action. 2015;8(1):26227. doi:10.3402/gha.v8.26227
14. Sarki AM, Nduka CU, Stranges S, Kandala NB, Uthman OA. Prevalence of hypertension in low- and middle-income countries: a systematic review and meta-analysis. Medicine. 2015;94(50):e1959. doi:10.1097/MD.0000000000001959
15. Kato A, Kibone W, Okot J, Baruch Baluku J, Bongomin F. Self-reported hypertension and associated factors among adults in Butambala District, Central Uganda: a community-based prevalence study. Integr Blood Press Control. 2023;16:71–80. doi:10.2147/IBPC.S434230
16. Kilama D, Ayella DO, Asiimwe I, Nakibuuka B, Laker F, Bongomin F. Undiagnosed hypertension among market salespersons in Kitgum Central Market, Northern Uganda. Integr Blood Press Control. 2023;16:37–46. doi:10.2147/IBPC.S402988
17. Princewel F, Cumber SN, Kimbi JA, et al. Prevalence and risk factors associated with hypertension among adults in a rural setting: the case of Ombe, Cameroon. Pan Afr Med J. 2019;34. doi:10.11604/pamj.2019.34.147.17518
18. Prince SA, Elliott CG, Scott K, Visintini S, Reed JL. Device-measured physical activity, sedentary behaviour and cardiometabolic health and fitness across occupational groups: a systematic review and meta-analysis. Int J Behav Nutr Phys Act. 2019;16(1):30. doi:10.1186/s12966-019-0790-9
19. Riley L, Guthold R, Cowan M, et al. The World Health Organization STEPwise approach to noncommunicable disease risk-factor surveillance: methods, challenges, and opportunities. Am J Public Health. 2016;106(1):74–78. doi:10.2105/AJPH.2015.302962
20. Unger T, Borghi C, Charchar F, et al. 2020 international society of hypertension global hypertension practice guidelines. Hypertension. 2020;75(6):1334.
21. Zhang W, Azibani F, Okello E, et al. Clinical characterization, cardiovascular risk factor profile and cardiac strain analysis in a Uganda cancer population: the SATRACD study. Coelho-Filho OR, ed. PLoS One. 2021;16(4):e0249717. doi:10.1371/journal.pone.0249717
22. Mogaka JN, Sharma M, Temu T, et al. Prevalence and factors associated with hypertension among adults with and without HIV in Western Kenya. He W, ed. PLoS One. 2022;17(1):e0262400. doi:10.1371/journal.pone.0262400
23. Byonanebye DM, Polizzotto MN, Parkes-Ratanshi R, Musaazi J, Petoumenos K, Castelnuovo B. Prevalence and incidence of hypertension in a heavily treatment-experienced cohort of people living with HIV in Uganda. De Socio GV, ed. PLoS One. 2023;18(2):e0282001. doi:10.1371/journal.pone.0282001
24. Kavishe B, Biraro S, Baisley K, et al. High prevalence of hypertension and of risk factors for non-communicable diseases (NCDs): a population based cross-sectional survey of NCDS and HIV infection in Northwestern Tanzania and Southern Uganda. BMC Med. 2015;13(1):126. doi:10.1186/s12916-015-0357-9
25. Khanam MA, Lindeboom W, Razzaque A, Niessen L, Milton AH. Prevalence and determinants of pre-hypertension and hypertension among the adults in rural Bangladesh: findings from a community-based study. BMC Public Health. 2015;15(1):203. doi:10.1186/s12889-015-1520-0
26. Baluku JB, Nabwana M, Nalunjogi J, et al. Cardiovascular risk factors among people with drug-resistant tuberculosis in Uganda. BMC Cardiovasc Disord. 2022;22(1):464. doi:10.1186/s12872-022-02889-y
27. Musinguzi G, Nuwaha F, Ashton N. Prevalence, awareness and control of hypertension in Uganda. Ashton N, ed. PLoS One. 2013;8(4):e62236. doi:10.1371/journal.pone.0062236
28. Rahman M, Zaman MM, Islam JY, et al. Prevalence, treatment patterns, and risk factors of hypertension and pre-hypertension among Bangladeshi adults. J Hum Hypertens. 2018;32(5):334–348. doi:10.1038/s41371-017-0018-x
29. Ndong AK, Van Der Linden EL, Beune EJAJ, et al. Serum potassium concentration and its association with hypertension among Ghanaian migrants and non-migrants: the RODAM study. Atherosclerosis. 2022;342:36–43. doi:10.1016/j.atherosclerosis.2021.12.006
30. Padma V. DASH diet in preventing hypertension. Adv Biol Res. 2014;8(2):94.
31. Musinguzi G, Ndejjo R, Ssinabulya I, Bastiaens H, Van Marwijk H, Wanyenze RK. Cardiovascular risk factor mapping and distribution among adults in Mukono and Buikwe districts in Uganda: small area analysis. BMC Cardiovasc Disord. 2020;20(1):284. doi:10.1186/s12872-020-01573-3
32. Ndejjo R, Musinguzi G, Nuwaha F, Bastiaens H, Wanyenze RK, Pakhare AP. Understanding factors influencing uptake of healthy lifestyle practices among adults following a community cardiovascular disease prevention programme in Mukono and Buikwe districts in Uganda: a qualitative study. Pakhare AP, ed. PLoS One. 2022;17(2):e0263867. doi:10.1371/journal.pone.0263867
33. World Health Organization. Guideline: sodium intake for adults and children. World Health Organization; 2012. Available from: https://apps.who.int/iris/handle/10665/77985.
34. Menyanu EK, Corso B, Minicuci N, et al. Salt and potassium intake among adult Ghanaians: WHO-SAGE Ghana Wave 3. BMC Nutr. 2020;6(1):54. doi:10.1186/s40795-020-00379-y
35. Leyvraz M, Mizéhoun-Adissoda C, Houinato D, et al. Food consumption, knowledge, attitudes, and practices related to salt in Urban areas in five Sub-Saharan African Countries. Nutrients. 2018;10(8):1028. doi:10.3390/nu10081028
36. Menyanu E, Charlton K, Ware L, Russell J, Biritwum R, Kowal P. Salt use behaviours of Ghanaians and South Africans: a comparative study of knowledge, attitudes and practices. Nutrients. 2017;9(9):939. doi:10.3390/nu9090939
37. He FJ, MacGregor GA. Effect of modest salt reduction on blood pressure: a meta-analysis of randomized trials. Implications for public health. J Hum Hypertens. 2002;16(11):761–770. doi:10.1038/sj.jhh.1001459
38. Mu L, Li C, Liu T, et al. A pilot study on efficacy and safety of a new salt substitute with very low sodium among hypertension patients on regular treatment. Medicine. 2020;99(8):e19263. doi:10.1097/MD.0000000000019263
39. Cashman KD, Kenny S, Kerry JP, Leenhardt F, Arendt EK. ‘Low-salt’ bread as an important component of a pragmatic reduced-salt diet for lowering blood pressure in adults with elevated blood pressure. Nutrients. 2019;11(8):1725. doi:10.3390/nu11081725
40. Wang M, Moran AE, Liu J, et al. A meta-analysis of effect of dietary salt restriction on blood pressure in Chinese adults. Glob Heart. 2015;10(4):291. doi:10.1016/j.gheart.2014.10.009
41. Silveira EA, Mendonça CR, Delpino FM, et al. Sedentary behavior, physical inactivity, abdominal obesity and obesity in adults and older adults: a systematic review and meta-analysis. Clin Nutr ESPEN. 2022;50:63–73. doi:10.1016/j.clnesp.2022.06.001
42. Bolívar J, Daponte A, Rodríguez M, Sánchez JJ. The influence of individual, social and physical environment factors on physical activity in the adult population in Andalusia, Spain. Int J Environ Res Public Health. 2010;7(1):60–77. doi:10.3390/ijerph7010060
43. Musimbaggo DJ, Kimera ID, Namugenyi C, et al. Factors associated with blood pressure control in patients with hypertension and HIV at a large urban HIV clinic in Uganda. J Hum Hypertens. 2022. doi:10.1038/s41371-022-00786-7
44. Kyle RG, Wills J, Mahoney C, Hoyle L, Kelly M, Atherton IM. Obesity prevalence among healthcare professionals in England: a cross-sectional study using the health survey for England. BMJ Open. 2017;7(12):e018498. doi:10.1136/bmjopen-2017-018498
45. Atuahene M, Ganle JK, Adjuik M, Atuahene NF, Kampitib GB. Overweight and obesity prevalence among public servants in Nadowli district, Ghana, and associated risk factors: a cross-sectional study. BMC Obes. 2017;4(1):15. doi:10.1186/s40608-017-0153-5
46. Peltzer K, Pengpid S, Samuels T, et al. Prevalence of overweight/obesity and its associated factors among university students from 22 countries. Int J Environ Res Public Health. 2014;11(7):7425–7441. doi:10.3390/ijerph110707425
47. Kayima J, Nankabirwa J, Sinabulya I, et al. Determinants of hypertension in a young adult Ugandan population in epidemiological transition—the MEPI-CVD survey. BMC Public Health. 2015;15(1):830. doi:10.1186/s12889-015-2146-y
48. Kotwani P, Kwarisiima D, Clark TD, et al. Epidemiology and awareness of hypertension in a rural Ugandan community: a cross-sectional study. BMC Public Health. 2013;13(1):1151. doi:10.1186/1471-2458-13-1151
49. Jiang SZ, Lu W, Zong XF, Ruan HY, Liu Y. Obesity and hypertension. Exp Ther Med. 2016;12(4):2395–2399. doi:10.3892/etm.2016.3667
50. Baluku JB, Ronald O, Bagasha P, Okello E, Bongomin F. Prevalence of cardiovascular risk factors in active tuberculosis in Africa: a systematic review and meta-analysis. Sci Rep. 2022;12(1):16354. doi:10.1038/s41598-022-20833-0
51. Kabwama SN, Ndyanabangi S, Mutungi G, Wesonga R, Bahendeka SK, Guwatudde D. Alcohol use among adults in Uganda: findings from the countrywide non-communicable diseases risk factor cross-sectional survey. Glob Health Action. 2016;9(1):31302. doi:10.3402/gha.v9.31302
52. Ranasinghe P, Cooray DN, Jayawardena R, Katulanda P. The influence of family history of hypertension on disease prevalence and associated metabolic risk factors among Sri Lankan adults. BMC Public Health. 2015;15(1):576. doi:10.1186/s12889-015-1927-7
53. Nyombi KV, Kizito S, Mukunya D, et al. High prevalence of hypertension and cardiovascular disease risk factors among medical students at Makerere University College of Health Sciences, Kampala, Uganda. BMC Res Notes. 2016;9(1):110. doi:10.1186/s13104-016-1924-7
54. Wu CT, Kuo CF, Lin CP, et al. Association of family history with incidence and gestational hypertension outcomes of preeclampsia. Int J Cardiol Hypertens. 2021;9:100084. doi:10.1016/j.ijchy.2021.100084
55. Fikadu G, Lemma S. Socioeconomic status and hypertension among teachers and bankers in Addis Ababa, Ethiopia. Int J Hypertens. 2016;2016:1–7. doi:10.1155/2016/4143962
56. Abdul-Razak S, Daher AM, Ramli AS, et al. Prevalence, awareness, treatment, control and socio demographic determinants of hypertension in Malaysian adults. BMC Public Health. 2016;16(1):351. doi:10.1186/s12889-016-3008-y
57. Bjertness MB, Htet AS, Meyer HE, et al. Prevalence and determinants of hypertension in Myanmar - a nationwide cross-sectional study. BMC Public Health. 2016;16(1):590. doi:10.1186/s12889-016-3275-7
 © 2024 The Author(s). This work is published and licensed by Dove Medical Press Limited. The full terms of this license are available at https://www.dovepress.com/terms.php and incorporate the Creative Commons Attribution - Non Commercial (unported, v3.0) License.
By accessing the work you hereby accept the Terms. Non-commercial uses of the work are permitted without any further permission from Dove Medical Press Limited, provided the work is properly attributed. For permission for commercial use of this work, please see paragraphs 4.2 and 5 of our Terms.
© 2024 The Author(s). This work is published and licensed by Dove Medical Press Limited. The full terms of this license are available at https://www.dovepress.com/terms.php and incorporate the Creative Commons Attribution - Non Commercial (unported, v3.0) License.
By accessing the work you hereby accept the Terms. Non-commercial uses of the work are permitted without any further permission from Dove Medical Press Limited, provided the work is properly attributed. For permission for commercial use of this work, please see paragraphs 4.2 and 5 of our Terms.