")
Back to Journals » International Journal of Nephrology and Renovascular Disease » Volume 16
Predicting the Stone-Free Status of Percutaneous Nephrolithotomy with the Machine Learning System
Authors AlAzab R, Ghammaz O, Ardah N, Al-Bzour A , Zeidat L, Mawali Z, Ahmed YB, Alguzo TA, Al-Alwani AM, Samara M
Received 24 June 2023
Accepted for publication 6 September 2023
Published 11 September 2023 Volume 2023:16 Pages 197—206
DOI https://doi.org/10.2147/IJNRD.S427404
Checked for plagiarism Yes
Review by Single anonymous peer review
Peer reviewer comments 2
Editor who approved publication: Professor Pravin Singhal
Rami AlAzab,1 Owais Ghammaz,2 Nabil Ardah,2 Ayah Al-Bzour,2 Layan Zeidat,2 Zahraa Mawali,2 Yaman B Ahmed,2 Tha’er Abdulkareem Alguzo,1 Azhar Mohanad Al-Alwani,1 Mahmoud Samara1
1Department of General Surgery and Urology, King Abdullah University Hospital, Irbid, Jordan; 2Faculty of Medicine, Jordan University of Science and Technology, Irbid, Jordan
Correspondence: Owais Ghammaz, Faculty of Medicine, Jordan University of Science and Technology, P.O Box 3030, Irbid, 22110, Jordan, Tel +962775741299, Email [email protected]
Purpose: The study aimed to create a machine learning model (MLM) to predict the stone-free status (SFS) of patients undergoing percutaneous nephrolithotomy (PCNL) and compare its performance to the S.T.O.N.E. and Guy’s stone scores.
Patients and Methods: This is a retrospective study that included 320 PCNL patients. Pre-operative and post-operative variables were extracted and entered into three MLMs: RFC, SVM, and XGBoost. The methods used to assess the performance of each were mean bootstrap estimate, 10-fold cross-validation, classification report, and AUC. Each model was externally validated and evaluated by mean bootstrap estimate with CI, classification report, and AUC.
Results: Out of the 320 patients who underwent PCNL, the SFS was found to be 69.4%. The RFC mean bootstrap estimate was 0.75 and 95% CI: [0.65– 0.85], 10-fold cross-validation of 0.744, an accuracy of 0.74, and AUC of 0.761. The XGBoost results were 0.74 [0.63– 0.85], 0.759, 0.72, and 0.769, respectively. The SVM results were 0.70 [0.60– 0.79], 0.725, 0.74, and 0.751, respectively. The AUC of Guy’s stone score and the S.T.O.N.E. score were 0.666 and 0.71, respectively. The RFC external validation set had a mean bootstrap estimate of 0.87 and 95% CI: [0.81– 0.92], an accuracy of 0.70, and an AUC of 0.795, While the XGBoost results were 0.84 [0.78– 0.91], 0.74, and 0.84, respectively. The SVM results were 0.86 [0.80– 0.91], 0.79, and 0.858, respectively.
Conclusion: MLMs can be used with high accuracy in predicting SFS for patients undergoing PCNL. MLMs we utilized predicted the SFS with AUCs superior to those of GSS and S.T.O.N.E scores.
Keywords: Guy’s stone score, machine learning, percutaneous nephrolithotomy, renal stones, S.T.O.N.E score
Introduction
Urolithiasis (or nephrolithiasis) is a relatively common disease affecting 1–13% of the global population and is more common in Jordan affecting 5.95% of the Jordanian population.1,2 It has a predilection for obese Caucasian men and carries significant morbidity, its prevalence being on the rise over the last four decades. Several procedures are currently in use for the management of kidney stones, including extracorporeal shockwave lithotripsy (ESWL), ureteroscopic lithotripsy (URSL), and percutaneous nephrolithotomy (PCNL). With each having its own indications, PCNL remains the golden standard for large renal stones measuring greater than 2 cm, staghorn stones, and partial staghorn stones.3
PCNL is not free of complications and its efficacy can be variable; therefore, few pre-operative nomograms are in place to help predict success rates, namely stone-free status, and possible complications, and nomograms help to systemize the reporting and interpretation of the surgery’s outcomes.4 Examples of such nomograms are the S.T.O.N.E score, S-ReSC score, Guy’s Stone Score (GSS), and CROES nephrolithometry score. The GSS comprises 4 grades that rate the complexity of the future PCNL based on renal anatomy and stone location; the score is based on all stones detected and not only those amenable for PCNL; higher grades in GSS correlate with a lower chance of stone-free status (SFS).5 On the other hand, the S.T.O.N.E score is obtained from pre-operative radiological characteristics that include stone size, the topography of stone, obstruction with respect to the degree of hydronephrosis, number of stones, and the Hounsfield Unit (HU) value of the stone6 Studies have shown that these stone scoring systems (SSS) have similar accuracy in predicting the SFS of PCNL patients, although GSS shows a slight superiority in complication prediction.7
Recently, machine learning (ML) has been trialed as a possible alternative to traditional SSS in predicting the sequelae of PCNL, with five studies in the literature documenting the endeavor.8–12 All five studies described ML as promising, as it showed high sensitivity and accuracy along with efficiency in comparison to SSS. Each study used different ML methods, from artificial neural network (ANN) systems9 to support vector machine (SVM) models. However, none of the aforementioned studies were externally validated, and they all had smaller sample sizes compared to our study. In our study, we utilized the following three ML methods to predict the SFS of 320 PCNL patients: Random Forest (RF), Support Vector Machine (SVM), and eXtreme Gradient Boosting (XGBoost). Using our results, we compared ML’s performance to two stone scoring systems: Guy’s Stone Score and S.T.O.N.E score. We then externally validated our model, becoming the first study in the literature to do so, as well as the first study in Jordan that aims to create a machine learning model (MLM) for predicting the SFS of PCNL.
Materials and Methods
We conducted a retrospective, observational, single-center cohort study at King Abdullah University Hospital (KAUH), the main tertiary hospital in North Jordan. The Transparent Reporting of a Multivariable Prediction Model for Individual Prognosis or Diagnosis (TRIPOD) statement, which provides guidelines for reporting and developing predictive models, was followed in this study.13 The Research Committee of the Faculty of Medicine and the Institutional Review Board at Jordan University of Science and Technology (JUST) approved the study, and the Institutional Review Board provided the ethical approval (840–2022). The ethics committee approved a waiver of consent from the patients because the study did not include any therapeutic intervention and the outcomes planned are routinely registered in patients with nephrolithiasis. All patients diagnosed with nephrolithiasis, confirmed by computed tomography (CT) scans, and who had undergone Percutaneous Nephrolithotomy (PCNL) between January 2017 and September 2022 at KAUH were included. A standard diagnostic and preoperative evaluation were performed on all patients, which included a complete blood count, full coagulation profile, urine culture, kidney function test, and second-generation prophylactic antibiotics.
The study included a total of three surgeons (A, B, and C) who performed PCNL procedures on patients with renal calculi. The assignment process involved a random allocation method, which allowed for an unbiased distribution of surgeons across the various groups. This approach aimed to explore the potential patterns or trends in PCNL outcomes without intentional surgeon classification. The study aimed to analyze the outcomes within this random assignment to gain insights that could contribute to the broader understanding of PCNL efficacy and surgeon impact on treatment success. All procedures were performed under general anesthesia. The patients were put in a prone position, and a small skin incision would be made around the nephrostomy tract, under fluoroscopy guidance a guide wire was inserted down to the urinary bladder. Dilatation is then done up to 11fr, using a double-lumen catheter, a safety guidewire would then be inserted. A balloon dilator (nephromax) is used to achieve maximum dilation reaching 12pa, then the working sheath is inserted. A rigid 26 Fr nephroscope was used in all patients, then stone fragmentation was performed using different methods depending on the preference of the treating urologist; ultrasonic was the most common method in this regard. A nephrostomy was placed in almost all cases. If necessary, the nephrostomy tube would be left in the renal pelvis for decompression and/or easy access. Plain radiography of the kidneys, ureters, and bladder (KUB) was obtained from postoperative day 1 according to the state of the patient.
The nephrostomy tubes were removed on postoperative day 1 or 2 when the radiological images show signs of SFS. SFS means either the absence of stones or clinically insignificant residual fragments (diameter less than 4 mm) in the kidney after the procedure. Various methods were used to determine whether stone-free status has been achieved, including imaging studies such as X-rays or CT scans, as well as direct inspection of the kidney using the nephroscope. Stone-free status is typically assessed immediately following the procedure, but in some cases, a follow-up evaluation may be required to confirm that no residual stones remain.
A set of input variables were collected from the hospital records at KAUH for all patients that included preoperative and postoperative variables. The preoperative variables were age, gender, hypertension, diabetes, hyperlipidemia, preoperative hemoglobin, renal insufficiency, recent urinary tract infections, previous surgeries on the target kidney, stone burden, stone location, and hydronephrosis. Postoperative variables included fever, septicemia, need for transfusion, length of hospital stay, ancillary procedures, and stone-free status. SFS was defined as either no residual stone fragments on a CT scan or X-ray as well as direct inspection of the kidney using the nephroscope or those with clinically insignificant residual fragments <4 mm. The results of the definition were entered as a binary number: 1 (stone residual, ie, Yes) or 0 (clinically insignificant residual fragments or no residual stone fragments).
The MLM
Three ML ensembles were employed in this study: the Random Forest Classifier (RFC), Support Vector Classifier (SVC), and Extreme Gradient Boosting (XGBoost). These algorithms were selected due to their effectiveness in handling complex, multidimensional datasets and their capacity to model nonlinear relationships. The RFC model is a decision tree-based machine learning model. Each node of the decision tree divides the data into two groups using a cutoff value within one of the features. By creating an ensemble of randomized decision trees, each of which overfits the data and aggregates the results to achieve improved classification, the RFC technique mitigates the impact of the overfitting problem.14 SVC is a powerful supervised machine learning technique that aims to find the optimal hyperplane to separate data into different classes. It is well suited for both classification and regression tasks. XGBoost was also used and is constructed based on a decision tree-based gradient boosting regression method.15 In this approach, trees for prediction are sequentially built, with each subsequent tree designed to reduce errors from its predecessors.
After that, the machine learning models were trained on a dataset with a binary classification output predicting the target Stone-Free Status (SFS) using 26 features including demographic, clinical, renal, preoperative, and postoperative surgical variables. Then, dataset was split randomly into 7:3 for the training set (n = 224) and n = 96 for the testing set. Feature’s contribution in predicting SFS status was calculated using the permutation importance method, in which a higher decrease in mean accuracy represents higher importance in models’ predictions. Receiver Operating Characteristic (ROC) curves and Area Under the Curve (AUC) scores were calculated to evaluate the discriminatory power of different models. The roc_curve function from the sklearn.metrics module was employed to compute the False Positive Rate (FPR) and True Positive Rate (TPR) for each model. The predicted probabilities of the positive class were obtained using the predict_proba method of each model. The AUC scores were calculated using the roc_auc_score function. A custom plotting function plot_roc_curve was defined to visualize the ROC curves of multiple models. The model was also evaluated using Mean Bootstrap Estimate with a 95% Confidence Interval, 10-fold cross-validation, and classification report for precision, recall, and F1-score.
All three models were externally validated by data extracted from a previous similar study by Zhao et al with compatible variables that included 224 patients.8 The algorithm generated predictions for the instances in the validation dataset, and these predictions were compared to the actual outcomes to assess the model’s accuracy, mean bootstrap estimate, and AUC. The results obtained from this evaluation provide an estimate of the model’s generalizability to unseen data, thus helping to validate its effectiveness and applicability in real-world scenarios. All ML implementations were processed using the scikit-learn 0.18 package in Python.
Statistical Analysis
All data analyses were performed using the IBM Statistical Package for the Social Sciences (SPSS) software for Windows, version 26.0. Descriptive measures included means ± standard deviations for continuous data if the normality assumption was not violated, according to the Shapiro–Wilk test, and median with first and third quartiles (Q1–Q3) if the assumption was violated. Categorical data were presented by frequencies and percentages (%). Continuous data were compared using the Student t test in normally distributed variables and the Mann–Whitney U-test if not normally distributed. Categorical data were compared using the χ2 test or the Fisher's exact test if 1 cell had an expected count of less than 5. Variables included in the model were chosen based on a separate bivariate analysis, including all variables yielding a P value of <0.1. Nagelkerke R2 was used as a measure for the goodness-of-fit. The variables in the model were checked for multicollinearity using the variance inflation factor. Statistical significance was considered at a 2-sided P value of ≤.05.
Results
A total of 320 patients (222 males, 69.4%) were enrolled. The mean age was 46.03 ± 14.7 years, and the median (IQR) stone burden was 208.1 ± 231 mm2. Table 1 shows the preoperative variables including individual variables, renal and stone data. The patients comprised 92 non-stone-free cases and 228 stone-free cases. The distribution of GSS categories differed significantly between the Non-Stone-Free and Stone-Free groups (p < 0.0001). The Stone-Free group had higher proportions of patients in the GSS I, GSS II, and GSS III categories compared to the Non-Stone-Free group, which had a higher proportion of patients in the GSS IV category. The S.T.O.N.E score is another scoring system used to evaluate stone characteristics. Similar to GSS, the distribution of S.T.O.N.E score categories varied between the non-stone-free and stone-free groups. Higher S.T.O.N.E scores (9 and above) had a higher percentage in the non-stone-free group, compared to the stone-free group. The non-stone-free group had a higher median stone burden of 319.6 mm2, compared to 182.9 mm2 in the stone-free group. The stone burden within the non-stone-free group was nearly twice as large as that within the stone-free group, and this difference is statistically significant (p < 0.0001). Stone location accounted for statistically significant differences in the upper calyx, middle calyx, and lower calyx showing a higher percentage in non-stone-free compared with stone-free. Preoperative UTI had a higher percentage of 37% in the stone-free group compared with 22.4% in the non-stone-free group. No statistically significant differences were observed between the non-stone-free and stone-free groups for variables such as diabetes, hypertension, hyperlipidemia, unilateral kidney, renal insufficiency, anemia, and previous surgery on the target kidney (p > 0.05). Table 2 shows the postoperative data for these patients. The overall SFS was 71.3% (228/320). Table 3 presents the analysis of the impact of surgeon expertise on SFS in PCNL. The table provides a comparison of SFS across the three surgeon groups (A, B, and C). Among patients operated on by surgeon A, 65 (73%) were stone-free, indicating successful complete stone clearance. In contrast, 24 patients (27%) in this group were classified as non-stone-free, indicating the presence of residual stones >4 mm post-PCNL. In surgeon B, 75 (70%) of the patients were stone-free, while 32 (30%) were classified as non-stone-free. Surgeon C had 88 patients (71%) classified as stone-free, and 36 patients (29%) classified as non-stone-free. Figure 1 shows the stone-free rate in each subgroup of GSS grades and the S.T.O.N.E score systems.
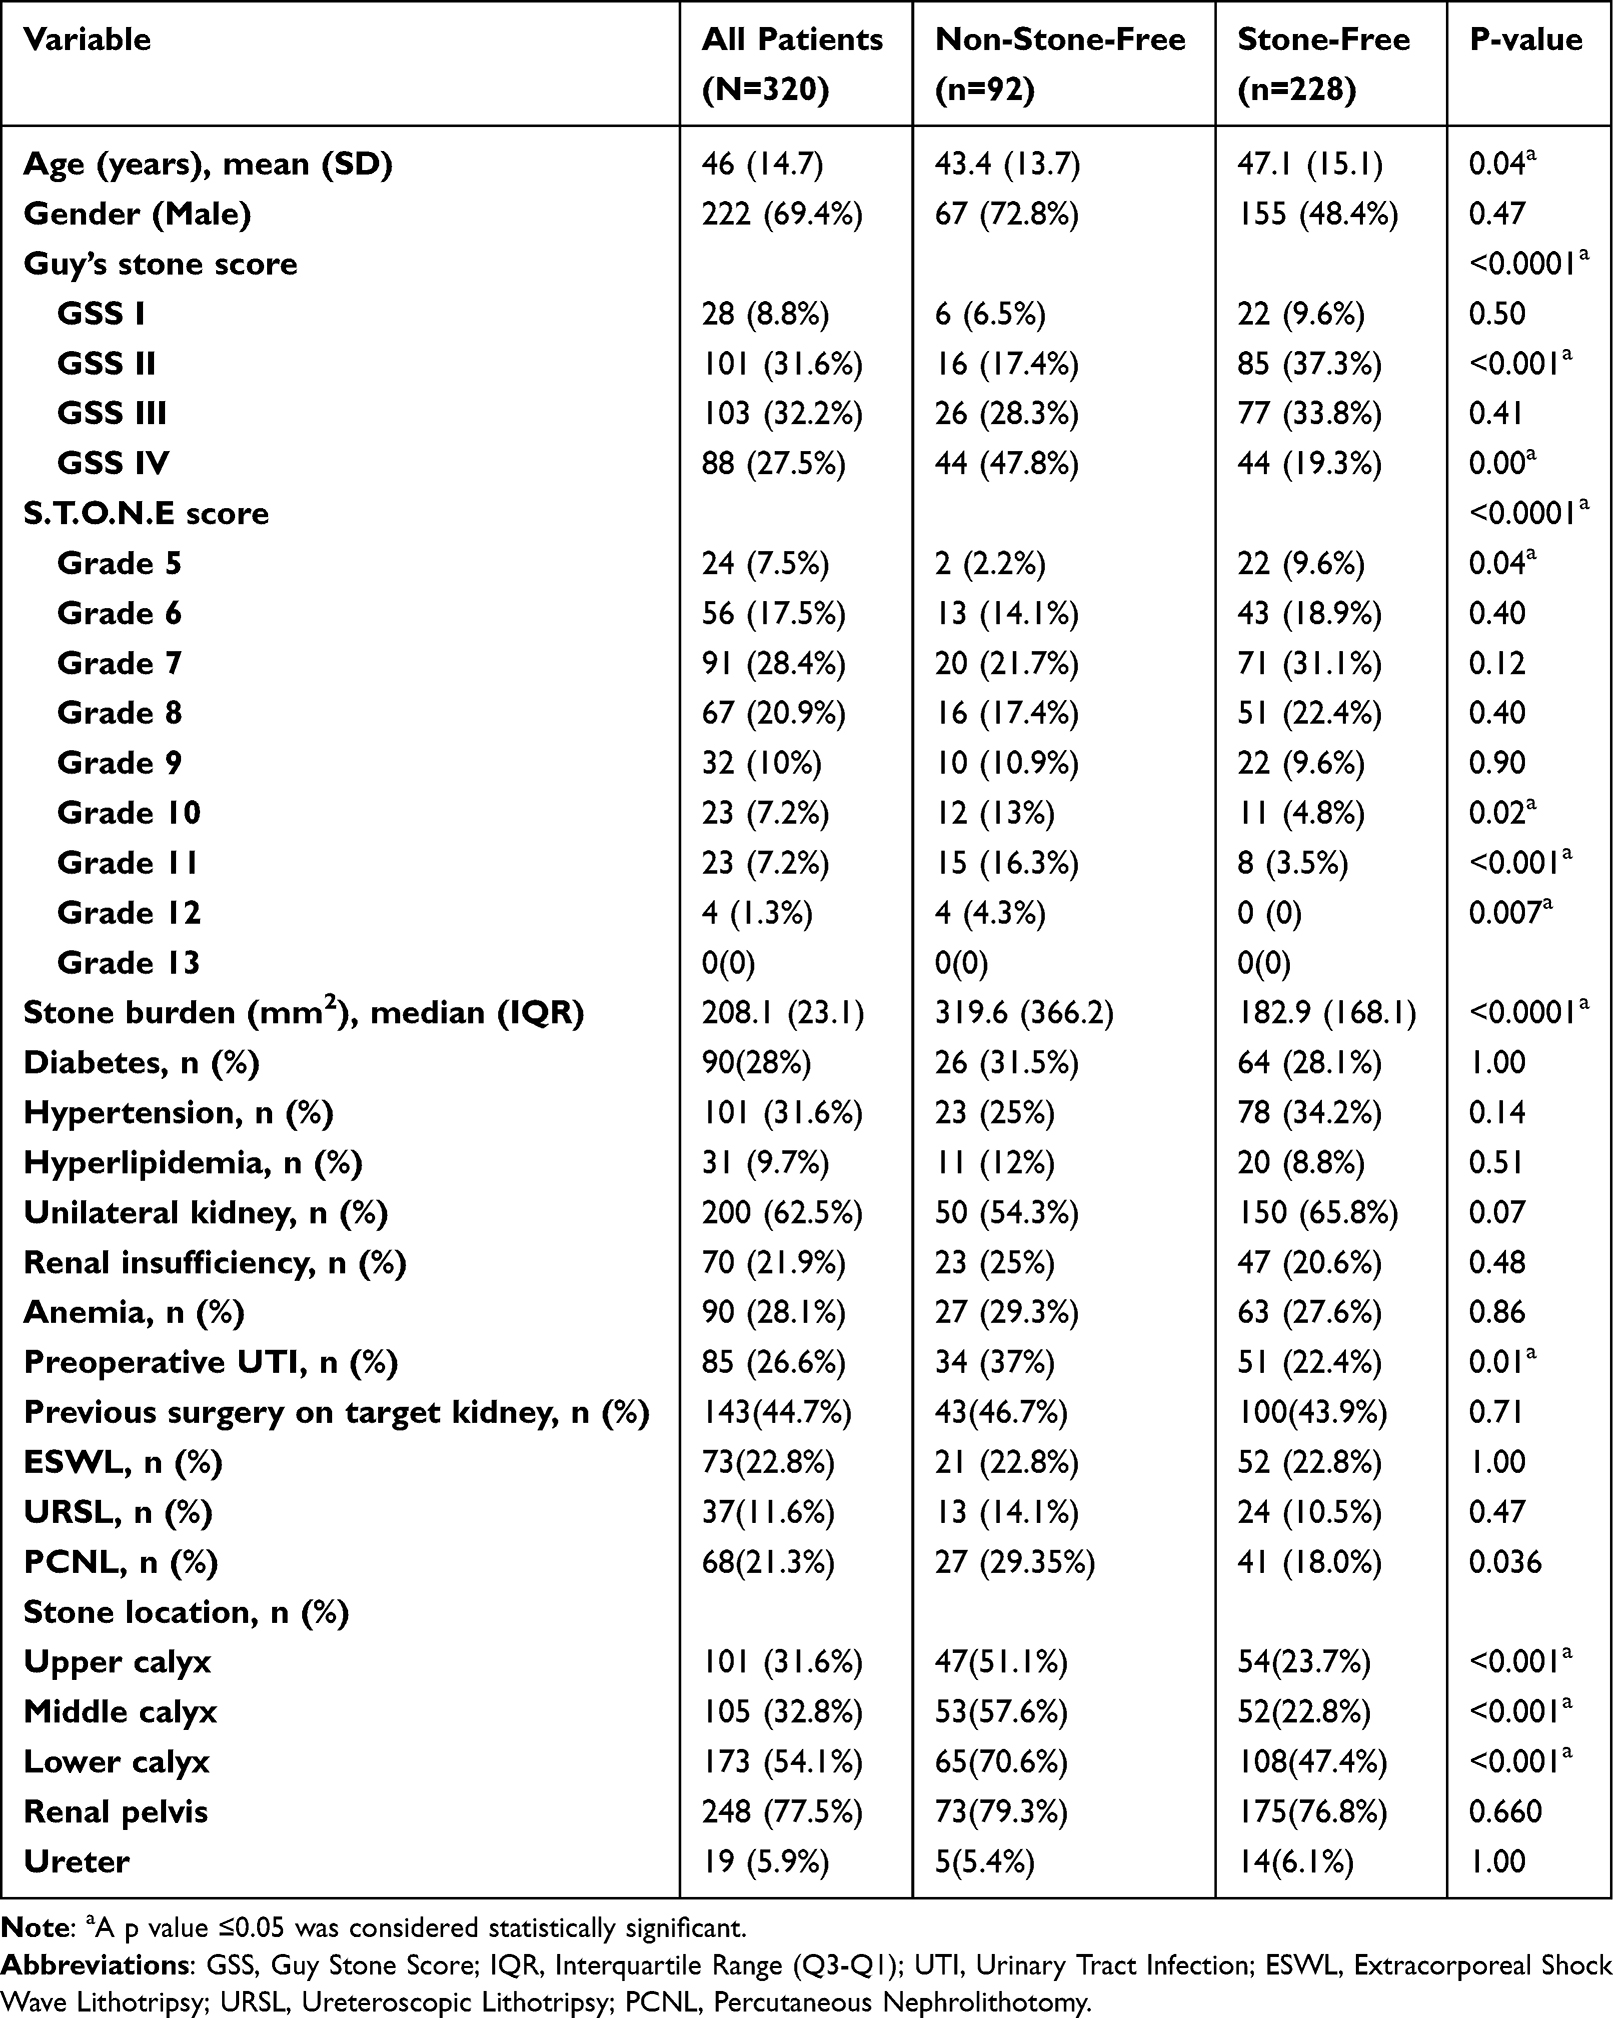 |
Table 1 Preoperative Factors Including Individual Variables and Renal Stone Factors |
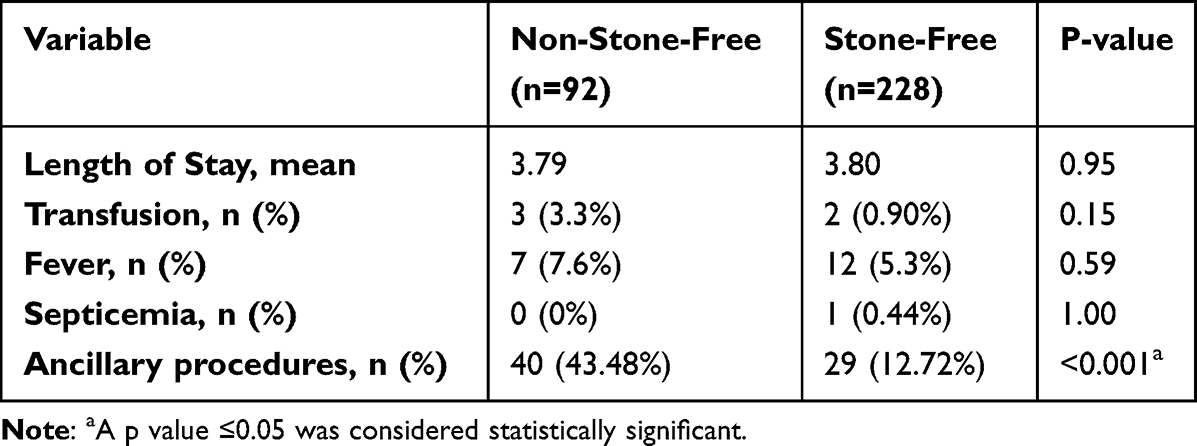 |
Table 2 Postoperative Outcome Variable (n = 320) |
 |
Table 3 Analyzing the Impact of Surgeon Expertise on SFS in PCNL |
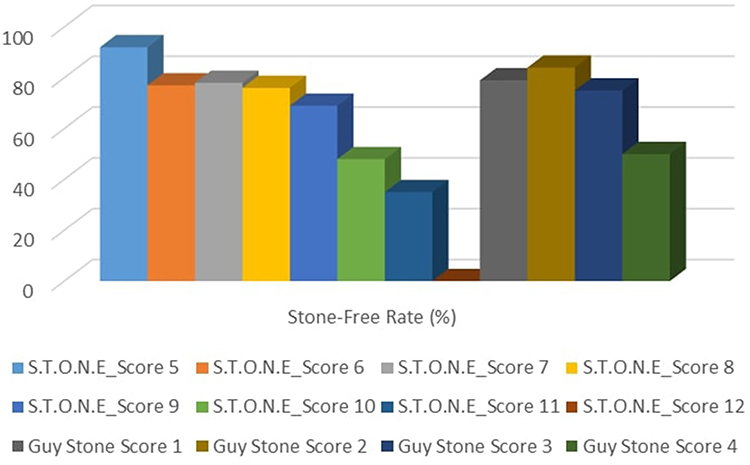 |
Figure 1 The stone-free rate in each subgroup of GSS grades and the S.T.O.N.E score systems. |
Predicting SFS Using ML
The RFC model was performed on the testing set with a mean bootstrap estimate of 0.75 and 95% CI: [0.65–0.85], 10-fold cross-validation of 0.744, an accuracy of 0.74, and an AUC of 0.761, while the XGBoost model predicted on the testing set with a mean bootstrap estimate of 0.74 and 95% CI: [0.63–0.85], 10-fold cross-validation of 0.759, the accuracy of 0.72, and AUC of 0.769. The SVM model performed with a mean bootstrap estimate of 0.70 and 95% CI: [0.60–0.79], 10-fold cross-validation of 0.725, an accuracy of 0.74, and an AUC of 0.751. On the other hand, Guy’s Score and S.T.O.N.E Score had an AUC of 0.666 and 0.71, respectively. The RFC model performed on the external validation set with a mean bootstrap estimate of 0.87 and 95% CI: [0.81–0.92], an accuracy of 0.70, and an AUC of 0.795, while the XGBoost model predicted on the external validation set with a mean bootstrap estimate of 0.84 and 95% CI: [0.78–0.91], an accuracy of 0.74, and an AUC of 0.84. The SVM model performed on the external validation set with a mean bootstrap estimate of 0.86 and 95% CI: [0.80–0.91], an accuracy of 0.79, and an AUC of 0.858. ROC curves of all MLMs are displayed in Figure 2. The most contributing features in predicting SFS in the RFC model are displayed in Figure 3. The highest contributing factor was stone burden, followed by the length of stay and age.
 |
Figure 2 The ROC curves of the three MLMs including the externally validated set and the GSS and S.T.O.N.E score system. |
 |
Figure 3 Results of feature importance analysis in the RFC model for predicting SFS of PCNL patient. |
Discussion
Nephrolithiasis is a common kidney disease with 1%–5% prevalence in Asia and 7%–13% in America, with a male predominance of ratio 1.5–2.5:1 [13–15]. Urinary lithiasis casts diagnostic, prognostic, and financial burdens, especially when a patient needs multiple imaging and surgical procedures.16 Therefore, we aimed to develop an MLM that can predict the postoperative outcome namely SFS in patients who underwent PCNL. Our models predicted the SFS with high accuracy and certainty using pre- and post-operative variables, marking the stone burden as the highest contributing predictor of SFS.
Among the factors considered in our predictive models, the length of hospital stay and age stand out as noteworthy contributors to the predictive capacity of the model. These findings underscore the dynamic nature of predicting SFS, revealing that beyond preoperative variables, factors associated with the postoperative trajectory can substantially influence outcome predictions. The inclusion of the length of stay, a postoperative parameter, lends valuable insights into the nuances of stone clearance efficacy and the recovery process. Our models demonstrate that patients who required a longer hospital stay were more likely to exhibit distinct stone burdens and procedural complexities, aligning with the clinical intuition that these patients may require additional care to achieve optimal outcomes. The predictive power of the length of hospital stay offers clinicians an early indicator of potential stone-related challenges, allowing for more targeted interventions and follow-up strategies.
Upon comparison of the stone burden between non-stone-free and stone-free groups, the non-stone-free group showed nearly double the stone burden, which was statistically significant. This disparity in stone burden between both groups could be due to the multifaceted challenges these larger stone burdens pose on PCNL procedures. These large burdens often indicate complex or multiple stone formations that hinder full access to the collecting system, therefore, preventing complete fragmentation which renders a lower rate of stone-free status.17
Upon closer examination, we observed a counterintuitive trend between age and SFS. Interestingly, the mean age of non-stone-free patients was lower than that of stone-free patients. It is important to note that the non-stone-free group consisted of 93 patients, whereas the stone-free group comprised 228 patients. This disparity in sample sizes could potentially influence the observed relationship, prompting us to consider the role of sample distribution in drawing conclusive insights. This observation prompts further investigation into the complex relationship between age, stone characteristics, and treatment outcomes. While age emerged as a contributing factor to our predictive models, the inverse relationship between age and SFS in our study warrants a deeper exploration of the underlying mechanisms. The relationship between age and SFS could potentially be attributed to a variety of factors. One possible explanation could be the differential distribution of stone types among different age groups. Age-related variations in stone composition, density, or structure might influence fragmentation behavior and clearance rates, subsequently affecting SFS outcomes. Moreover, physiological differences related to bone density, urinary dynamics, and kidney function across various age cohorts could contribute to the observed trend.
When compared to the conventional scoring systems, our model showed superior performance to Guy’s stone score and S.T.O.N.E score. The Guy’s stone score was first developed by Thomas et al and consists of four grades based on the location and number of stones.18 This score has been validated on many prospective PCNL procedures and was significantly correlated with the stone-free rate, whereas stone burden and patients’ demographic and clinical factors did not show any correlation19 and 0.69 for Guy’s stone score.20
A study by Zhao et al also assessed the predictive effect of demographic, pre- and post-operative renal variables on SFS using ML with similar performance to our model. The stone burden was also observed to be the highest contributing feature in their logistic regression model in addition to stone location.8 However, their model did not show superior performance to the S.T.O.N.E score but only to Guy’s score (RFC: 0.80, Guy’s score: 0.84, S.T.O.N.E score: 0.78). Our data was externally validated using this study, ensuring our results are generalized to the population. However, calculating the stone burden is not consistent across all studies, and there is no descriptive formula for its calculation. This presents heterogeneity and inconsistency in predicting SFS. In our study, the stone burden was calculated by the following formula: (maximum length × Maximum width × π × 0.25), which was also used by Smith et al.21 This, in turn, raises the need for a clearly defined model that considers interindividual variables and operative variables in addition to ethnic and racial. All studies have externally evaluated stone scoring systems in eastern and western societies, here we present the first study cohort which evaluated stone scores in a middle eastern society. Srivastava et al also evaluated the effect of inter-observer variability between surgeons and radiologists for Guy’s and S.T.O.N.E scores and studied the agreement using the Fleiss К coefficients. The overall S.T.O.N.E score showed good agreement between surgeons and radiologists (Fleiss К = 0.79) the same applies to Guy’s score for all grades with moderate to very good agreement (Fleiss К: Grade I = 0.91; Grade 2: 0.53; Grade 3: 0.61; Grade 4: 0.84).22
We were the only publication in our field to externally validate our data, ensuring the accuracy and reliability of our findings. This process involved an independent third-party review to verify the methodology and results, and by taking this extra step, we were able to provide further creditability to our conclusions. Overall, the use of statistical methods and Python programming in external validation helps to ensure the robustness and generalizability of the data and model. A strength of the study is that it considered additional variables such as age and pre-operative UTI, which were not included in GSS and S.T.O.N.E score.
Conclusion
The ML techniques employed in this study were able to predict the rate of successful stone removal with higher accuracy than the established GSS and S.T.O.N.E score systems, moreover, this study considered other variables that were not considered in the aforementioned scoring systems. When evaluated, all three MLMs were externally validated and showed high accuracy rates. The accuracy of the system for predicting the stone-free rate was found to be between 70 and 79% with an AUC between 0.751 and 0.858, compared to the AUC of GSS and S.T.O.N.E which were 0.67 and 0.71, respectively. All ML methods found that the factors that had the greatest impact on stone-free status were the initial stone burden, length of stay, and patient age.
Ethics Approval and Informed Consent
In accordance with the ethical guidelines and standards outlined in the Declaration of Helsinki, we hereby confirm that our study fully complies with these principles. The Research Committee of the Faculty of Medicine and the Institutional Review Board at Jordan University of Science and Technology (JUST) approved the study, and the Institutional Review Board provided the ethical approval (840-2022). The ethics committee approved a waiver of consent from the patients because the study did not include any therapeutic intervention and the outcomes planned are routinely registered in patients with nephrolithiasis.
Consent for Publication
The authors declare that they have followed all ethical and scientific standards when conducting their research and writing the manuscript and that all authors have approved the final version of the manuscript for submission.
Acknowledgments
We would like to thank Editage for English language editing.
Author Contributions
All authors made a significant contribution to the work reported, whether that is in the conception, study design, execution, acquisition of data, analysis and interpretation, or in all these areas; took part in drafting, revising or critically reviewing the article; gave final approval of the version to be published; have agreed on the journal to which the article has been submitted; and agree to be accountable for all aspects of the work.
Funding
This research received no external funding.
Disclosure
The authors of this article have carefully considered any potential conflicts of interest and have found none to report. They have no relevant financial or non-financial interests that could impact the article’s content, and they have no affiliations or involvement with any organizations with a financial or proprietary interest in the material discussed. The authors declare that they have no competing interests related to the manuscript’s subject matter and certify that they have no ties to any entity that could present a conflict.
References
1. Sorokin I, Mamoulakis C, Miyazawa K, Rodgers A, Talati J, Lotan Y. Epidemiology of stone disease across the world. World J Urol. 2017;35(9):1301–1320. doi:10.1007/s00345-017-2008-6
2. Abboud IA. Prevalence of Urolithiasis in Adults due to Environmental Influences: a Case Study from Northern and Central Jordan. Jordan J Earth Environ Sci. 2018;9(1):29–38.
3. Ganpule AP, Vijayakumar M, Malpani A, Desai MR. Percutaneous nephrolithotomy (PCNL) a critical review. Int J Surgery. 2016;36(PD):660–664. doi:10.1016/j.ijsu.2016.11.028
4. Kumar U, Tomar V, Yadav SS, et al. STONE score versus Guy’s Stone Score - Prospective comparative evaluation for success rate and complications in percutaneous nephrolithotomy. Urol Ann. 2018;10(1):76–81. doi:10.4103/UA.UA_119_17
5. Wu WJ, Okeke Z. Current clinical scoring systems of percutaneous nephrolithotomy outcomes. Nat Rev Urol. 2017;14(8):459–469. doi:10.1038/nrurol.2017.71
6. Zhernovoi I, Shchukin D, Jundi M, Grabs D, Maranzano J, Nayouf A. Comparison of four transdiaphragmatic approaches to remove cavoatrial tumor thrombi: a pilot study. Cent European J Urol. 2022;75(2):145–152. doi:10.5173/ceju.2022.0277.R1
7. Jiang K, Sun F, Zhu J, et al. Evaluation of three stone-scoring systems for predicting SFR and complications after percutaneous nephrolithotomy: a systematic review and meta-analysis. BMC Urol. 2019;19:1. doi:10.1186/s12894-019-0488-y
8. Zhao H, Li W, Li J, Li L, Wang H, Guo J. Predicting the Stone-Free Status of Percutaneous Nephrolithotomy With the Machine Learning System: comparative Analysis With Guy’s Stone Score and the S.T.O.N.E Score System. Front Mol Biosci. 2022;9. doi:10.3389/fmolb.2022.880291
9. Aminsharifi A, Irani D, Pooyesh S, et al. Artificial Neural Network System to Predict the Postoperative Outcome of Percutaneous Nephrolithotomy. J Endourol. 2017;31(5):461–467. doi:10.1089/end.2016.0791
10. Shabaniyan T, Parsaei H, Aminsharifi A, et al. An artificial intelligence-based clinical decision support system for large kidney stone treatment. Australas Phys Eng Sci Med. 2019;42(3):771–779. doi:10.1007/s13246-019-00780-3
11. Aminsharifi A, Irani D, Tayebi S, Jafari Kafash T, Shabanian T, Parsaei H. Predicting the Postoperative Outcome of Percutaneous Nephrolithotomy with Machine Learning System: software Validation and Comparative Analysis with Guy’s Stone Score and the CROES Nomogram. J Endourol. 2020;34(6):692–699. doi:10.1089/end.2019.0475
12. Hameed BMZ, Shah M, Naik N, Singh Khanuja H, Paul R, Somani BK. Application of Artificial Intelligence-Based Classifiers to Predict the Outcome Measures and Stone-Free Status Following Percutaneous Nephrolithotomy for Staghorn Calculi: cross-Validation of Data and Estimation of Accuracy. J Endourol. 2021;35(9):1307–1313. doi:10.1089/end.2020.1136
13. Collins GS, Reitsma JB, Altman DG, Moons K. Transparent reporting of a multivariable prediction model for individual prognosis or diagnosis (TRIPOD): the TRIPOD Statement. BMC Med. 2015;13(1):1. doi:10.1186/s12916-014-0241-z
14. TIBCO Software. What is a Random Forest? Available from: https://www.tibco.com/reference-center/what-is-a-random-forest.
15. Pushkar Mandot. How exactly XGBoost Works? 2019. Available from: https://medium.com/@pushkarmandot/how-exactly-xgboost-works-a320d9b8aeef.
16. Ziemba JB, Matlaga BR. Epidemiology and economics of nephrolithiasis. Investig Clin Urol. 2017;58(5):299–306. doi:10.4111/icu.2017.58.5.299
17. Rais-Bahrami S, Friedlander JI, Duty BD, Okeke Z, Smith AD. Difficulties with access in percutaneous renal surgery. Ther Adv Urol. 2011;3(2):59–68. doi:10.1177/1756287211400661
18. Thomas K, Smith NC, Hegarty N, Glass JM. The Guy’s Stone Score—Grading the Complexity of Percutaneous Nephrolithotomy Procedures. Urology. 2011;78(2):277–281. doi:10.1016/j.urology.2010.12.026
19. Noureldin YA, Elkoushy MA, Andonian S. External validation of the S.T.O.N.E. nephrolithometry scoring system. J Canadian Urol Assoc. 2015;9(6):190–195. doi:10.5489/cuaj.2652
20. Ingimarsson JP, Dagrosa LM, Hyams ES, Pais VM. External validation of a preoperative renal stone grading system: reproducibility and inter-rater concordance of the Guy’s stone score using preoperative computed tomography and rigorous postoperative stone-free criteria. Urology. 2014;83(1):45–49. doi:10.1016/j.urology.2013.09.008
21. Smith A, Averch TD, Shahrour K, et al. A nephrolithometric nomogram to predict treatment success of percutaneous nephrolithotomy. J Urol. 2013;190(1):149–156. doi:10.1016/j.juro.2013.01.047
22. Srivastava A, Yadav P, Madhavan K, et al. Inter-observer variability amongst surgeons and radiologists in assessment of Guy’s Stone Score and S.T.O.N.E. nephrolithometry score: a prospective evaluation. Arab J Urol. 2020;18(2):118–123. doi:10.1080/2090598X.2019.1703278
 © 2023 The Author(s). This work is published and licensed by Dove Medical Press Limited. The full terms of this license are available at https://www.dovepress.com/terms.php and incorporate the Creative Commons Attribution - Non Commercial (unported, v3.0) License.
By accessing the work you hereby accept the Terms. Non-commercial uses of the work are permitted without any further permission from Dove Medical Press Limited, provided the work is properly attributed. For permission for commercial use of this work, please see paragraphs 4.2 and 5 of our Terms.
© 2023 The Author(s). This work is published and licensed by Dove Medical Press Limited. The full terms of this license are available at https://www.dovepress.com/terms.php and incorporate the Creative Commons Attribution - Non Commercial (unported, v3.0) License.
By accessing the work you hereby accept the Terms. Non-commercial uses of the work are permitted without any further permission from Dove Medical Press Limited, provided the work is properly attributed. For permission for commercial use of this work, please see paragraphs 4.2 and 5 of our Terms.