")
Back to Journals » Patient Preference and Adherence » Volume 9
Pre- and in-therapy predictive score models of adult OSAS patients with poor adherence pattern on nCPAP therapy
Authors Li Y, Wang Y, Alan G , Chai Y, Luo J, Niu X, Hai B, Qin J
Received 18 February 2015
Accepted for publication 18 March 2015
Published 28 May 2015 Volume 2015:9 Pages 715—723
DOI https://doi.org/10.2147/PPA.S83105
Checked for plagiarism Yes
Review by Single anonymous peer review
Peer reviewer comments 4
Editor who approved publication: Dr Naifeng Liu
Yeying Wang,1,2 Alan F Geater,3 Yanling Chai,1 Jiahong Luo,2 Xiaoqun Niu,1 Bing Hai,1 Jingting Qin,1 Yongxia Li1
1Department of Respiratory Medicine, The 2nd Affiliated Hospital of Kunming Medical University, Kunming, Yunnan Province, People’s Republic of China; 2Department of Epidemiology and Biostatistics, School of Public Health, Kunming Medical University, Kunming, Yunnan Province, People’s Republic of China; 3Epidemiology Unit, Faculty of Medicine, Prince of Songkla University, Hat Yai, Songkhla, Thailand
Objectives: To identify patterns of adherence to nasal continuous positive airway pressure (nCPAP) use in the first 3 months of therapy among newly diagnosed adult patients with obstructive sleep apnea/hypopnea syndrome (OSAS) and their predictors. To develop pretherapy and in-therapy scores to predict adherence pattern.
Methods: Newly diagnosed adult OSAS patients were consecutively recruited from March to August 2013. Baseline clinical information and measures such as Epworth Sleepiness Scale (ESS), Fatigue Severity Scale (FSS), Zung’s Self-Rating Depression Scale (SDS), and The Pittsburgh Sleep Quality Index (PSQI) at baseline and at the end of 3rd-week therapy were collected. Twelve weeks’ adherence data were collected from the nCPAP memory card, and K-means cluster analysis was used to explore adherence patterns. Predictive scores were developed from the coefficients of cumulative logit models of adherence patterns using variables available at baseline and after 3 weeks of therapy. Performance of the score was validated using 500 bootstrap resamples.
Results: Seventy six patients completed a 12-week follow-up. Three patterns were revealed. Patients were identified as developing an adherence pattern that was poor (n=14, mean ± SD, 2.3±0.9 hours per night), moderate (n=19, 5.3±0.6 hours per night), or good (n=43, 6.8±0.3 hours per night). Cumulative logit regression models (good → moderate → poor) revealed independent baseline predictors to be ESS (per unit increase) (OR [95% CI], 0.763 [0.651, 0.893]), SDS (1.461 [1.238, 1.724]), and PSQI (2.261 [1.427, 3.584]); and 3-week therapy predictors to be ESS (0.554 [0.331, 0.926]), PSQI (2.548 [1.454, 4.465]), and the changes (3rd week–baseline data) in ESS (0.459 [0.243, 0.868]), FSS (3.556 [1.788, 7.070]), and PSQI (2.937 [1.273, 6.773]). Two predictive score formulas for poor adherence were developed. The area under the curve (AUC) of the receiver operating characteristics (ROC) curves for baseline and 3-week formulas were 0.989 and 0.999, respectively. Bootstrap analysis indicated positive predictive values of baseline and 3-week predictive scores in our patient population of 0.82 (95% CI [0.82, 0.83]) and 0.94 (95% CI [0.93, 0.94]), respectively.
Conclusion: A high level of prediction of poor adherence pattern is possible both before and at the first 3 weeks of therapy. The predictive scores should be further evaluated for external validity.
Keywords: OSAS, adherence, nCPAP, predictive model, K-means cluster analysis, bootstrap analysis
Background
Obstructive sleep apnea/hypopnea syndrome (OSAS) is a common sleep disorder characterized by repetitive obstruction of the upper airway that occurs in 2%–14% of adult populations1–3 and 1% of pediatric age children,4,5 and causes oxygen desaturation and arousals from sleep.6 OSAS has been reported to be an independent risk factor of cardiovascular diseases,7,8 traffic accidents caused by excessive daytime sleepiness (EDS),9,10 and executive dysfunction11,12 and depression in both adults and children.13,14 Continuous positive airway pressure (CPAP) therapy has been demonstrated to be effective in treating OSAS by keeping the upper airway open and reducing the events of apnea/hypopnea.15 However, the effectiveness of CPAP therapy depends on good adherence to CPAP use, such as using it for more than 4 hours per night during sleep.16,17 Only 40%–80% of OSAS patients have been reported to meet this minimum of 4 hours.18–23
To evaluate patients’ adherence, most studies adopted a mean of CPAP use per night between two time points and predefined adherence as a mean of over 4 hours per night.18–20 Another approach to evaluating adherence has been used in some prospective studies,24,25 which have described a long-term time-series trend of adherence to CPAP use and then defined patients’ adherence on the bases of patterns over time, such as good adherence pattern, consistent pattern, etc.
Previous studies have found that nonadherence to CPAP use was influenced not only by pretherapy factors such as demography (ie, age, sex),21,23,26,27 baseline clinical information (ie, apnea/hypopnea index [AHI], EDS, sleep quality),19,21,28–32 and psychological factors (ie, depression),30,33 but also by in-therapy variables such as the improvement of symptoms34 and early adherence.20,35 While these studies have yielded valuable information on factors affecting adherence, as far as is known, none has applied the findings to develop a practical score that can be used to predict the pattern of adherence to CPAP use and to identify patients likely to develop a poor adherence pattern. Such patients could then be targeted for investigation of individual problems and for further encouragement in CPAP use.
The aims of this study, therefore, were to identify patterns of CPAP use in the first 12 weeks of therapy, and to develop practical scores that can be used, before or after the start of therapy, to predict poor adherence in a population of adult Chinese patients with OSAS.
Methods
Subjects
Using the guideline for OSAS diagnosis and therapy,36 newly diagnosed OSAS patients aged 18 years or more were consecutively recruited from March to August 2013, at the Sleep Center of The First People’s Hospital of Yunnan Province, and the Department of Respiratory Medicine of The Second Affiliated Hospital of Kunming Medical University. Patients were excluded if they did not start nasal CPAP (nCPAP) therapy within 30 days after the titration trial at the sleep center.
Sleep test
The diagnostic polysomnography (Alice 5; Respironics, PA, USA) included electroencephalography, electrooculography, chin electromyography, airflow at the nose and mouth, abdominal and chest movements, electrocardiography, sleep position, and snoring frequency. An apneic episode was defined as a complete cessation of airflow or reduction in airflow by more than 90% of the baseline for at least 10 s, and a hypopneic episode was defined as a reduction in airflow by more than 30% of the baseline for at least 10 s in association with a fall in arterial oxygen saturation of at least 4%; or 50% of the baseline for at least 10 s in association with a fall in arterial oxygen saturation of at least 3%.36
Data collection
Demographic data, height, weight, circumferences of neck, and waist and hip of each subject were recorded at the beginning of the study. Subjective daytime sleepiness, fatigue, depression, and sleep quality were measured using the Epworth Sleepiness Scale (ESS),37 Fatigue Severity Scale (FSS),38 Zung’s Self-Rating Depression Scale (SDS),39 and The Pittsburgh Sleep Quality Index (PSQI)40 before the onset of therapy and at the end of the 3rd week of therapy from the date of starting nCPAP therapy. To simplify the development of predictive scores, the integer values of FSS and SDS scales were used. Use of nCPAP was recorded by a memory card in the nCPAP, which stored the daily information on the times at pressure. Subjects were recommended to bring the nCPAP to the clinics to download the records at the end of the 12th week.
The protocol of this study was approved by the Ethics Committees of Prince of Songkla University and The Second Affiliated Hospital of Kunming Medical University. Informed consent was taken from all eligible participants.
Analysis
K-means cluster analysis was used to identify the patterns of adherence. The K-means method aims to partition the data into k groups such that the sum of squares from data within the assigned clusters is minimized.41 Thus, we used the value of the between-cluster sum of squares (bss) divided by the total sum of squares (tss) as well as the number of subjects in the smallest cluster to decide on the optimum number of clusters to be selected. The number of clusters providing a high ratio of bss/tss but with a sufficient number of subjects in the smallest cluster to enable meaningful multivariate analysis to be undertaken was chosen. Ultimately, three clusters were chosen as optimal.
The potential predictor variables were then compared across the three clusters using the ANOVA F-test, Fisher’s exact test, or Kruskal–Wallis test, depending on the distribution of data. Paired t-test and Wilcoxon signed rank test were used to compare baseline data with the end of 3rd-week data. On the basis of the results of univariate analyses, variables were selected for inclusion in initial cumulative logit regression models to identify the independent predictors of adherence pattern, first using variables available at baseline and then those available after the first 3 weeks of therapy. Model refinement was conducted using manual backward exclusion, sequentially removing variables not contributing significantly to the fit of the model based on the change in log likelihood of successive models. All the significance tests were two-sided, and P-values less than 0.05 were considered as indicating statistical significance.
To develop a practical tool to predict adherence pattern, integer value weights were then allocated in place of the coefficients from the cumulative logit models, maintaining approximately the same ratios as among the coefficients. The sum of the weighted predictors was calculated for each patient and used as the single predictor in binary logistic models to predict the outcome of poor adherence pattern. Receiver operating characteristics (ROC) curves were constructed to demonstrate the discriminating ability of each model.
A suitable cut-off point was then chosen for each model. The cut-off points selected were those corresponding in our sample to the maximum specificity for which the sensitivity was 100%. Performance of the predictive models using these cut-off points was then explored by applying them to 500 bootstrap resamples created from our original sample.
Results
Eighty newly diagnosed OSAS patients were recruited in this study; four patients were lost to follow-up, one at the 3rd week and three at the 9th week. The remaining 76 patients finished the 12-week follow-up, giving a completion rate of 95%. Among these 76 patients, comprising 58 males and 18 females, the mean age was 48.1 years (range: 18–78) and mean AHI was 51.2 hour−1 (range: 15.0–138.0). The overall mean of the average duration of nightly use of nCPAP during 12 weeks of follow-up was 5.60 hours (range: 1.17–7.44) and within each 3-week period was 5.45 hours (range: 3.06–6.74) in weeks 1–3, 5.48 hours (range: 0.30–7.89) in weeks 4–6, 5.70 hours (range: 0.00–8.09) in weeks 7–9, and 5.78 hours (range: 0.45–7.76) in weeks 10–12. The 3-week average nightly adherences in each patient of the 12 weeks of study are shown in Figure 1A.
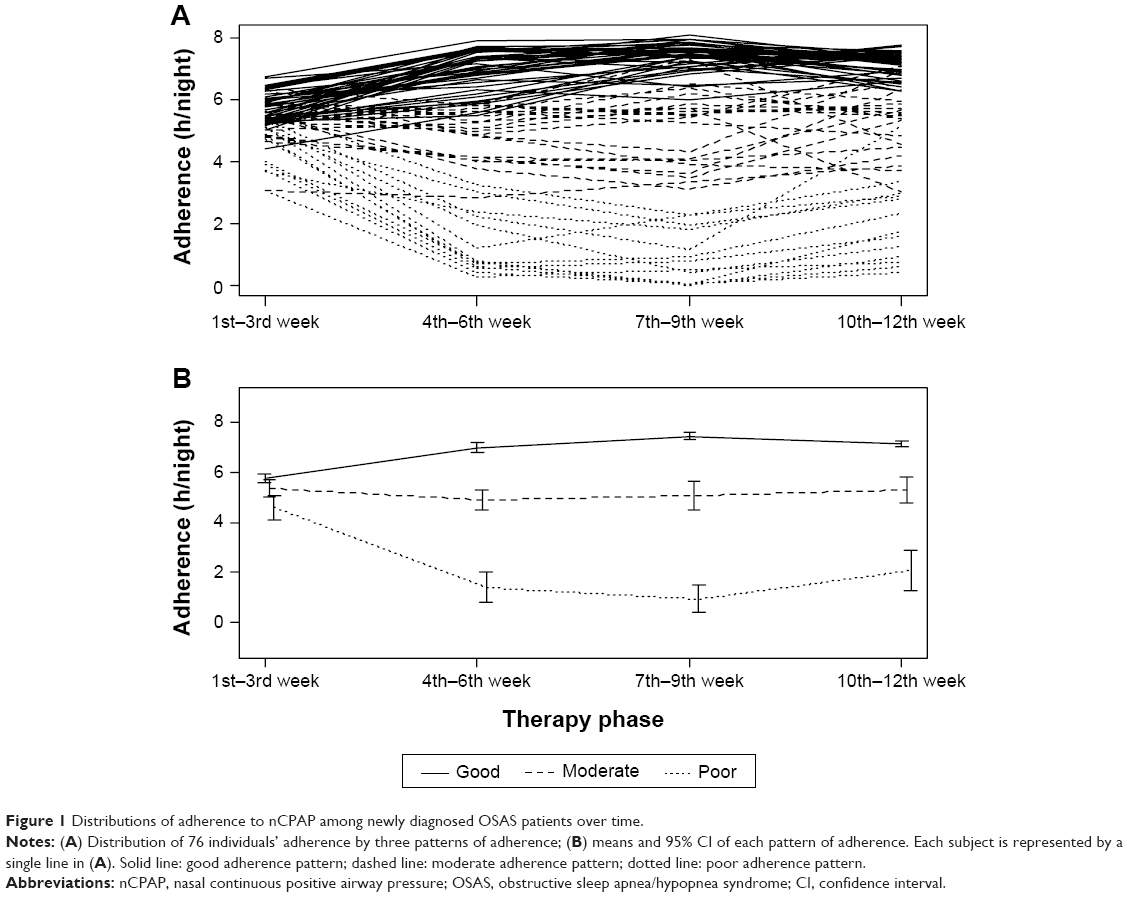 | Figure 1 Distributions of adherence to nCPAP among newly diagnosed OSAS patients over time. |
The values of bss/tss, and the number of subjects in the smallest cluster for different cluster numbers in the K-means cluster analysis are shown in Table 1. The three-cluster model was chosen, and the adherence patterns of the patients in each of these clusters are distinguished in Figure 1, the patterns constituting an ordinal set. Fourteen patients (18.4%) formed a cluster with a noticeably declining adherence after the 3rd week and are referred to henceforth as having a poor adherence pattern (“poor pattern”), 19 patients (25%) tended to maintain their initial levels of adherence (“moderate pattern”), and 43 (56.6%) patients developed a noticeably improved adherence after the 3rd week (“good pattern”). The within-cluster means of average 3-week nightly adherence are indicated in Figure 1B. From the 4th to the 12th week, the within-cluster means (SD) of 3-week average nightly mean hours CPAP use for poor, moderate, and good patterns were 1.61 (1.06), 5.47 (0.71), and 7.18 (0.35).
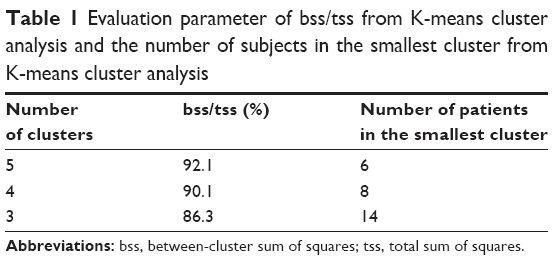 | Table 1 Evaluation parameter of bss/tss from K-means cluster analysis and the number of subjects in the smallest cluster from K-means cluster analysis |
Table 2 shows the values of variables according to the three adherence patterns identified by the K-means cluster analysis. The poor adherence group comprised a relatively larger proportion of females than the moderate and good groups. At baseline, two important measures of daytime symptoms, ESS and FSS scores, showed no significant difference among the three patterns, but those developing a poor adherence had worse depression. The measures of nocturnal symptoms, AHI and sleep quality score, differed significantly across the patterns. Patients with poor adherence pattern had a relatively lower AHI but worse sleep quality. After 3 weeks of therapy, the subjective feeling of sleepiness measured by the ESS score dramatically declined to a similar level among the three groups but with a significantly different absolute change across the three groups. The change in the FSS score showed not only a significant difference among the three groups but also an ordinal trend across the three adherence patterns. A similar trend to that of the FSS score was seen in the change in the SDS score, but with no change in the poor adherence group. Sleep quality in the poor adherence group showed no significant change after 3 weeks of therapy, a slightly increased (worse) score in moderate adherence, and a decreased (improved) score in the good adherence group (Table 2).
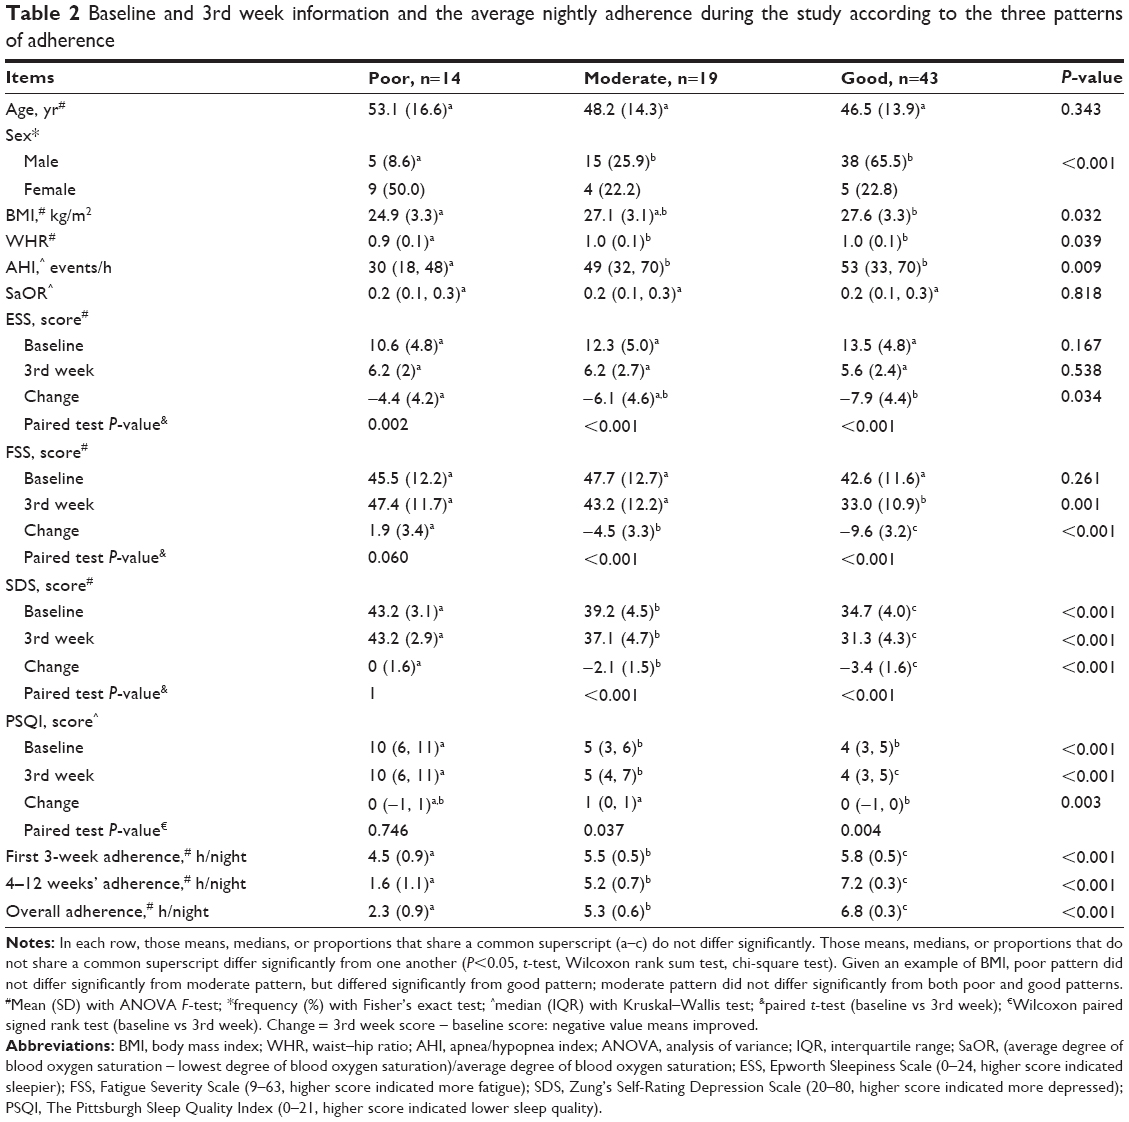 | Table 2 Baseline and 3rd week information and the average nightly adherence during the study according to the three patterns of adherence |
On the basis of the results of the univariate analyses, all baseline variables except ratio of blood oxygen saturation were included in an initial cumulative logit model to identify pretherapy predictors of the three adherence patterns (good → moderate → poor). After model refinement, ESS, SDS, and PSQI remained. Worse daytime sleepiness (higher score) (OR =0.763, 95% CI: 0.651, 0.893) favored a better adherence pattern, whereas worse depression (higher score) (OR =1.461, 95% CI: 1.238, 1.724) and worse sleep quality (higher score) (OR =2.261, 95% CI: 1.427, 3.584) favored a poorer adherence pattern (Table 3).
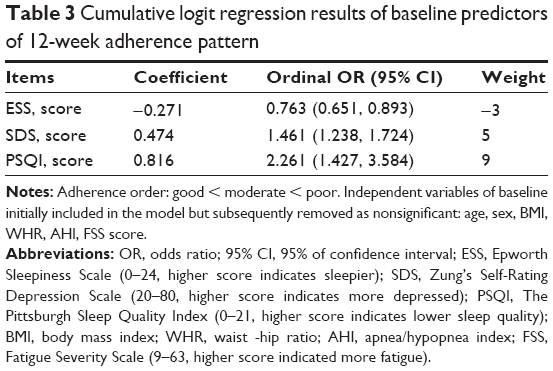 | Table 3 Cumulative logit regression results of baseline predictors of 12-week adherence pattern |
Nine baseline variables, the average adherence hours of nCPAP during the 1st to 3rd week, and the changes in ESS, FSS, SDS, and PSQI scores were considered potential in-therapy predictors of three adherence groups and were included in a second initial cumulative logit model. After model refinement, five variables, namely, baseline ESS and PSQI scores and the changes in the scores of ESS, FSS, and PSQI, were identified as statistically significant independent predictors. Worse daytime sleepiness (higher score) (OR =0.554, 95% CI: −0.331, 0.926) at baseline and worsening sleepiness (positive value of change) (OR =0.459, 95% CI: 0.243, 0.868) in the first 3 weeks favored improved subsequent adherence. By contrast, poorer baseline sleep quality (higher score) (OR =2.548, 95% CI: 1.454, 4.465) and worsening sleep quality in the first 3 weeks (positive value of change) (OR =2.937, 95% CI: 1.273, 6.773) favored poorer subsequent adherence. Worsening fatigue in the first 3 weeks (positive value of change) (OR =3.556, 95% CI: 1.788, 7.070) was associated with a poorer pattern of adherence (Table 4).
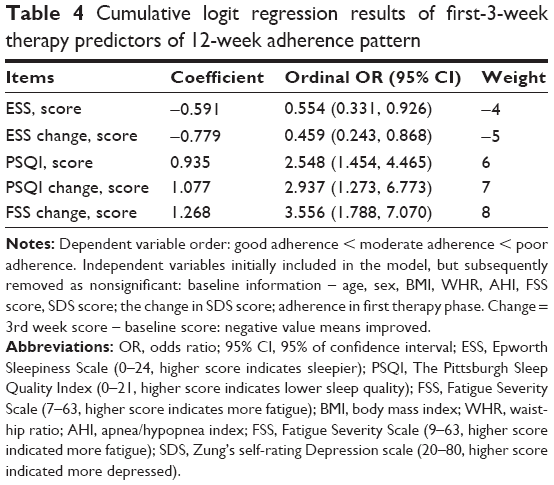 | Table 4 Cumulative logit regression results of first-3-week therapy predictors of 12-week adherence pattern |
For practical application, the allocated weights for each variable in the models, shown in Tables 3 and 4, were used to combine the identified predictor variables into single scores for each patient. The distributions of these scores for each of the three adherence patterns are shown in Figure 2. The scores were then used as the single predictor in binary logistic models in which the outcome was poor adherence pattern compared with moderate or good adherence pattern. ROC curves of both models had high area under the curve (AUC) (0.989 and 0.999, respectively) (P=0.166, chi-square test) (Figure 3). The corresponding equations for the predictive scores, therefore, were
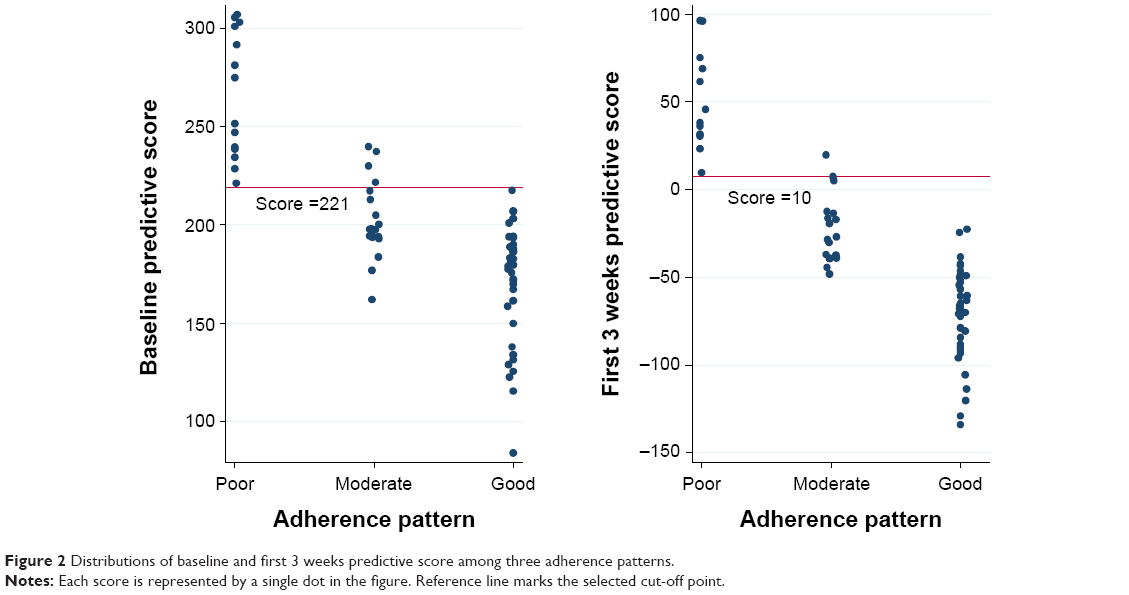 | Figure 2 Distributions of baseline and first 3 weeks predictive score among three adherence patterns. |
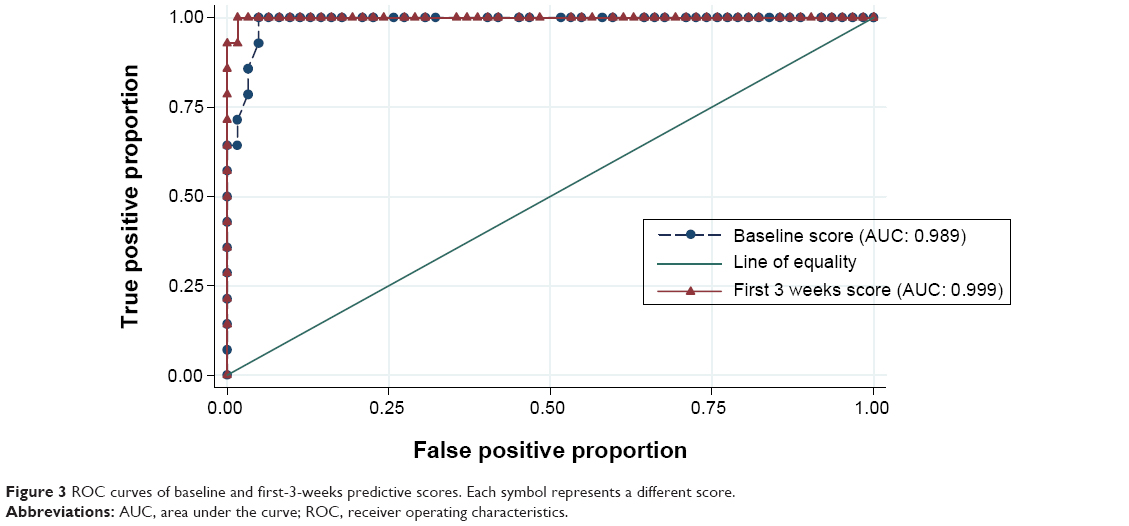 | Figure 3 ROC curves of baseline and first-3-weeks predictive scores. Each symbol represents a different score. |
PSbase = −3× ESS score +5× SDS score +9× PSQI score; |
and
PS3wks = −4× ESS score +6× PSQI score −5× the changes of ESS score +8× the changes of FSS score +7× the changes of PSQI score. |
From each ROC curve, a suitable cut-off point was chosen to explore the predictive ability of each score. The point chosen was that corresponding to the lowest false positive proportion consistent with 100% true positive proportion in our data set. These points were <221/≥221for the baseline score and <10/≥10 for the 3-week score. Evaluation of the predictive performance of these scores and the corresponding cut-off points revealed that 95% of the values of positive predictive value lay between 0.815 and 0.832 for the baseline model and between 0.930 and 0.942 for the 3-week model (Table 5).
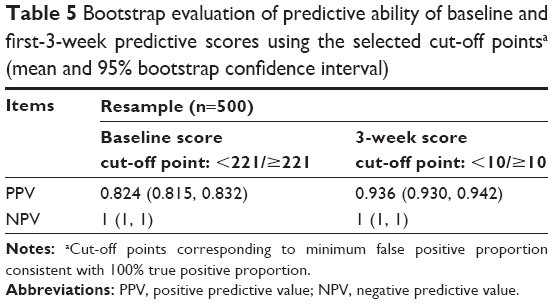 | Table 5 Bootstrap evaluation of predictive ability of baseline and first-3-week predictive scores using the selected cut-off pointsa (mean and 95% bootstrap confidence interval) |
Discussion
Three distinct patterns of adherence to CPAP use among adult Chinese patients with OSAS in the first 3 months of therapy were identified – those developing a poor level, those maintaining a moderate level, and those developing a good level of adherence. Practical scores that can be easily computed on the basis of ESS, SDS, and PSQI before start of therapy and based on baseline ESS and PSQI and change from baseline after the first 3 weeks of therapy in ESS, FSS, and PSQI were constructed, and each score was demonstrated to have a high predictive ability to identify patients with poor adherence pattern in a population similar to that providing the sample used in this study.
Adherence to CPAP use has been studied for decades, with most studies evaluating patients’ adherence using an average nightly adherence over the whole study period. The average values have then been compared with those previously identified as being correlated with clinical outcome.16,17 Thus, an average nightly adherence of >7 hours was considered to be optimal adherence, 4 to ≤7 hours to be suboptimal, and <4 hours to be nonadherence.16,17
Similar to our study, Aloia et al25 identified patterns of adherence among 71 patients in the USA from nightly records over 1 year to which they applied time-series analysis. The results of analysis were used to allocate patients to different patterns by two independent observers. In this way, seven different patterns were distinguished – good users, slow improvers, slow decliners, variable users, occasional attempters, early dropouts, and nonusers. However, no practical scoring system was developed in their study.
An interesting finding of the current study is that the timing of divergence of the patterns into good, moderate, and poor adherence was first apparent in the 4th- to 6th-week period. This phenomenon suggests that particular attention to monitoring adherence should be paid toward the end of the first 3 weeks of therapy.
Consistent with recent studies,18,19,21,30,42 neither sex nor age was identified as an independent predictor of adherence in our study after adjusting for sleep-related parameters, even though 50% of the females had a poor adherence pattern, compared with only 9% of the males. Other potential risk factors of OSAS, such as high body mass index (BMI) and waist–hip ratio (WHR), were also not significant in the final models, again consistent with other recent studies.18,19,21,30,42
The disease severity index, AHI, also was not a statistically significant predictor of adherence in this study. Similar results have been reported by others.19,43,44 Compared with significant independent adherence predictors of this study, namely, ESS, SDS, and PSQI, the nonsignificance of AHI could be explained as being due to the lack of awareness of sleep apnea/hypopnea, which might not be easily detected by the patients or their bed partners during night time, or as being due to the effects of AHI rather than AHI itself that influenced the level of adherence. High levels of daytime sleepiness are self-evident in the daytime6,9,10 and may encourage OSAS patients to adhere to the therapy;23,29 ESS correspondingly contributes a negative weight to the predictive score. By contrast, poor sleep quality contributed a positive weight score to the predictive score. Poor sleep quality may cause patients to blame the poor quality on using the CPAP and thus avoid its use to ensure sleep quality. Low mood, which also has a positive score, also might cause a negative attitude toward the use of CPAP. Means et al33 indicated that depression could reduce CPAP use hours.
In our 3-week model, average nightly adherence during the first 3 weeks was not a significant predictor independent of the parameters retained in the model, despite its differing significantly across the three adherence groups in univariate analysis, and has been reported to be related to subsequent adherence in other studies.20,35 This suggests that the characteristics of daytime sleepiness, fatigue, and sleep quality are stronger predictors of overall adherence pattern than the early adherence. In terms of a practical score to predict subsequent adherence, the lack of a requirement to consider the first 3 weeks of adherence is something of an advantage, as to reliably measure adherence would require the information to be read from the smart card of the CPAP device, which in turn would require the patient to bring in the card or the device and for the availability of a card reader. Using a clinical scale may be simpler.
Improvements in fatigue and sleep quality after the first 3 weeks of therapy were related to better adherence in this study. Previous studies have also indicated that when patients feel they have benefited from34 or are satisfied35 with CPAP therapy, they tend to increase their use of CPAP. Unexpectedly, an improvement in ESS (negative change) over the first 3 weeks was associated with a greater probability of being a poor adherer in our 3-week model. The explanation is that, while improvement on ESS was correlated with an improvement in FSS, change in FSS was more strongly related than ESS to adherence pattern; including both predictors resulted in a change in the direction of influence of ESS on adherence pattern.
Practical numerical scores to predict outcome have been developed for many different clinical settings,45,46 although, to our knowledge, not previously for adherence to CPAP therapy.
A strength of our study is the use of an objective method to identify adherence patterns, the use of multiple regression models and integer weights to generate the predictive scores, and the evaluation of the predictive ability of the scores using a bootstrap approach,47,48 which avoids the tendency to overestimate the quality of a proposed prediction tool.
Of the two scores, that for use before start of therapy and that for use after the first 3 weeks of therapy, the latter seems, not surprisingly, to have somewhat better predictive ability. A shortcoming of using the 3-week score, however, is the delay in identifying probable poor adherers. A previous study35 reported that about 22% of the patients refused to continue therapy after 2 weeks’ trial. Thus, using the baseline score could help to identify high-risk patients before they develop poor adherence or nonadherence.
In conclusion, two simple scores with a high predictive ability to identify patients who are likely to develop poor adherence to nCPAP use have been constructed. The scores require the results of ESS, FSS, SDS, and PSQI scales, each of which is simple to administer at a clinic visit. Application of these scales is expected to increase the cost-effectiveness of interventions for patients with OSAS. Although these scores were developed for adult Chinese patients, these or similar scores could be developed for OSAS patients among other populations. Further investigation to evaluate the external validity of such scores is suggested.
Acknowledgments
This study was supported by the Yunnan Provincial Science and Technology Department (2011CZ048) and the National Natural Science Foundation of China (81460017). The study was conducted in partial fulfillment of the requirements of PhD degree in Epidemiology of the first author at Prince of Songkla University.
Disclosure
All the authors report no conflicts of interest in this study.
References
Peppard PE, Young T, Barnet JH, Palta M, Hagen EW, Hla KM. Increased prevalence of sleep-disordered breathing in adults. Am J Epidemiol. 2013;177:1006–1014. | ||
Kim J, In K, Kim J, et al. Prevalence of sleep-disordered breathing in middle-aged Korean men and women. Am J Respir Crit Care Med. 2004;170:1108–1113. | ||
Young T, Palta M, Dempsey J, Skatrud J, Weber S, Badr S. The occurrence of sleep-disordered breathing among middle-aged adults. N Engl J Med. 1993;328:1230–1235. | ||
Brunetti L, Rana S, Lospalluti ML, et al. Prevalence of obstructive sleep apnea syndrome in a cohort of 1,207 children of southern Italy. Chest. 2001;120(6):1930–1935. | ||
Bixler EO, Vgontzas AN, Lin HM, et al. Sleep disordered breathing in children in a general population sample: prevalence and risk factors. Sleep. 2009;32(6):731–736. | ||
American Academy of Sleep Medicine. International Classification of Sleep Disorders, Revised: Diagnostic and Coding Manual. Chicago, IL: American Academy of Sleep Medicine; 2001. | ||
McNicholas WT, Bonsigore MR; Management Committee of EU COST ACTION B26. Sleep apnoea as an independent risk factor for cardiovascular disease: current evidence, basic mechanisms and research priorities. Eur Respir J. 2007;29:156–178. | ||
Marin JM, Carrizo SJ, Vicente E, Agusti AG. Long-term cardiovascular outcomes in men with obstructive sleep apnoea-hypopnoea with or without treatment with continuous positive airway pressure: an observational study. Lancet. 2005;365:1046–1053. | ||
Lloberes P, Levy G, Descals C, et al. Self-reported sleepiness while driving as a risk factor for traffic accidents in patients with obstructive sleep apnoea syndrome and in non-apnoeic snorers. Respir Med. 2000;94:971–976. | ||
Lindberg E, Carter N, Gislason T, Janson C. Role of snoring and daytime sleepiness in occupational accidents. Am J Respir Crit Care Med. 2001;164:2031–2035. | ||
Saunamaki T, Himanen SL, Polo O, Jehkonen M. Executive dysfunction in patients with obstructive sleep apnea syndrome. Eur Neurol. 2009;62(4):237–242. | ||
Esposito M, Antinolfi L, Gallai B, et al. Executive dysfunction in children affected by obstructive sleep apnea syndrome: an observational study. Neuropsychiatr Dis Treat. 2013;9:1087–1094. | ||
Gylen E, Anttalainen U, Saaresranta T. Relationship between habitual sleep duration, obesity and depressive symptoms in patients with sleep apnoea. Obes Res Clin Pract. 2014;8(5):e459–e465. | ||
Carotenuto M, Esposito M, Parisi L, et al. Depressive symptoms and childhood sleep apnea syndrome. Neuropsychiatr Dis Treat. 2012;8:369–373. | ||
Gay P, Weaver TE, Loube D, Iber C. Evaluation of positive airway pressure treatment for sleeprelated breathing disorders in adults. Sleep. 2006;29:381–401. | ||
Weaver TE, Maislin G, Dinges DF, et al. Relationship between hours of CPAP use and achieving normal levels of sleepiness and daily functioning. Sleep. 2007;30(6):711–719. | ||
Antic NA, Catcheside P, Buchan C, et al. The effect of CPAP in normalizing daytime sleepiness, quality of life, and neurocognitive function in patients with moderate to severe OSA. Sleep. 2011;34(1):111–119. | ||
Ye L, Pack AI, Maislin G, et al. Predictors of continuous positive airway pressure use during the first week of treatment. J Sleep Res. 2012;21(4):419–426. | ||
Wallace DM, Vargas SS, Schwartz SJ, Aloia MS, Shafazand S. Determinants of continuous positive airway pressure adherence in a sleep clinic cohort of South Florida Hispanic veterans. Sleep Breath. 2013;17(1):351–363. | ||
Budhiraja R, Parthasarathy S, Drake CL, et al. Early CPAP use identifies subsequent adherence to CPAP therapy. Sleep. 2007;30(3):320–324. | ||
Alves C, Caminha JM, da Silva AM, Mendonca D. Compliance to continuous positive airway pressure therapy in a group of Portuguese patients with obstructive sleep apnea syndrome. Sleep Breath. 2012;16(2):555–562. | ||
Lewis KE, Seale L, Bartle IE, Watkins AJ, Ebden P. Early predictors of CPAP use for the treatment of obstructive sleep apnea. Sleep. 2004;27(1):134–138. | ||
Sin DD, Mayers I, Man GC, Pawluk L. Long-term compliance rates to continuous positive airway pressure in obstructive sleep apnea: a population-based study. Chest. 2002;121(2):430–435. | ||
Kribbs NB, Pack AI, Kline LR, et al. Objective measurement of patterns of nasal CPAP use by patients with obstructive sleep apnea. Am Rev Respir Dis. 1993;147(4):887–895. | ||
Aloia MS, Goodwin MS, Velicer WF, et al. Time series analysis of treatment adherence patterns in individuals with obstructive sleep apnea. Ann Behav Med. 2008;36(1):44–53. | ||
Woehrle H, Graml A, Weinreich G. Age- and gender-dependent adherence with continuous positive airway pressure therapy. Sleep Med. 2011;12(10):1034–1036. | ||
Janson C, Noges E, Svedberg-Randt S, Lindberg E. What characterizes patients who are unable to tolerate continuous positive airway pressure (CPAP) treatment? Respir Med. 2000;94(2):145–149. | ||
Tarasiuk A, Reznor G, Greenberg-Dotan S, Reuveni H. Financial incentive increases CPAP acceptance in patients from low socioeconomic background. PLoS One. 2012;7(3):e33178. | ||
Wolkove N, Baltzan M, Kamel H, Dabrusin R, Palayew M. Long-term compliance with continuous positive airway pressure in patients with obstructive sleep apnea. Can Respir J. 2008;15(7):365–369. | ||
Pieh C, Bach M, Popp R, et al. Insomnia symptoms influence CPAP compliance. Sleep Breath. 2013;17(1):99–104. | ||
Yetkin O, Kunter E, Gunen H. CPAP compliance in patients with obstructive sleep apnea syndrome. Sleep Breath. 2008;12(4):365–367. | ||
Somiah M, Taxin Z, Keating J, et al. Sleep quality, short-term and long-term CPAP adherence. J Clin Sleep Med. 2012;8(5):489–500. | ||
Means MK, Ulmer CS, Edinger JD. Ethnic differences in continuous positive airway pressure (CPAP) adherence in veterans with and without psychiatric disorders. Behav Sleep Med. 2010;8(4):260–273. | ||
Crawford MR, Bartlett DJ, Coughlin SR, et al. The effect of continuous positive airway pressure usage on sleepiness in obstructive sleep apnoea: real effects or expectation of benefit? Thorax. 2012;67(10):920–924. | ||
Popescu G, Latham M, Allgar V, Elliott MW. Continuous positive airway pressure for sleep apnoea/hypopnoea syndrome: usefulness of a 2 week trial to identify factors associated with long term use. Thorax. 2001;56(9):727–733. | ||
Chinese Society of Respiratory Diseases. Obstructive sleep apnea/hypopnea diagnosis guideline. Chin J Tuberc Respir Dis. 2012;35:9–12. | ||
Johns MW. A new method for measuring daytime sleepiness: the Epworth sleepiness scale. Sleep. 1991;14(6):540–545. | ||
Krupp LB, LaRocca NG, Muir-Nash J, Steinberg AD. The fatigue severity scale. Application to patients with multiple sclerosis and systemic lupus erythematosus. Arch Neurol. 1989;46(10):1121–1123. | ||
Zung WW. A self-rating depression scale. Arch Gen Psychiatry. 1965;12:63–70. | ||
Buysse DJ, Reynolds CF 3rd, Monk TH, Berman SR, Kupfer DJ. The Pittsburgh Sleep Quality Index: a new instrument for psychiatric practice and research. Psychiatry Res. 1989;28(2):193–213. | ||
Hartigan JA, Wong MA. A K-means clustering algorithm. Appl Stat. 1979;28:100–108. | ||
Bakker JP, O’Keeffe KM, Neill AM, Campbell AJ. Ethnic disparities in CPAP adherence in New Zealand: effects of socioeconomic status, health literacy and self-efficacy. Sleep. 2011;34(11):1595–1603. | ||
Sawyer AM, Canamucio A, Moriarty H, Weaver TE, Richards KC, Kuna ST. Do cognitive perceptions influence CPAP use? Patient Educ Couns. 2011;85(1):85–91. | ||
Campbell A, Neill A, Lory R. Ethnicity and socioeconomic status predict initial continuous positive airway pressure compliance in New Zealand adults with obstructive sleep apnoea. Intern Med J. 2012;42(6):e95–e101. | ||
Ramchandran KJ, Shega JW, Von Roenn J, et al. A predictive model to identify hospitalized cancer patients at risk for 30-day mortality based on admission criteria via the electronic medical record. Cancer. 2013;119(11):2074–2080. | ||
Canavese G, Bruzzi P, Catturich A, et al. A risk score model predictive of the presence of additional disease in the axilla in early-breast cancer patients with one or two metastatic sentinel lymph nodes. Eur J Surg Oncol. 2014;40(7):835–842. | ||
Steyerberg EW, Bleeker SE, Moll HA, Grobbee DE, Moons KG. Internal and external validation of predictive models: a simulation study of bias and precision in small samples. J Clin Epidemiol. 2003;56(5):441–447. | ||
Steyerberg EW, Harrell FE Jr, Borsboom GJ, Eijkemans MJ, Vergouwe Y, Habbema JD. Internal validation of predictive models: efficiency of some procedures for logistic regression analysis. J Clin Epidemiol. 2001;54(8):774–781. |
 © 2015 The Author(s). This work is published and licensed by Dove Medical Press Limited. The full terms of this license are available at https://www.dovepress.com/terms.php and incorporate the Creative Commons Attribution - Non Commercial (unported, v3.0) License.
By accessing the work you hereby accept the Terms. Non-commercial uses of the work are permitted without any further permission from Dove Medical Press Limited, provided the work is properly attributed. For permission for commercial use of this work, please see paragraphs 4.2 and 5 of our Terms.
© 2015 The Author(s). This work is published and licensed by Dove Medical Press Limited. The full terms of this license are available at https://www.dovepress.com/terms.php and incorporate the Creative Commons Attribution - Non Commercial (unported, v3.0) License.
By accessing the work you hereby accept the Terms. Non-commercial uses of the work are permitted without any further permission from Dove Medical Press Limited, provided the work is properly attributed. For permission for commercial use of this work, please see paragraphs 4.2 and 5 of our Terms.