")
Back to Journals » Journal of Multidisciplinary Healthcare » Volume 17
Photoplethysmography for Assessing Microcirculation in Hypertensive Patients After Taking Antihypertensive Drugs: A Review
Received 20 October 2023
Accepted for publication 9 January 2024
Published 16 January 2024 Volume 2024:17 Pages 263—274
DOI https://doi.org/10.2147/JMDH.S441440
Checked for plagiarism Yes
Review by Single anonymous peer review
Peer reviewer comments 2
Editor who approved publication: Dr Scott Fraser
Yanchun Hu,1 Anming Hu,2 Shenju Song3
1Department of Orthopaedics, the Fifth People’s Hospital of Jinan, Jinan, People’s Republic of China; 2Taishan College, Shandong University, Jinan, People’s Republic of China; 3Department of Nursing, the Fifth People’s Hospital of Jinan, Jinan, People’s Republic of China
Correspondence: Yanchun Hu, Department of Orthopaedics, the Fifth People’s Hospital of Jinan, No. 24297 of Jingshi Road, Jinan, 250022, People’s Republic of China, Tel +86 531 87198016, Email [email protected]
Abstract: High blood pressure (BP) is a common disease and is associated with many chronic diseases. Measuring BP is essential for the treatment and management of many diseases, and therefore there is a growing need for a non-invasive, sleeveless and continuous BP monitoring device. With the development of technology, pulse waveform analysis using photoplethysmography (PPG) has become more feasible for evaluating BP. This study aimed to evaluate the changes of vascular elasticity and blood volume over time by using the characteristic parameters extracted by PPG. We reviewed the latest progress and literature on the observation of capillary network characteristics in hypertensive and non-hypertensive patients by PPG, the influence of different drugs on microcirculation characteristics in hypertensive patients with PPG, and further explored the key relationship between microcirculation and hypertension. We found that the PPG waveform produced by the fingertips of hypertensive patients is very different from that of healthy people, and the PPG waveform changes significantly during diastolic period after antihypertensive treatment. With the rapid development of medical technology, people can get more intuitive microcirculation image data, which provides beneficial help for the comprehensive understanding of hypertension.
Keywords: capillary network, microcirculation, hypertension, PPG, arteriovenous anastomosis
Introduction
High blood pressure (BP) is a common disease. There is still uncertainty about the effectiveness of blood pressure drugs taken by people with high BP.1,2 Sometimes, the condition has no apparent symptoms for patients insensitive to therapeutic drugs. It usually goes undetected unless a health professional regularly monitors BP.3 Especially for those patients with refractory hypertension who are not detected in time, taking blood pressure medications, and remain at increased risk for mortality. Therefore, BP monitoring is essential in managing and treating hypertension.
Because of the high branching, the capillary network has a substantially higher overall cross-sectional area. The capillaries may act as a “windkessel” to dampen the pulsations caused by the heart because of their low elastic modulus. This structural and functional feature also makes the pressure in the capillary network significantly lower than that in the arteriole.4 As the smallest blood vessels, the blood flow in the capillaries is not smooth.5,6 For example, red blood cells with a diameter of 7 µm must bend to flow through them.7,8 When studying the hydrodynamic characteristics of the cardiovascular system, the basic flow equation is usually used, ie (the Poiseuille equation). But the Poiseuille equation is not accurate in measuring fluid resistance in complex elastic vessels, especially in a structure whose total cross-sectional area is wider in the middle and narrower at both ends.9 Therefore, the analysis of the characteristics of microcirculation perfusion is of great significance for further understanding of peripheral resistance and hypertension, but the irrational application of the Poiseuille equation may affect the correct understanding of peripheral resistance and the essence of hypertension.
The microvascular tissue bed may be monitored for changes in blood volume using the simple, affordable optical approach known as photoplethysmography (PPG).10 Recently, it has been generally accepted that PPG components can provide valuable information about the cardiovascular system.11,12 In this work, we summarized the characteristics of capillary PPG parameters in different subjects and discussed peak changes in patients with hypertension after applying nitroglycerin or urapidil. What’s more, physiological and pathological information can be extracted by studying the characteristics of pulse wave signals.
Microvascular Imaging Techniques
Microvascular measurement is currently a great challenge in clinical practice. Because the spatial structure of microvessels is non-uniform, high variations in perfusion over time can lead to inaccurate measurements. Therefore, the current research on microvascular imaging remains to be further developed. And the direction of microvascular imaging is diverse, and the correct technique can be selected according to different clinical needs.
Microvascular imaging techniques are currently varied.12 Specific methods and performances of the different techniques are presented in Table 1. Currently, laser Doppler perfusion imaging and laser speckle contrast imaging are established commercially available techniques for determining microvascular perfusion, and have demonstrated clinical utility in applications such as burn depth assessment. Nailfold capillaroscopy is also one of the techniques currently used in the market to detect microangiopathy secondary to specific connective tissue diseases in patients with Raynaud ‘s phenomenon. Infrared thermography measures skin temperature rather than direct perfusion and is currently used only for some surgical and peripheral microvascular applications. Other emerging technologies have potential for clinical applications.
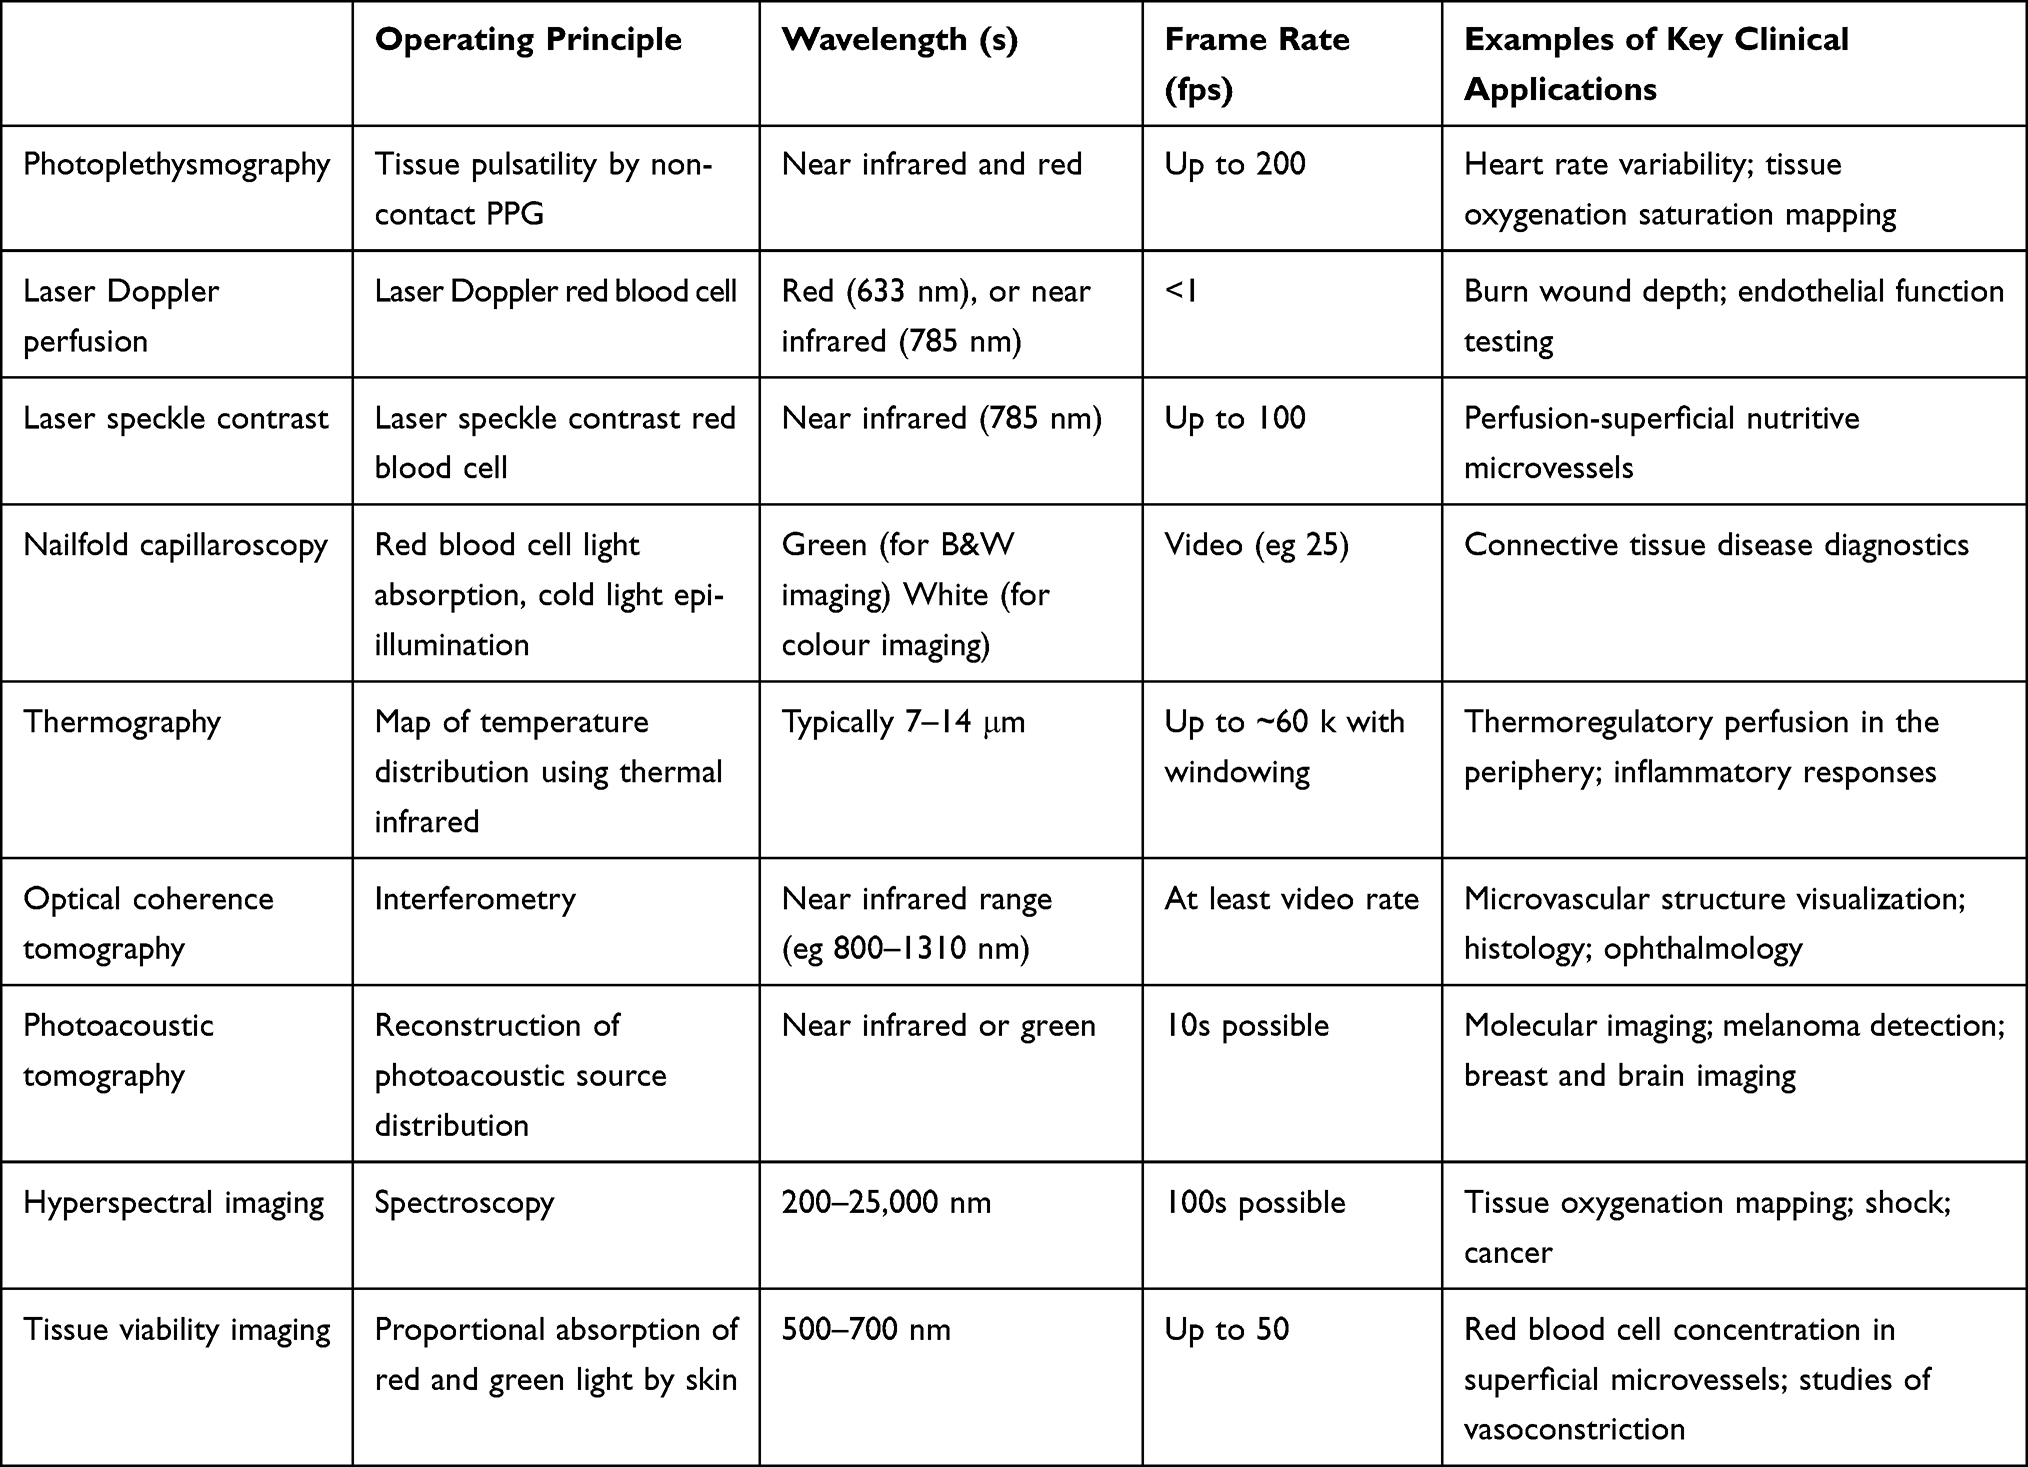 |
Table 1 Overview of Characteristics for the Microvascular Imaging Modalities |
PPG is a non-invasive feature using contact optics and can be used to detect cardiovascular pulse waves. The PPG is simple in composition, and the most basic form technology only requires a light source that illuminates the tissue and a photodetector that measures small changes in light intensity caused by the interaction of light with the illuminated tissue. However, the origin of light intensity changes is not yet fully understood and has the following mechanisms: direction shift of red blood cells between systole and diastole, changes in vessel wall motion and tissue blood volume. PPG has high resolution, fast scanning speed and low cost.
Capillary Network Characteristics Were Observed in Hypertensive or Non-Hypertensive Patients by PPG
We can observe the elastic performance of the capillary network through PPG signals. The PPG waveform of healthy young people has two peaks, with the ascending and descending branches of the first peak being very steep.13 With the contraction of the ventricular muscle and the opening of the aortic valve, the blood rapidly flows into the capillary network, the capillary elastically relaxes, and the perfusion of the capillary network increases.14 Because the total cross-sectional area of the capillary network is extensive and a single capillary is thin, there is less blood flowing out of the capillary network currently.15,16 Thus, the rising branch of the first peak appears. With the increase in capillary network perfusion, the pressure in the capillaries gradually increases, and similarly, the blood flowing out of the capillary network gradually increases. As the aortic valve closes, the blood flow into the capillary network decreases, progressively becoming less than the outflow, and the descending branch of the first peak appears.17
Figure 1 illustrates the PPG waveform. The relevant signal spots were located using five markers. Marker 1 represents the first foot of the PPG waveform, marker 2 represents the first peak, marker 3 represents valley, marker 4 represents the second peak, and marker 5 represents the second foot. Two positive waves are denoted by P1 and P2, respectively, while negative waves are denoted by V.18 Each PPG waveform mainly involves four phases when performing the healthy population test. + a Increased: occurs between marker 1 and marker 2. -b Decrease: occurs between marker 2 and marker 3. + c elevation: occurs between marker 3 and marker 4. -d dip: occurs between markers 4 and 5. However, the PPG waveforms of hypertensive patients were abnormal, and the second peak was low or even disappeared, resulting in that the starting and ending points of T3 were not easily visualized. The PPG has a second peak with an interval of approximately 0.2 seconds. The appearance of the second peak indicates that the microcirculation perfusion increased during the diastolic period of the heart. The second wave peak appears because some people tend to have a reflected wave. In mechanical locks, the propagation medium and wave velocity remain unchanged. The distance from the reflection point to the end stays constant, as does the vascular elasticity. According to this principle, the interval between the first and second peaks and between the two PPG peaks should also remain constant. However, when healthy young people exercise, PPG readings show that directly the heart rate increases, the interval between the two PPG peaks narrows, and the PPG waveform is still able to remain regular.19,20
 |
Figure 1 Schematic diagram of Photoplethysmography (PPG) waveform (Marker 1 is the first foot of the PPG waveform, marker 2 is the first peak of the waveform, marker 3 is The Valley, marker 4 is the second peak, and marker 5 is the second foot of the waveform; P1 and P2 indicate two positive waves respectively, V indicates the negative wave). |
The fluctuation of blood volume was monitored using an optic-based PPG method. PPG works because when an artery’s pulse varies, so does the amount of light absorb by its blood. The pulse oximeter sends a vertical monochromatic light beam of a certain intensity into the fingertip. Skin, muscle, bone, and other tissues absorb light as the arteries and blood vessels in the transparent region pulsate. However, when the arteries pulsate, the microcirculation perfusion changes, which impacts how well the blood absorbs light. The elevated PPG waveform was observed if the blood volume increased. However, a decreased PPG waveform can be seen if the blood volume in the microvascular tissue bed is reduced.
There are two measurement patterns observable in PPG sensing at different sites. The fingertip or earlobe are the common locations for transmission-mode PPG sensors, and the light source is separated by tissue from the detector.21 On the contrary, reflection PPG sensors have these two components on the same side of the tissue, commonly located on the wrist and forehead. Both patterns can reflect various physiological indexes.
The fluctuation of microcirculation perfusion volume, and its formation is related to intravascular pressure. With increasing age, the second summit becomes less obvious.22 Compared with healthy young people, microcirculation perfusion in elderly and hypertensive patients in the diastolic period of the heart is reduced, which means that the amount of blood flowing into the microcirculation in the artery is reduced in the diastolic period. So in PPG waveform, purple represents elderly and hypertensive patients, and grey represents healthy young adults (Figure 2).23
 |
Figure 2 The comparison of PPG between hypertensive patients and normal young adults. |
Effects of Different Drugs on Microcirculation Characteristics in Patients with Hypertension by PPG
Drugs such as nitroglycerin or urapidil can relax the vascular smooth muscle of arterioles, relax the vascular smooth muscle, and increase microcirculation perfusion in diastole. After applying nitroglycerin or urapidil to hypertensive patients for rapid hypotension, it was found that the slope of the PPG waveform changed significantly at 0.1–0.2 seconds after the first peak, and the inclination of some patients recovered to a positive reading comparable to that of healthy individuals, presenting the second peak (Figure 3).23 According to the PPG reading, the perfusion of microcirculatory blood flow in hypertensive patients decreased in the middle and late diastolic periods. The prescription of hypotensive drugs to hypertensive patients can relax the vascular smooth muscle and increase microcirculatory blood perfusion in the middle and late diastole. Nevertheless, it is necessary to explore the microcirculatory structure further to understand the reasons for the above situation. The pressure between the capillaries and arterioles decreased significantly, which should be related to the structure of systemic circulation.24 Furthermore, it is necessary to consider the capillaries’ elasticity and the network’s overall cross-sectional properties. Although the evidence shows that the blood flow resistance of the capillary network is significantly greater than that of the arterioles, relaxing the arterioles’ vascular smooth muscle can reduce blood pressure in hypertensive patients. The reduction in microcirculation perfusion in hypertensive individuals should occur in ventricular systole if it is assumed that there is an increase in the peripheral resistance of the arterioles.
 |
Figure 3 The comparison of PPG between hypertensive patients and patients with hypertension after the application of nitroglycerin. (A) PPG waveform examples of patients with hypertension. (B) PPG waveform examples of patients with hypertension after the application of nitroglycerin. |
The application of nitroglycerin to relax the vascular smooth muscle of small arteries within a short time has little effect on the elastic modulus of large arteries, and the disappearance of the second wave peak is not caused by arteriosclerosis. Since PPG shows microcirculation perfusion, the appearance and disappearance of the second wave peak should be observed because of the structure of the microcirculation itself. The overall cross-sectional area of the capillary network is substantial, and the blood flow rate through the capillaries is moderate. When blood leaves the heart, systole has a flow rate of roughly 0.2 M/s, while the capillary network has a flow rate of just 0.001–0.01 M/s.25 The reduced blood flow velocity in the capillary network is advantageous in exchanging materials. Because of the blood’s rapid flow velocity, arterial endothelial cells cannot directly absorb nutrients from the blood. The flow velocity in the capillary network rises again if diastolic perfusion increases, which is manifestly unfavourable to material exchange.26
Poiseuille Equation
We further explored the principle of capillary hemodynamics, which is usually applied – ie the Poiseuille equation.27 The fundamental flow equation summarises the link between the pressure differential, blood flow and vascular resistance: Q = P/R, blood flow = pressure/resistance. In the human cardiovascular system, the ventricular muscle contraction pushes the blood to flow out of the ventricle. It increases the BP in the artery, which gradually reaches the highest value. The difference in BP between arterioles and capillaries was the largest (ie highest) value. If the basic flow equation is applied, the flow resistance in the arterioles is the largest, thereby confirming that arterioles are important in developing systemic vascular resistance. The hydraulic analogy with the Law of Ohm approximates blood flow via the circulatory system. And Figure 4 can be used to explain the capillary hemodynamic characteristics. There were three components in vessel 1 (a, b and c). Each component was one-third the length of vessel 2. Compared to components A and C, B had a much larger radius. Individually, component B should have substantially lower resistance than both A and C. Vessel 1 was composed of a network of three segments with different cross-sectional areas, two narrow ends and a broad middle (the inlet and outlet). According to the basic flow equation, the total resistance of vessel 1 should be around 66% of that of vessel 2 based on the calculation for overall resistance in a series. On the contrary, it was found that the water in vessel 1 drained more slowly than in vessel 2 and exhibited a higher flow resistance.28 The water flow in vessel 1 could not maintain a laminar state due to the large gradient in the cross-sectional areas among the three components, resulting in excessive friction and greater resistance to flow in vessel 1. What’s more, in pipeline fluid, the inertia of the fluid cannot be overlooked, while the inertia of the electrons does not need to be considered in the circuit.29
 |
Figure 4 Schematic diagram of microcirculation. (A) Two Fluid Dynamics Diagrams: it seems that the vessel 1 had low resistance than vessel 2 because it had a greater cross-sectional area (electrical features); There were three components in vessel 1 (a, b and c). However, the fact is that the flow in vessel 1 drained more slowly than in vessel 2 because there was excessive friction in vessel 1, resulting in a greater resistance to flow. (B and C) The difference between parallel fluid pipeline and parallel circuit. |
Microcirculatory Perfusion in Diastole
The significant difference in patients with hypertension is the microcirculation blood perfusion in the diastolic period before and after applying the vasoactive nitroglycerin. What’s more, human blood flows in relatively closed vessels. In the body, the alternating expansion and contraction of blood vessels cause blood to flow forward, gradually returning from the left ventricle to the right atrium. During ventricular systole, the ventricular muscle contracts, rapidly squeezing the blood out, which flows forward quickly through the artery. The capillary network has a substantially higher overall cross-sectional area than the arterial and venous networks. The capillary is an elastic, permeable tube loaded from the outside by tissue pressure. At the distal end of the arterial network, the capillary network must relax receptively to accommodate the inflow of blood.
The capillaries may act as a “windkessel” to dampen the pulsations caused by the heart due to their low elastic modulus and vast cross-sectional area (Figure 5A).30 During cardiac systole, if capillaries are considered to behave as rigid bodies and not behave as a windkessel, the blood flow velocity in the venules will be close to the blood flow velocity in the arterioles and should fluctuate as the ventricular muscle expands and contracts. This is obviously inconsistent with the physical situation.31,32 Because of the high branching, the total cross-sectional area of the capillary network in the circulatory system was significantly higher than in the aorta. Subsequently, it was highly collected and gradually flowed into the vein, where the total cross-sectional area gradually decreased until it flowed into the right atrium.33 Only when the flow is laminar and non-pulsating with constant diameters, as with water flowing through horizontal cylindrical pipes, can Poiseuille’s law be applicable in the cardiovascular system (Figure 5B). The blood flow in human circulation pulses and is sometimes turbulent, in contrast to the water in Poiseuille’s conditions. The blood vessels are not horizontally positioned, cylindrical or rigid.34 Because the total cross-sectional area of the capillary network was obviously increased, a structure that is broad in the middle and thin at each end between the arterioles and the venules is generated. This dramatic change in the cross-sectional area means the blood cannot maintain a steady flow. It is more likely that the high hydrodynamic resistance of capillaries is a consequence of high tortuosity and friction.
 |
Figure 5 Diagram of the windkessel. (A) The elastic arteries and heart are similar with the windkessel and the pump, respectively. The change of air can somewhat represent the change of microvascular resistance during diastole and systole. (B) The components and structure of capillaries. |
Nowadays, recently published papers are related to weather PPG wave patterns to calculate blood pressure. Yan et al35 reported a PPG method that can work with a degree-learning algorithm, which is beneficial for the diagnosis and identification of hypertension. Liang et al36 reported an approach to hypertension management based on arterial wave propagation theory and investigated changes in different BP levels. According to PPG signals, changes in diastolic microcirculation perfusion in healthy young adults, the elderly and hypertensive patients are very significant. Microcirculation perfusion changes in the diastolic period of the heart are related to hypertension. Therefore, it is necessary to discuss the structure of microcirculation deeply.
Effects of Antihypertensive Drugs on Arteriovenous Anastomosis
PPG sensor coverage aencompasses veins, arteries, andcountless capillaries.37 Our body can avoid the capillaries by diverting blood from the arteries to the veins.38,39 Low-resistance vessels are arteriovenous anastomosis (AVA). They generate low-resistance channels with a significantly larger diameter than capillaries, allowing the high-capacity venous bed to be quickly perfused. The opening of low-resistance vessels will decrease blood flow in the parallel capillary network and the blood flow velocity in the capillaries since they run parallel. Different elastic moduli are present in the blood vessel wall’s structural makeup. According to Figure 6, the arterioles developed a muscle resembling a sphincter. This has the ability to modulate blood flow into AVAs.40 Histologically, AVAs are distinguished by muscular walls and irregular lumina (three to eight times bigger than those of capillaries). A less than 90 mmHg pressure during diastole, leading AVA to open. Conversely, a pressure of at least 90 mmHg during systole and cause AVA to shut. AVAs and arterioles increase the likelihood of an abrupt AVA opening during diastole.41,42
 |
Figure 6 The blood vessel wall of Arteriovenous Anastomosis (AVA). The thick walls of AVAs are made up of circular and longitudinally organised smooth muscle fibres in cross-sections. The mother arterial segment’s vertical arrangement of spindle-shaped smooth muscle cells may resemble the acd valve, which regulates the opening of the AVA. |
The structural diagram in Figure 7 is with AVA added. When exposed to the tangential pull force of the wall tube, the structure is not pushed too far away from the tangential direction because the thickened area is fibrous tissue and the direction of the elastic modulus. The elastic modulus of the inner and outer layers differs. When the pressure in the maternal blood vessel changes, a lip-like structure may form. When the intravascular pressure of the mother arteries exceeds 90 mmHg, this causes the lips to shut. The outside fibre tension drops, the inner elastic modulus is tiny, and a certain tension is maintained; thus, the lip-like structure is in an open condition when the mother blood vessel’s internal pressure is less than 90 mmHg.
 |
Figure 7 The structure diagram added at AVA. Mother and daughter vessels are in the spotlight. The construction of the fictitious AVA entrance serves as the link between the mother vessel and the daughter’s vessel. The muscle fibers are thickened and organised in the mother vessel’s direction to create a lip-like longitudinal structure. |
The appearance of double peaks in the PPG waveforms reflects a healthy human circulatory system. When diastolic pressure exceeds 90mmHg, no double peaks are present in the PPG. The PPG double peak will also disappear when systolic blood pressure is lower than 90mmHg. When a healthy young person enters a state of shock due to blood loss, the PPG waveform is low and flat – ie the ascending and descending branches are not steep, the waveform is irregular, and there is no double peak. However, after treatment such as blood loss correction, fluid replacement, and dopamine administration, the PPG displays a bimodal waveform again.43,44 This suggests that blood pressure is closely related to PPG double peaks, and normal blood pressure is necessary for PPG double peaks.
Based on the PPG waveforms, microvascular AVA was the cause of the changes in microcirculation perfusion during the diastolic period. Arteriolar regulation of blood flow can be complemented by microvascular AVA. The difference in capillary flow capacity is influenced by two factors: (1) Because the AVA in capillaries opens, the pressure in the connecting venules increases dramatically, which can lead to the degree of flow cessation or even reversal in capillaries. (2) At this time, total blood flow can be increased due to a sharp decrease in resistance in the vessels. Current drugs targeting the AVA adrenoceptor clinically can influence microvascular AVA status.45
Dyslipidemia and Hypertension
Hypertension and hyperlipidemia can contribute to endothelial injury and arteriolar vasomotor dysfunction, a known independent risk factor for cardiac death.46 These alterations in microvascular signalling and vasomotor activity adversely affect our bodies. The capillary network is crucial for material metabolism. Its low elastic modulus and vast cross-sectional area are conducive to the reduction of blood flow velocity in capillaries and the exchange of substances. However, it also leads to a great head loss in the capillary network.47,48 In this study, the change in microcirculation perfusion was more apparent in hypertensive patients during the diastolic period. Metabolic abnormalities and metabolic syndrome are closely associated with hypertension severity.49,50 There is valid evidence to support the notion that hypertension and metabolic syndrome have a bi-directional relationship.51 The accumulation of metabolic wastes in microcirculation directly impacts microvascular patency.52,53 Combined lipid-lowering is beneficial to control blood pressure and benefit hypertensive patients, which further illustrates the important relationship between microcirculation and hypertension. There is a possibility of delaying or preventing the development of high blood pressure by modifying blood cholesterol levels.54
Hypercholesterolemia and diabetes are frequently associated with the development of hypertension, which increases the risk of cardiovascular disease in patients. 3OH-3 methyl-glutaryl coenzyme A reductase inhibitors are currently the most widely used cholesterol-lowering drugs in clinical practice. These drugs can significantly reduce the risk of death from cardiovascular events in patients. Statins currently benefit patients primarily by lowering cholesterol content, but increasing research has focused on other effects of statins called “lipophilic effects”, which may be one of the reasons why statins have cardiovascular protective effects.55 Therefore, the regulation of blood pressure by statins may play a clinically feasible role in hyperlipidemia-hypertension patients.56 Hyperlipidemia is prevalent in hypertension, but the cause of this association is unknown.57 Considering the dramatic difference in the flow capabilities of AVA and capillaries, high blood lipids are more likely to cause an obstruction in AVA so the possibility of functional changes in AVA increases. From the perspective of microcirculation perfusion, hypertension is more like a microcirculation disorder. According to the data obtained by the PPG, it is related to age and obstruction caused by hyperlipidemia. Although PPG images based on fingertips are one-sided and non-intuitive to reveal the truth of microcirculation, with the development of 3D technology and finite element technology, the hydrodynamic characteristics of microcirculation will surely be slowly revealed. Human beings will have a more comprehensive understanding of hypertension.
Conclusion
PPG waveforms provide information about the microcirculation of superficial tissues such as fingers, toes and earlobes, but it also opens a window for us to understand microcirculation truly. The PPG waveform produced by the fingertip in hypertensive patients radically differs from that of healthy people. The PPG waveform significantly changes during diastole after the administration of antihypertensive treatment. This review suggests that more research is needed to investigate the relationship between hypertension and diastolic microcirculatory blood perfusion, which may provide a new direction for hypertension detection.
Abbreviations
PPG, photoplethysmography; BP, blood pressure; BMI, body mass index; BPM, beat per minute; AVA, arteriovenous anastomosis.
Ethics Approval and Consent to Participate
An ethics statement is not applicable because this study is based exclusively on published literature.
Disclosure
The author reports no conflicts of interest in this work.
References
1. Mark PB, Carrero JJ, Matsushita K, et al. Major cardiovascular events and subsequent risk of kidney failure with replacement therapy: a CKD Prognosis Consortium study. Eur Heart J. 2023;44(13):1157–1166. doi:10.1093/eurheartj/ehac825
2. Mahfoud F, Mancia G, Schmieder RE, et al. Cardiovascular Risk Reduction After Renal Denervation According to Time in Therapeutic Systolic Blood Pressure Range. J Am Coll Cardiol. 2022;80(20):1871–1880. doi:10.1016/j.jacc.2022.08.802
3. Tsai PC, Chao YM, Chan JYH. Sympathetic activation of splenic T-lymphocytes in hypertension of adult offspring programmed by maternal high fructose exposure. Chin J Physiol. 2020;63(6):263–275. doi:10.4103/CJP.CJP_85_20
4. Solelhac G, Sánchez-de-la-Torre M, Blanchard M, et al. Pulse Wave Amplitude Drops Index: a Biomarker of Cardiovascular Risk in Obstructive Sleep Apnea. Am J Respir Crit Care Med. 2023;207(12):1620–1632. doi:10.1164/rccm.202206-1223OC
5. Hadjinicolaou M, Protopapas E. A Microscale Mathematical Blood Flow Model for Understanding Cardiovascular Diseases. Adv Exp Med Biol. 2020;1194:373–387. doi:10.1007/978-3-030-32622-7_35
6. Erhardt AH, Wahlén E, Weber J. Bifurcation analysis for axisymmetric capillary water waves with vorticity and swirl. Stud Appl Math. 2022;149(4):904–942. doi:10.1111/sapm.12525
7. Ebrahimi S, Bagchi P. A computational study of red blood cell deformability effect on hemodynamic alteration in capillary vessel networks. Sci Rep. 2022;12(1):4304. doi:10.1038/s41598-022-08357-z
8. Hossain MMN, Hu NW, Abdelhamid M, et al. Angiogenic Microvascular Wall Shear Stress Patterns Revealed Through Three-dimensional Red Blood Cell Resolved Modeling. Function. 2023;4(6):zqad046. doi:10.1093/function/zqad046
9. Nabeel PM, Jayaraj J, Mohanasankar S. Single-source PPG-based local pulse wave velocity measurement: a potential cuffless blood pressure estimation technique. Physiol Meas. 2017;38(12):2122–2140. doi:10.1088/1361-6579/aa9550
10. Alam J, Khan MF, Khan MA, et al. A Systematic Approach Focused on Machine Learning Models for Exploring the Landscape of Physiological Measurement and Estimation Using Photoplethysmography (PPG). J Cardiovasc Transl Res. 2023. doi:10.1007/s12265-023-10462-x
11. Ibrahim NS, Rampal S, Lee WL, et al. Evaluation of Wrist-Worn Photoplethysmography Trackers with an Electrocardiogram in Patients with Ischemic Heart Disease: a Validation Study. Cardiovas c Eng Technol. 2023. doi:10.1007/s13239-023-00693-z
12. Allen J, Howell K. Microvascular imaging: techniques and opportunities for clinical physiological measurements. Physiol Meas. 2014;35(7):R91–R141. doi:10.1088/0967-3334/35/7/R91
13. Park J, Seok HS, Kim SS, et al. Photoplethysmogram Analysis and Applications: an Integrative Review. Front Physiol. 2022;12:808451. doi:10.3389/fphys.2021.808451
14. Frøhlich AF, Østergaard L, Kiselev VG. Theory of susceptibility-induced transverse relaxation in the capillary network in the diffusion narrowing regime. Magn Reson Med. 2005;53(3):564–573. doi:10.1002/mrm.20394
15. Katsogridakis E, Simpson DM, Bush G, et al. Revisiting the frequency domain: the multiple and partial coherence of cerebral blood flow velocity in the assessment of dynamic cerebral autoregulation. Physiol Meas. 2016;37(7):1056–1073. doi:10.1088/0967-3334/37/7/1056
16. Ferrell N, Sandoval RM, Bian A, et al. Shear stress is normalized in glomerular capillaries following (5/6) nephrectomy. Am J Physiol Renal Physiol. 2015;308(6):F588–93. doi:10.1152/ajprenal.00290.2014
17. Allen J, Zheng D, Kyriacou PA, et al. Photoplethysmography (PPG): state-of-The-art methods and applications. Physiol Meas. 2021;42(10). doi:10.1088/1361-6579/ac2d82
18. Iketani T, Iketani Y, Takazawa K, et al. The influence of the peripheral reflection wave on left ventricular hypertrophy in patients with essential hypertension. Hypertens Res. 2000;23(5):451–458. doi:10.1291/hypres.23.451
19. Singstad BJ, Azulay N, Bjurstedt A, et al. Estimation of Heart Rate Variability from Finger Photoplethysmography During Rest, Mild Exercise and Mild Mental Stress. J Electr Bioimpedance. 2021;12(1):89–102. doi:10.2478/joeb-2021-0012
20. Sun S, Bezemer R, Long X, et al. Systolic blood pressure estimation using PPG and ECG during physical exercise. Physiol Meas. 2016;37(12):2154–2169. doi:10.1088/0967-3334/37/12/2154
21. Fine I, Kaminsky A. Scattering-driven PPG signal model. Biomed Opt Express. 2022;13(4):2286–2298. doi:10.1364/BOE.451620
22. Allen J, Murray A. Age-related changes in the characteristics of the photoplethysmographic pulse shape at various body sites. Physiol Meas. 2003;24(2):297–307. doi:10.1088/0967-3334/24/2/306
23. Hu Y, Hu A, Song S. Comparative study of photoplethysmographic waveforms with application of antihypertensive medication in hypertensive patients. Ann Noninvasive Electrocardiol. 2022;27(3):e12941. doi:10.1111/anec.12941
24. Kovtanyuk A, Turova V, Sidorenko I, et al. Modeling of the cerebral blood circulation in a capillary network accounting for the influence of the endothelial surface layer. Comput Methods Programs Biomed. 2022;224:107008. doi:10.1016/j.cmpb.2022.107008
25. Koutsiaris AG, Tachmitzi SV, Papavasileiou P, et al. Blood velocity pulse quantification in the human conjunctival pre-capillary arterioles. Microvasc Res. 2010;80(2):202–208. doi:10.1016/j.mvr.2010.05.001
26. Wang T, Rongin U, Xing Z. A micro-scale simulation of red blood cell passage through symmetric and asymmetric bifurcated vessels. Sci Rep. 2016;6:20262. doi:10.1038/srep20262
27. Singh S, Randle LV, Callaghan PT, et al. Beyond poiseuille: preservation fluid flow in an experimental model. J Transplant. 2013;2013:605326. doi:10.1155/2013/605326
28. Silva DV, Waclawovsky G, Kramer AB, et al. Comparison of Cardiac and Vascular Parameters in Powerlifters and Long-Distance Runners: comparative Cross-Sectional Study. Arq Bras Cardiol. 2018;111(6):772–781. doi:10.5935/abc.20180167
29. Fine J, Branan KL, Rodriguez AJ, et al. Sources of Inaccuracy in Photoplethysmography for Continuous Cardiovascular Monitoring. Biosensors. 2021;11(4). doi:10.3390/bios11040126
30. Georgianos PI, Sarafidis PA, Liakopoulos V. Arterial Stiffness: a Novel Risk Factor for Kidney Injury Progression? Am J Hypertens. 2015;28(8):958–965. doi:10.1093/ajh/hpv004
31. Mei CC, Zhang J, Jing HX. Fluid mechanics of Windkessel effect. Med Biol Eng Comput. 2018;56(8):1357–1366. doi:10.1007/s11517-017-1775-y
32. Hochauf S, Sternitzky R, Schellong SM. Struktur und Funktion des venösen Systems [Structure and function of the peripheral venous system]. Herz. 2007;32(1):3–9. doi:10.1007/s00059-007-2951-x
33. Yang J, Pak YE, Lee TR. Predicting bifurcation angle effect on blood flow in the microvasculature. Microvasc Res. 2016;108:22–28. doi:10.1016/j.mvr.2016.07.001
34. Byar D, Fiddian RV, Quereau M, et al. The Fallacy of Applying the Poiseuille Equation to Segmental Arterial Stenosis. Am Heart J. 1965;70:216–224. doi:10.1016/0002-8703(65)90070-0
35. Yan L, Wei M, Hu S, et al. Photoplethysmography Driven Hypertension Identification: a Pilot Study. Sensors. 2023;23(6). doi:10.3390/s23063359
36. Liang Y, Chen Z, Liu G, et al. A new, short-recorded photoplethysmogram dataset for blood pressure monitoring in China. Sci Data. 2018;5:180020. doi:10.1038/sdata.2018.20
37. Mangouritsas G, Koutropoulou N, Ragkousis A, et al. Peripapillary Vessel Density In Unilateral Preperimetric Glaucoma. Clin Ophthalmol. 2019;13:2511–2519. doi:10.2147/OPTH.S224757
38. Stefánsson E, Chan YK, Bek T, et al. Laws of physics help explain capillary non-perfusion in diabetic retinopathy. Eye (Lond). 2018;32(2):210–212. doi:10.1038/eye.2017.313
39. Ishibashi T, Yamamoto M, Morimoto I, et al. Arteriovenous Anastomosis in Human Hand Digital Skin. Bull Tokyo Dent Coll. 2021;62(2):63–70. doi:10.2209/tdcpublication.2020-0036
40. Aherne T, Kheirelseid E, O’Neill D, et al. The Use of Arteriovenous Fistulae as an Adjunct to Peripheral Arterial Bypass: a Systematic Review and Meta-analysis. Eur J Vasc Endovasc Surg. 2016;51(5):707–717. doi:10.1016/j.ejvs.2016.01.014
41. Woodside KJ, Bell S, Mukhopadhyay P, et al. Arteriovenous Fistula Maturation in Prevalent Hemodialysis Patients in the United States: a National Study. Am J Kidney Dis. 2018;71(6):793–801. doi:10.1053/j.ajkd.2017.11.020
42. Bergersen TK, Walloe L. Acral coldness - severely reduced blood flow to fingers and toes. Handb Clin Neurol. 2018;157:677–685. doi:10.1016/B978-0-444-64074-1.00040-9
43. Mackenzie CF, Wang Y, Hu PF, et al. Automated prediction of early blood transfusion and mortality in trauma patients. J Trauma Acute Care Surg. 2014;76(6):1379–1385. doi:10.1097/TA.0000000000000235
44. Wendelken SM, McGrath SP, Akay M, et al. Using a forehead reflectance pulse oximeter to detect changes in sympathetic tone. Conf Proc IEEE Eng Med Biol Soc. 2004;2006:325–328. doi:10.1109/IEMBS.2004.1403158
45. Rozen WM, Chubb D, Ashton MW, et al. Macrovascular arteriovenous shunts (MAS): a newly identified structure in the abdominal wall with implications for thermoregulation and free tissue transfer. J Plast Reconstr Aesthet Surg. 2010;63(8):1294–1299. doi:10.1016/j.bjps.2009.06.010
46. Sabe SA, Feng J, Sellke FW, et al. Mechanisms and clinical implications of endothelium-dependent vasomotor dysfunction in coronary microvasculature. Am J Physiol Heart Circ Physiol. 2022;322(5):H819–H41. doi:10.1152/ajpheart.00603.2021
47. Gan J, Wang Y, Wang D, et al. Research on the Law of Head Loss of Jet Pumps in the Cavitation State. ACS Omega. 2022;7(15):12661–12679. doi:10.1021/acsomega.1c06895
48. Zayed M, El Molla A, Sallah M. An experimental investigation of head loss through a triangular “V- shaped” screen. J Adv Res. 2018;10:69–76. doi:10.1016/j.jare.2017.12.005
49. Seravalle G, Grassi G. Obesity and hypertension. Pharmacol Res. 2017;122:1–7. doi:10.1016/j.phrs.2017.05.013
50. Katsimardou A, Imprialos K, Stavropoulos K, et al. Hypertension in Metabolic Syndrome: novel Insights. Curr Hypertens Rev. 2020;16(1):12–18. doi:10.2174/1573402115666190415161813
51. Litwin M, Kulaga Z. Obesity, metabolic syndrome, and primary hypertension. Pediatr Nephrol. 2021;36(4):825–837. doi:10.1007/s00467-020-04579-3
52. Natsis M, Antza C, Doundoulakis I, et al. Hypertension in Obesity: novel Insights. Curr Hypertens Rev. 2020;16(1):30–36. doi:10.2174/1573402115666190415154603
53. Sullivan PW, Ghushchyan VH, Ben-Joseph R. The impact of obesity on diabetes, hyperlipidemia and hypertension in the United States. Qual Life Res. 2008;17(8):1063–1071. doi:10.1007/s11136-008-9385-7
54. Borghi C, Fogacci F, Agnoletti D, et al. Hypertension and Dyslipidemia Combined Therapeutic Approaches. High Blood Press Cardiovasc Prev. 2022;29(3):221–230. doi:10.1007/s40292-022-00507-8
55. Feldstein CA. Statins in hypertension: are they a new class of antihypertensive agents? Am J Ther. 2010;17(3):255–262. doi:10.1097/MJT.0b013e3181c0695e
56. Chopra V, Choksi PU, Cavusoglu E. Beyond lipid lowering: the anti-hypertensive role of statins. Cardiovasc Drugs Ther. 2007;21(3):161–169. doi:10.1007/s10557-007-6025-3
57. Park SH, Chung S, Chung MY, et al. Effects of Panax ginseng on hyperglycemia, hypertension, and hyperlipidemia: a systematic review and meta-analysis. J Ginseng Res. 2022;46(2):188–205. doi:10.1016/j.jgr.2021.10.002
 © 2024 The Author(s). This work is published and licensed by Dove Medical Press Limited. The full terms of this license are available at https://www.dovepress.com/terms.php and incorporate the Creative Commons Attribution - Non Commercial (unported, v3.0) License.
By accessing the work you hereby accept the Terms. Non-commercial uses of the work are permitted without any further permission from Dove Medical Press Limited, provided the work is properly attributed. For permission for commercial use of this work, please see paragraphs 4.2 and 5 of our Terms.
© 2024 The Author(s). This work is published and licensed by Dove Medical Press Limited. The full terms of this license are available at https://www.dovepress.com/terms.php and incorporate the Creative Commons Attribution - Non Commercial (unported, v3.0) License.
By accessing the work you hereby accept the Terms. Non-commercial uses of the work are permitted without any further permission from Dove Medical Press Limited, provided the work is properly attributed. For permission for commercial use of this work, please see paragraphs 4.2 and 5 of our Terms.