")
Back to Journals » Drug Design, Development and Therapy » Volume 18
Pharmacokinetics, Bioavailability, and Tissue Distribution of the Kirsten Rat Sarcoma Inhibitor Adagrasib in Rats Using UPLC-MS/MS
Authors Lei P, Shen W, Tang H, You L, Chen G, Tang Y, Lu W
Received 26 August 2023
Accepted for publication 21 December 2023
Published 5 January 2024 Volume 2024:18 Pages 1—12
DOI https://doi.org/10.2147/DDDT.S437293
Checked for plagiarism Yes
Review by Single anonymous peer review
Peer reviewer comments 2
Editor who approved publication: Professor Manfred Ogris
Pan Lei,1,2 Wanying Shen,2 Huijuan Tang,2 Li You,2 Guoyi Chen,2 Yijun Tang,1 Wei Lu3
1Hubei Key Laboratory of Embryonic Stem Cell Research, Taihe Hospital, Hubei University of Medicine, Shiyan, People’s Republic of China; 2Hubei Hongshan Laboratory, College of Biomedicine and Health, College of Life Science and Technology, Huazhong Agricultural University, Wuhan, People’s Republic of China; 3Department of Pharmacy, Taihe Hospital, Hubei University of Medicine, Shiyan, People’s Republic of China
Correspondence: Yijun Tang, Hubei Key Laboratory of Embryonic Stem Cell Research, Taihe Hospital, Hubei University of Medicine, Shiyan, People’s Republic of China, Email [email protected] Wei Lu, Department of Pharmacy, Taihe Hospital, Hubei University of Medicine, Shiyan, People’s Republic of China, Email [email protected]
Purpose: Adagrasib is a selective and reversible inhibitor of KRAS G12C, which significantly delays the progression of solid tumors. However, the absorption, distribution, metabolism, and excretion of adagrasib in vivo are unclear. This study explores the absorption and distribution of adagrasib in vivo.
Methods: An ultra-high performance liquid chromatography-tandem quadrupole mass spectrometry (UPLC-MS/MS) method was established for the determination of adagrasib in the rat plasma and tissue. Sprague-Dawley rats were intravenous administrated (5 mg/kg) and oral administrated (30 mg/kg) with adagrasib, and the plasma concentration of adagrasib was determined. After single oral administration of adagrasib (30 mg/kg), the heart, liver, spleen, lung, kidney, intestine, and pancreas were excised. The organs were homogenized with saline solution, and the concentration of adagrasib in tissues was determined.
Results: The intra- and inter-day accuracy were from 84.90% to 113.47%, and the precision was within ± 15%. The matrix effect and recovery were within ± 15%. The maximum plasma concentration (Cmax) of adagrasib was 677.45 ± 58.72 ng/mL. The elimination half-life time (t1/2) was 3.50 ± 0.21 h after oral administration and 2.08 ± 0.54 h after intravenous administration. The oral bioavailability was 50.72%. The highest concentrations of adagrasib in liver was 5047.80 ± 676.48 ng/g at 2 h after administration, and it was still detectable at 24 hours after administration.
Conclusion: Adagrasib was slowly absorbed and cleared rapidly, and it was also widely distributed in vivo. This study provides a potential reference for adagrasib in clinical studies.
Keywords: adagrasib, UPLC-MS/MS, pharmacokinetics, tissue distribution
Introduction
The rat sarcoma (RAS) family genes, including Kirsten RAS (KRAS), Harvey RAS (HRAS), and neuroblastoma RAS (NRAS). RAS genes are the most prevalent and foremost genetic alteration in human cancers.1,2 KRAS is the most frequently mutated among the three isoforms; indeed, more than 85% are KRAS aberrations. The highest rate of KRAS mutations located in pancreatic cancer (−90%), colorectal cancer (30–40%), and lung adenocarcinoma (−32%).3 A total of 80% of carcinogenic mutations occur in the codon 12 in KRAS mutated tumors, and the most popular mutation sites are KRAS G12C, KRAS G12D, and KRAS G12V.4 Nearly 43% of mutations in non-small cell lung cancer (NSCLC) are KRAS G12C.5
Over the past decades, KRAS oncoprotein was intensively studied, but it has been considered as an “undruggable” target because of its high affinity for cytoplasmic GTP, the smooth surface of the RAS protein without a drug binding, multiple upstream and downstream regulators enabling multiple resistance mechanisms as well as the ability to bypass signals to overcome inhibition.6 The discovery of an allosteric binding site behind the switch II region in KRAS G12C-mutant protein provides the possibility of developing inhibitors of the mutated KRAS. Many small molecular compounds have been designed to inhibit the mutated KRAS, with the attempt to target upstream regulators, downstream effectors, and mutant KRAS protein itself.7–10 However, only Sotorasib (AMG 510) and Adagrasib were approved as a treatment against KRAS G12C-mutated locally advanced or metastatic non-small-cell lung cancer due to the poor metabolic stability and/or bioavailability of other inhibitors.5,11,12
Adagrasib is a potent, orally available, small molecule covalent inhibitor of KRAS G12C, which irreversibly and selectively binds it in its inactive GDP-bound state. It was approved by FDA in 2022 as an oral KRAS G12C inhibitor in the treatment of NSCLC. Adagrasib inhibits or delays cancer progression, and reduces NSCLC patient mortality with KRAS G12C mutation at a dose of 600 mg by oral administration twice daily.13 In addition, preliminary data indicate excellent clinical activity in other cancers with KRAS G12C mutations, including colorectal, pancreatic, and biliary tract cancers, as well as other gastrointestinal and non-gastrointestinal cancers.
Few studies are available on the pharmacokinetic studies of adagrasib. Hallin evaluated the concentration of adagrasib in H358 tumor-bearing mice plasma after oral administration of 30 mg/kg.12 The concentration was over 1000 ng/mL at 6 h after administration, and it was still detectable after 72 h. Du developed a HPLC-MS method and investigated the pharmacokinetic of adagrasib in SD rats. The t1/2 was 10.13 h, the time to reach the maximum plasma concentration (tmax) was 6 h, and the maximum concentration (Cmax) was 122.3 ng/mL after oral administration (15 mg/kg).14 Fell evaluated the intravenous and oral pharmacokinetic parameters of adagrasib in mice, rats, and dogs.15 The t1/2 after intravenous administration (3 mg/kg) was 1.51 h (mouse), 2.57 h (rat), and 7.56 h (dog). The t1/2 after oral administration of 30mg/kg adagrasib was 0–4.00 h, and the Cmax was 252–2410 ng/mL. The oral bioavailability was from 25.9 to 62.9% in the three species. The pharmacokinetic of adagrasib was also evaluated in healthy volunteers. The tmax after the administration of the recommended dose of 600 mg was 4.17 h and the t1/2 was 23.0 h, while the tmax was 2.96 h after multiple-dose administration the Css min was 2,693 ng/mL. However, these studies do not completely reflect the absorption, distribution, metabolism, and excretion of adagrasib in vivo. Therefore, a reproducible UPLC-MS/MS assay was developed and fully validated for determining the concentration of adagrasib in plasma and tissues. Furthermore, the method was successfully used in the pharmacokinetic study of rats and tissue distribution after oral and intravenous administration. The results might provide a basis for the clinical study of adagrasib.
Materials and Methods
Chemicals and Reagents
Adagrasib (purity >98%, 20211017) was purchased from Shanghai Ronbio Scientific Co., Ltd (Shanghai, China), and Lapatinib-d4 (purity 99.5%, 22T077-Y1) used as the internal standard was purchased from Shanghai, ZZBIO Co., Ltd. (Shanghai, China). The chemical structures of adagrasib and Lapatinib-d4 are shown in Figure 1. Formic acid was provided by Tianjin Kemiou Chemical Reagent Co. (Tianjin, China). Redistilled and deionized water was used throughout the entire study. HPLC grade acetonitrile and methanol were purchased from Merck (Darmstadt, Germany).
 |
Figure 1 Chemical structures of adagrasib and Lapatinib-D4 (IS). |
Instrumentation and LC-MS/MS Conditions
The concentrations of adagrasib in plasma and tissue homogenate were determined by Waters ACQUITY UPLC system (Waters, Milford, MA, USA) and Micro mass Quattro Micro API mass spectrometer (Waters, Milford, MA, USA). The electrospray ionization source interface was operated in positive mode. The capillary voltage was 3.0 kV, the source temperature was 150°C, and the desolvation temperature was 400°C. Desolvation gas flow rate was 800 L/h. The collision gas flow rate was 0.17 mL/min. The MS/MS parameters for adagrasib and Lapatinib-D4 are listed in Table 1. The fragmentation patterns for adagrasib and the Lapatinib-D4 are shown in Figure 2.
 |
Table 1 Optimization of Mass Parameters of Adagrasib and Lapatinib-D4 |
 |
Figure 2 Mass fragmentation pattern of adagrasib (A) and Lapatinib-d4 (B). |
Separation was achieved on an ACQUITYTM UPLC BEH C18 column (2.1 × 50 mm; 1.7 µm). The mobile phases were 0.1% formic acid in water (solvent A) and acetonitrile (solvent B), and the flow rate was 0.3 mL/min. The gradient program was as follows: 0–0.5 min, 90% A; 0.5–3.0 min, 90%–10% A; 3.0–4.0 min, 10% A; 4.0–4.5 min, 10%–90% A; 4.5–5.0 min, 90% B. The column temperature was 45 °C, and the injection volume was 5 µL.
Calibration and Quality Control (QC) Sample Preparation
The stock solution of adagrasib was prepared in methanol at 5.586 mg/mL. Working solutions of adagrasib were prepared in methanol by diluting the stock solutions, the concentrations were 2.79, 5.57, 11.17, 27.93, 55.86, 111.7, 279.30, 558.60, 1117.2, and 2793.00 ng/mL. The QC solution was prepared in methanol by diluting the stock solutions, to obtain the following concentrations: 2094.75 ng/mL, 837.90 ng/mL, 418.95 ng/mL, 209.47 ng/mL, 167.58 ng/mL, 83.79 ng/mL, 20.95 ng/mL, 16.76 ng/mL, and 8.38 ng/mL. The Lapatinib-d4 stock solution was 0.507 mg/mL, then diluted in methanol to obtain a working solution of 50.70 ng/mL. All stock and working solutions were stored at 4 °C.
The calibration solution and QC solution of adagrasib (100 µL) were added into centrifuge tubes, and they were evaporated under nitrogen. Next, blank plasma or homogenate (100 µL) was added to the tubes and vortex for 5 min to prepare the calibration curve samples, plasma QC samples, and homogenate QC samples. Then, the samples of the calibration curves and QC were used in the protocol described in the paragraph “Sample preparation”.
Sample Preparation
A simple protein precipitation method was used to extract adagrasib from rat plasma and tissue homogenate. One hundred microliters plasma or homogenate was mixed with 100 µL Lapatinib-d4 solution (50.70 ng/mL) and 500 µL methanol. Then, the mixture was mixed by vortex for 60s to precipitate proteins. Then, the mixture was centrifugated at 20,800×g and 4 °C for 10 min, the supernatant was collected and transferred to a new tube and evaporated to dry under nitrogen. The obtained residue was reconstituted in 100 mL 10% acetonitrile–90% water (containing 0.1% formic acid) and centrifuged (20,800×g and 4 °C for 10 min). Then, supernatant (5 µL) was injected into the UPLC-MS/MS system for analysis.
Method Validation
Method validation was based on the principles of the bioanalytical method validation guidelines,16,17 which including selectivity, specificity, carryover, calibration curve, matrix effects, extraction recovery, precision and accuracy, stability.
Selectivity and specificity were validated by comparing the chromatograms of different sources of blank rat plasma, blank rat plasma spiked with adagrasib at LLOQ, and the plasma samples after oral administration of adagrasib. Carry-over was assessed by the comparison of an extract of blank plasma injected immediately after the injection of the highest calibration standard in triplicate.
Linearity was determined by analyzing the calibration curves using 7–9 concentrations. Calibration curves were constructed by plotting peak area ratios (analyte/internal standard) versus the concentrations of the calibration solution. The LLOQ was defined as the lowest calibration points in the calibration curve.
Intra-day precision and accuracy were evaluated in six replicates at four levels within one day. Inter-day precision and accuracy were assessed based on the analysis of the same QC samples on three consecutive days. RSD was evaluated to determine precision, and accuracy was represented by a percentage of the nominal concentration (%). The precision should be within 15%, and the accuracy should be in 85–115% except for LLOQ (80–120%).
The extraction recovery of adagrasib was assessed by comparing the peak area from six replicate QC samples at LQ, MQ, and HQ that were spiked with analytes prior to extraction with the peak area of those that were spiked with blank biological samples. The matrix effects were evaluated by comparing the peak areas of the analytes in post-extracted blank biological samples spiked with QC samples with those of pure standard solutions with the same concentration that were dried directly and reconstituted with the mobile phase. All matrix effects and extraction recoveries were determined at three concentrations, and the QC samples were prepared using one source of plasma. The ratio of extraction recoveries should be >85% and <115%, whereas the RSD should be <15%.
Three levels of adagrasib QC samples in plasma and homogenates were used to evaluate the stability under different storage conditions, it included three freeze-thaw stability (from −20 °C to 25 °C), long-term stability (−80 °C for 14 days), short-term stability (25 °C for 6 h), and post-processing stability (4 °C for 24h). They were considered as stable if the accuracy was 85–115% and precision was within ± 15%.
Animal Study
Forty-five male Sprague-Dawley rats (180–220 g) were purchased from Hubei University of Medicine Animal Laboratory (Shiyan, China). Rats were fed for a week at 25 ± 2 °C and 55% ± 5% relative humidity before test. The study protocols were approved by the Hubei University of Medicine’s Institutional Animal Care and Uses Committee, and all the animal-related experimental procedures were conducted in accordance with the Guide for the Care and Use of Laboratory Animals. The animals were fasted overnight before drug administration.
The solutions of adagrasib were performed using solution with an oral dose of adagrasib at a concentration of 3.0 mg/mL in 5% carboxymethyl-cellulose sodium (the dosage was 30 mg/kg and 10 mL/kg) in pharmacokinetic study. The adagrasib solution for intravenous injection was prepared at a concentration of 5 mg/mL in polyethylene glycol 400 and dimethyl sulfoxide (8%). Twenty rats were divided into two groups (n = 10), one for the intravenous administration of 5 mg/kg and the other one for the oral administration of 30 mg/kg adagrasib. Rats were slightly anesthetized with ethyl ether before the collection of approximately 150 µL from the suborbital vein and placed into heparinized tubes at 0.25 h, 0.50 h, 0.75 h, 1 h, 1.5 h, 2 h, 3 h, 4 h, 6 h, 8 h, 10 h, and 24 h after adagrasib administration. All rats were treated with the same volume of saline by gavage after each three-sample collection. The blood samples were centrifuged at 20800×g and 4°C for 10 min and stored at −80 °C.
The tissue distribution study was performed using 25 rats that received a single oral administration of adagrasib at 30 mg/kg. The rats were anesthetized with ethyl ether at 1.0, 2.0 h, 4.0 h, 8.0 h, and 24 h (n = 5) after administration and the blood samples were collected from the abdominal aorta. The rats were perfused with saline solution, and the heart, liver, spleen, lung, kidney, intestine, and pancreas were excised. The organs were washed with cold physiological saline (4 °C), and all tissue samples of each organ were collected, weighed, and homogenized with saline solution (1:3, w/v). The homogenized samples were processed as described in the “sample preparation” paragraph.
DAS 3.2 software package (edited by the Chinese Mathematical Pharmacology Society) was used for the pharmacokinetic data analysis, and the non-compartmental model was applied. The Cmax, t1/2, Tmax, AUC0-t, MRT, CL, and Vd were obtained. The absolute oral bioavailability F of adagrasib was measured by comparing each AUC 0–t value after intragastric (i.g.) and intravenous (i.v.) administration and the equation: F = (AUC i.g./Dose i.g.)/(AUC i.v./Dose i.v.).
Results and Discussion
Method Development and Optimization
Method development was performed by full mass scan and was performed under positive ionization mode and then the corresponding product ions for adagrasib and Lapatinib-D4, they were shown in Figure 2. Cone energy and collision energy were optimized to achieve optimal intensity. Several mobile phases and additives at different concentrations were evaluated. Both methanol and acetonitrile were tested as organic mobile phases, formic acid (0.05%, 0.1%, and 0.2%) and ammonium formate (2 mM and 5 mM) were investigated as additives to the mobile phases. The result shows that 0.1% formic acid was added into aqueous phase cloud to increase the intensity on Acquity UPLC BEH C18 column.
Method Validation
Specificity and Carry-Over
As shown in Figure 3, no obvious interferences were observed in the spiked samples and practical samples. The peak area of adagrasib and IS in the blank plasma and tissue homogenate injected after the higher limit of quantification sample was 1.6% of the LLOQ and <0.9% of the IS. The result shows that the method had good selectivity and specificity in plasma and homogenates, and the carry-over effect conforms the requirement.
 |
Figure 3 Typical chromatograms of adagrasib and Lapatinib-d4. (A) Blank rat plasma sample. (B) Blank rat plasma sample spiked with adagrasib at LLOQ and IS at 50.70 ng/mL; (C) rat plasma sample at 4 h after oral administration of 30 mg/kg adagrasib spiked with IS (50.70 ng/mL). Number 1 is adagrasib, 2 is Lapatinib-D4 (IS). |
Linearity and LLOQ
The calibration curve and linear range of adagrasib in different biological samples are shown in Table 2. The calibration curves fitted well, and the correlation coefficient r2 exceeding 0.99. The LLOQ was the lowest point of the calibration curve, and the signal-to-noise of LLOQ was higher than 10:1.
 |
Table 2 Linear Ranges, Linear Equations, Correlation Coefficients, and LLOQ of Adagrasib in Plasma and Tissue Homogenate |
Precision and Accuracy
The intra- and inter-day accuracy and precision assessed at four levels of QCs, and the results are shown in Table 3. The accuracy of adagrasib ranged from 84.90% to 113.47% in plasma and tissue homogenate. The precisions of adagrasib ranged from 1.96% to 10.69%. The accuracy and precisions were within acceptable limits. The results demonstrated that the method was reliable and reproducible.
 |
Table 3 Intra-and Inter-Day Accuracy and Precision of Adagrasib in Rat Plasma and Tissue Homogenate |
Recovery and Matrix Effect
The matrix effect of adagrasib ranged from 95.80% to 104.83%, and the extraction recovery was between 90.72% and 103.76% in plasma and tissue homogenate (Table 4); the RSD was <8.81%. These results demonstrated that pretreatment of plasma samples and homogenate with protein precipitation resulted in a stable extraction efficiency, and the ion suppression or enhancement matrix could be ignored.
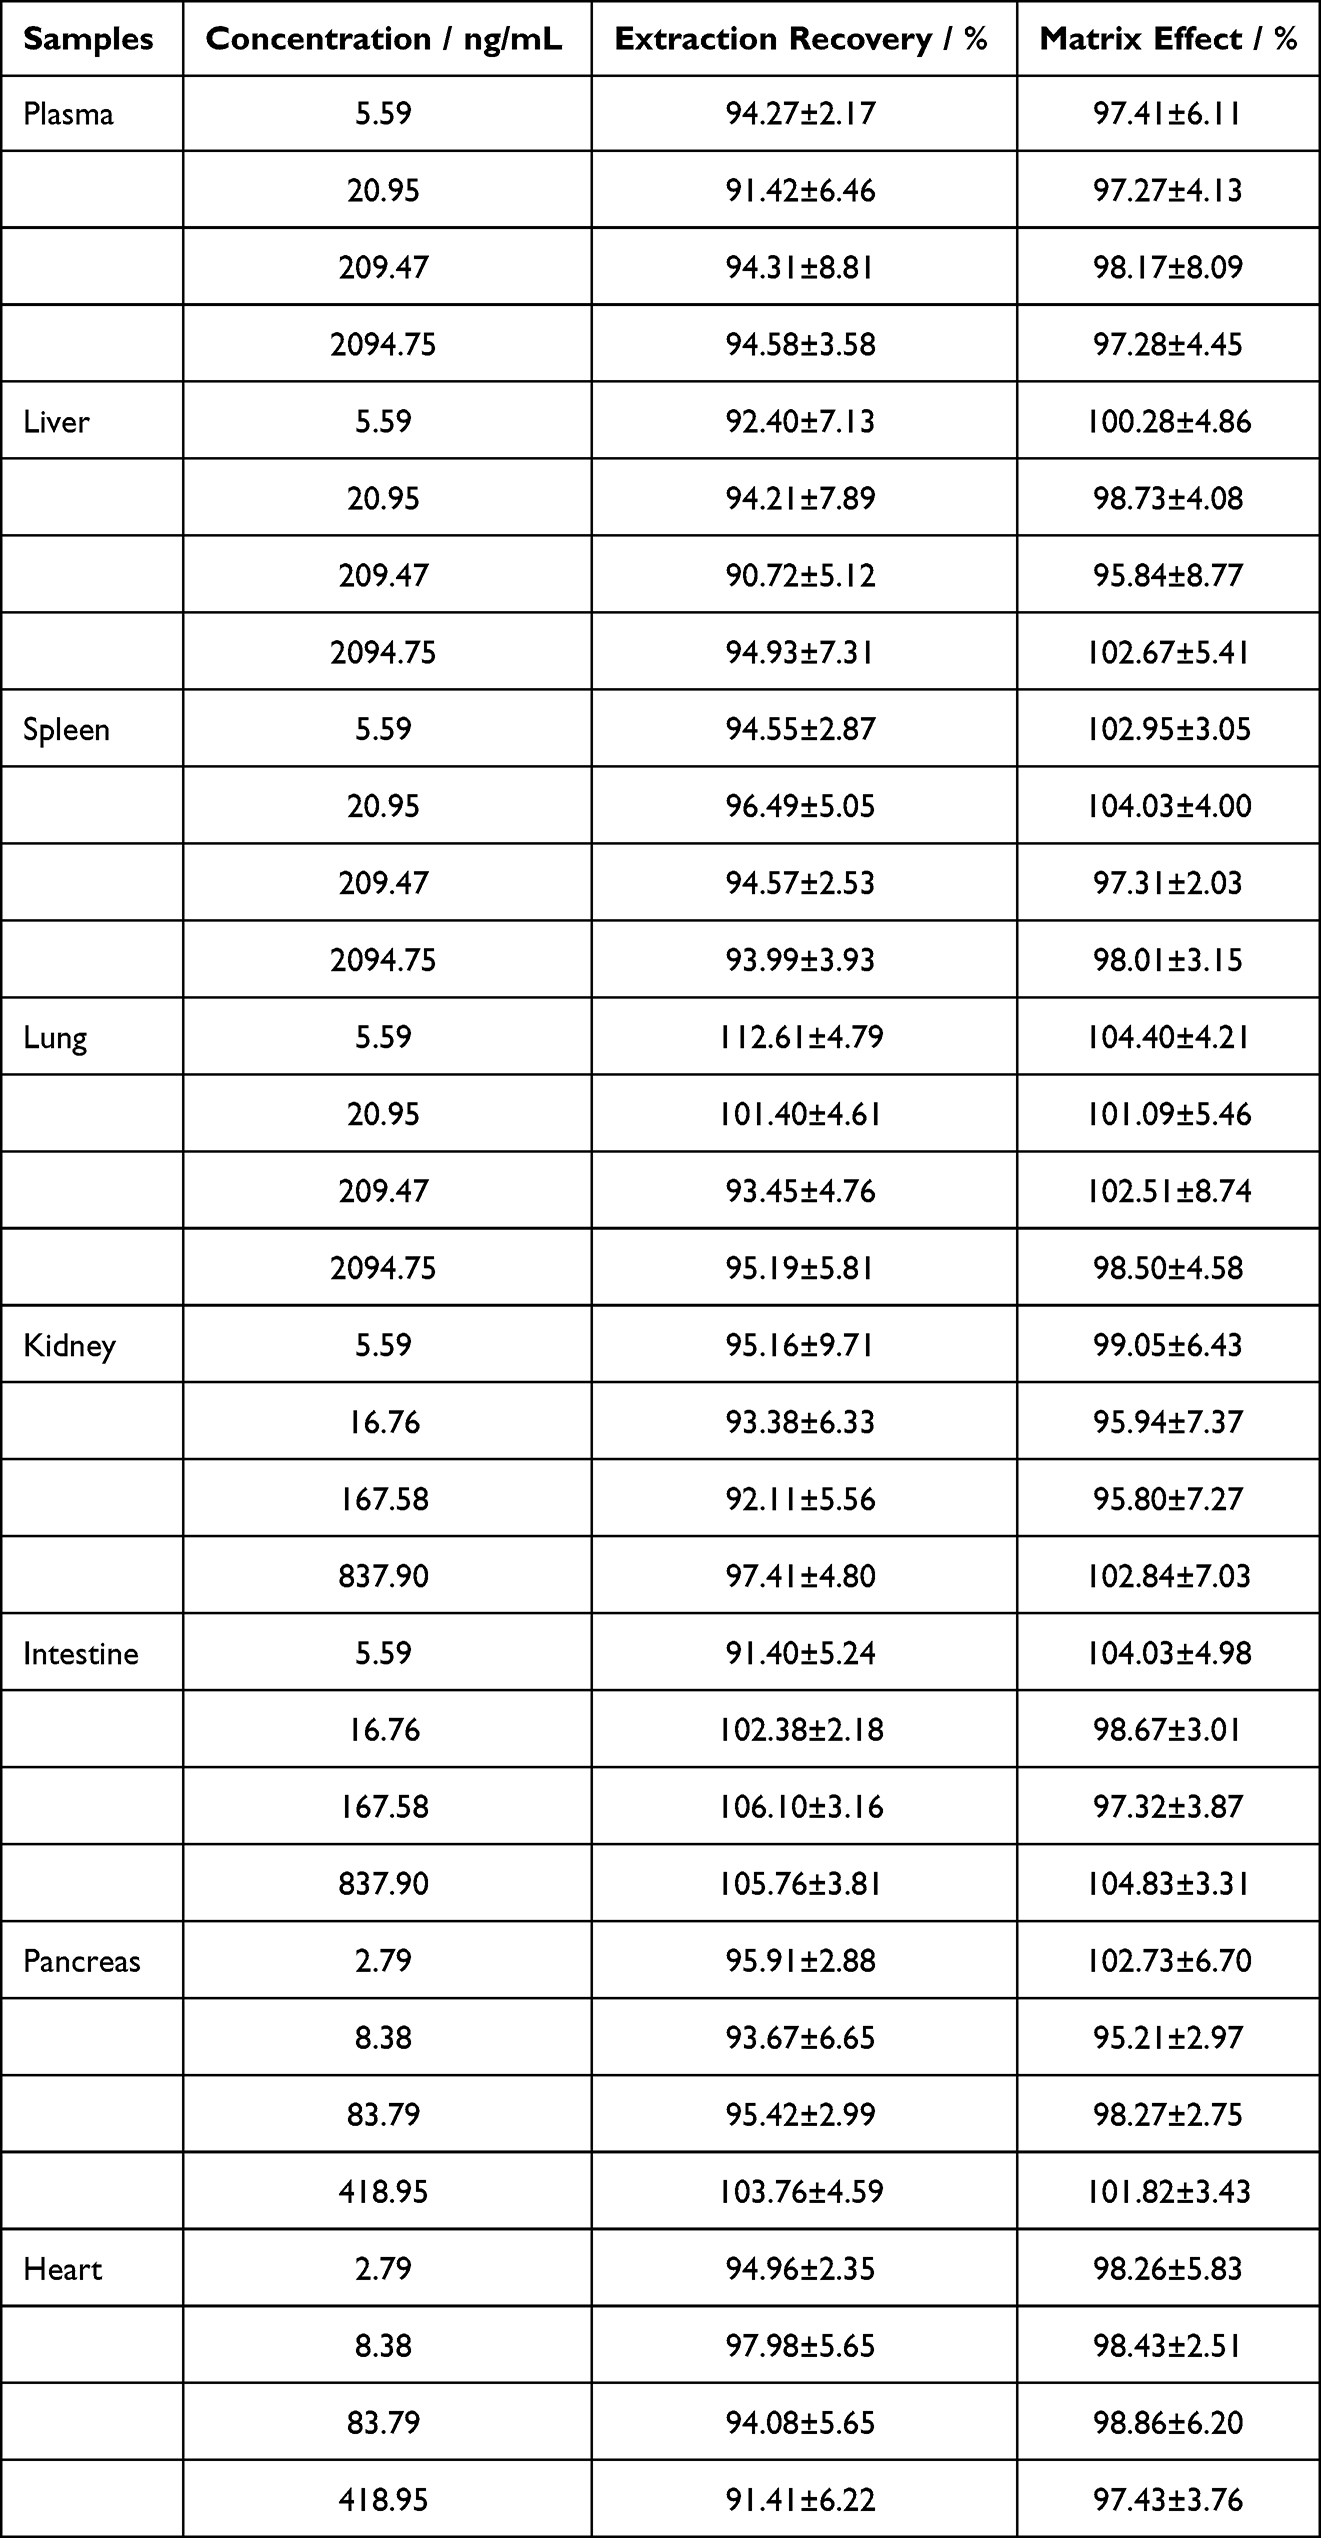 |
Table 4 Matrix Effect and Extraction Recovery of Adagrasib in Rat Plasma and Tissue Homogenate (Means ± RSD, n = 6) |
Stability
The result of stability is summarized in Table 5. Adagrasib was stable in plasma samples and homogenate stored at room temperature (25 °C for 24 h), in the sampler at 4 °C for 24 h, three freeze-thaw cycles (from −20 °C to 25 °C) and at −80 °C for 14 days. The accuracy was between 89.04% and 108.36% in plasma, as well as liver, kidney, and pancreas homogenate. All the RSDs were within 7.21%.
 |
Table 5 Stability of Adagrasib in Rat Plasma and Tissue Homogenate (%, n = 6) |
Animal Study
Pharmacokinetics Study
Adagrasib was detected in the plasma samples of rats after the injection of 5 mg/kg into tail vein and oral administration of 30 mg/kg to rats. The plasma concentration–time curves are shown in Figure 4, and the main pharmacokinetic parameters are shown in Table 6. A previous article reported that the Tmax of adagrasib was 4–6 h in mice, rats, and dogs. The Tmax of adagrasib in this study was 3.20±0.42 h, thus, being in line with previous studies, and suggesting that adagrasib was slowly absorbed. The Cmax was 677.45±58.72 ng/mL after oral administration of 30 mg/kg adagrasib, and this result agreed with previous studies using H358 tumor-bearing mice and rats after a single oral dose of 30 mg/kg.12,15 The t1/2 of adagrasib varied among different animals, from 1 h to 10.13 h. The t1/2 was also investigated in healthy volunteers, which was 23.0 h after oral administration of 600 mg adagrasib. Our results demonstrated that adagrasib was cleared very rapidly, with a t1/2 of adagrasib of 3.50±0.21 h after oral administration and 2.08 ± 0.54 h after intravenous administration in rats. Adagrasib disappeared completely from the plasma 10 h after intravenous administration, with a very low plasma concentration at 24h after single oral administration. However, Hallin reported that adagrasib was still detectable after 72 h in the plasma of H358 tumor-bearing mice after a single oral dose of 30 mg/kg.12 The difference in t1/2 might be related to the different animals used and the way of administration. The absolute oral bioavailability of adagrasib was also calculated, which was high (50.92%), and it was consistent with previous studies (25.9% to 62.9%).
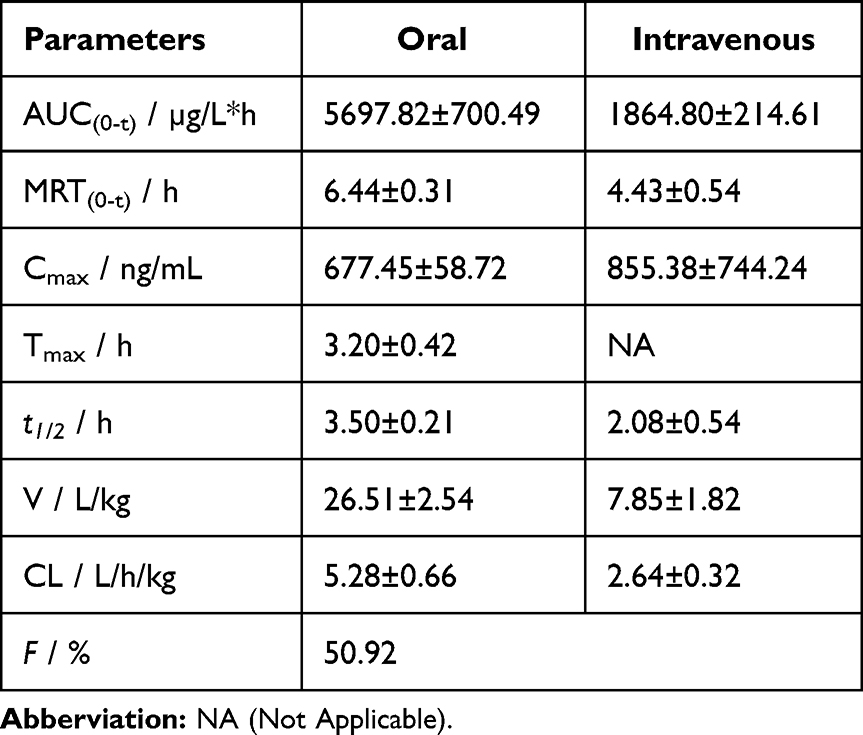 |
Table 6 Pharmacokinetic Parameters of Adagrasib in Rat Plasma After Oral Administration at 30 mg/kg and Intravenous Administration at 5 mg/kg |
 |
Figure 4 Mean plasma concentration - time curves for adagrasib in rats after intragastric administration of adagrasib at 30 mg/kg (A) and intravenous administration at 5 mg/kg (B). Values are expressed as mean ± SD (n = 10). |
Tissue Distribution
The tissue distribution of adagrasib in rats was investigated at 1, 2, 4, 8, and 24 h after oral administration of 30 mg/kg. Figure 5 shows the wide distribution of adagrasib in the main organ liver, kidney, lung, spleen, heart, pancreas, and intestine. The highest concentrations of adagrasib in liver were 5047.80 ± 676.48 ng/g at 2 h after administration. The highest concentrations in kidney, lung, pancreas, and heart were 1787.02 ± 364.44 ng/g, 3897.76 ± 217.27 ng/g, 648.72 ± 305.97 ng/g, and 70.49 ± 32.73 ng/g, respectively, at 4 h after administration. The highest concentration in spleen was 3891.80 ± 699.19 ng/g at 8 h after administration. Unlike plasma pharmacokinetics, adagrasib was still detectable in the organs (except intestine) at 24 hours after administration. Adagrasib was also measured in the testis, but it was not found. The results showed that the concentration of adagrasib in liver, spleen, kidney, and lung increased rapidly after administration, and they were higher than the concentration of the drug in plasma at the same time, which is indicated that adagrasib has high affinity to these organs. Adagrasib was quickly transferred from serum to the liver, sleep, lung, and kidney, and it was widely distributed into the tissues. Notably, the concentration of adagrasib in pancreas is also high, it was similar with the concentration in plasma, which indicates that adagrasib also has a high affinity to pancreas, and it may be used to treat with pancreatic tumors caused by KRAS G12C mutation.
 |
Figure 5 Mean concentration - time profiles of adagrasib in plasma (ng/mL), liver, heart, spleen, lung, kidney, pancreas, and intestine (ng/g) after oral administration of adagrasib at a dose of 30 mg/kg. Values are expressed as mean ± SD (n = 5). |
In this study, the pharmacokinetic and distribution of adagrasib in rats were investigated, but not the metabolism and excretion of adagrasib in vivo, which is one of the directions of our next work.
Conclusion
A sensitive, rapid, and reliable UPLC-MS/MS method was developed to evaluate adagrasib in rat plasma and tissue homogenate. The established method was successfully applied to the pharmacokinetic study of adagrasib in rats after different modes of administration, as well as its bioavailability and distribution. Therefore, the results might provide a potential reference for the quantitative determination of adagrasib in clinical studies.
Abbreviations
AUC, area under the plasma concentration–time curve; Cmax, maximum drug concentration; IS, internal standard; LLOQ, lower limit of quantification; QC, quality control; RAS, rat sarcoma; UPLC-MS, ultra performance liquid chromatography-tandem mass spectrometer; t1/2, half-life elimination time; Tmax, time to Cmax; AUC0-t, area under the concentration–time curve from 0 to the last time point; MRT, mean residence time; CL, clearance rate; Vd, apparent volume of distribution.
Funding
This work was supported by Hubei Province’s Outstanding Medical Academic Leader Program (Yijun Tang), China International Medical Foundation (202334).
Disclosure
The authors declare that there are no conflicts of interest.
References
1. Abankwa D, Gorfe AA, Inder K, Hancock JF. Ras membrane orientation and nanodomain localization generate isoform diversity. Proc Natl Acad Sci USA. 2010;107(3):1130–1135. doi:10.1073/pnas.0903907107
2. Thein KZ, Biter AB, Hong DS. Therapeutics targeting mutant KRAS. Annu Rev Med. 2021;72(1):349–364. doi:10.1146/annurev-med-080819-033145
3. Simanshu DK, Nissley DV, McCormick F. RAS proteins and their regulators in human disease. Cell. 2017;170(1):17–33. doi:10.1016/j.cell.2017.06.009
4. Prior IA, Lewis PD, Mattos C. A comprehensive survey of ras mutations in cancer. Cancer Res. 2012;72(10):2457–2467. doi:10.1158/0008-5472.CAN-11-2612
5. Reck M, Carbone DP, Garassino M, Barlesi F. Targeting KRAS in non-small-cell lung cancer: recent progress and new approaches. Ann Oncol. 2021;32(9):1101–1110. doi:10.1016/j.annonc.2021.06.001
6. Cx Z, Xq G, Xn Z, et al. Targeting KRAS mutant cancers: from druggable therapy to drug resistance. Mol Cancer. 2022;21(1):159. doi:10.1186/s12943-022-01629-2
7. Sf B, Mh U, Nagasaka M, et al. Targeting KRAS in pancreatic cancer: new drugs on the horizon. Cancer Metastasis Rev. 2021;40(3):819–835. doi:10.1007/s10555-021-09990-2
8. Tang DL, Kroemer G, Kang R. Oncogenic KRAS blockade therapy: renewed enthusiasm and persistent challenges. Mol Cancer. 2021;20(1):128. doi:10.1186/s12943-021-01422-7
9. Qian YZ, Gong YT, Fan ZY, et al. Molecular alterations and targeted therapy in pancreatic ductal adenocarcinoma. J Hematol Oncol. 2020;13(1):130. doi:10.1186/s13045-020-00958-3
10. Mao ZW, Xiao HY, Shen PP, et al. KRAS(G12D) can be targeted by potent inhibitors via formation of salt bridge. Cell Discov. 2022;8(1):5. doi:10.1038/s41421-021-00368-w
11. Canon J, Rex K, Saiki AY, et al. The clinical KRAS(G12C) inhibitor AMG 510 drives anti-tumour immunity. Nature. 2019;575(7781):217–223. doi:10.1038/s41586-019-1694-1
12. Hallin J, Engstrom LD, Hargis L, et al. The KRASG12C inhibitor MRTX849 provides insight toward therapeutic susceptibility of KRAS-mutant cancers in mouse models and patients. Cancer Discov. 2020;10(1):54–71. doi:10.1158/2159-8290.CD-19-1167
13. Jänne PA, Riely GJ, Gadgeel SM, et al. Adagrasib in non-small-cell lung cancer harboring a KRASG12C mutation. N Engl J Med. 2022;387(2):120–131. doi:10.1056/NEJMoa2204619
14. Du P, Xuan LL, An Z, Zhang YH. Development and validation of a robust and sensitive HPLC-MS/MS method for the quantitation of MRTX849 in plasma and its application in pharmacokinetics. Analyst. 2022;147(6):1175–1180. doi:10.1039/d1an01928g
15. Fell JB, Fischer JP, Baer BR, et al. Identification of the clinical development candidate MRTX849, a covalent KRASG12C inhibitor for the treatment of cancer. J Med Chem. 2020;63(13):6679–6693. doi:10.1021/acs
16. FDA. Bioanalytical method validation guidance for industry. USA; 2018. Available from: https://www.fda.gov/media/70858/download.
17. Chinese Pharmacopoeia Commission. Guidelines for validation of methods for quantitative analysis of biological samples, Chinese pharmacopoeia volume IV, China, Beijing; 2020. 466–472.
 © 2024 The Author(s). This work is published and licensed by Dove Medical Press Limited. The full terms of this license are available at https://www.dovepress.com/terms.php and incorporate the Creative Commons Attribution - Non Commercial (unported, v3.0) License.
By accessing the work you hereby accept the Terms. Non-commercial uses of the work are permitted without any further permission from Dove Medical Press Limited, provided the work is properly attributed. For permission for commercial use of this work, please see paragraphs 4.2 and 5 of our Terms.
© 2024 The Author(s). This work is published and licensed by Dove Medical Press Limited. The full terms of this license are available at https://www.dovepress.com/terms.php and incorporate the Creative Commons Attribution - Non Commercial (unported, v3.0) License.
By accessing the work you hereby accept the Terms. Non-commercial uses of the work are permitted without any further permission from Dove Medical Press Limited, provided the work is properly attributed. For permission for commercial use of this work, please see paragraphs 4.2 and 5 of our Terms.