")
Back to Journals » Cancer Management and Research » Volume 16
Linking EMT Status of Circulating Tumor Cells to Clinical Outcomes in Lung Cancer
Authors Huangfu Y, Guo J, Zhao Y, Cao X, Han L
Received 14 November 2023
Accepted for publication 7 February 2024
Published 18 April 2024 Volume 2024:16 Pages 325—336
DOI https://doi.org/10.2147/CMAR.S449777
Checked for plagiarism Yes
Review by Single anonymous peer review
Peer reviewer comments 2
Editor who approved publication: Dr Chien-Feng Li
Yun Huangfu,1,* Jianxin Guo,1,* Yang Zhao,1,* Xuexia Cao,1 Lei Han2
1Henan Medical College, Zhengzhou, Henan Province, People’s Republic of China; 2Henan Eye Hospital, Henan Provincial People’s Hospital, Zhengzhou, Henan Province, People’s Republic of China
*These authors contributed equally to this work
Correspondence: Lei Han, Henan Eye Hospital, Henan Provincial People’s Hospital, No. 7 Weiwu Road, Zhengzhou, Henan Province, People’s Republic of China, Tel +86-15937121171, Email [email protected]
Background: Lung cancer (LC) remains a leading cause of cancer-related mortality worldwide, with its prognosis influenced by complex biological factors.
Objective: This study delves into the clinical relevance of circulating tumor cells (CTCs) and their Epithelial-Mesenchymal Transition (EMT) status in LC patients.
Methods: We enrolled 30 newly diagnosed LC patients and utilized the CanPatrol technique for the separation and categorization of CTCs from peripheral blood samples. Immunofluorescent staining identified epithelial (CK8/18/19, EpCAM), mesenchymal (Vimentin, Twist), and leukocyte (CD45) markers in these cells. Fluorescence microscopy analyzed the slides, and RECIST 1.1 criteria assessed treatment response. Spearman’s method was used to correlate CTCs’ EMT states with their count and clinical characteristics.
Results: Our findings reveal three distinct CTC groups: epithelial (E-CTCs), hybrid epithelial/mesenchymal (E/M-CTCs), and mesenchymal (M-CTCs). Significant statistical differences were observed in stages III–IV vs I–II, tumor sizes T3-T4 vs T1-T2, and in the presence or absence of distant metastasis and lymph node involvement. Notably, the count of E/M-CTCs was positively correlated with TNM staging, tumor size, lymph node, and distant metastasis. Changes in M-CTC count pre- and post-treatment closely mirrored disease progression and control, showing considerable consistency with RECIST criteria.
Conclusion: In conclusion, the EMT status of CTCs, especially E/M-CTCs, holds predictive value for LC staging, tumor size, and metastasis. Dynamic monitoring of M-CTCs can accurately reflect disease progression.
Keywords: lung cancer, circulating tumor cells, epithelial-mesenchymal transition, canpatrol technique, CTC classification
Introduction
Lung cancer (LC) consistently ranks as one of the most prevalent and deadly cancers worldwide.1–3 Despite advancements in early detection and therapeutic approaches, the overall five-year survival rate for LC patients remains disappointingly low.1,3,4 Traditional LC diagnostic methods, primarily relying on radiological and histopathological techniques, often only identify the disease at more advanced and less treatable stages.5 Moreover, while current treatment modalities including surgery, chemotherapy, radiation, and targeted therapies have improved outcomes to some extent, they are still hindered by significant challenges. These include variability in patient responses, and the risk of disease recurrence and metastasis, which limit their overall effectiveness.6,7
In the realm of LC diagnostics and prognosis, circulating tumor cells (CTCs) have emerged as a critical biomarker. These cells, originating from primary or metastatic tumors, circulate in the bloodstream and are indicators of disease progression and response to therapy.8–11 Alongside this, the phenomenon of epithelial-mesenchymal transition (EMT), where tumor cells undergo a transformation from epithelial to mesenchymal states, enhances their invasive and metastatic capabilities.12,13 The study of CTCs’ EMT status is increasingly recognized as crucial for understanding the intricacies of tumor metastasis and invasiveness in LC.
One of the breakthroughs in this field is the CanPatrol typing technology. This innovative method enables detailed analysis and classification of CTCs, shedding light on the intricate biological nature of LC. It has opened up new pathways for identifying potential biomarkers and therapeutic targets.14–16 By exploring the EMT status of CTCs in LC patients, we can better predict disease progression and individual responses to treatments, setting the stage for more personalized and effective therapeutic strategies.
This study, therefore, focuses on investigating the association between the EMT status of CTCs in the peripheral blood of LC patients and various clinical characteristics. Utilizing the advanced CanPatrol typing technology, we aim to elucidate the influence of CTCs’ EMT status on the clinical trajectory and treatment response in LC. Our objective is to provide deeper insights into LC pathobiology and to contribute valuable information that could guide future personalized treatment approaches, ultimately aiming to improve patient outcomes and quality of life.
Materials and Methods
Patient Selection and Sample Collection Methodology
This study enrolled 30 lung cancer (LC) patients (Table 1) diagnosed between January 2021 and August 2022 at Henan Provincial People’s Hospital. The diagnosis of LC was based on computed tomography (CT) scans or tissue biopsies. Of the patients, 16 were male and 14 were female, aged between 35 and 80 (median age of 63). All patients underwent histopathological examination for confirmation of diagnosis, with 15 cases of adenocarcinoma, 11 of squamous cell carcinoma, and 4 of other types. Disease staging was performed according to the International Association for the Study of Lung Cancer’s TNM classification: 9 cases were stage I, 4 were stage II, 8 were stage III, and 9 were stage IV. Inclusion criteria were: (1) patients who had not received any treatment before blood sample collection and (2) pathologically confirmed LC diagnosis. Exclusion criteria were: (1) patients with end-stage liver or kidney disease and (2) those with another malignancy within the past 5 years. Written informed consent was obtained from patients participating in this study.17 This research was conducted in adherence to the principles of the Declaration of Helsinki and was approved by Henan Medical College (HNYZLLWYH-2021-013).
 |
Table 1 The Background Information of Patients |
Isolation of Peripheral Blood CTCs Using CanPatrol Typing Detection Technology
5.0 mL of peripheral venous blood samples were collected from all patients before treatment and 17 LC patients within two cycles post-treatment (targeted therapy and chemotherapy). The CanPatrol™CTC technology (SurExam, Guangzhou, China) was employed for CTC enrichment. Firstly, erythrocyte lysis buffer was added to the red blood cells. The remaining cells were resuspended in PBS containing 4% formaldehyde (Sigma-Aldrich) and allowed to suspend for 5 minutes. Subsequently, the cell suspension was transferred to a filtration tube with a valve pressure of at least 0.08 MPa. The CTCs filtration system comprised a filtration tube, a calibration membrane with an 8 μm pore diameter (SurExam, Guangzhou, China), a vacuum valve setup (SurExam, Guangzhou, China), an E-Z 96 vacuum manifold (Omega, Norcross, USA), and a vacuum pump (Auto Science, Tianjin, China).18
Identification of CTCs via Immunofluorescence Staining
Firstly, CTCs were fixed onto slides and stained using antibodies against epithelial biomarkers CK8/18/19 and EpCAM (Abcam, UK), mesenchymal biomarkers Vimentin and Twist (Cell Signaling Technology, USA), and leukocyte biomarker CD45 (BD Biosciences, USA). Following staining, 4’,6-diamidino-2-phenylindole (DAPI, Sigma-Aldrich, USA) was used for nuclear staining to better identify and differentiate the cells. Images were captured using a high-resolution fluorescence microscope (Leica Microsystems, Germany). Quantitative analysis of positive signals, which appeared as specific punctate signals, was performed for each fluorescence channel.19
Criteria for Evaluating Treatment Outcomes
Treatment response was assessed using RECIST version 1.1, with responses categorized as Complete Response (CR), Partial Response (PR), Progressive Disease (PD), and Stable Disease (SD). Disease Control (DC) was defined as CR+PR+SD.20
Statistical Analysis
Data were analyzed using SPSS statistical software version 20.0. Continuous variables were presented as mean ± standard deviation( ± SD). Independent t-tests were used to compare means and distribution differences between the two groups, while one-way ANOVA was employed for multi-group analysis. For non-normally distributed data, the Mann–Whitney U-test was used to compare differences between the two groups. Correlations between the EMT status of CTCs quantity and clinical features were analyzed using the Spearman method. Categorical data were presented as counts or percentages (%), and Fisher’s exact test was used for comparative analysis. Correlations were represented using contingency coefficients, or Cramer’s V. A two-tailed P-value of less than 0.05 was considered statistically significant.
Results
E/M-CTCs Predominate as the Leading Circulating Tumor Cell Phenotype in Lung Cancer Patients
Through fluorescence signal analysis, we successfully categorized CTCs into three distinct phenotypes: E-CTCs, E/M-CTCs, and M-CTCs, as visually presented in Figure 1. We collected 5 mL blood samples from each patient for analysis and noted the median counts for each CTC phenotype.
 |
Figure 1 Identification of the three CTCs isolated from LC patients. Notes: Immunofluorescent staining detects the expression of epithelial markers (red fluorescence) and mesenchymal markers (green fluorescence). Representative images of the three types of CTCs isolated from LC patients are shown from left to right. (a) E-CTCs: epithelial marker+, mesenchymal marker-, CD45-, and DAPI+ cells; (b) E/M-CTCs: epithelial marker+, mesenchymal marker+, CD45-, and DAPI+ cells; (c) M-CTCs: epithelial marker-, mesenchymal marker+, CD45-, and DAPI+ cells. |
In pre-treatment samples, E-CTCs had a median count of 1, ranging from 0 to 8, indicating their relatively scarce presence in some patients. Conversely, E/M-CTCs exhibited the highest median count of 8, ranging from 0 to 30, underscoring its dominance as the primary CTC phenotype. M-CTCs had a median of 0, further corroborated in Figure 2a.
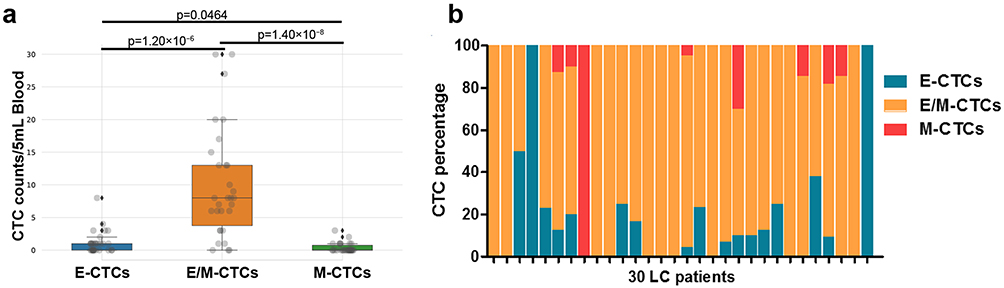 |
Figure 2 Distribution of CTC phenotypes in 30 LC patients before treatment. Notes: (a) Distribution of E-CTC, E/M-CTC, and M-CTC in 30 LC patients; (b) Percentage of E-CTC, E/M-CTC, and M-CTC among patients. |
Remarkably, we detected CTCs in all 30 patients, emphasizing the sensitivity and reliability of this approach. Of these, 56.7% of patients (17/30) exhibited the E-CTC phenotype, whereas the E/M-CTC phenotype typified 90% (27/30). In contrast, M-CTCs were identified in 26.7% of patients (8/30). Notably, three phenotypes coexisted in samples from 5 patients, revealing the intricacies and heterogeneity of LC biology. Furthermore, two patients displayed a blend of M-CTC and E/M-CTC phenotypes, while 11 exhibited a combination of E-CTC and E/M-CTC. We also observed 10 patients exclusively presenting the E/M-CTC phenotype, confirming its predominance. Additionally, one patient each exclusively displayed the E-CTC and M-CTC phenotypes, elaborated in Figure 2b.
Through this profound examination, the results shed light on the diversity and abundance of CTCs in LC patients, accentuating the distribution and coexistence patterns of different CTC phenotypes.
E/M-CTC Counts Significantly Correlate with Clinical Staging and Metastatic Features in Lung Cancer Patients
Furthering our investigation, we meticulously analyzed the association between the CTC types and clinical features in the 30 LC patients, with detailed data in Tables 2–4. Notably, when comparing the distribution of E/M-CTCs across different TNM staging groups, a significant difference was identified between stages I–II and III–IV (p=0.0001) (Figure 3a), indicating a notable alteration in the expression level of E/M-CTCs between these two phases. Secondly, in analyzing T stage, we observed a significant discrepancy in the expression of E/M-CTCs between tumors ≤5cm and those >5cm (p=0.0125) (Figure 3b). Likewise, in exploring N stage, individuals with lymph node metastasis (“yes” group) exhibited a significant difference in E/M-CTCs distribution compared to those without lymph node metastasis (“no” group) (p=0.0010) (Figure 3c). Further investigation revealed that, upon analyzing M stage, there was a significant difference in E/M-CTCs distribution between groups with (M1) and without (M0) distant metastasis (p=0.0039) (Figure 3d).
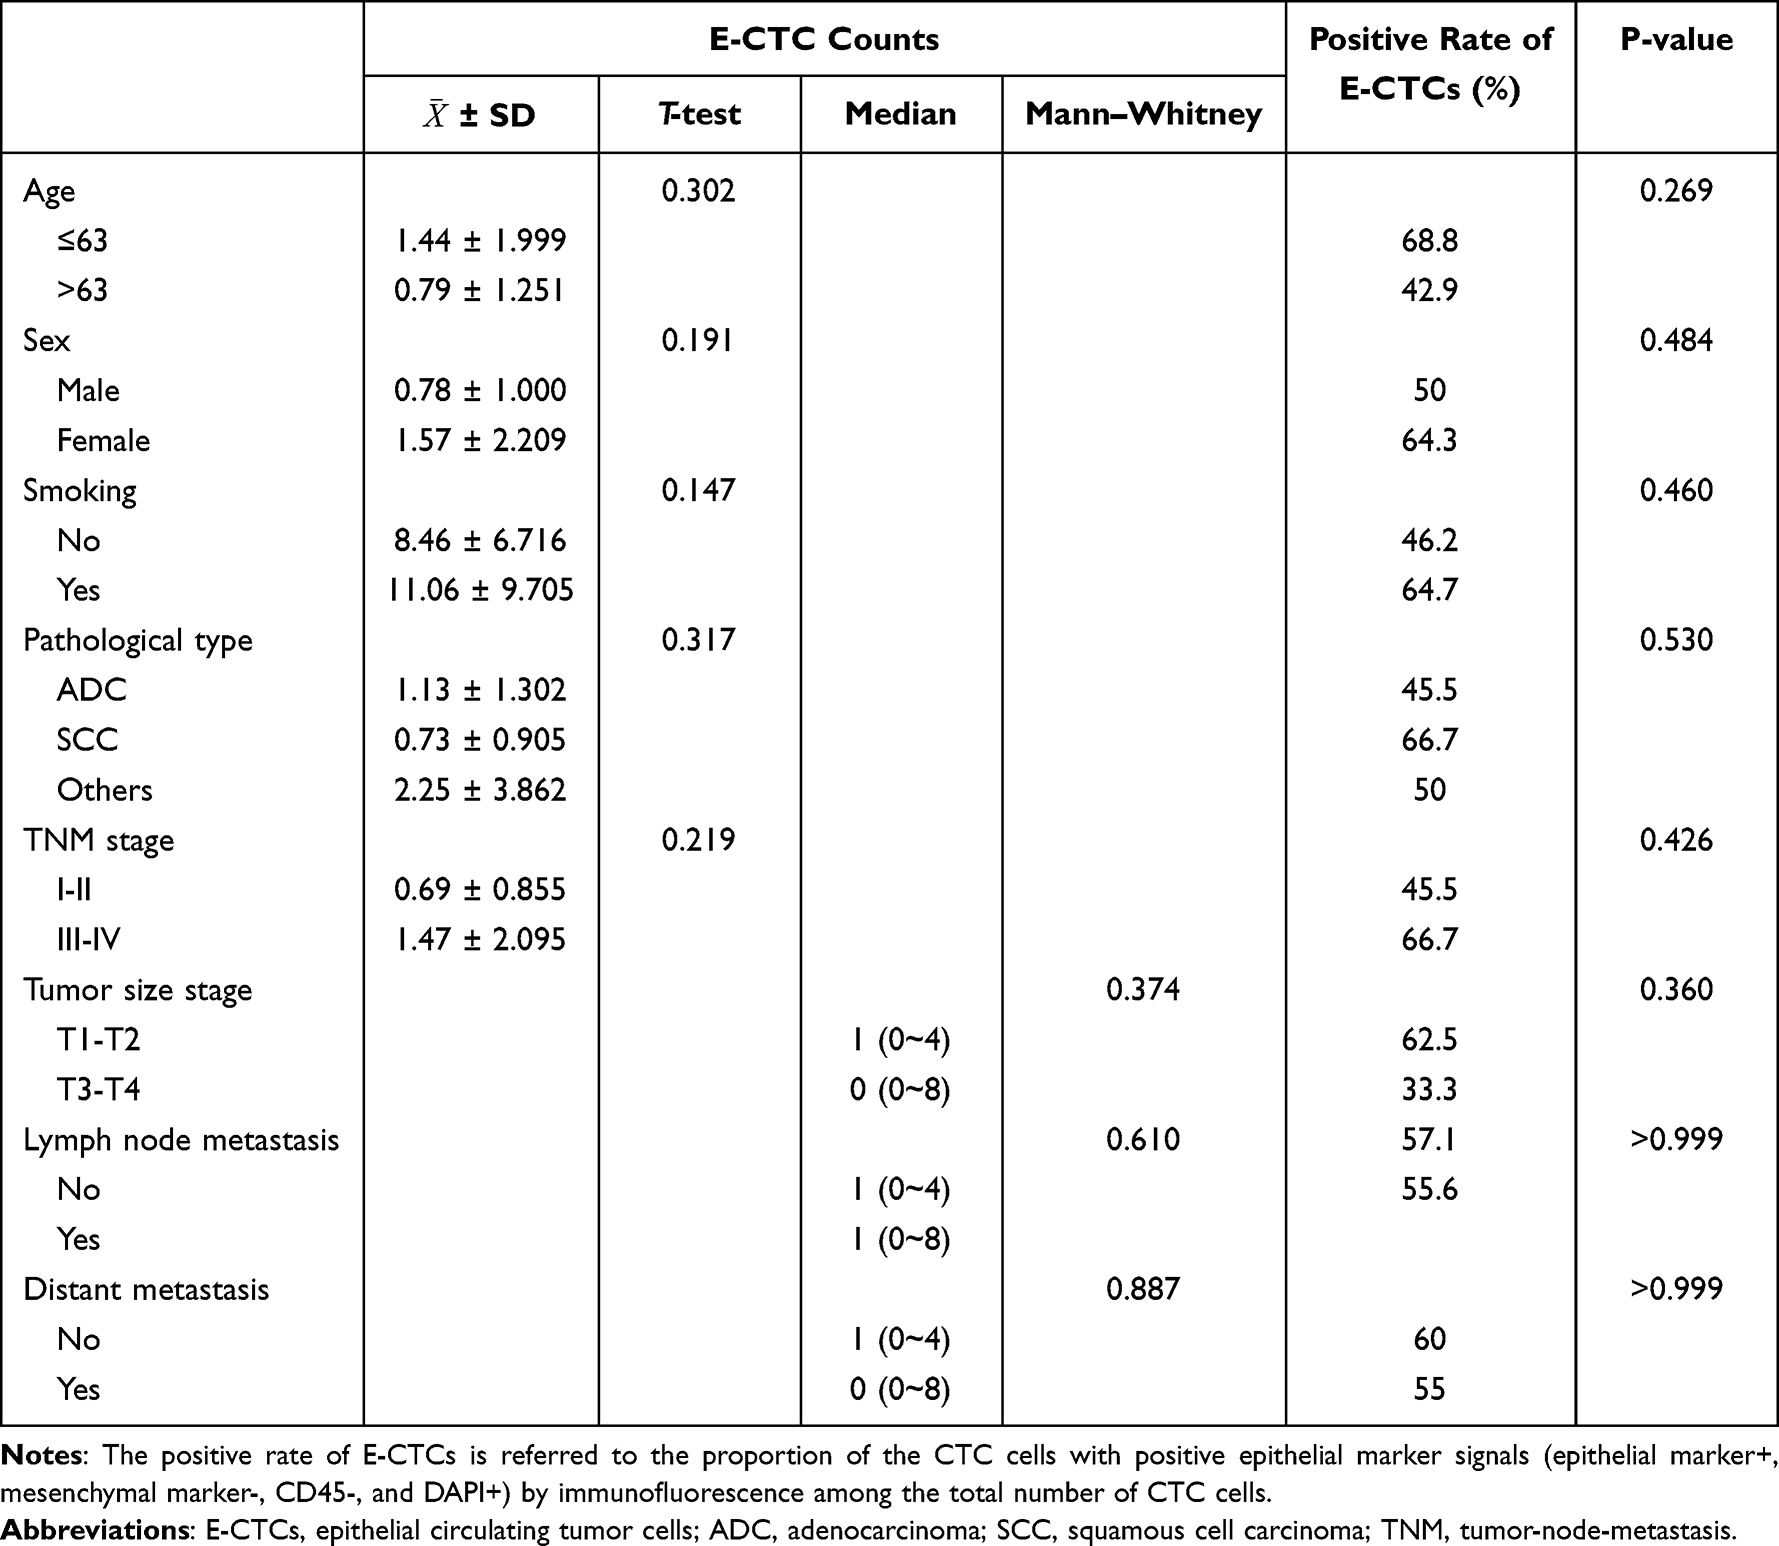 |
Table 2 Comparison of the Counts and Positive Rate of E-CTCs in Different Clinical Feature Groups |
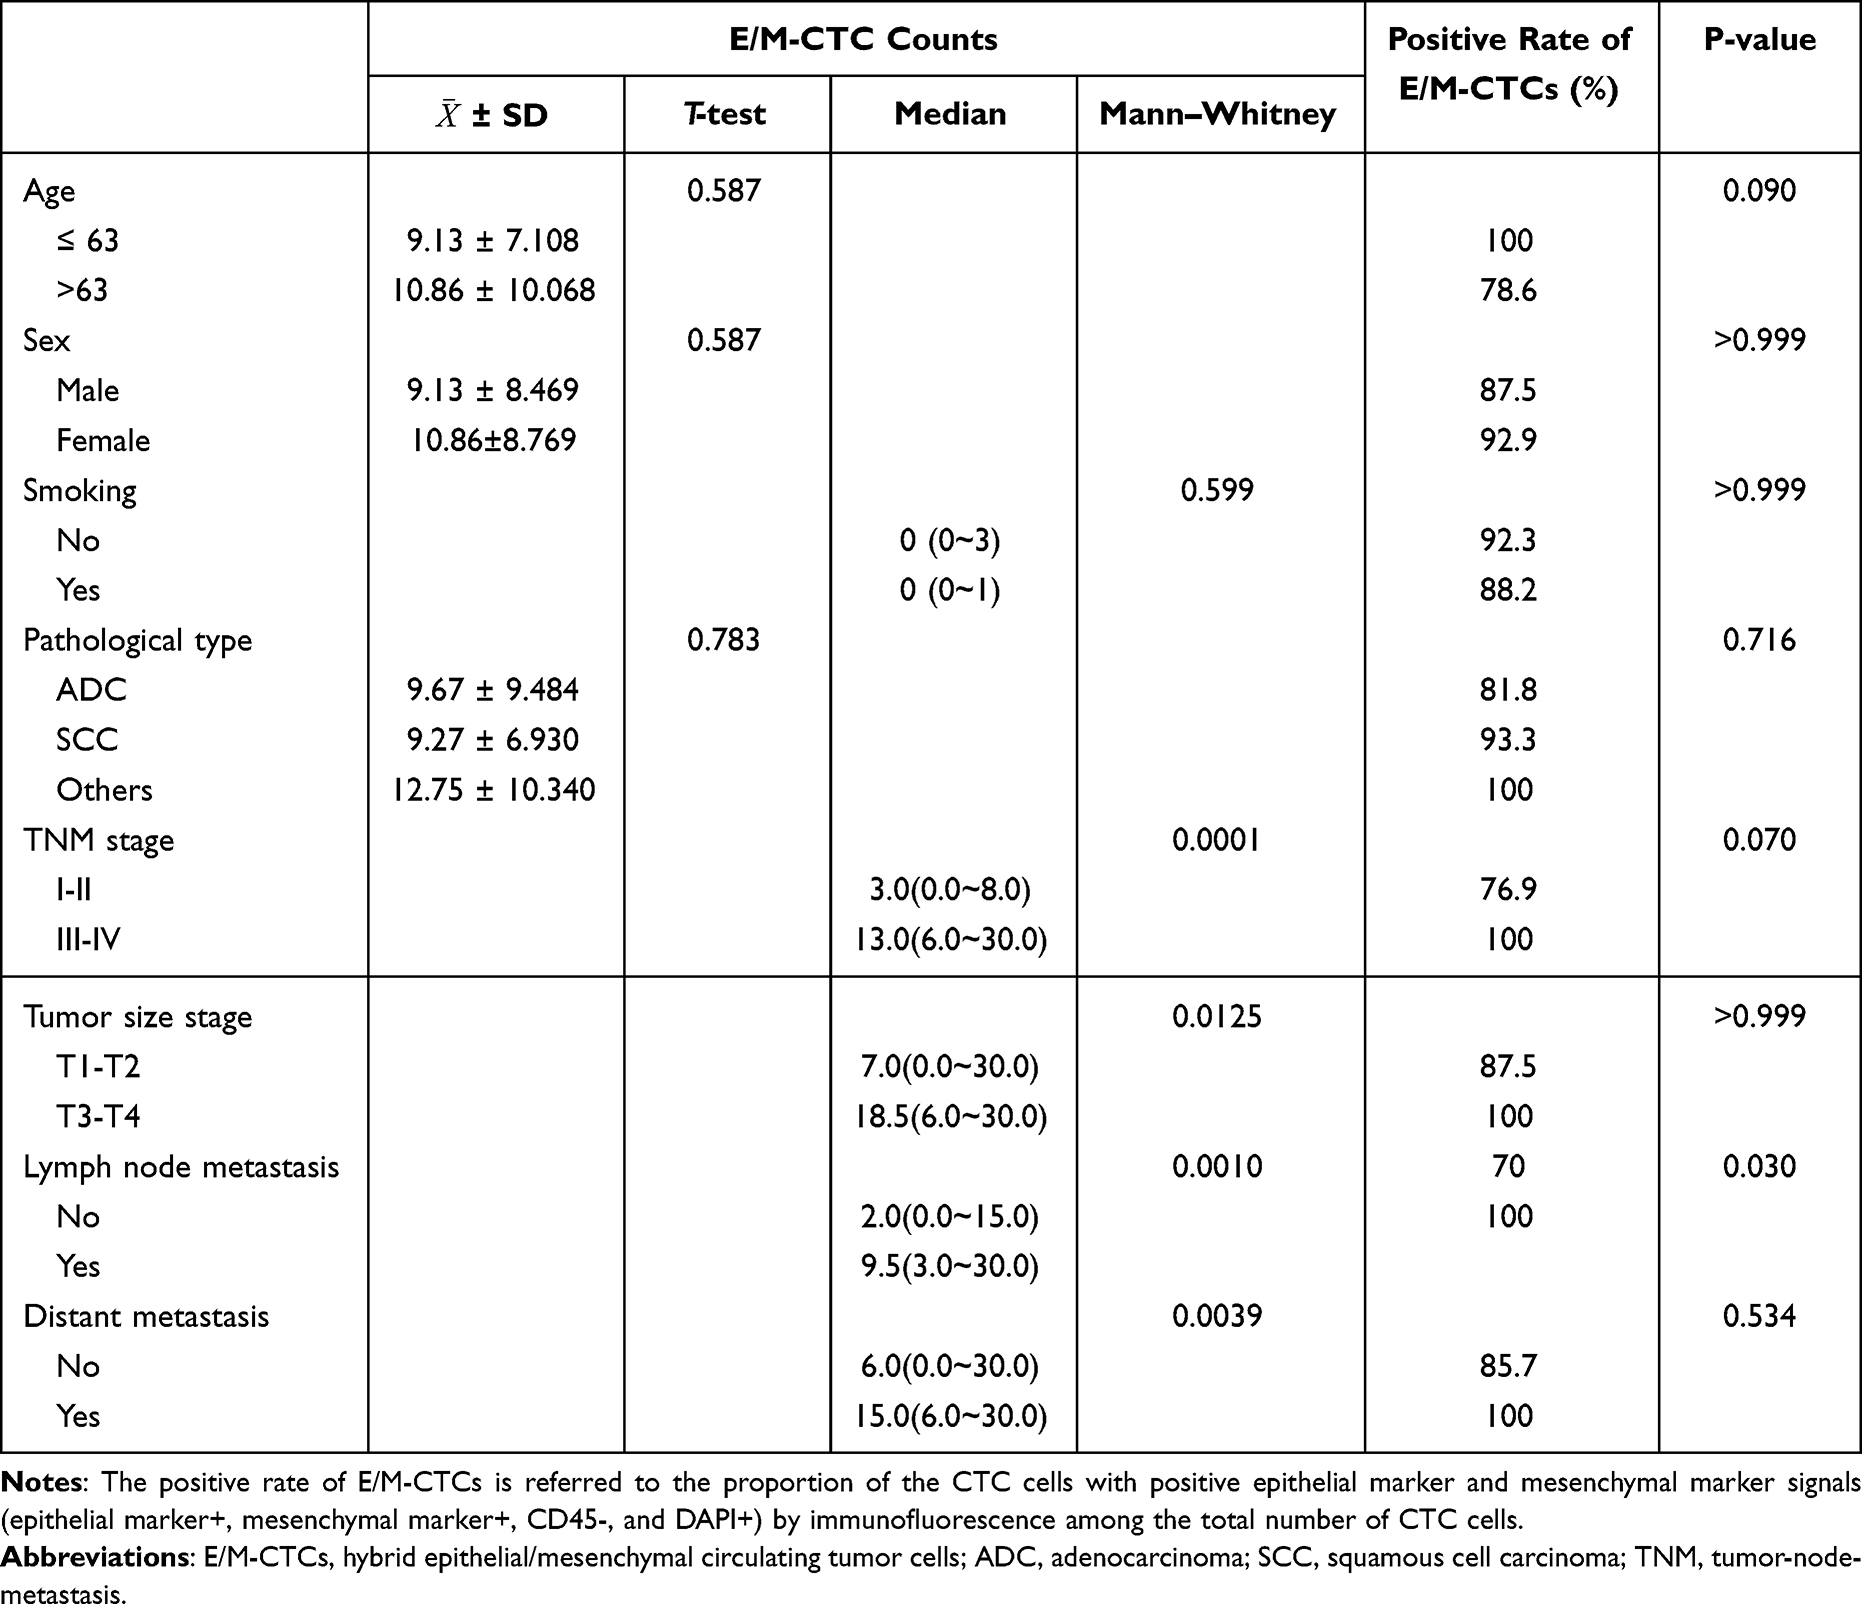 |
Table 3 Comparison of the Counts and Positive Rate of E/M-CTCs in Different Clinical Feature Groups |
 |
Table 4 Comparison of the Counts and Positive Rate of M-CTCs in Different Clinical Feature Groups |
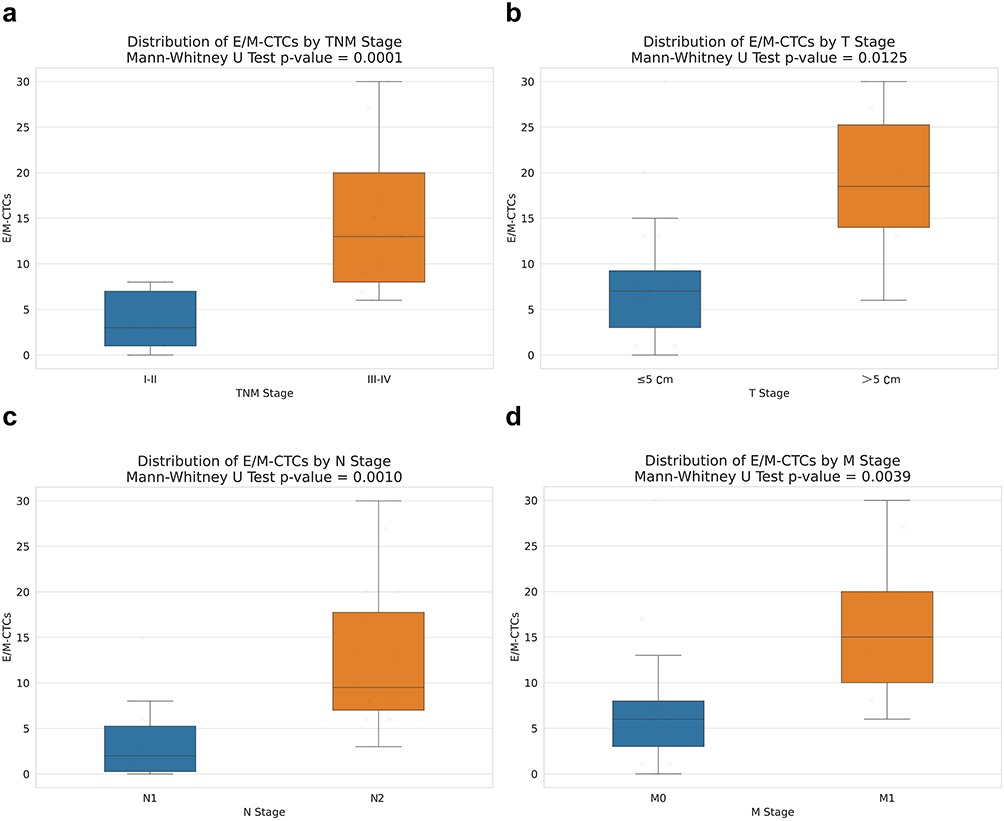 |
Figure 3 Association Analysis of E/M-CTCs Distribution with Clinical Staging Variables. Notes: (a) The figure shows the distribution of E/M-CTCs in two different TNM stage groups (I–II and III–IV). (b) The figure shows the distribution of E/M-CTCs in two different T stage groups (≤5cm and >5cm). (c) The figure shows the distribution of E/M-CTCs in two different N stage groups (“no” and “yes”). (d) The figure shows the distribution of E/M-CTCs in two different M stage groups (M0 and M1). Each box represents the interquartile range (IQR), and the individual scattered points represent the individual observations. |
Upon a granular analysis, we observed that the count of E/M-CTCs positively correlated with TNM staging, tumor infiltration depth, lymph node metastasis, and distant metastasis, with correlation coefficients of 0.718, 0.469, 0.615, and 0.540, respectively, all bearing significant statistical weight. Notably, no significant association between E/M-CTC count and age, gender, smoking history, or histopathological features was detected (Table 3). It suggests that while E/M-CTCs are a robust indicator characterizing certain tumor facets, they do not act as an overarching biomarker encompassing all clinical variables.
Turning our attention to E-CTCs, we observed no significant associations between their counts, positivity rates, or any studied clinical features. This trend was mirrored in M-CTCs, where we detected their presence in 8 patients, but their counts and positivity rates bore no discernible difference across the diverse clinical feature groups (Table 4).
This comprehensive and exhaustive analysis shows that E/M-CTCs play a central role in LC progression, directly correlating with disease severity and intricacy. In contrast, E-CTCs and M-CTCs showed no significant clinical feature correlations.
Elevated Lymph Node Metastasis (N Stage) Significantly Correlates with Increased E/M-CTC Counts
Among the 30 LC patients we studied, 20 were diagnosed with lymph node metastasis. These patients were further stratified into different N stages, revealing varying degrees of metastatic lymph nodes: 7 were categorized as N1, having a lower average E/M-CTC count (average of 7); 11 were in N2 with an average E/M-CTC count of 15.6; and 2 progressed to N3, showcasing the highest average E/M-CTC count of 22.5 (Figure 4).
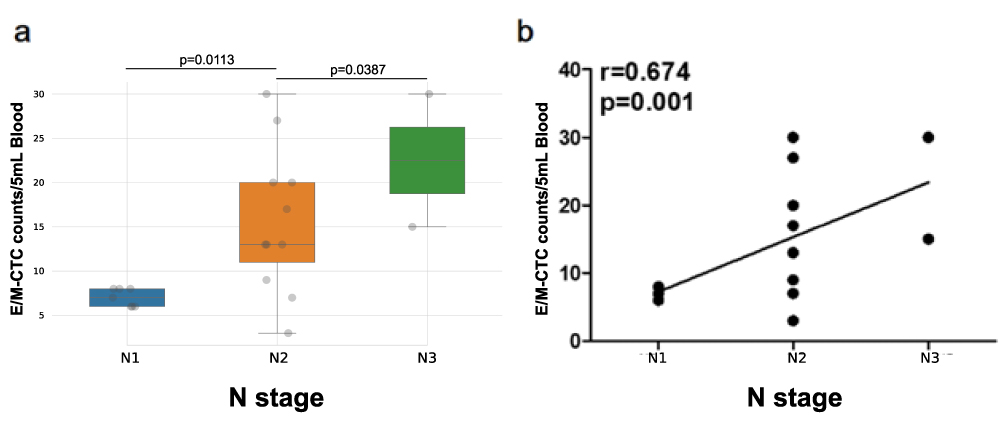 |
Figure 4 Distribution and correlation analysis of E/M-CTCs count in different N-stages. Notes: (a) Comparison of E/M-CTC counts in different N-stages; (b) Correlation analysis between different N-stages and E/M-CTCs count. N1: metastasis to ipsilateral peribronchial and/or ipsilateral hilar lymph nodes and intrapulmonary nodes, including involvement by direct extension. N2: metastasis to ipsilateral mediastinal and/or subcarinal lymph nodes. N3: Metastasis to contralateral mediastinal, contralateral hilar, ipsilateral or contralateral scalene, or supraclavicular lymph nodes. |
We observed a significant upward trend in E/M-CTC counts with the progression of N stages, delineating a clear positive correlation. Statistical testing confirmed the difference in E/M-CTC counts across N stages to be significant (P < 0.05), further reinforcing its status as a reliable metric to gauge the severity of lymph node metastasis (Figure 4a).
We delved into the relationship between E/M-CTC counts and N stages using Spearman correlation analysis to further understand this phenomenon. The results showcased a significant positive correlation (r=0.674, P=0.001), indicating that higher N stages correspond to increased E/M-CTC counts (Figure 4b). This observation is consistent with our earlier findings, underscoring the pivotal role E/M-CTCs play in evaluating lymph node metastasis in LC patients.
Alterations in M-CTC Counts Significantly Indicate Treatment Response and Disease Progression in Lung Cancer Patients
In our cohort, we quantified CTCs in 17 LC patients one month post-two treatment cycles and pre-treatment, keen to unravel the association between M-CTC count changes and treatment response. We defined the pre-treatment M-CTC count as M-CTC0. For a holistic understanding of therapeutic outcomes, we employed the RECIST 1.1 criteria to evaluate each patient’s treatment response, with detailed data in Table 5.
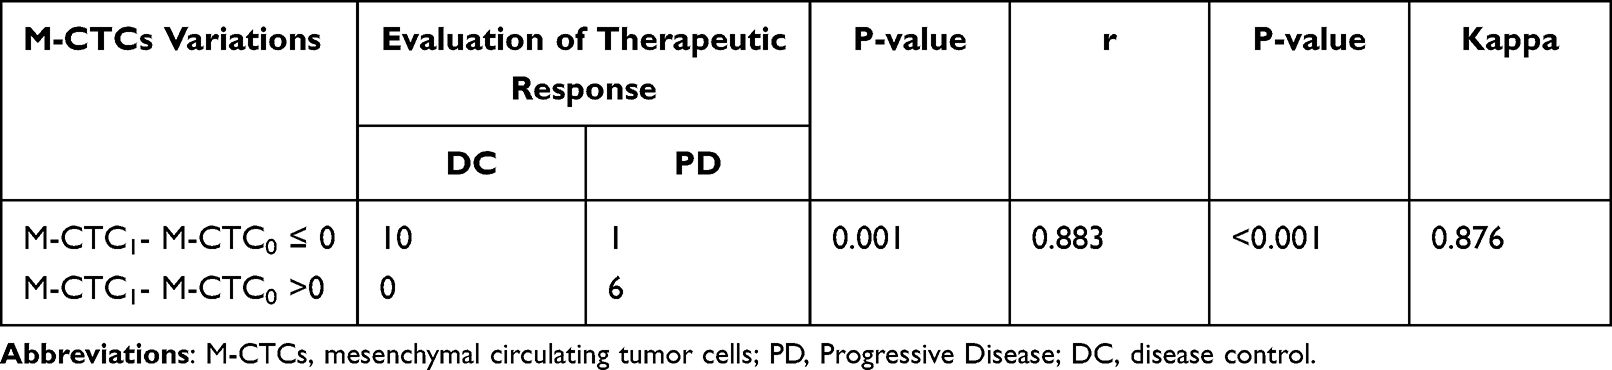 |
Table 5 Correlation Between the Change in M-CTCs and the Efficacy of Therapy |
We discerned that alterations in M-CTC counts significantly correlated with disease progression (PD) and disease control (DC) after targeted therapy and chemotherapy. Specifically, patients with increased M-CTC counts were more prone to manifesting PD, while those with decreased counts were likelier to achieve DC, a finding of paramount statistical significance (P=0.001). Further correlation analysis elucidated a strong association between pre-and post-treatment M-CTC count changes and PD and DC (r=0.883, P<0.001), proposing M-CTC counts as a potent predictor for gauging treatment response.
Interestingly, we also observed a high concordance between M-CTC count changes and the RECIST 1.1 criteria, with a Kappa value of 0.876 and a P-value of 0.001. It strongly suggests that M-CTC count is a reliable and productive metric for monitoring disease trajectory and therapeutic responses.
Discussion
In this study, we sought to elucidate the clinical significance of circulating tumor cells (CTCs) and epithelial-mesenchymal transition (EMT) in lung cancer (LC) patients, employing the CanPatrol typing detection technique. Our focus was on understanding the role of CTCs in the progression of LC and their association with various clinical characteristics.
CTCs, originating from primary tumors or metastatic sites, often undergo phenotypic transformations through EMT, a process critical in embryonic development and tissue regeneration.21–23 While EMT is a natural process, its aberrant activation in tumor cells can lead to increased malignancy, characterized by enhanced migration, invasiveness, tumor stemness, and resistance to chemotherapy and immunotherapy.12,24,25 The study of CTCs, particularly their heterogeneity, is pivotal in identifying crucial biomarkers and developing targeted diagnostic and therapeutic strategies.
Our research identified three distinct phenotypes of CTCs in LC: epithelial (E-CTCs), hybrid epithelial/mesenchymal (E/M-CTCs), and mesenchymal (M-CTCs). These phenotypes reflect the complex nature of LC and suggest varied roles of CTCs in its progression. The prevalence of E/M-CTCs in LC patients, in particular, signals their central role in disease advancement. It is hypothesized that the hybrid nature of E/M-CTCs might confer more aggressive characteristics than either purely epithelial or mesenchymal CTCs. These E/M hybrids, owing to their high plasticity, are essential for the metastatic spread of tumor cells,26,27 contributing to the heterogeneity and dissemination of tumor cells during metastasis.
A notable finding was the positive correlation between E/M-CTCs and key clinical parameters such as TNM staging, tumor infiltration depth, lymph node metastasis, and distant metastasis. This correlation underscores the potential of E/M-CTCs as a biomarker for assessing disease severity. In particular, the correlation of E/M-CTCs count with increasing lymph node metastasis N-stage implies their significance in gauging disease progression. This is supported by studies in breast cancer, where lymph node metastasis has been linked to enhanced CTC seeding potential, associated with vimentin expression, an EMT marker.28
We have also taken note of findings from other research teams regarding the relationship between the epithelial-mesenchymal transition (EMT) status of circulating tumor cells (CTCs) and the prognosis of cancer patients. For instance, Alexander Semaan et al discovered a significant positive correlation between an increased proportion of partially epithelial-mesenchymal transition CTCs (pEMT-CTCs) in pancreatic cancer patients and disease progression as well as unfavorable prognosis.29 Additionally, Hiroe Tada et al, through their study on CTCs of head and neck squamous cell carcinoma (HNSCC) patients, found a notable increase in the proportion of epithelial CTCs (E-CTCs), indicating a lower metastatic potential and increased sensitivity to treatment in patients without metastasis or with complete remission.30 Similarly, Yariswamy Manjunath et al identified a significant correlation between an elevated number of CTCs expressing PD-L1 and EMT markers in non-small cell lung cancer patients and unfavorable prognosis as well as shorter overall survival.31 These studies further support our findings that assessing the EMT status of patient CTCs can serve as a biomarker for tumor metastasis and prognosis.
The study also underscores the importance of monitoring M-CTCs as a biomarker for LC treatment response. We observed that changes in M-CTCs count, pre- and post-treatment, closely correlate with disease progression and control, aligning with RECIST 1.1 criteria. This suggests that M-CTCs could be a reliable indicator for monitoring therapeutic outcomes and predicting disease progression.32
In summary, our study successfully revealed the distribution of CTC phenotypes, particularly E/M-CTCs and M-CTCs, in LC patients and their relationship with various clinical parameters (Figure 5). This highlights not only their significant value as potential biomarkers for LC progression and treatment response but also provides a strong theoretical basis for future clinical research. However, we acknowledge the limitations of our study, especially the small sample size and heterogeneity among the patient population. In this study, we only included 30 lung cancer patients from January 2021 to August 2022, which is a relatively small sample size, and the individual differences among patients could potentially influence our research conclusions. For future studies, we will need to collect a larger sample size over a longer period and collaborate with multiple centers to validate and expand our findings, enabling a better understanding of the true potential of CTCs in LC treatment and monitoring.
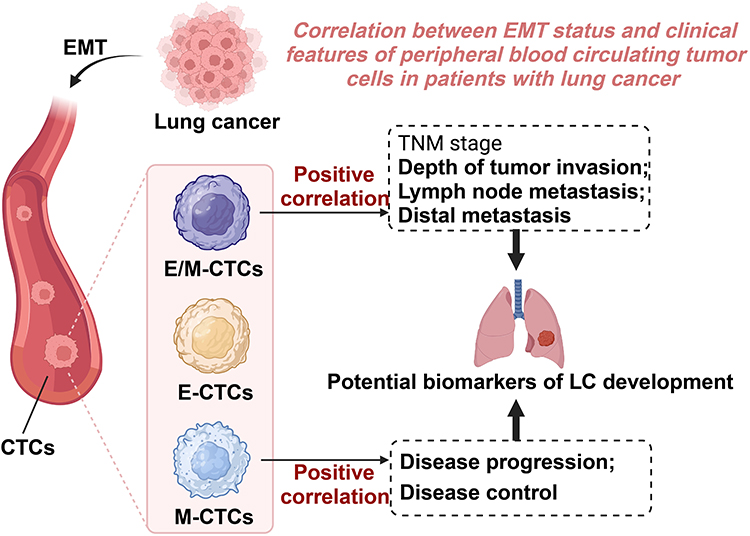 |
Figure 5 Schematic illustration of the role of epithelial-mesenchymal transition phenotypes of circulating tumor cells in regulating lung cancer progression. |
Conclusion and Recommendation
In conclusion, CTCs, especially the E/M and M phenotypes, emerge as vital biomarkers in predicting and monitoring the course of LC, offering insights into potential personalized treatment strategies.
Abbreviations
LC, Lung cancer; CTCs, circulating tumor cells; CT, computed tomography; CR, Complete Response; PR, Partial Response; DP, Progressive Disease; SD, Stable Disease; DC, Disease Control.
Data Sharing Statement
The data that support the findings of this study are available from the corresponding author upon reasonable request.
Ethical Considerations
This research was conducted in adherence to the principles of the Declaration of Helsinki and was approved by Henan Medical College (HNYZLLWYH-2021-013).
Author Contributions
All authors made a significant contribution to the work reported, whether that is in the conception, study design, execution, acquisition of data, analysis and interpretation, or in all these areas; took part in drafting, revising or critically reviewing the article; gave final approval of the version to be published; have agreed on the journal to which the article has been submitted; and agree to be accountable for all aspects of the work.
Funding
This study was supported by Henan Provincial Science and Technology Research Project (No.202102310794).
Disclosure
The authors declare no competing interest in this work.
References
1. Huang S, Yang J, Shen N, Xu Q, Zhao Q. Artificial intelligence in lung cancer diagnosis and prognosis: current application and future perspective. Semin Cancer Biol. 2023;89:30–37. doi:10.1016/j.semcancer.2023.01.006
2. Cao M, Li H, Sun D, et al. Cancer screening in China: the current status, challenges, and suggestions. Cancer Lett. 2021;506:120–127. doi:10.1016/j.canlet.2021.02.017
3. Dalmartello M, La Vecchia C, Bertuccio P, et al. European cancer mortality predictions for the year 2022 with focus on ovarian cancer. Ann Oncol. 2022;33(3):330–339. doi:10.1016/j.annonc.2021.12.007
4. Lewis DR, Siembida EJ, Seibel NL, Smith AW, Mariotto AB. Survival outcomes for cancer types with the highest death rates for adolescents and young adults, 1975–2016. Cancer. 2021;127(22):4277–4286. doi:10.1002/cncr.33793
5. Rudin CM, Brambilla E, Faivre-Finn C, Sage J. Small-cell lung cancer. Nat Rev Dis Primers. 2021;7(1):3. doi:10.1038/s41572-020-00235-0
6. Ko J, Winslow MM, Sage J. Mechanisms of small cell lung cancer metastasis. EMBO Mol Med. 2021;13(1):e13122. doi:10.15252/emmm.202013122
7. Kang J, Zhang C, Zhong WZ. Neoadjuvant immunotherapy for non-small cell lung cancer: state of the art. Cancer Commun. 2021;41(4):287–302. doi:10.1002/cac2.12153
8. Park HA, Brown SR, Kim Y. Cellular mechanisms of circulating tumor cells during breast cancer metastasis. Int J Mol Sci. 2020;21(14):5040. doi:10.3390/ijms21145040
9. Pei H, Li L, Han Z, Wang Y, Tang B. Recent advances in microfluidic technologies for circulating tumor cells: enrichment, single-cell analysis, and liquid biopsy for clinical applications. Lab Chip. 2020;20(21):3854–3875. doi:10.1039/d0lc00577k
10. Tinganelli W, Durante M. Tumor hypoxia and circulating tumor cells. Int J Mol Sci. 2020;21(24):9592. doi:10.3390/ijms21249592
11. Yousefi M, Ghaffari P, Nosrati R, et al. Prognostic and therapeutic significance of circulating tumor cells in patients with lung cancer. Cell Oncol. 2020;43(1):31–49. doi:10.1007/s13402-019-00470-y
12. Huang Y, Hong W, Wei X. The molecular mechanisms and therapeutic strategies of EMT in tumor progression and metastasis. J Hematol Oncol. 2022;15(1):129. doi:10.1186/s13045-022-01347-8
13. Ebrahimi N, Adelian S, Shakerian S, et al. Crosstalk between ferroptosis and the epithelial-mesenchymal transition: implications for inflammation and cancer therapy. Cytokine Growth Factor Rev. 2022;64:33–45. doi:10.1016/j.cytogfr.2022.01.006
14. Zhang Q, Rong Y, Yi K, Huang L, Chen M, Wang F. Circulating tumor cells in hepatocellular carcinoma: single-cell based analysis, preclinical models, and clinical applications. Theranostics. 2020;10(26):12060–12071. doi:10.7150/thno.48918
15. Li J, Liao Y, Ran Y, et al. Evaluation of sensitivity and specificity of CanPatrol™ technology for detection of circulating tumor cells in patients with non-small cell lung cancer. BMC Pulm Med. 2020;20(1):274. doi:10.1186/s12890-020-01314-4
16. Chen J, Ye C, Dong J, et al. Metabolic classification of circulating tumor cells as a biomarker for metastasis and prognosis in breast cancer. J Transl Med. 2020;18(1):59. doi:10.1186/s12967-020-02237-8
17. Goldstraw P, Chansky K, Crowley J, et al. The IASLC Lung Cancer Staging Project: proposals for Revision of the TNM Stage Groupings in the Forthcoming (Eighth) Edition of the TNM Classification for Lung Cancer. J Thorac Oncol. 2016;11(1):39–51. doi:10.1016/j.jtho.2015.09.009
18. Qi LN, Xiang BD, Wu FX, et al. Circulating tumor cells undergoing EMT provide a metric for diagnosis and prognosis of patients with hepatocellular carcinoma. Cancer Res. 2018;78(16):4731–4744. doi:10.1158/0008-5472.CAN-17-2459
19. Asante DB, Morici M, Mohan GRKA, et al. Multi-marker immunofluorescent staining and PD-L1 detection on circulating tumour cells from ovarian cancer patients. Cancers. 2021;13(24):6225. doi:10.3390/cancers13246225
20. Eisenhauer EA, Therasse P, Bogaerts J, et al. New response evaluation criteria in solid tumours: revised RECIST guideline (version 1.1). Eur J Cancer. 2009;45(2):228–247. doi:10.1016/j.ejca.2008.10.026
21. De Souza LM, Robertson BM, Robertson GP. Future of circulating tumor cells in the melanoma clinical and research laboratory settings. Cancer Lett. 2017;392:60–70. doi:10.1016/j.canlet.2017.01.023
22. Teeuwssen M, Fodde R. Cell heterogeneity and phenotypic plasticity in metastasis formation: the case of colon cancer [published correction appears in Cancers (Basel). 2020 May 28;12(6)]. Cancers. 2019;11(9):1368. doi:10.3390/cancers11091368
23. Thiery JP, Lim CT. Tumor dissemination: an EMT affair. Cancer Cell. 2013;23(3):272–273. doi:10.1016/j.ccr.2013.03.004
24. Brabletz S, Schuhwerk H, Brabletz T, Stemmler MP. Dynamic EMT: a multi-tool for tumor progression. EMBO J. 2021;40(18):e108647. doi:10.15252/embj.2021108647
25. Pantazaka E, Vardas V, Roumeliotou A, Kakavogiannis S, Kallergi G. Clinical relevance of mesenchymal- and stem-associated phenotypes in circulating tumor cells isolated from lung cancer patients. Cancers. 2021;13(9):2158. doi:10.3390/cancers13092158
26. Li D, Xia L, Huang P, et al. Heterogeneity and plasticity of epithelial-mesenchymal transition (EMT) in cancer metastasis: focusing on partial EMT and regulatory mechanisms. Cell Prolif. 2023;56(6):e13423. doi:10.1111/cpr.13423
27. Nihan Kilinc A, Sugiyama N, Reddy Kalathur RK, et al. Histone deacetylases, Mbd3/NuRD, and Tet2 hydroxylase are crucial regulators of epithelial-mesenchymal plasticity and tumor metastasis. Oncogene. 2020;39(7):1498–1513. doi:10.1038/s41388-019-1081-2
28. Riggio AI, Varley KE, Welm AL. The lingering mysteries of metastatic recurrence in breast cancer. Br J Cancer. 2021;124(1):13–26. doi:10.1038/s41416-020-01161-4
29. Semaan A, Bernard V, Kim DU, et al. Characterisation of circulating tumour cell phenotypes identifies a partial-EMT sub-population for clinical stratification of pancreatic cancer. Br J Cancer. 2021;124(12):1970–1977. doi:10.1038/s41416-021-01350-9
30. Tada H, Takahashi H, Ida S, Nagata Y, Chikamatsu K. Epithelial-mesenchymal transition status of circulating tumor cells is associated with tumor relapse in head and neck squamous cell carcinoma. Anticancer Res. 2020;40(6):3559–3564. doi:10.21873/anticanres.14345
31. Manjunath Y, Upparahalli SV, Avella DM, et al. PD-L1 expression with epithelial mesenchymal transition of circulating tumor cells is associated with poor survival in curatively resected non-small cell lung cancer. Cancers. 2019;11(6):806. doi:10.3390/cancers11060806
32. Zhang Y, Men Y, Wang J, et al. Epithelial circulating tumor cells with a heterogeneous phenotype are associated with metastasis in NSCLC. J Cancer Res Clin Oncol. 2022;148(5):1137–1146. doi:10.1007/s00432-021-03681-9
 © 2024 The Author(s). This work is published and licensed by Dove Medical Press Limited. The full terms of this license are available at https://www.dovepress.com/terms.php and incorporate the Creative Commons Attribution - Non Commercial (unported, v3.0) License.
By accessing the work you hereby accept the Terms. Non-commercial uses of the work are permitted without any further permission from Dove Medical Press Limited, provided the work is properly attributed. For permission for commercial use of this work, please see paragraphs 4.2 and 5 of our Terms.
© 2024 The Author(s). This work is published and licensed by Dove Medical Press Limited. The full terms of this license are available at https://www.dovepress.com/terms.php and incorporate the Creative Commons Attribution - Non Commercial (unported, v3.0) License.
By accessing the work you hereby accept the Terms. Non-commercial uses of the work are permitted without any further permission from Dove Medical Press Limited, provided the work is properly attributed. For permission for commercial use of this work, please see paragraphs 4.2 and 5 of our Terms.