")
Back to Journals » Risk Management and Healthcare Policy » Volume 14
Incidence and Predictors of Cardiovascular Disease among Type 1 and Type 2 Diabetes Mellitus in a Tertiary Health Care Setting of Ethiopia: 8-Year Retrospective Follow-Up Study
Authors Debele GR , Kefeni BT , Kanfe SG , Ayele TA, Wolde HF , Yenit MK , Ahmed MH
Received 24 February 2021
Accepted for publication 14 April 2021
Published 13 May 2021 Volume 2021:14 Pages 1959—1968
DOI https://doi.org/10.2147/RMHP.S307303
Checked for plagiarism Yes
Review by Single anonymous peer review
Peer reviewer comments 2
Editor who approved publication: Professor Marco Carotenuto
Gebiso Roba Debele,1 Bilisumamulifna Tefera Kefeni,1 Shuma Gosha Kanfe,2 Tadesse Awoke Ayele,3 Haileab Fekadu Wolde,3 Melaku Kindie Yenit,3 Mohammedjud Hassen Ahmed2
1Department of Public Health, College of Health Sciences, Mettu University, Mettu, Ethiopia; 2Department of Health Informatics, College of Health Sciences, Mettu University, Mettu, Ethiopia; 3Department of Epidemiology and Biostatistics, Institute of Public Health, College of Medicine and Health Sciences, University of Gondar, Gondar, Ethiopia
Correspondence: Gebiso Roba Debele Tel +251 922042777
Email [email protected]
Background: Cardiovascular disease (CVD) is a major cause of death and disability among people with diabetes in the world and it is proving to be a major barrier to sustainable human development. Despite CVD continuing to devastate human survival, few studies in Ethiopia have focused on its prevalence which alone are insufficient to assess the risk of incident cardiovascular events. Therefore, we determined the incidence and predictors of cardiovascular disease among diabetic patients in a selected tertiary healthcare setting of Ethiopia.
Methods: A retrospective cohort study using secondary data was conducted on 399 randomly selected diabetes patients. Data were entered using Epi-Data and analyzed using Stata version 14. Multivariable Weibull proportional hazards regression analysis was used to identify the predictors of CVDs (namely, coronary heart disease (CHD), stroke, and peripheral arterial disease (PAD)) at 5% level of significance.
Results: After a median follow-up of 5.9 years, the overall incidence rate of CVD per 100 person–years (PY) was 2.71 (95% CI=16.9– 17.6). The multivariable Weibull proportional hazard regression analysis showed a significant association of chronic kidney disease (CKD); (adjusted hazard ratio (AHR) [95% CI]=2.53 [1.36– 4.72]), systolic blood pressure (SBP)≥ 140; (AHR [95% CI]=4.30 [2.12– 8.73]) and triglyceride (TG)≥ 200 mg/dL; (AHR [95% CI[=5.10 [2.02– 12.89]) with risk of incident CVD.
Conclusion: CVD is a public health problem among diabetic patients in Ethiopia. SBP≥ 140, chronic kidney disease, and high triglyceride were independent predictors of new CVD among diabetic patients. These findings emphasize the need of attention for CVD patients with CKD and hypertension (HTN) comorbidities and a longer follow-up period using a prospective study design to determine the long-term effects of predictors of CVD among diabetic patients.
Keywords: incidence, cardiovascular disease, predictors, type 1 and type 2 diabetes
Introduction
Many Sub-Saharan African (SSA) countries, including Ethiopia, are facing a high burden of noncommunicable diseases (NCDs).1 Diabetes mellitus (DM) is one global epidemic NCD which has been estimated to affect 463 million peoples globally and 4.3% of Ethiopia's population according to the International diabetic federation in 2019.2 Part of the severity of DM is explained by its association with risk of CVD and other clinical complications.3 Individuals with DM have a 2–8-fold higher risk of heart disease as well as an increased risk of mortality of up to 3-times,4 and CVD is responsible for 80% of the mortality in diabetes.5
CVDs are a group of diseases involving the heart or blood vessels and are now the leading cause of diabetes-related morbidity and mortality.6 Globally, there were an estimated 422.7 million cases of CVD, and Africa were one of the countries with the highest age-standardized prevalence in 2015.7 The age-adjusted incidence rate of CVD was 6,081.6 per 100,000 in 2017.8 According to a systematic literature review from 2007 to 2017, the magnitude of CVD among DM was about 32.2% in the world.9
CVD is among the world’s leading killers, responsible for a combined 15.2 million deaths in 2016, increasing to 17.8 million in 2017, and has remained a leading cause of death in the last 15 years.8,10 According to 2015 global burden of disease data there were 418, 285, and 349 deaths per 100,000 due to CVD in central, western, and eastern SSA countries.7 CVD death has increased by more than 50% in SSA over the past three decades11 and is inclined to happen at younger ages, leading to a high number of disability adjusted life years and most of them were attributed to DM.12,13
Several epidemiological researchers around the world have identified older age and longer duration of DM,14 high density lipoprotein cholesterol (HDL-C) level,15 smoking and heavy alcohol consumption,16 HTN,17,18 poor glycemic control (high glycosylated hemoglobin (HbA1c)18 and TG19 to be independent predictors for incident CVD. In response to the recent rise of CVDs in developing countries, the World Health Organization (WHO) has identified very cost-effective interventions that are applicable even in low-resource settings for prevention and control of CVDs.20
Although the WHO predicts a rapid increase of CVDs in SSA by 2030, researchers perceive that CVDs are not a priority public health problem in the region.21 This perception is undermining the existing burden of the problem in this continent. Despite CVDs continuing to devastate human survival through the premature deaths of its workforce in developing countries, the few studies in Ethiopia have been limited to cross-sectional studies, which alone are insufficient to assess the risk of incident cardiovascular events. Therefore, we determined the incidence and predictors of cardiovascular disease among diabetic patients, from 2012 to 2020.
Methods and Materials
Study Setting, Design, and Period
This was a retrospective follow-up study done at Jimma University Medical Center (JUMC) to assess the incidence and predictors of CVD among diabetic patients from September 5, 2012 to February 25, 2020. JUMC is one of the largest public hospitals in Jimma zone, Oromia regional state, Ethiopia. It is about 352 kilometers from Addis Ababa, the capital city of Ethiopia. Every year approximately 9,000 inpatients and 80,000 outpatients are served in the hospital, coming from a catchment population of about 15 million people. In addition to other services, chronic disease follow-up services are being provided and diabetic clinic is found separated from other chronic disease.
Study Population
Our reference population involves all type 1 DM (T1DM) and type 2 DM (T2DM) patients (age of 15 years and above) who had follow-up at JUMC and all newly-diagnosed T1DM and T2DM patients during the study period were our study population. The study population was recruited from September 5, 2012 to September 8, 2015 and each case was followed until February 25, 2020. Once diagnosed for T1DM or T2DM, follow-up immediately started for all patients. We followed our cohort of DM patients to measure the primary outcomes, and new cases of CVD were recorded among diabetic patients during the follow-up period. Diabetic patients with no history of CVD at baseline were included in the study. Patients with unknown date of diabetes and cardiovascular disease diagnosis were excluded from the study.
Measurements and Operational Definition
Our primary outcome was CVD and defined as the first non-fatal CHD, stroke, or PAD, diagnosed by specialized physicians based on the clinical assessment and confirmed using diagnostic tests. We excluded sudden death from the definition and only non-fatal CVD was included. A non-fatal CHD was confirmed using the WHO’s criteria in the case of raised levels of cardiac biomarkers with either symptoms or electrocardiograms suggestive of ischemia.22 A non-fatal stroke was defined as typical dysfunction of neurology that lasts >24 hours excluding other diagnoses and was taken from patients records. Peripheral arterial occlusion was defined as an sudden onset arterial event with a duration of greater than 2 weeks, and resulted in symptomatic limb ischemia.23 In cases when a subject had experienced greater than one endpoint, the first event was used to define the onset of CVD. Once patients were diagnosed with T1DM or T2DM they immediately started follow-up. Our independent variables include: socio-demographics, clinical parameters, laboratory, and comorbidities characteristics. Socio-demographics include: age, sex, and residence. Clinical and laboratory characteristics include: type of DM, type of treatment, family history of diabetes, body mass index (BMI), classified as low (<18.5 kg/m2), normal (18.5–24.9 kg/m2), and high (≥ 25 kg/m2) according to WHO criteria24, HDL-C, low density lipoprotein cholesterol (LDL-C), TG, total cholesterol (TC), diastolic blood pressure (DBP), SBP, baseline fasting blood sugar (FBS), creatinine, and history of acute complication. The third characteristic assessed was the comorbidities and this includes HTN (based on physician-registered diagnosis on the medical record when SBP ≥140 mmHg and DBP ≥90 mmHg), diabetic retinopathy, CKD, and diabetic retinopathy.
Sample Size and Sampling Procedure
The final sample size of 424 was calculated using Schoenfeld formula for survival analysis25 using 8.1% probability of events and 2.74 AHR of TG from previous studies.14,19 We assumed a 95% confidence level, 80% power and 10% of withdrawal probability, and this sample was computed using Stata version 14. Then subjects were selected using simple random sampling technique by collecting the identification number of DM patients from the registration book.
Data Collection and Quality Control
This secondary data was collected by trained nurses from the medical records of the study participants using a preliminary reviewed uniform checklist. This checklist was checked for consistency and completeness. Data was cross-checked and clarified for any missing data. We followed subjects from the date of enrolment (September 5, 2012) until they were diagnosed to have CVD or February 25, 2020 (study exit date). Patients with diagnosed CVD before the date of enrolment were excluded. Those who died or were lost to follow-up before the study exit date and were event free at the exit date were considered as censored during analysis.
Data Management and Statistical Analysis
Data were entered using Epi-Data version 4.6 and then exported to Stata version 14 for further data cleaning and analysis. Descriptive statistics like mean (standard deviation) or median (inter-quartile range) for continuous variables and frequencies (%) for categorical variables were used to describe the population. Cumulative incidence was computed by the number of new cases (CVD) per total initial population and incidence rate was calculated as the number of new cases per by PY at risk. Bivariable analysis with a p-value less than 0.2 were included in the multivariable regression. The Kaplan-Meier procedure was used to estimate the survival curves and Log rank test to compare survival time between groups of categorical variables. Schoenfeld residuals method was used to assess proportional hazard assumptions (PHA). The parsimonious survival model was selected based on Akaike Information Criterion (AIC) and goodness of fitness of the model was checked using Cox Snell residual plot. To deal with missing data, we compared the model for multiple imputed data with complete case analysis and the model with the lowest AIC was used for analysis. Finally, Weibull regression analysis was used to calculate the hazard ratios and variables with a significance level of <0.05 were used to identify the predictors of CVD.
Results
Out of 424 total sample, 25 (5.9%) subjects with incomplete records (unknown date of DM and CVD diagnosis and diagnosed CVD before the diabetes) were excluded, making a 94.1% response rate. Then 399 T1DM and T2DM patients were retrospectively followed from September 5, 2012, to February 25. 2020.
Socio-Demographic and Clinical Characteristics
The mean age at baseline was 43.93±15.87 years, with minimum and maximum ages of 15 and 90 years, respectively. Male patients accounted for 61.4% and urban residents accounted for 59.15% of study participants, and a high proportion of CVD were from urban areas (65.6%). The majority (70.4%) of subjects had T2DM and SBP ≥140 constituted 36.8% of study participants. A high percentage of CVDs happened in T2DM (82.0%) and SBP ≥140 (77.1%). Further details on the socio-demographic and baseline clinical characteristics of the study sample are shown in Table 1.
 |
Table 1 Socio-Demographic and Clinical Characteristics of Study Participants, 2020 |
Comorbidities and Laboratory Characteristics
Table 2 shows the study baseline laboratory and comorbidities characteristics of study participants. The median (IQR) of baseline FBS and creatinine was 186 (99) and 0.86 (0 0.52), respectively. Regarding the lipid profile of the study participants: 30.8%, 38.8%, and 23.6% of patients had TG ≥200 md/dL, LDL-C ≥100 md/dL, and HDL-C <40 md/dL, respectively. Nearly one fifth (20.3%) and 15.8% of patients had diabetic retinopathy (DR) and CKD comorbid, respectively.
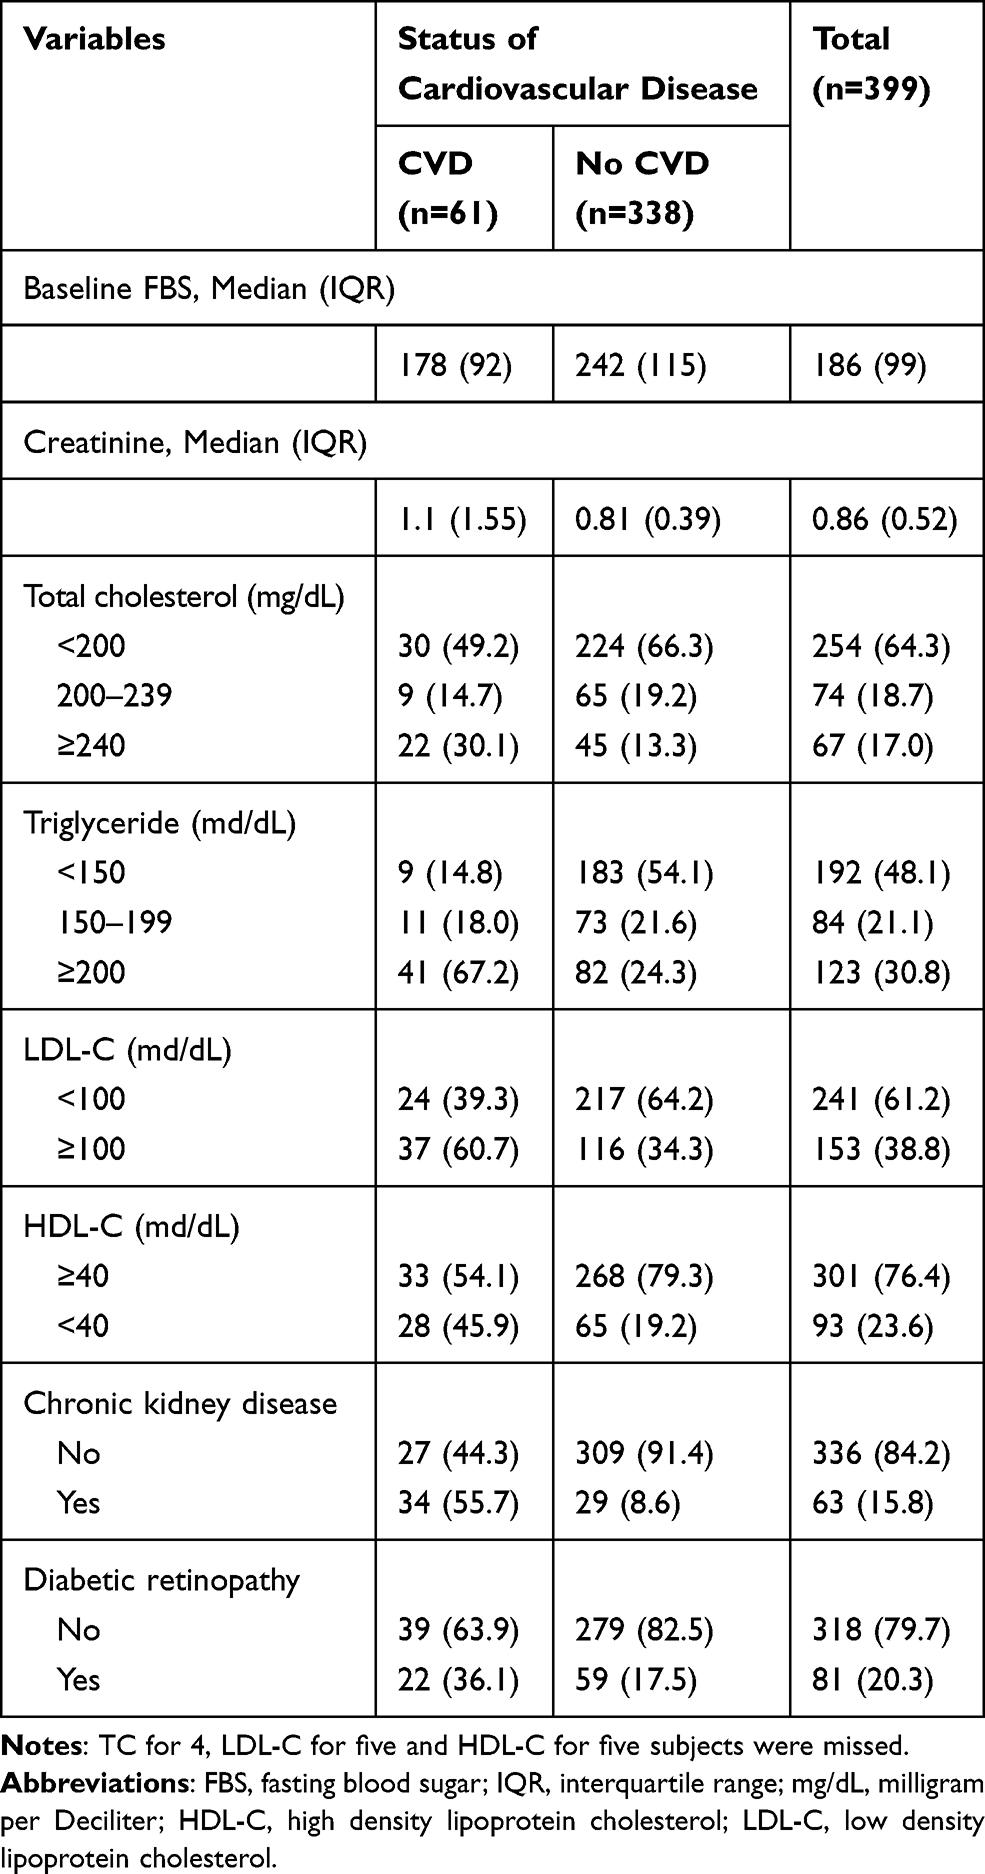 |
Table 2 Laboratory and Comorbidities Characteristics of Study Participants, 2020 |
Incidence of Cardiovascular Disease among Diabetic Patients
We followed study subjects for a median follow-up period of 5.89 years (minimum of 0.66 and maximum of 7.50 years) after initiation of treatment for a total of 2,250.4 PY. The entire cumulative incidence of CVD in this study was 15.29% (61/399; 95% CI=12.07–19.18). The total incidence density was 2.71; 95% CI=2.11–3.48, with 2.82; 95% CI=2.05–, 3.87, and 2.55; 95% CI=1.69–, 3.83 per 100 PY among males and females, respectively (no significant difference, p=0.876). The incidence density was found to be 15.78; 95% CI=8.74–28.49, and 32.18; 95% CI=24.39–42.47, 1,000 PY in type 1 and type 2 diabetes respectively. Among diabetic patients who were free from any type of CVD at the start of study, the cumulative proportion of developing CVD was 0.0452, 0.0862, 0.1394, and 0.2511 at year 2, 4, 6, and at the end of the study, respectively (Figure 1).
 |
Figure 1 The life table graph showing cumulative proportion of CVD among diabetic patients over time with 95% confidence interval, 2020. |
Predictors of CVD among Diabetic Patients
To evaluate the effect of the number of factors on the risk of patients to develop new-onset CVD we fitted Weibull regression which has the lowest AIC compared to all other models (Cox, exponential, and Gompertz models). The tolerance of factors ranged from 0.48 to 0.89 and variance inflation ranged from 1.12 to 2.10, indicating an absence of multicollinearity. Schoenfeld residual to test the proportional hazards assumption was not significant (P-value for each variable ranged from 0.111 to 0.777, with a global P-value of 0.535) and indicates that PHA was satisfied. As well, the Cox Snell residual plot showed the goodness of fitness of the model was satisfied because the cumulative hazard plot follows 45 degrees or a straight line through the origin with slope one (Figure 2). As shown in Table 3, bivariate Weibull regression (95% CI of CHR) shows a significant association with age, type of DM, CKD, DR, DBP, SBP, BMI, HDL, LDL, TC, and TG with risk of CVD. But after adjusting for other variables in multivariable Weibull regression, there are three independent variables (CKD, systolic HTN, and TG) that significantly determine the risk of CVD in diabetic patients. The risk of CVD was 2.53-times higher among diabetic patients with CKD as compared to those who have no CKD. The hazard of CVD among DM was 4.30-times higher for patients with systolic HTN as compared to their counterparts. Compared to patients with TG <150 mg/dL, diabetic patients with TG >200 mg/dL had a 5.10-fold higher risk for the incident CVD.
 |
Figure 2 Cox-Snell residuals for Weibull PH models of incidence and predictors of incident CVD among diabetic patients, 2020. |
 |
Table 3 Multivariable Weibull Regression for Predictors of Incident CVD among Diabetes Mellitus Patients, 2020 |
Discussion
CVD among patients with diabetes is a life-threatening disease with poor survival rates and it is associated with high healthcare expenditure. Thus, the current study investigated the incidence of CVD and its predictors among type 1 and type 2 diabetes mellitus in Ethiopia. A total of three factors were identified to determine the incidence of CVD and these factors include: CKD, systolic HTN, and TG.
The current study revealed 15.29% (95% CI=12.07–19.18) of cumulative incidence and 2.71 (95% CI=2.11–3.48) per 100PY of incidence density CVD among T1DM and T2DM patients during the median follow-up time of 5.89 years. Incidence of CVD differs substantially across different populations with diabetes based on the study setting, inclusion criteria, CVD outcome definition, and duration of the follow-up. Unfortunately, to our knowledge there were no longitudinal studies found in the literature related to CVD incidence among diabetic patients in the countries near to Ethiopia. However, worldwide, some studies showed a higher and others a much lower incidence of CVD compared to our study. The incidence of CVD in our study is in line with recent studies conducted in Italy (incidence rates of 28.8 and 23.3 per 1,000 PYs among men and women, respectively),26 Sweden (25.4 per 1,000 PY),27 and Africa (22.5 per 1,000 PY).28 Our study revealed a higher incidence of CVD among diabetic patients as compared with studies conducted in the world. Studies in China14 and Oman29 showed that 17.2 and 17.6 per 1,000 PY of CVD among DM within median follow-up periods of 5.3 and 5.6 years, respectively. This difference was probably because of the higher proportion of DM patients in our study who had HTN, which contributes to the risk for developing CVD, compared to the general population.6 A facility-based study in Ethiopia19 and a population-based study in Italy26 revealed an incidence rate of 16.7 per 1,000 PY and a cumulative incidence of 7.6%, respectively. Nevertheless, these two studies considered CHD alone as an outcome, which might be the reason for the lower incidence of CVD compared to our study. However, our estimates of incident CVD were lower than those reported in Finland (cumulative incidence of 20.2%) with a mean age of 59.1 years30 and a New Zealand cohort (incidence rate of 44.5 per 1,000 PY) with a mean age of 59.2 years.31 The possible reason for this lower incidence of CVD in our study could be due to the lower mean age of our study participants (43.93 years) compared to the studies in Finland and New Zealand. Age plays an important role in the deterioration of cardiovascular functionality.32 These functional changes in aging adult hearts have been characterized by diastolic, systolic, and electrical dysfunction, resulting in an increased risk of CVD in older adults.33 For example, the American Heart Association (AHA) reported the incidence of CVD: approximately 40% among those aged 40–59 years, 75% among those aged 60–79 years, and 86% in those above the age of 80 years.34 Another possible reason might be because our study included CHD, PAD, and stroke as CVD outcomes and excluded sudden death from the definition of the outcome. Due to methodological differences such as the methods of CVD diagnosis and study design, direct comparisons of study findings may not be feasible.
In our study, we found that, the presence of chronic kidney disease comorbid increased the incidence of CVD among diabetes by more than 2-fold as compared with their counterparts. The finding of increased incident CVD among DM patients with CKD in our study is consistent with previous reports in different parts of the world.14,35,36 Our finding also supports the current American Diabetes Association direction that regular assessment of estimated glomerular filtration rate (eGFR) and urine albumin creatinine ratio is part of routine care for DM patients and used for early identification of patients at high risk of CVD.37 This study also revealed that renal function impairment (low eGFR and increased albuminuria) can increase the risk of CVD by 2–4-fold.38 CKD is not only associated with risk of CVD, but also increases the CVD mortality by 2-fold in patients with stage 3 CKD and 3-fold in patients with stage 4 CKD when compared to patients with normal renal function.39 CKD causes CVD through alteration of salt and water balance which predisposes to volume retention and alterations in vascular tone that together contribute to HTN.40 Elevation in blood pressure initially causes extracellular fluid volume expansion and a rise in cardiac output. Subsequently, arterial pressure remains elevated and increases peripheral resistance which leads to CVD.41 The other means of CVD in CKD is through activation of renin, angiotensin, and aldosterone that contributes to abnormal vascular tone, HTN, nephron loss, and finally leads to CVD.42
Similarly, diabetic patients with systolic HTN comorbid had more than 4-fold higher risk of developing CVD than those who had no systolic HTN, which agrees with the findings from other longitudinal studies.14,18,43 Even though the recent guidelines by the American College of Cardiology and AHA showed importance of detection, evaluation and management of high blood pressure in reducing the risk of CVD,44 a significant number of patients fail to achieve blood pressure targets in developing countries.45 As an example, the findings from a regional survey of Middle East countries showed that, out of all HTN patients in the countries only 47% were being treated with antihypertensives and, of these, only 19% had blood pressures <140/90 mmHg.46 Though there is no literature on how many hypertensive patients achieved the target blood pressures in Ethiopia, it is expected that an important number of patients target blood pressures are not being achieved. The other possible reason could be the damage of endothelial cell structure and functioning by high blood pressure that leads to abnormal growth of endothelial cells and vasoconstriction that predispose DM patients for vascular complications.47
Another important finding of this study was that DM patients with TG ≥200 mg/dL were around 5-times at higher risk of developing CVD than triglyceride <150 mg/dL and the association between CVD and TG 150–199 mg/dL was not significant. Such studies showing the high risk of developing CVD among diabetes with high TG has been previously reported.15,48 Due to the scarce amount of studies on causal associations between TG and CVD, attention was not given by researchers and physicians, mainly from cardiologists who should carefully assess patients at risk of CVD.49 However, high levels of TG are common in DM patients due to the overproduction of TG-rich and reduced hepatic clearance for TG.50 Mendelian randomization studies showed a significant association of triglyceride with the risk of CVD.51 Remarkably, the gene-based testing indicated that a rare genetic variation with lower TG was consistently associated with a reduced risk for CVD.52 Despite the above facts, a study reported that significantly elevated TG level (>1,000 mg/dL) is not always associated with CVD.53 Therefore, further investigation about this issue is needed.
In spite of its strength, this study was not done without limitations. First, due to the retrospective nature of the data, we have not considered other potential predictors such as HbA1c, exercise, smoking, alcohol drinking, and diet due to their unavailability in the patients’ card. Exclusion of fatal myocardial infarction and fatal stroke from the CVD definition may underestimate the incidence of CVD among DM patients. Also, a longer follow-up of 10 years and above would be required to determine the long-term predictors of CVD, while our study participants were only followed for a median of 5.89 years.
Conclusion
In conclusion, CVD is a public health problem among diabetic patients in Ethiopia and systolic HTN, chronic kidney disease, and high triglyceride were found to be independent modifiable predictors of incident CVD among DM patients. More attention should be given to diabetic patients, who had HTN, CKD, and high TG level. Studies with a longer follow-up period using a prospective study design are required to determine the long-term effects of predictors of CVD among diabetic patients.
Abbreviations
AHR, adjusted hazard ratio; AIC, Akaike Information Criterion; AHA, American Heart Association; BMI, body mass index; CI, confidence interval; CHR, crude hazard ratio; CKD, chronic kidney disease; CHD, cardiac heart disease; CVD, cardiovascular disease; DBP, diastolic blood pressure; DM, diabetes mellitus; FBS, fasting blood sugar; HbA1c, glycosylated hemoglobin; HDL-C, high-density lipoprotein cholesterol; HTN, hypertension; IHD, ischemic heart disease; JUMC, Jimma University Medical Center; Kg/m2, kilogram per square meters; KM, Kaplan–Meier; LDL-C, low-density lipoprotein cholesterol; NCDs, noncommunicable diseases; OHA, oral hypoglycemic agent; PAD, peripheral arterial disease; PHA, proportional hazard assumption; PY, person years; SSA, Sub-Saharan African; SBP, systolic blood pressure; TC, total cholesterol; TG, triglyceride; T1DM, type one diabetes mellitus; T2DM, type two diabetes mellitus; WHO, World Health Organization.
Data Sharing Statement
Data will be available from the corresponding author upon request.
Ethical Approval and Consent to Participate
Ethical approval for the study was obtained from the Ethical Review Board of University of Gondar and permission or waiver letter was obtained from the medical directors of JUMC to review the medical charts. Data confidentiality was kept during all phases of research activities and held on secured password protected system. This study was conducted in accordance with the Declaration of Helsinki.
Acknowledgments
Our heartfelt gratitude goes to the University of Gondar, and Mettu University for support by all necessary services. Additionally, we appreciate the support from Hospitals administrations and data collector.
Author Contributions
All authors contributed to designation of the study, supervision of data collection, data analysis and interpretation, drafting or revising the article, have agreed on the journal to which the article will be submitted, gave final approval of the version to be published, and agree to be accountable for all aspects of the work.
Funding
The University of Gondar has covered the costs of data collectors and supervisors per diem. However, the University had no role in study design, data collections, and analysis, decision to publish, or preparation of the manuscript.
Disclosure
The authors reported no conflicts of interest for this work.
References
1. Dalal S, Beunza JJ, Volmink J, et al. Non-communicable diseases in sub-Saharan Africa: what we know now. Int J Epidemiol. 2011;40(4):885–901. doi:10.1093/ije/dyr050
2. Atlas D. Inernational Diabetes federation DIABETES ATLAS.
3. Members ATF, Rydén L, Grant PJ, et al. ESC Guidelines on diabetes, pre-diabetes, and cardiovascular diseases developed in collaboration with the EASD: the Task Force on diabetes, pre-diabetes, and cardiovascular diseases of the European Society of Cardiology (ESC) and developed in collaboration with the European Association for the Study of Diabetes (EASD). Eur Heart J. 2013;34(39):3035–3087. doi:10.1093/eurheartj/eht108
4. Martín-Timón I, Sevillano-Collantes C, Segura-Galindo A, Del Cañizo-Gómez FJ. Type 2 diabetes and cardiovascular disease: have all risk factors the same strength? World J Diabetes. 2014;5(4):444. doi:10.4239/wjd.v5.i4.444
5. Morrish N, Wang S-L, Stevens L, Fuller J, Keen H, Group WMS. Mortality and causes of death in the WHO Multinational Study of Vascular Disease in Diabetes. Diabetologia. 2001;44(2):S14. doi:10.1007/PL00002934
6. Grundy SM, Benjamin IJ, Burke GL, et al. Diabetes and cardiovascular disease: a statement for healthcare professionals from the American Heart Association. Circulation. 1999;100(10):1134–1146. doi:10.1161/01.CIR.100.10.1134
7. Roth GA, Johnson C, Abajobir A, et al. Global, regional, and national burden of cardiovascular diseases for 10 causes, 1990 to 2015. J Am Coll Cardiol. 2017;70(1):1–25. doi:10.1016/j.jacc.2017.04.052
8. Benjamin EJ, Blaha MJ, Chiuve SE, et al. Heart disease and stroke statistics—2017 update. Nat Rev Cardiol. 2017.
9. Einarson TR, Acs A, Ludwig C, Panton UH. Prevalence of cardiovascular disease in type 2 diabetes: a systematic literature review of scientific evidence from across the world in 2007–2017. Cardiovasc Diabetol. 2018;17(1):83. doi:10.1186/s12933-018-0728-6
10. Mozaffarian D, Benjamin EJ, Go AS, et al. Executive summary: heart disease and stroke statistics—2016 update: a report from the American Heart Association. Circulation. 2016;133(4):447–454. doi:10.1161/CIR.0000000000000366
11. Salama S, Mullany EC. A systematic analysis for the Global Burden of Disease Study 2017. Lancet. 2017.
12. Moran A, Forouzanfar M, Sampson U, Chugh S, Feigin V, Mensah G. The epidemiology of cardiovascular diseases in sub-Saharan Africa: the global burden of diseases, injuries and risk factors 2010 study. Prog Cardiovasc Dis. 2013;56(3):234–239. doi:10.1016/j.pcad.2013.09.019
13. Keates AK, Mocumbi AO, Ntsekhe M, Sliwa K, Stewart S. Cardiovascular disease in Africa: epidemiological profile and challenges. Nat Rev Cardiol. 2017;14(5):273–293. doi:10.1038/nrcardio.2017.19
14. Wan EYF, Fong DYT, Fung CSC, Lam CLK. Incidence and predictors for cardiovascular disease in Chinese patients with type 2 diabetes mellitus – a population-based retrospective cohort study. J Diabetes Complications. 2016;30(3):444–450. doi:10.1016/j.jdiacomp.2015.12.010
15. Bonakdaran S, Ebrahimzadeh S, Noghabi S. Cardiovascular disease and risk factors in patients with type 2 diabetes mellitus in Mashhad, Islamic Republic of Iran. EMHJ. 2011;17(9):640–646. doi:10.26719/2011.17.9.640
16. Umamahesh K, Vigneswari A, Surya Thejaswi G, Satyavani K, Viswanathan V. Incidence of cardiovascular diseases and associated risk factors among subjects with type 2 diabetes - an 11-year follow up study. Indian Heart J. 2014;66(1):5–10. doi:10.1016/j.ihj.2013.12.009
17. Avogaro A, Giorda C, Maggini M, et al. Incidence of coronary heart disease in type 2 diabetic men and women: impact of microvascular complications, treatment, and geographic location. Diabetes Care. 2007;30(5):1241–1247. doi:10.2337/dc06-2558
18. Al-Shamsi S, Regmi D, Govender RD. Incidence of cardiovascular disease and its associated risk factors in at-risk men and women in the United Arab Emirates: a 9-year retrospective cohort study. BMC Cardiovasc Disord. 2019;19(1):148. doi:10.1186/s12872-019-1131-2
19. Wolde HF, Atsedeweyen A, Jember A, et al. Predictors of vascular complications among type 2 diabetes mellitus patients at University of Gondar Referral Hospital: a retrospective follow-up study. BMC Endocr Disord. 2018;18(1):52. doi:10.1186/s12902-018-0280-0
20. Organization WH. Prevention of Cardiovascular Disease: World Health Organization; 2007.
21. Kariuki JK, Stuart-Shor EM, Leveille SG, Hayman LL. Methodological challenges in estimating trends and burden of cardiovascular disease in sub-Saharan Africa. Cardiol Res Pract. 2015;2015:2015. doi:10.1155/2015/921021
22. Mendis S, Thygesen K, Kuulasmaa K, et al. World Health Organization definition of myocardial infarction: 2008–09 revision. Int J Epidemiol. 2011;40(1):139–146. doi:10.1093/ije/dyq165
23. Norgren L, Hiatt WR, Dormandy JA, Nehler MR, Harris KA, Fowkes FGR. Inter-society consensus for the management of peripheral arterial disease (TASC II). J Vasc Surg. 2007;45(1):S5–S67.
24. WHO. Physical Status: The Use and Interpretation of Anthropometry. Report of a WHO Expert Committee. Vol. 854. Geneva: World Health Organization technical report series; 1995:1–452.
25. Schoenfeld DA. Sample-size formula for the proportional-hazards regression model. Biometrics. 1983;39(2):499–503. doi:10.2307/2531021
26. Avogaro A, Giorda C, Maggini M, et al. Incidence of coronary heart disease in type 2 diabetic men and women: impact of microvascular complications, treatment, and geographic location. Diabetes Care. 2007;30(5):1241–1247.
27. Cederholm J, Eeg-Olofsson K, Eliasson B, Zethelius B, Nilsson PM, Gudbjörnsdottir S. Risk prediction of cardiovascular disease in type 2 diabetes: a risk equation from the Swedish National Diabetes Register. Diabetes Care. 2008;31(10):2038–2043. doi:10.2337/dc08-0662
28. Franco OH, Steyerberg EW, Hu FB, Mackenbach J, Nusselder W. Associations of diabetes mellitus with total life expectancy and life expectancy with and without cardiovascular disease. Arch Intern Med. 2007;167(11):1145–1151. doi:10.1001/archinte.167.11.1145
29. Al Rawahi AH, Lee P, Al Anqoudi ZA, et al. Cardiovascular disease incidence and risk factor patterns among Omanis with type 2 diabetes: a retrospective cohort study. Oman Med J. 2017;32(2):106. doi:10.5001/omj.2017.20
30. Haffner SM, Lehto S, Rönnemaa T, Pyörälä K, Laakso M. Mortality from coronary heart disease in subjects with type 2 diabetes and in nondiabetic subjects with and without prior myocardial infarction. N Eng j Med. 1998;339(4):229–234. doi:10.1056/NEJM199807233390404
31. Elley CR, Robinson E, Kenealy T, Bramley D, Drury PL. Derivation and validation of a new cardiovascular risk score for people with type 2 diabetes: the new zealand diabetes cohort study. Diabetes Care. 2010;33(6):1347–1352. doi:10.2337/dc09-1444
32. North BJ, Sinclair DA. The intersection between aging and cardiovascular disease. Circ Res. 2012;110(8):1097–1108. doi:10.1161/CIRCRESAHA.111.246876
33. Steenman M, Lande G. Cardiac aging and heart disease in humans. Biophys Rev. 2017;9(2):131–137. doi:10.1007/s12551-017-0255-9
34. Roger VL, Go AS, Lloyd-Jones DM, et al. Heart disease and stroke statistics—2011 update: a report from the American Heart Association. Circulation. 2011;123(4):e18–e209.
35. Yang C, Wang J, Yang Y, et al. Impact of anemia and chronic kidney disease on the risk of cardiovascular disease and all-cause mortality among diabetic patients. J Peking Univ Health Sci. 2018;50(3):495–500.
36. Meisinger C, Döring A, Löwel H. Chronic kidney disease and risk of incident myocardial infarction and all-cause and cardiovascular disease mortality in middle-aged men and women from the general population. Eur Heart J. 2006;27(10):1245–1250. doi:10.1093/eurheartj/ehi880
37. Association AD. Standards of medical care in diabetes—2015 abridged for primary care providers. Clin Diabetes. 2015;33(2):97. doi:10.2337/diaclin.33.2.97
38. Gansevoort RT, Correa-Rotter R, Hemmelgarn BR, et al. Chronic kidney disease and cardiovascular risk: epidemiology, mechanisms, and prevention. Lancet. 2013;382(9889):339–352. doi:10.1016/S0140-6736(13)60595-4
39. Van Der Velde M, Matsushita K, Coresh J, et al. Lower estimated glomerular filtration rate and higher albuminuria are associated with all-cause and cardiovascular mortality. A collaborative meta-analysis of high-risk population cohorts. Kidney Int. 2011;79(12):1341–1352. doi:10.1038/ki.2010.536
40. Koomans HA, Roos J, Dorhout Mees E, Delawi I. Sodium balance in renal failure. A comparison of patients with normal subjects under extremes of sodium intake. Hypertension. 1985;7(5):714–721. doi:10.1161/01.HYP.7.5.714
41. Guyton A. Kidneys and fluids in pressure regulation. Small volume but large pressure changes. Hypertension. 1992;19(1_supplement):I2. doi:10.1161/01.HYP.19.1_Suppl.I2
42. Tomey MI, Winston JA. Cardiovascular pathophysiology in chronic kidney disease: opportunities to transition from disease to health. Ann Global Health. 2014;80(1):69–76. doi:10.1016/j.aogh.2013.12.007
43. Trialists’Collaboration BPLT. Effects of different regimens to lower blood pressure on major cardiovascular events in older and younger adults: meta-analysis of randomised trials. BMJ. 2008;336(7653):1121–1123. doi:10.1136/bmj.39548.738368.BE
44. Carey RM, Whelton PK. Prevention, detection, evaluation, and management of high blood pressure in adults: synopsis of the 2017 American College of Cardiology/American Heart Association Hypertension Guideline. Ann Intern Med. 2018;168(5):351–358. doi:10.7326/M17-3203
45. Xu W, Goldberg SI, Shubina M, Turchin A. Optimal systolic blood pressure target, time to intensification, and time to follow-up in treatment of hypertension: population based retrospective cohort study. BMJ. 2015;350(feb05 9):h158. doi:10.1136/bmj.h158
46. Yusufali AM, Khatib R, Islam S, et al. Prevalence, awareness, treatment and control of hypertension in four Middle East countries. J Hypertens. 2017;35(7):1457–1464. doi:10.1097/HJH.0000000000001326
47. Hsueh WA, Anderson PW. Hypertension, the endothelial cell, and the vascular complications of diabetes mellitus. Hypertension. 1992;20(2):253–263. doi:10.1161/01.HYP.20.2.253
48. Lee JS, Chang P-Y, Zhang Y, Kizer JR, Best LG, Howard BV. Triglyceride and HDL-C dyslipidemia and risks of coronary heart disease and ischemic stroke by glycemic dysregulation status: the strong heart study. Diabetes Care. 2017;40(4):529–537. doi:10.2337/dc16-1958
49. Madsen CM, Varbo A, Nordestgaard BG. Unmet need for primary prevention in individuals with hypertriglyceridaemia not eligible for statin therapy according to European Society of Cardiology/European Atherosclerosis Society guidelines: a contemporary population-based study. Eur Heart J. 2018;39(7):610–619. doi:10.1093/eurheartj/ehx659
50. Vergès B. Pathophysiology of diabetic dyslipidaemia: where are we? Diabetologia. 2015;58(5):886–899. doi:10.1007/s00125-015-3525-8
51. Holmes MV, Asselbergs FW, Palmer TM, et al. Mendelian randomization of blood lipids for coronary heart disease. Eur Heart J. 2015;36(9):539–550. doi:10.1093/eurheartj/eht571
52. Tada H, Kawashiri M. Genetic variations, triglycerides, and atherosclerotic disease. J Atheroscler Thromb. 2019;26(2):128–131. doi:10.5551/jat.ED102
53. Tada H, Takamura M, Kawashiri M. Genomics of hypertriglyceridemia. Advances in Clinical Chemistry. Advances in Clinical Chemistry. 2020;97:141–169. doi:10.1016/bs.acc.2019.12.005
 © 2021 The Author(s). This work is published and licensed by Dove Medical Press Limited. The full terms of this license are available at https://www.dovepress.com/terms.php and incorporate the Creative Commons Attribution - Non Commercial (unported, v3.0) License.
By accessing the work you hereby accept the Terms. Non-commercial uses of the work are permitted without any further permission from Dove Medical Press Limited, provided the work is properly attributed. For permission for commercial use of this work, please see paragraphs 4.2 and 5 of our Terms.
© 2021 The Author(s). This work is published and licensed by Dove Medical Press Limited. The full terms of this license are available at https://www.dovepress.com/terms.php and incorporate the Creative Commons Attribution - Non Commercial (unported, v3.0) License.
By accessing the work you hereby accept the Terms. Non-commercial uses of the work are permitted without any further permission from Dove Medical Press Limited, provided the work is properly attributed. For permission for commercial use of this work, please see paragraphs 4.2 and 5 of our Terms.