")
Back to Journals » Clinical Optometry » Volume 15
Hospitalisation Trends for Choroid and Retina Diseases in the Past 20 Years: An Ecological Study in Australia
Received 31 July 2023
Accepted for publication 11 October 2023
Published 17 October 2023 Volume 2023:15 Pages 247—259
DOI https://doi.org/10.2147/OPTO.S433266
Checked for plagiarism Yes
Review by Single anonymous peer review
Peer reviewer comments 2
Editor who approved publication: Mr Simon Berry
Mohammad R Naqeeb,1 Abdallah Y Naser2
1College of Medicine, Umm Al-Qura University, Makkah, Saudi Arabia; 2Department of Applied Pharmaceutical Sciences and Clinical Pharmacy, Faculty of Pharmacy, Isra University, Amman, Jordan
Correspondence: Mohammad R Naqeeb, College of Medicine, Umm Al-Qura University, Makkah, Saudi Arabia, Tel +966555505011, Email [email protected]
Background: Choroidal and retinal disorders significantly contribute to vision impairment, often necessitating hospitalization for the purposes of diagnosis, treatment, and continued care. The aim of this study was to examine hospitalisation trends of choroid and retina diseases in the past 20 years in Australia.
Methods: This was an ecological study that used publically available data in Australia from 1998 to 2021. The National Hospital Morbidity Database (NHMD) is an online database that was used to collect the data for this study. We used the chi-squared test to assess the difference between the hospitalisation rates between 1998 and 2021.
Results: During the study period, hospital admission rate for choroid and retina diseases increased by 13.21-fold [from 29.54 (95% CI 28.77– 30.32) in 1998 to 419.70 (95% CI 417.21– 422.20) in 2021 per 100,000 persons, p< 0.001]. Same-day hospital admission patients accounted for 90.3% of the total number of episodes. Rates of same-day hospital admission increased by 37.70-fold [from 9.24 (95% CI 8.81– 9.68) in 1998 to 357.78 (95% CI 355.48– 360.09) in 2021 per 100,000 persons]. Rates of overnight-stay hospital admission decreased by 19.3% [from 20.34 (95% CI 19.69– 20.98) in 1998 to 16.41 (95% CI 15.91– 16.90) in 2021 per 100,000 persons]. Females contributed to 54.6% of the total number of hospital admission. Admission rate among females increased by 16.01-fold [from 23.68 (95% CI 22.70– 24.66) in 1998 to 402.78 (95% CI 399.33– 406.22) in 2021 per 100,000 persons]. Admission rate among males increased by 8.69-fold [from 35.57 (95% CI 34.36– 36.78) in 1998 to 344.80 (95% CI 341.58– 348.02) in 2021 per 100,000 persons].
Conclusion: In this ecological investigation, we found that the admission rate for choroid and retina disorders increased dramatically. The preponderance of these admissions were made up of females and elderly patients. Future research is required to identify additional risk factors for disorders of this type.
Keywords: admission, Australia, choroid haemorrhage, choroid disease, hospitalisation, retina
Introduction
Worldwide, an integral part of specialized eye care is traditional inpatient hospitalisation. Eye diseases and various causes require inpatient eye care.1–4 Many factors guide ophthalmic hospital admission, including inpatient distance from the hospital, medical causes, ocular surgeries, preference for surgeons, and the existence of home support.2,3,5 There is a broad range of medical causes for ophthalmic admissions, including vision-threatening conditions to head positioning, frequency of application or monitoring of topical medicines, and the requirement for intravenous medications.2 The need for ophthalmic patient admissions must be explained because inpatient care is expensive for the patient and the health system. In addition to that, eye care for ophthalmic outpatients decreases the cost.3
Previous study from developing and developed countries indicates that the main indications for admission of ophthalmic patients are glaucoma, retinal detachment, eye trauma, and cataracts.2,6,7 According to the International Classification of Diseases 10th Revision (ICD-10), retinal detachment is one of the choroidal and retinal disorders that are part of the diseases of the eye and its appendices.8
Choroidal and retinal abnormalities are a prominent contributor to visual impairment, frequently requiring hospitalization for the purposes of diagnosis, treatment, and ongoing care.9 Various medical conditions, namely age-related macular degeneration, diabetic retinopathy, and retinal detachment, have the potential to cause significant impairment of vision and necessitate the provision of specialist medical attention.9 The management of hospital admissions for these illnesses necessitates a collaborative and interdisciplinary approach, wherein ophthalmologists, retinal specialists, and nurses work together to deliver comprehensive care. A recent study found that the rate of hospital admissions for eye and adnexa diseases in England and Wales increased by 73.8% from 1999 to 2019.10 Choroidal and retinal disorders were the second most common reason for hospitalisation for eye and adnexa disorders, accounting for 14.2% of all diseases of the eye and adnexa hospital admissions episodes. Moreover, the most increased hospitalisation rate for eye and adnexa diseases was seen in disorders of the choroid and retina at 3.6-fold.10 In 2017–2018 in Australia, the total number of hospitalisations for eye and ocular adnexa-related was 451,069 (245,018 females Vs 206,037 males).11
However, there were no previous studies evaluating trends in choroidal and retinal disorders hospital admissions in Australia. Thus, our research aimed to examine hospitalisation trends of choroid and retina diseases in the past 20 years.
Methods
Study Design
This was an ecological study that used publically available data in Australia from 1998 to 2021.
Data Sources
The National Hospital Morbidity Database
The National Hospital Morbidity Database (NHMD) is an online database that was used to collect the data for this study for patients admitted to private and public hospitals.12,13 The aforementioned is a yearly compilation that consists of episode-level records derived from the collection systems of admitted patient morbidity data in hospitals across Australia.12 Episodes of care at the hospital level result in the development of unit records, which are then transmitted to state hospital authorities for data submission.12 The documents encompass data regarding the patient’s characteristics, hospital details, and detailed information pertaining to the health aspects of the treatment episode. This includes diagnoses, external causes of harm and poisoning, and procedures.
Australian Bureau of Statistics
The Australian Bureau of Statistics (ABS) was used to collect mid-year population data for the period between 1998 and 2021 as follows:14,15
Study Population and Outcome
All patients who were hospitalised for disorders of choroid and retina in Australia formed the study population. Hospitalisation were identified using the H30-H36 ICD codes. The ICD codes are derived from the principal diagnosis. The data included in this study consists exclusively of publicly accessible aggregated data. The definition of “same-day hospitalisation” pertains to a defined timeframe during which an individual, admitted to a hospital as an inpatient, remains bedridden and stays overnight within the hospital facility. The definition of “overnight-stay admitted care” pertains to the delivery of medical care to a patient who is admitted to a hospital for a minimum period of one night and is afterwards discharged on a different day.
Statistical Analysis
Hospitalisation rates (with 95% confidence intervals (CIs)) were calculated using the finished consultant episodes of admission divided by the mid-year population. We used the chi-squared test to assess the difference between the hospitalisation rates between 1998 and 2021. All analyses were conducted using SPSS version 27 (IBM Corp, Armonk, NY, USA).
Results
Hospitalisation Profile for Choroid and Retina Disorders
A total of 1,034,143 disorders of choroid and retina hospital admission episodes were recorded in Australia between 1998 and 2021. The total annual number for “disorders of choroid and retina” hospital admissions for various reasons increased by 18.44-fold from 5558 in 1998 to 108,024 in 2021, expressing an increase in hospital admission rate of 13.21-fold [from 29.54 (95% CI 28.77–30.32) in 1998 to 419.70 (95% CI 417.21–422.20) in 2021 per 100,000 persons, p<0.001].
Same-day disorders of “choroid and retina” hospital admission patients accounted for 90.3% of the total number of “disorders of choroid and retina” hospital admissions, and 9.7% were overnight-stay patients. Rates of same-day hospital admission for “disorders of choroid and retina” increased by 37.70-fold [from 9.24 (95% CI 8.81–9.68) in 1998 to 357.78 (95% CI 355.48–360.09) in 2021 per 100,000 persons]. Rates of overnight-stay hospital admission for disorders of “choroid and retina” decreased by 19.3% [from 20.34 (95% CI 19.69–20.98) in 1998 to 16.41 (95% CI 15.91–16.90) in 2021 per 100,000 persons] (Figure 1).
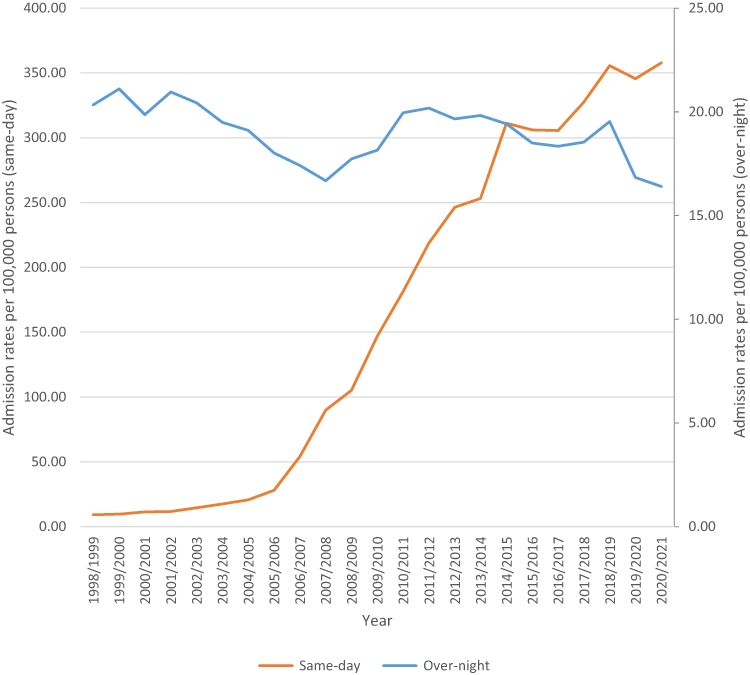 |
Figure 1 Rates of same-day and overnight-stay hospital admission for disorders of choroid and retina. |
Other retinal disorders were the most common reason for hospital admissions, which accounted for 79.3% of the total number of hospital admissions, followed by retinal detachments and breaks with 12.3% (Table 1).
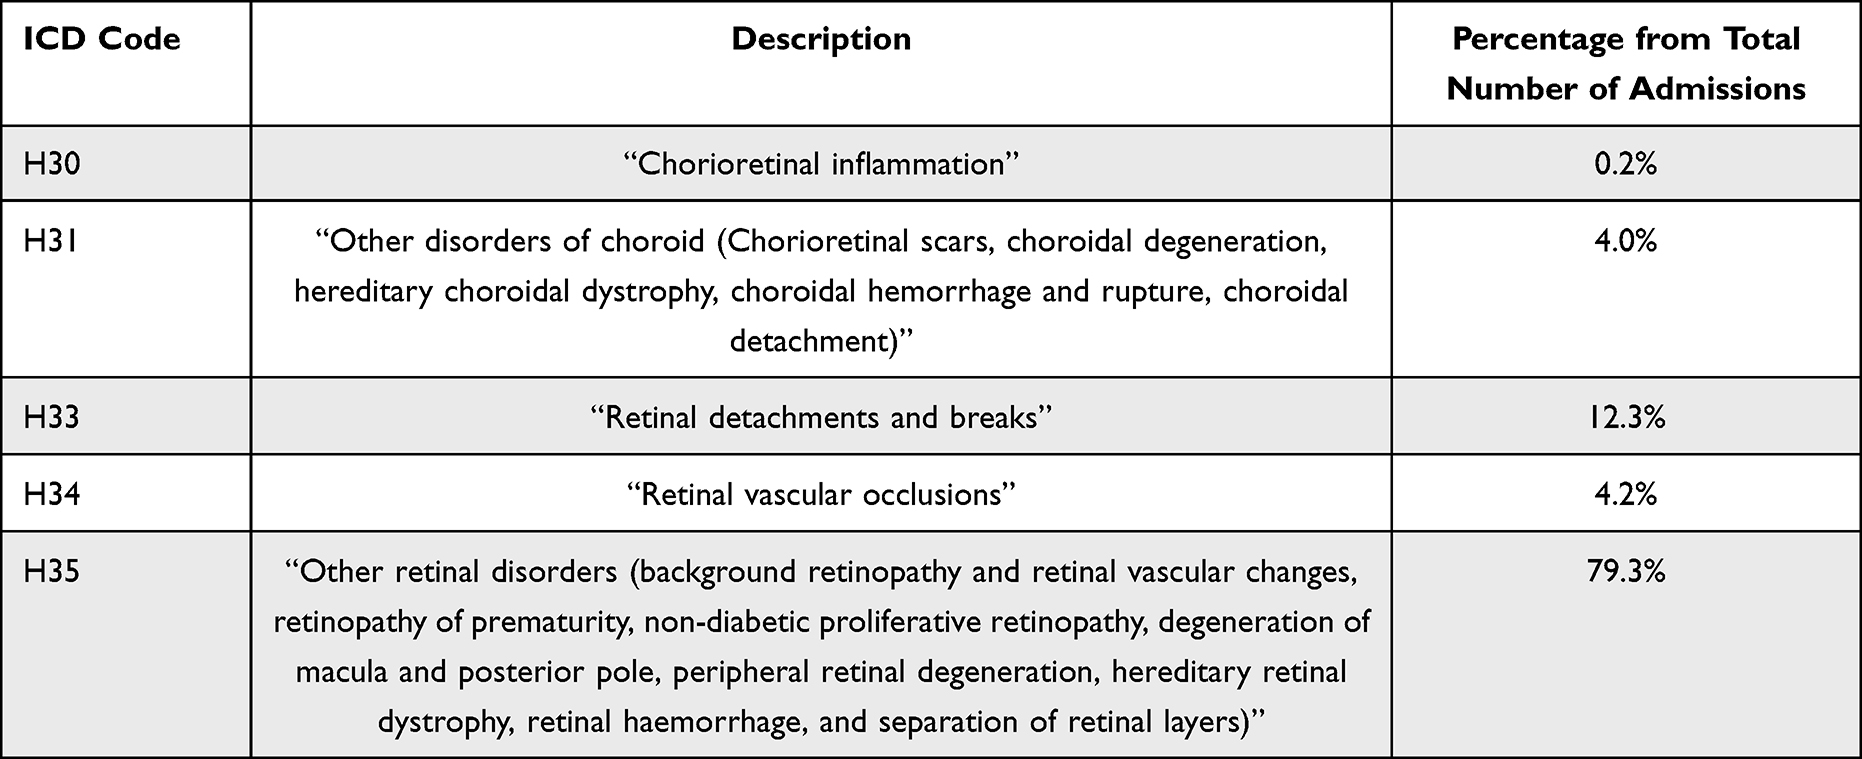 |
Table 1 Percentage of Disorders of Choroid and Retina Hospital Admission from Total Number of Admissions per ICD Code |
Changes in the Rate of Hospital Admissions
During the past 23 years, a massive increase was observed in “other disorders of choroid”, “other retinal disorders”, and “retinal vascular occlusions” with: 134.33-fold, 40.54-fold, and 16.23-fold, respectively. Admissions rate for retinal detachments and breaks increased by 56.0%. However, admissions rate for chorioretinal inflammation decreased by 21.6% (Table 2 and Figure 2).
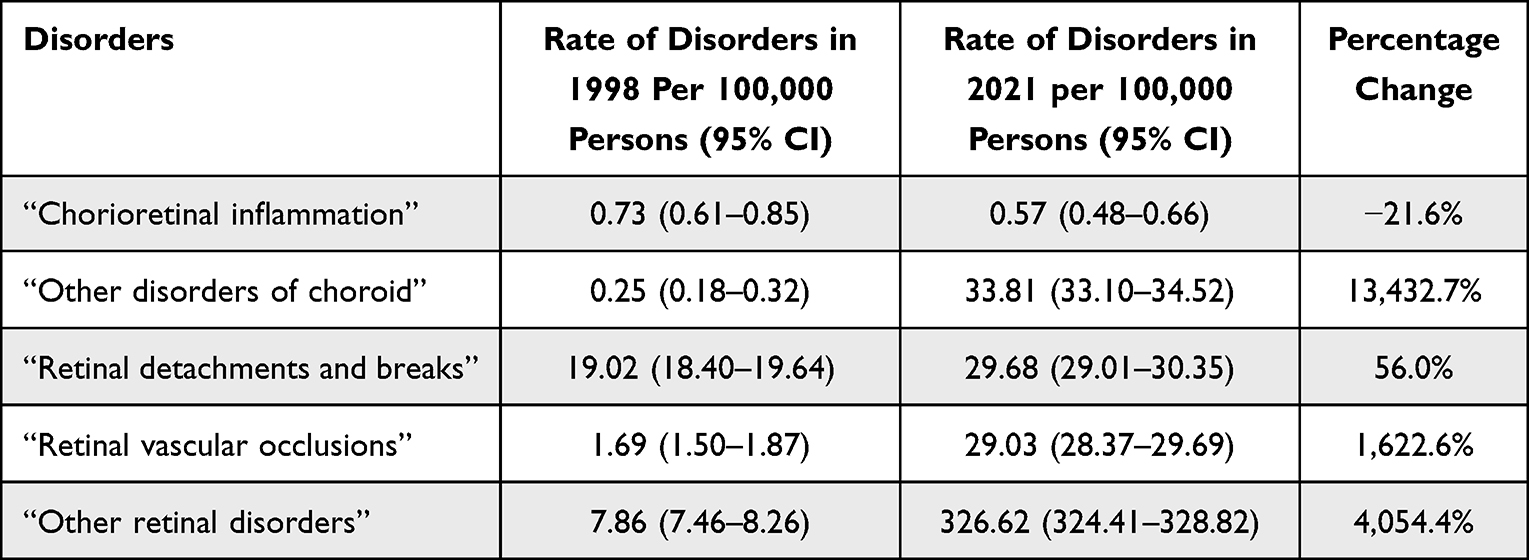 |
Table 2 Percentage Change in the Hospital Admission Rates |
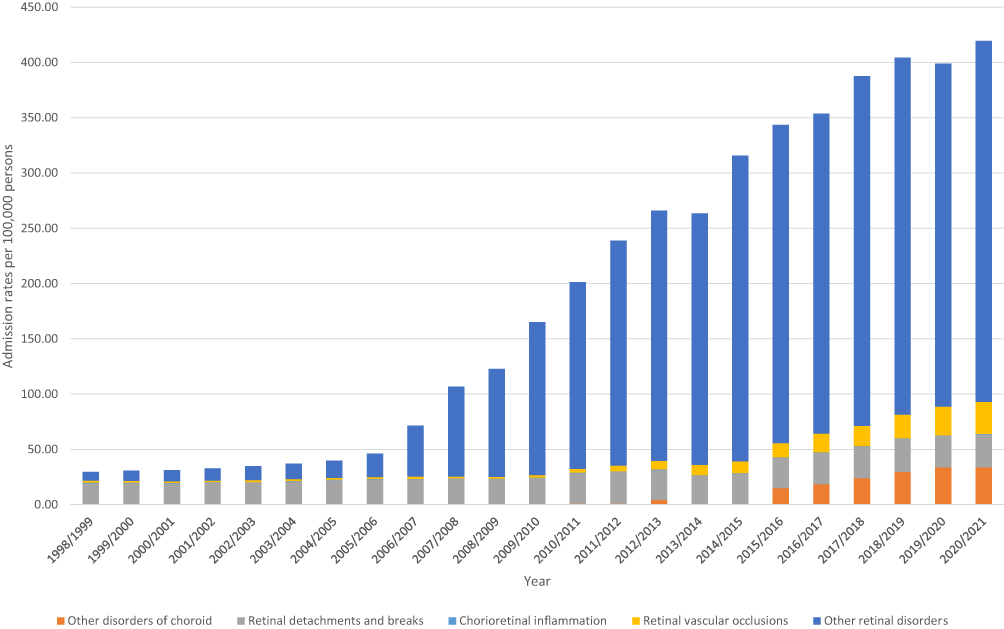 |
Figure 2 Admission rates stratified by type between 1998 and 2021. |
Hospital Admissions Stratified by Gender
Females contributed to 54.6% of the total number of hospital admission accounting for 540,191 hospital admission episodes with a mean of 23,486.6 per year. Admission rate among females increased by 16.01-fold [from 23.68 (95% CI 22.70–24.66) in 1998 to 402.78 (95% CI 399.33–406.22) in 2021 per 100,000 persons]. Admission rate among males increased by 8.69-fold [from 35.57 (95% CI 34.36–36.78) in 1998 to 344.80 (95% CI 341.58–348.02) in 2021 per 100,000 persons] (Figure 3).
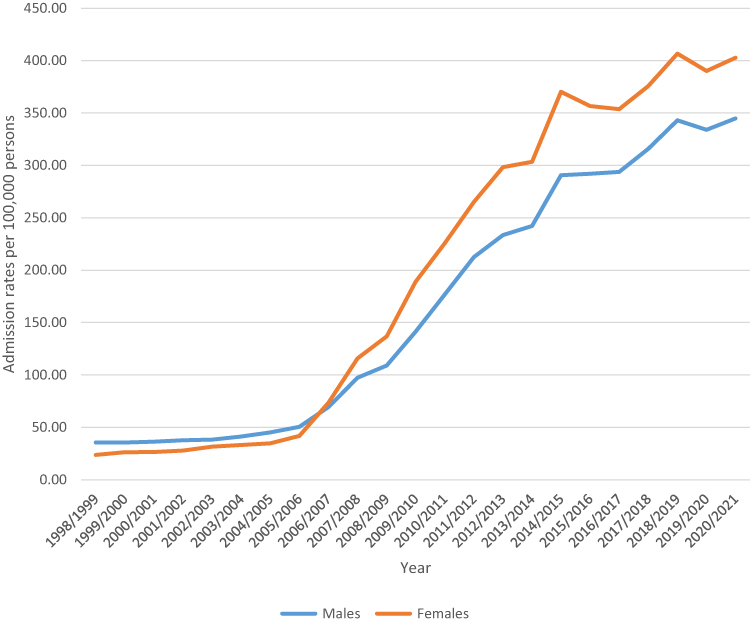 |
Figure 3 Admission rates stratified by gender. |
Hospital Admissions Stratified by Age
The age group 75 years and above accounted for 58.4% of the total number of disorders of admissions, followed by the age group 60–74 years with 29.2%, the age group 15–59 years with 11.6%, and then the age group below 15 years with 0.7%. Rates of hospital admission for patients aged below 15 years increased by 22.7% “[from 6.59 (95% CI 5.79–7.39) in 1998 to 8.09 (95% CI 7.28–8.89) in 2021 per 100,000 persons]”. Rates of hospital admission patients aged 15–59 years increased by 2.48-fold “[from 17.88 (95% CI 17.12–18.64) in 1998 to 62.25 (95% CI 61.00–63.51) in 2021 per 100,000 persons]”. Rates of hospital admission patients aged 60–74 years increased by 6.12-fold “[from 101.57 (95% CI 97.23–105.92) in 1998 to 723.51 (95% CI 715.08–731.95) in 2021 per 100,000 persons]”. Rates of hospital admission patients aged 75 years and above increased by 27.38-fold “[from 107.67 (95% CI 101.31–114.03) in 1998 to 3,055.23 (95% CI 3,030.84–3,079.62) in 2021 per 100,000 persons]” (Figure 4).
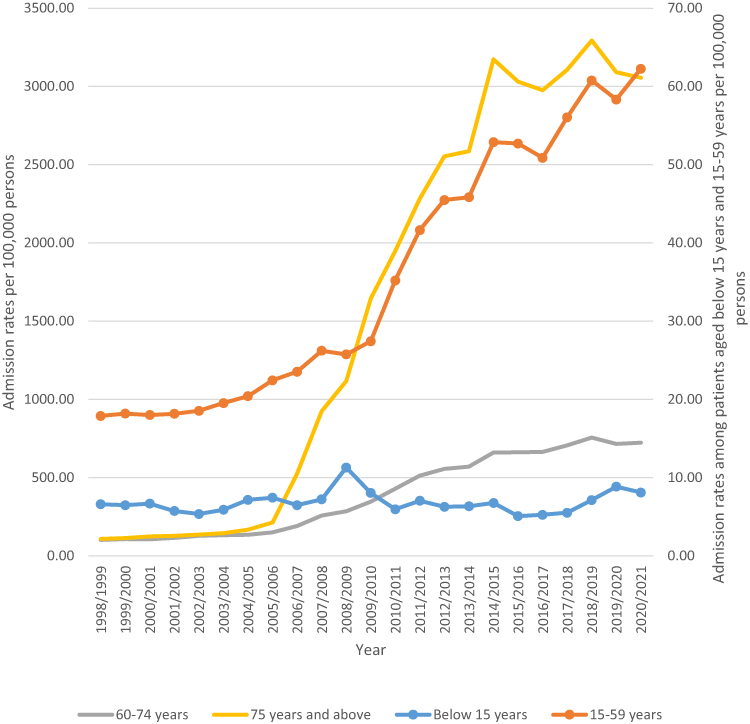 |
Figure 4 Admission rates stratified by age group. |
Hospital Admissions Stratified by Age and Gender
The Age Group Below 15 Years
During the past 23 years, admissions rates among patients aged 5–9 years and 10–14 years were decreased by 54.7% and 1.4%, respectively. Admissions rate among males’ patients aged 5–9 years and 10–14 years decreased by 56.3% and 18.8%, respectively. Admissions rate among females’ patients aged 5–9 years decreased by 52.6%. Admissions rate among total and males’ patients aged 0–4 years increased by 92.5% and 1.14-fold, respectively. Admissions rate among females’ patients aged 0–4 years and 10–14 years increased by 61.5% and 54.4%, respectively (Figure 5).
 |
Figure 5 Admission rates among the age group below 15 years. |
The Age Group 15 – 59 Years
During the past 23 years, admissions rates among patients aged 15–19 years, 20–24 years, 25–29 years, 30–34 years, 35–39 years, 40–44 years, 45–49 years, 50–54 years, and 55–59 years increased by 97.6%, 19.3%, 41.4%, 86.1%, 1.39-fold, 1.76-fold, 2.38-fold, 2.29-fold, and 3.57-fold, respectively. Admissions rate among males’ patients aged 15–19 years, 20–24 years, 25–29 years, 30–34 years, 35–39 years, 40–44 years, 45–49 years, 50–54 years, and 55–59 years increased by 1.30-fold, 6.0%, 11.2%, 37.5%, 1.15-fold, 1.54-fold, 2.05-fold, 1.60-fold, and 3.52-fold, respectively. Admissions rate among females’ patients aged 15–19 years, 20–24 years, 25–29 years, 30–34 years, 35–39 years, 40–44 years, 45–49 years, 50–54 years, and 55–59 years increased by 38.4%, 43.2%, 84.3%, 1.81-fold, 1.97-fold, 2.18-fold, 3.14-fold, 4.20-fold, and 3.68-fold, respectively (Figure 6).
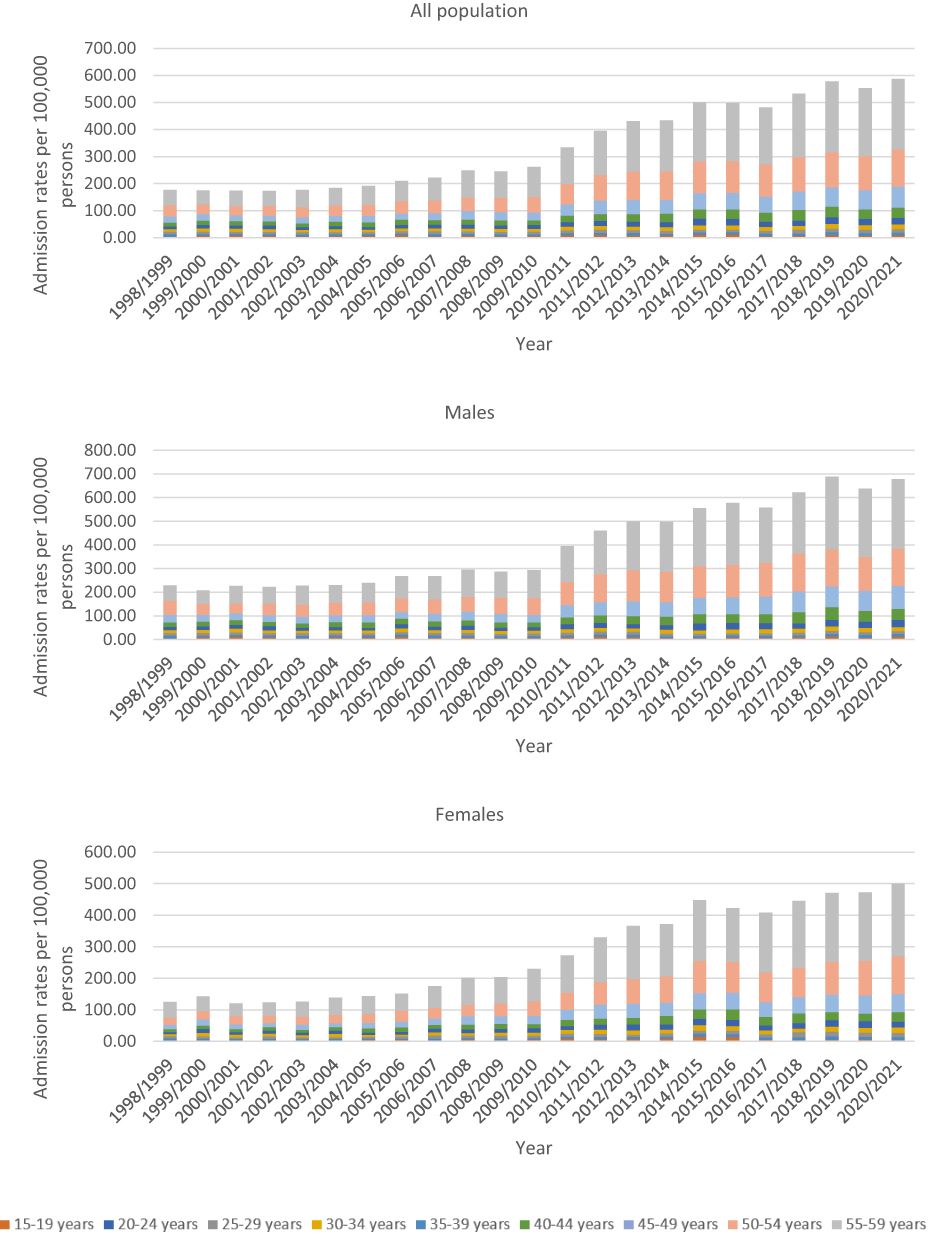 |
Figure 6 Admission rates among the age group 15–59 years. |
The Age Group 60–74 Years
During the past 23 years, admissions rates among patients aged 60–64 years, 65–69 years, and 70–74 years increased by 3.99-fold, 5.62-fold, and 8.50-fold, respectively. Admissions rate among males’ patients aged 60–64 years, 65–69 years, and 70–74 years increased by 3.48-fold, 4.85-fold, and 7.29-fold, respectively. Admissions rate among females’ patients aged 60–64 years, 65–69 years, and 70–74 years increased by 4.91-fold, 6.68-fold, and 9.89-fold, respectively (Figure 7).
 |
Figure 7 Admission rates among the age group 60–74 years. |
The Age Group 75–85 Years and Over
During the past 23 years, admissions rates among patients aged 75–79 years, 80–84 years, and 85 years and over increased by 14.46-fold, 29.68-fold, and 57.41-fold, respectively. Admissions rate among males’ patients aged 75–79 years, 80–84 years, and 85 years and over increased by 11.48-fold, 23.68-fold, and 29.86-fold, respectively. Admissions rate among females’ patients aged 75–79 years, 80–84 years, and 85 years and over increased by 17.75-fold, 34.94-fold, and 90.75-fold, respectively (Figure 8).
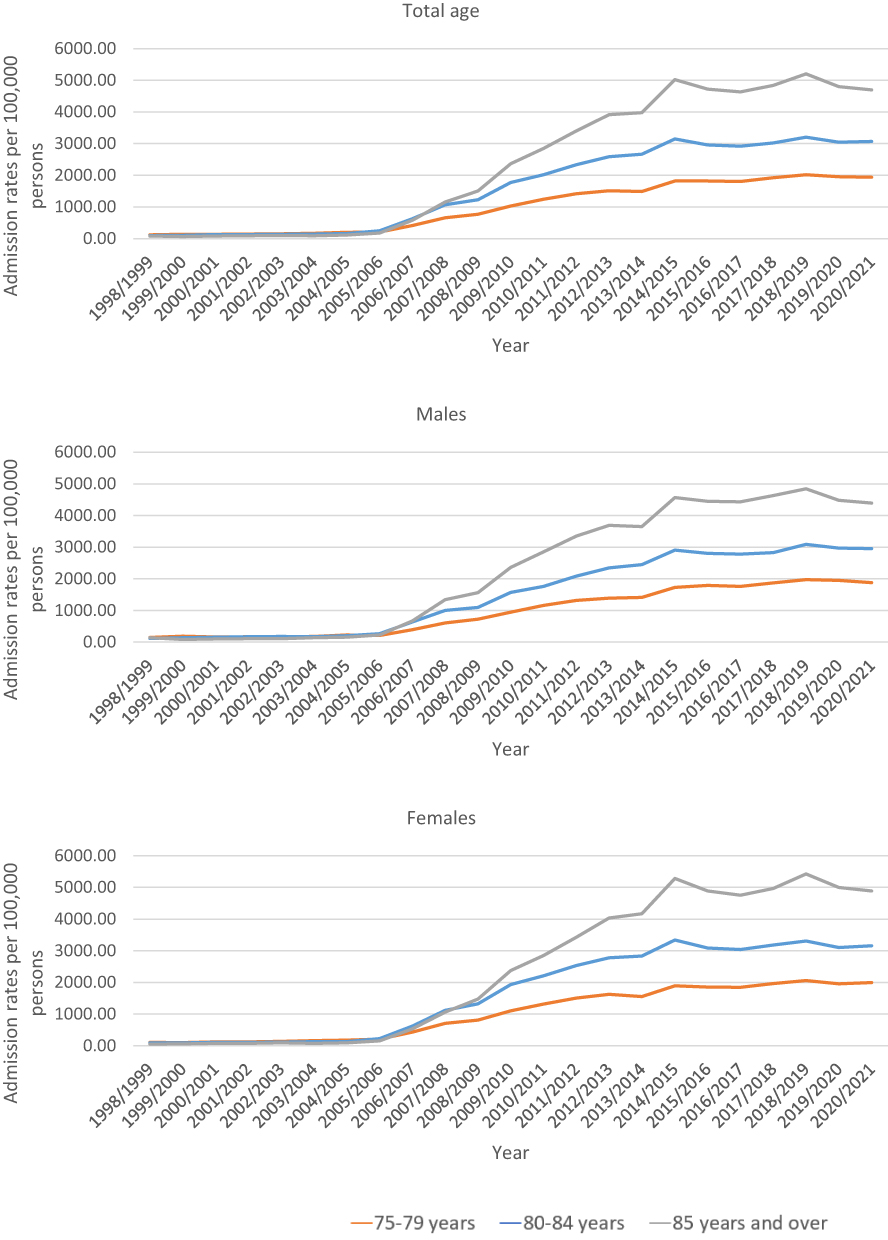 |
Figure 8 Admission rates among the age group 75–85 years and over. |
Discussion
This study aimed to examine hospitalisation trends of choroid and retina diseases in Australia the past 20 years. It was found that the total annual number for disorders of choroid and retina hospital admissions for various reasons increased by 18.44-fold from 5558 in 1998 to 108,024 in 2021, expressing an increase in hospital admission rate of 13.21-fold [from 29.54 (95% CI 28.77–30.32) in 1998 to 419.70 (95% CI 417.21–422.20) in 2021 per 100,000 persons, p<0.001]. We found that other retinal disorders were the most common disorders of choroid and retina hospital admissions reasons were accounting for 79.3% of the total number of disorders of choroid and retina hospital admissions, followed by retinal detachments and breaks with 12.3% (Table 1). Disorders of choroid and retina hospital admissions rate for retinal detachments and breaks were increased by 56.0%. However, disorders of choroid and retina hospital admissions rate for chorioretinal inflammation were decreased by 21.6% (Table 2 and Figure 2).
There are limited studies worldwide and in Australia concerning trends in hospital admissions of the eye and the choroid and retinal diseases and therefore, it is difficult to directly compare our results with previous studies. However, the findings of this study are generally consistent with previous studies that looked into the rate of postprocedural complications of eye and adnexa and studies reporting incidence or prevalence of retinal disease. We found that the total annual number for disorders of choroid and retina hospital admissions for various reasons increased by 18.44-fold from 5558 in 1998 to 108,024 in 2021. These results are consistent with a previous study that investigated the rate of postprocedural complications of eye and adnexa in the UK. The authors explored the trend of hospital admissions concerning diseases of the eye and adnexa in the United Kingdom in the past 20 years using hospital episodes data, they reported that the most common cause of hospitalization for diseases of the eye and adnexa was disorders of the lens (62.3%), followed by disorders of the choroid and retina (14.2%).10 In addition, another study that explored the demographic features and patterns of hospital admission in the United States for nontraumatic disorders of the eye and ocular adnexa reported similar results concerning retinal diseases.3
Several risk factors may contribute the increase in the retinal hospital admission including other diabetic retinopathy and retinal hemorrhage. Several studies reported that age is an important risk factor for retinal conditions,16,17 this was also noticed in our study, as we found that the older age group 60 and above accounted for the majority of the hospital admission cases, these findings can be explained by multiple reasons including the fact that majority of the eye procedures are for the older age group but also may be explained by the fact that older age group usually have other comorbidities such as diabetes, hypertension which may increase the risk of post procedural complications and admissions.18–20
In our study, retinal detachments and breaks accounted for the second most common disorders of choroid and retina hospital admissions, these results are consistent with a previous study in the UK that analyzed data from the Hospital Episode Statistics from the Health and Social Care Information Centre and population data from the United Kingdom’s Office for National Statistics, the authors concluded that the frequency of admissions to hospital for surgically treated retinal detachment seems to have been increasing significantly.19 The increased in rates of retinal detachment conditions may be attributed to the increased rates of cataract surgery, increased incidence of diabetes, aging, increasing longevity and increasing rates of myopia.19
In recent years, there has been a rise in the proportion of same day operations and day surgeries. This may be attributed to the fact that new surgical techniques and advances in anaesthesia is now more applicable.21 This was noticed in our results as we found that rates of same-day hospital admission for disorders of choroid and retina increased by 37.70-fold [from 9.24 (95% CI 8.81–9.68) in 1998 to 357.78 (95% CI 355.48–360.09) in 2021 per 100,000 persons], while rates of overnight-stay hospital admission for disorders of choroid and retina decreased by 19.3% [from 20.34 (95% CI 19.69–20.98) in 1998 to 16.41 (95% CI 15.91–16.90) in 2021 per 100,000 persons]. In addition, these results also shows indicates a better health-care system and early less complications and cost effectiveness approaches.22
This study has several strength points including that this is the first study to explore trends in the hospitalisation trends of choroid and retina diseases in Australia the past 20 years. The study was at the national level and we analyzed the data based on gender and age. The results of our study can help to have a better insight on the current situation and clinical practice regarding retinal conditions.
However, our study has some limitations. We were unable to investigate patient-level data and therefore, we were unable to investigate data related to the underlying reasons for the trends.23 Factors such as demographic, comorbidities, polypharmacy and lifestyles, were not considered in our analysis. In addition, in this study we used ICD-10 codes to identify the diagnosis and therefore, we were unable to specifically identify which eye problems had the greatest impact on the hospital admission rate.
Conclusion
In this ecological study, we found that there was a 13-fold increase in the admission rate for disorders of the choroid and retina. Females and elderly patients contributed for the majority of these admissions. Future studies are warranted to identify other risk factors for this type of disorders.
Data Sharing Statement
Publicly available datasets were analyzed in this study. This data can be found here: https://www.aihw.gov.au/about-our-data/our-data-collections/national-hospitals.
Ethical Approval and Consent to Participate
The research ethics committee of the Faculty of Pharmacy at Isra University approved the study protocol (SREC/22/08/49). Hospital admissions, mortality, and population data are publicly available as de-identified data. Therefore, it was considered an exempt category.
Author Contributions
All authors made a significant contribution to the work reported whether that is in the conception, study design, execution, acquisition of data, analysis and interpretation, or in all these areas; took part in drafting, revising or critically reviewing the article; gave final approval of the version to be published; have agreed on the journal to which the article has been submitted; and agree to be accountable for all aspects of the work.
Funding
No fund was received for this study.
Disclosure
The authors declare no conflicts of interest in this work.
References
1. Atalla ML, Wells KK, Peucker N, et al. Cataract extraction in a major ophthalmic hospital: day-case or overnight stay? Clin Experiment Ophthalmol. 2000;28:83–88.
2. Gaujoux T, Offret O, Renard G, Santini Y, Chauvaud D, Bourges JL. Pertinence de l’hospitalisation traditionnelle dans un service d’ophtalmologie [Relevance of traditional hospitalizations in an ophthalmology department]. J Fr Ophtalmol. 2008;31:503–508. French. doi:10.1016/S0181-5512(08)72467-7
3. Mulla ZD, Margo CE. Hospitalization for nontraumatic disorders of the eye and ocular adnexa: analysis of the Florida agency for health care administration data set. Arch Ophthalmol. 2004;122:262–266. doi:10.1001/archopht.122.2.262
4. Qureshi MB, Khan MD, Shah MN, Ahmad K. Glaucoma admissions and surgery in public sector tertiary care hospitals in Pakistan: results of a national study. Ophthalmic Epidemiol. 2006;13:115–119. doi:10.1080/09286580500521023
5. Denman-Johnson M, Bingham P, George S. A confidential enquiry into emergency hospital admissions on the Isle of Wight, UK. J Epidemiol Community Health. 1997;51:386–390. doi:10.1136/jech.51.4.386
6. Finger RP, Köberlein-Neu J, Gass P, Holz FG, Bertram B. Entwicklung der stationären augenärztlichen Versorgung in Deutschland [Trends in inpatient treatment in ophthalmology in Germany]. Der Ophthalmologe. 2013;110:224–229. doi:10.1007/s00347-012-2751-4
7. Onakpoya OH, Adegbehingbe BO, Adeoye AO, Adewara BA. Ophthalmic admissions in a tertiary hospital in Nigeria. Afr Health Sci. 2010;10:54–57.
8. World Health Organization. ICD-10 Version; 2010. Available from: https://icd.who.int/browse10/2010/en#/.
9. Wong TY, Sun J, Kawasaki R, et al. Guidelines on diabetic eye care: the international council of ophthalmology recommendations for screening, follow-up, referral, and treatment based on resource settings. Ophthalmology. 2018;125:1608–1622. doi:10.1016/j.ophtha.2018.04.007
10. Alrawashdeh HM, Naser AY, Alwafi H, et al. Trends in hospital admission due to diseases of the eye and adnexa in the past two decades in England and wales: an ecological study. Int J Gen Med. 2022;15:1097–1110. doi:10.2147/IJGM.S344380
11. Australian Institute of Health and Welfare. Data tables: eye Health 2020. Available from: https://www.aihw.gov.au/getmedia/4fbeb9cc-8a91-4f9e-aa0d-16bcda8f8ac4/eye-health-data-tables-2020_1.xlsx.aspx.
12. Australian Institute of Health and Welfare. National Hospitals Data Collection. Available from: https://www.aihw.gov.au/about-our-data/our-data-collections/national-hospitals.
13. Australian Bureau of Statistics. About. Available from: https://www.abs.gov.au/about.
14. Australian Bureau of Statistics. Historical population. Available from: https://www.abs.gov.au/statistics/people/population/historical-population/2016.
15. Australian Bureau of Statistics. National, state and territory population. Available from: https://www.abs.gov.au/statistics/people/population/national-state-and-territory-population/latest-release#media-releases.
16. Faghihi H, Jalali KH, Amini A, Hashemi H, Fotouhi A, Esfahani MR. Rhegmatogenous retinal detachment after LASIK for myopia. J Refract Surg. 2006;22:448–452. doi:10.3928/1081-597X-20060501-05
17. Raczyńska D, Glasner L, Serkies-Minuth E, Wujtewicz M, Mitrosz K. Eye surgery in the elderly. Clin Interv Aging. 2016;11:407–414. doi:10.2147/CIA.S101835
18. Desai P, Reidy A, Minassian DC. Profile of patients presenting for cataract surgery in the UK: national data collection. Br J Ophthalmol. 1999;83:893–896. doi:10.1136/bjo.83.8.893
19. Madi HA, Keller J. Increasing frequency of hospital admissions for retinal detachment and vitreo-retinal surgery in England 2000–2018. Eye. 2022;36:1610–1614. doi:10.1038/s41433-021-01647-2
20. Yong GY, Mohamed-Noor J, Salowi MA, Adnan TH, Zahari M. Risk factors affecting cataract surgery outcome: the Malaysian cataract surgery registry. PLoS One. 2022;17:1–11. doi:10.1371/journal.pone.0274939
21. Appleby J. Day case surgery: a good news story for the NHS. BMJ. 2015;351:1–4.
22. Syed ZA, Moayedi J, Mohamedi M, et al. Cataract surgery outcomes at a UK independent sector treatment centre. Br J Ophthalmol. 2015;99:1460–1465. doi:10.1136/bjophthalmol-2014-306586
23. Sivasubramaniam V, Patel HC, Ozdemir BA, Papadopoulos MC. Trends in hospital admissions and surgical procedures for degenerative lumbar spine disease in England: a 15-year time-series study. BMJ open. 2015;5:1–7. doi:10.1136/bmjopen-2015-009011
 © 2023 The Author(s). This work is published and licensed by Dove Medical Press Limited. The full terms of this license are available at https://www.dovepress.com/terms.php and incorporate the Creative Commons Attribution - Non Commercial (unported, v3.0) License.
By accessing the work you hereby accept the Terms. Non-commercial uses of the work are permitted without any further permission from Dove Medical Press Limited, provided the work is properly attributed. For permission for commercial use of this work, please see paragraphs 4.2 and 5 of our Terms.
© 2023 The Author(s). This work is published and licensed by Dove Medical Press Limited. The full terms of this license are available at https://www.dovepress.com/terms.php and incorporate the Creative Commons Attribution - Non Commercial (unported, v3.0) License.
By accessing the work you hereby accept the Terms. Non-commercial uses of the work are permitted without any further permission from Dove Medical Press Limited, provided the work is properly attributed. For permission for commercial use of this work, please see paragraphs 4.2 and 5 of our Terms.