")
Back to Journals » Clinical, Cosmetic and Investigational Dentistry » Volume 7
Hard and soft tissue correlations in facial profiles: a canonical correlation study
Received 29 August 2014
Accepted for publication 6 November 2014
Published 12 January 2015 Volume 2015:7 Pages 9—15
DOI https://doi.org/10.2147/CCIDE.S73457
Checked for plagiarism Yes
Review by Single anonymous peer review
Peer reviewer comments 4
Editor who approved publication: Professor Christopher E. Okunseri
Manal A Shamlan,1 Abdullah M Aldrees2
1Faculty of Dentistry, King Abdulaziz University, Jeddah, 2Division of Orthodontics, Department of Pediatric Dentistry and Orthodontics, College of Dentistry, King Saud University, Riyadh, Saudi Arabia
Background: The purpose of this study was to analyze the relationship between facial hard and soft tissues in normal Saudi individuals by studying the canonical correlation between specific hard tissue landmarks and their corresponding soft tissue landmarks.
Methods: A retrospective, cross-sectional study was designed, with a sample size of 60 Saudi adults (30 males and 30 females) who had a class I skeletal and dental relationship and normal occlusion. Lateral cephalometric radiographs of the study sample were investigated using a series of 29 linear and angular measurements of hard and soft tissue features. The measurements were calculated electronically using Dolphin® software, and the data were analyzed using canonical correlation.
Results: Eighty-four percent of the variation in the soft tissue was explained by the variation in hard tissue.
Conclusion: The position of the upper and lower incisors and inclination of the lower incisors influence upper lip length and lower lip position. The inclination of the upper incisors is associated with lower lip length.
Keywords: facial profile, hard tissue, soft tissue, canonical correlation
Introduction
Cephalometric dentoskeletal analysis alone cannot predict the soft tissue outcome of treatment. In addition, the accurate initial position determination of the lips is essential for planning of proper treatment. Understanding the correlation between hard tissue and soft tissue before treatment is also important in order to predict the changes that may result from orthodontic intervention.
Placing the teeth according to accepted cephalometric criteria does not necessarily ensure that the overlying soft tissue will drape in a harmonious manner,1 or guarantee that the soft tissue profile will directly follow the underlying skeletal profile.2 This is because the soft tissue covering the teeth and bone can vary so greatly that the dentoskeletal pattern may be inadequate in evaluating facial disharmony.3 According to Kasai, the relationship between the hard tissue and soft tissue profile is variable because some soft tissue structures are closely related to hard tissue while others are influenced by their length, thickness, and function.4
Saxby and Freer found that the position of the upper and lower incisors and angulation of the upper incisors are very important determinants of the associated soft tissues.5 In a study by Sodagar et al, the ratio of maxillary incisor to upper lip retraction was 2:1, and in another study a significant correlation was found between the retraction of the lower incisors and the retrusion of the lower lip.6,7 These correlations have also been established for the incisors and the lips,8 and for alveolar bone landmarks and the overlying soft tissues.9
Lower facial height was also found to be an important determinant of soft tissue morphology. Kasai reported that longer lower facial height and protruding lower incisors were associated with a thicker upper lip,4 while Saxby and Freer found correlations between lower facial height and soft tissue form in the horizontal and vertical planes.5 Although the sagittal jaw relationship was found to be strongly related to the overlying soft tissue outline,5 soft tissue can mask or exaggerate the jaw discrepancy.10
Racial and ethnic characteristics were found to be another factor influencing the soft tissue configuration. Thin and minimal lip protrusion was found in white Europeans and more protrusion in those of Middle Eastern origin, while greater thickness and protrusion were found among Orientals and Africans.11 Several studies have indicated that there is a tendency for bimaxillary protrusion among the Saudi population with more lip protrusion than the Caucasian individuals.7,12–14 Facial soft tissue structure affects the perception of profile esthetics. African Americans prefer a straighter profile than what has been measured as normal for their race.15,16 More recently, Marques et al concluded that society perceives straight profiles as esthetically more pleasing in comparison with protruding profiles.17
Canonical correlation analysis is a powerful statistical technique that enables examination of multiple predictor and multiple criterion variables.18 It is useful in assessing relationships and summarizing dependence between two groups of variables.19,20 In the dental literature, canonical analysis has served as an instrument for obtaining new knowledge about how important factors interact with each other.4,18,20–24 When compared with multiple r-tests, simultaneous multivariate statistical methods are more robust.22 The present study evaluated the correlation between facial hard and soft tissues in Saudi adults utilizing canonical correlation analysis to provide a basis for normal hard and soft tissue correlation in this population.
Materials and methods
The study sample included 60 lateral cephalometric radiographs from Saudi adults (30 males and 30 females) with normal occlusion. The study sample radiographs were taken from the archive of cephalometric radiographs for fourth year dental students (mean age 22±1 years) that were taken as a part of their undergraduate orthodontic course requirements. Formal approval to conduct the study was obtained from the ethical subcommittee at King Saud University, College of Dentistry Research Center (#NF 2101).
The selection criteria included: Saudi citizenship, age over 18 years, average skeletal relationship with ANB angle ranging between 1-4.5° (based on the normal ANB angle range in Saudi individuals),25–28 with no previous orthodontic treatment, a class I molar relationship, overjet 2–4 mm, and overbite one third to one half of the lower incisor crown height.
A Perfection 4990 photo scanner (Seiko Epson Corporation, Nagano, Japan) linked to a DELL computer running on Microsoft Windows XP was used to scan the cephalometric radiographs, which were then captured using Dolphin Imaging® version 10.0 software (Dolphin Imaging and Management Solutions, Chatsworth, CA, USA). The landmarks and measurements used in the cephalometric analysis are presented in Figures 1–3. The soft tissue measurements included evaluation of the position of the upper and lower lips to different reference lines, and the upper and lower lip thickness and length, as follows:
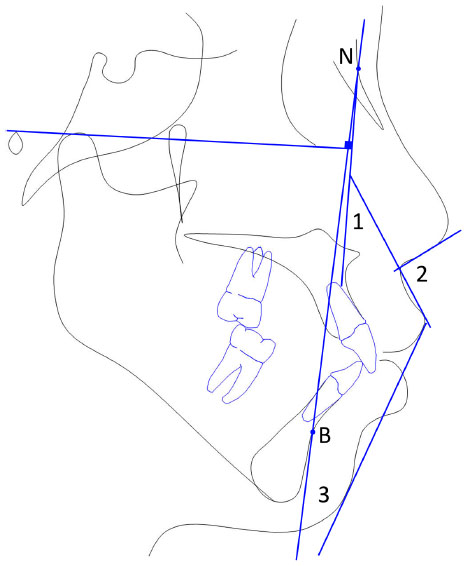 | Figure 1 Upper lip position. |
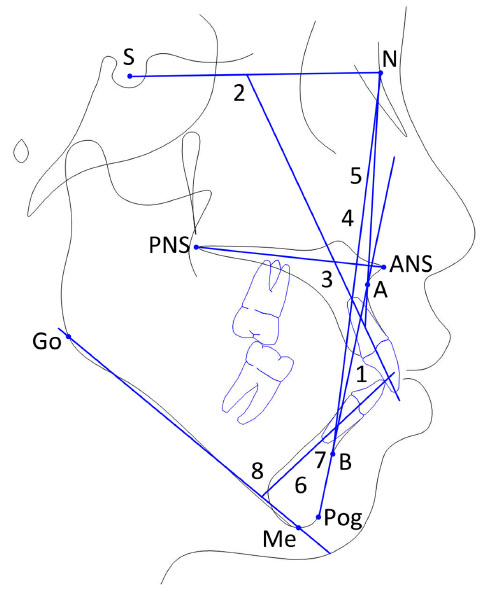 | Figure 2 Hard tissue variables. |
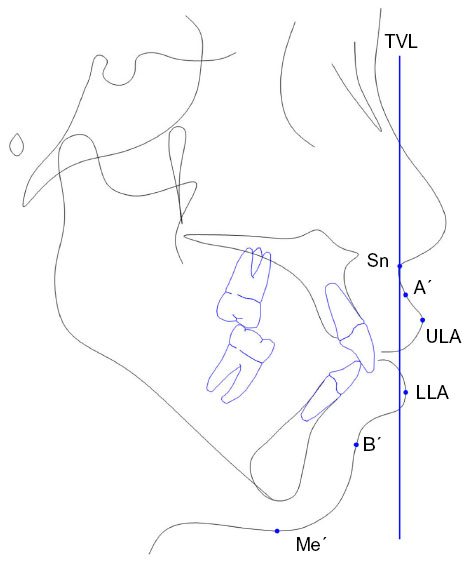 | Figure 3 Soft tissue projections from TVL. |
- The E-line extends from tip of the nose to soft tissue pogonion (Pog). UL-E is the distance from most anterior point of the upper lip to E-plane while the distance from the most anterior point of the lower lip to the E-plane is LL-E.
- The S-line extends from the soft tissue contour of the chin to the middle of an S formed by the lower border of the nose. The position of the upper and lower lips to this line was evaluated.
- The distances from the most anterior point of the upper and lower lips to the line connecting the soft tissue subnasale with soft tissue Pog were also measured.
- Upper and lower lip thickness represents the distance between the lip inside and the lip outside.
- The upper lip length extends from the subnasale to upper lip stomion superius point, while lower lip length extends from the lower lip stomion inferius to menton.
The data were analyzed using Statistical Package for the Social Sciences version 16 software (SPSS Inc., Chicago, IL, USA). An evaluation of the error of the method was carried out using the coefficient of reliability, while canonical correlation was used to evaluate the correlation between sets of hard and soft tissue variables. Canonical correlation evaluates the correlation of two canonical variables, one representing a set of independent variables and the other a set of dependent variables. In the present study, the following were the two sets:
- Set 1 (hard tissue variables) – U1-L1, U1-SN, U1-PP, U1-NA, U1-NA (mm), U1-APog, U1-APog (mm), L1-NB, L1-NB (mm), L1-APog, L1-APog (mm), L1-MP.
- Set 2 (soft tissue variables) – UL-SnPog′, LL-SnPog′, UL-E, LL-E, UL-S, LL-S, NLA, NB-H, Sn-ULI, LLS-Me, UL thickness, LL thickness, A′-TVL, ULA-TVL, LLA-TVL, B′-TVL, ULC.
Results
All variables in the 15 cephalometric radiographs were remeasured by one examiner (MS) to evaluate the error of the method. The coefficient of reliability was used to calculate the intraexaminer reliability. The values of the random errors for all landmarks were above 0.89. The means and standard deviations of the skeletal, dental, and soft tissue variables are listed in Table 1.
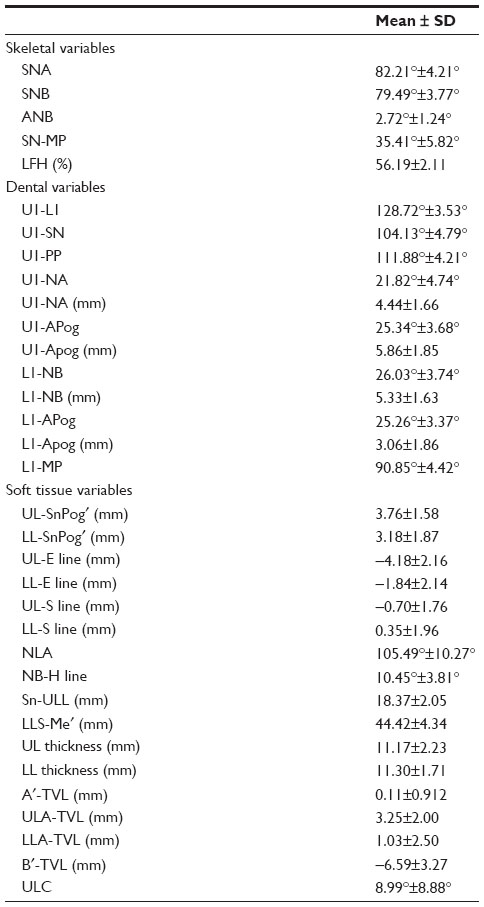 | Table 1 Means and standard deviations of the skeletal, dental, and soft tissue variables studied |
Table 2 shows the canonical correlation results, and indicates that the correlations ranged from 0.917 to 0.196. The first, second, and third correlations were found to be significant. The percentage of the squared value of the first, second, and third canonical variates was found to be 84%, 74%, and 67%, respectively.
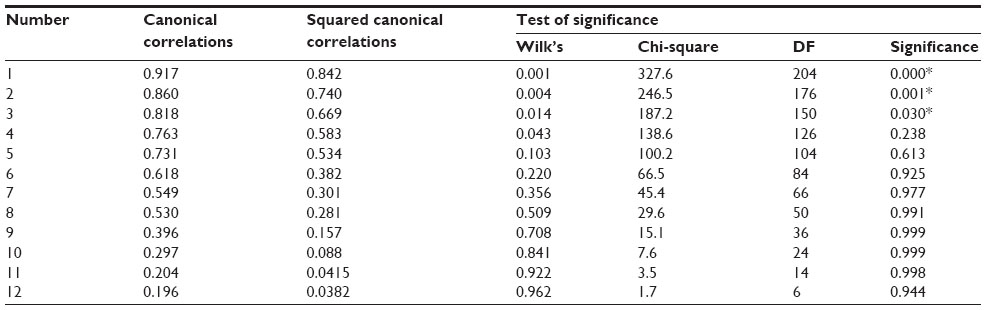 | Table 2 Canonical correlations and test of significance |
The loading and standardized canonical coefficients between set 1 (hard tissue variables) and set 2 (soft tissue variables) for the canonical variates are presented in Table 3. It was found that the first canonical variate for hard tissue variables has a heavy positive loading with U1-APog (mm; 0.966), L1-NB (mm; 0.887), and a moderate positive loading with L1-NB (0.627). The first canonical variate for soft tissue variables has a moderate positive loading with LL-E (0.756) and a moderate loading with Sn-ULI (0.459). The second canonical variate for set 1 is related to U1-NA (−0.706). In set 2, the second canonical variate is related to LLS-Me′ (−0.451).
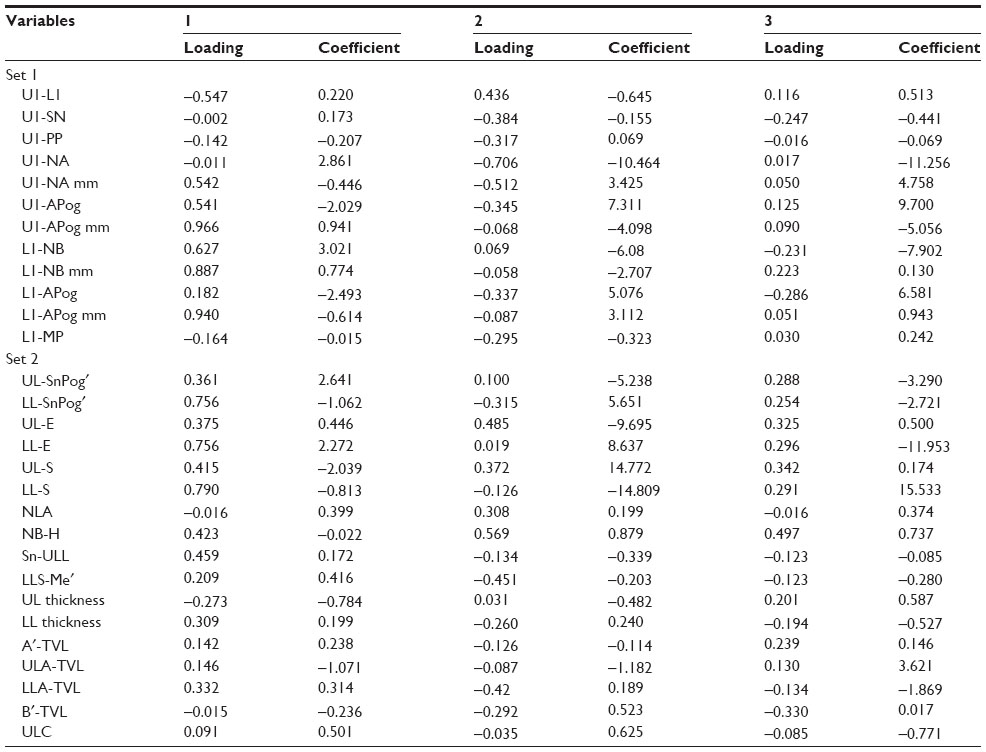 | Table 3 Loading and standardized canonical coefficients between set 1 and set 2 variables for the canonical variates |
Discussion
This retrospective study was designed to assess the correlation between hard and soft tissues in Saudi adults. The age of the subjects selected was over 18 years, as recommended by Subtelny and Sakuda to exclude the effect of growth.29 The cephalographs of the Saudi males and females were selected from the dental files of fourth year dental students; these are usually taken as part of their training in the preclinical orthodontic course.
The relationship between the soft tissue profile and the underlining hard tissue structure was evaluated by using canonical correlation analysis, which measures the strength of the overall relationships between the linear composites (canonical variates) of the independent and dependent variables. In general, the number of canonical dimensions (canonical variates) is equal to the number of variables in the smaller set; however, the number of significant dimensions may be even smaller.30 Canonical loadings are used as a basis for interpretation because of the deficiencies inherent in canonical weights. Canonical loadings, also called canonical structure correlations, measure the simple linear correlation between an original observed variable in the dependent or independent set and the set’s canonical variate. The larger the coefficient, the more important it is in deriving the canonical variate. The percentage of the squared canonical correlation of the first correlation in the study group indicated that 84% of the variation in soft tissue is explained by variation in hard tissue.
Analysis of this group of Saudi adults with normal occlusion showed that the variation in upper lip length and lower lip position could be explained by variation in the position of the upper incisors and the position and inclination of the lower incisors. Saxby and Freer detected a correlation between the upper and lower incisors horizontal position and the upper incisors angulation to lip position.5 The second squared canonical correlation of the control group indicated that 74% of the variation in soft tissue variables could be accounted for by variation in hard tissue variables. The lower lip length was associated with the inclination of the upper incisors in the present study. Figure 4 summarizes the canonical correlation in the study group.
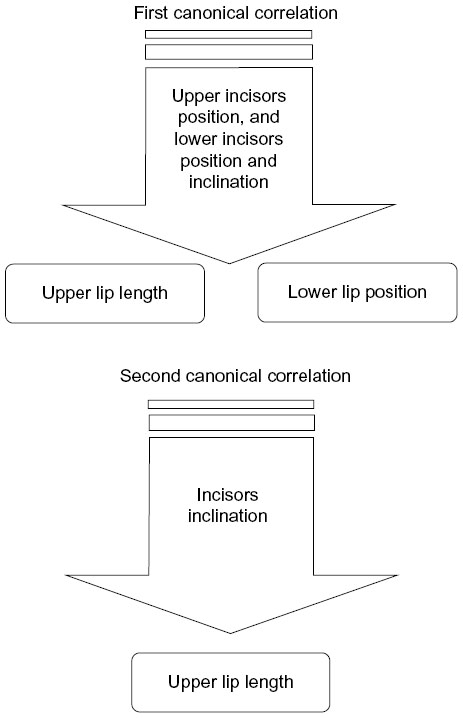 | Figure 4 Summary of results for the canonical correlation between hard tissues and soft tissues in normal Saudi adults. |
The current findings agree with those of Yogosawa, who found that the lower lip shortens about 80% of the amount of the maxillary incisors retraction while the upper lip shortens about 40% of that amount in patients with bimaxillary protrusion.31 In the same study, the influence of the maxillary incisors on lower lip position was detected. Kasai detected an association between the position of the lower incisors and upper lip thickness.4 The horizontal position of both lips was found also to be correlated with the position of the lower incisors by some researchers.32
Based on the previously described correlations, we can conclude that there is a correlation between hard tissue and soft tissue topography in normal Saudi individuals. Although many studies have focused on the importance of the teeth support on the upper lip, the present study shows that the upper and lower teeth influence the lower lip position. Clinically, these results emphasize the possible effects of extraction and nonextraction orthodontic treatment on the upper and lower lips. While retraction of the lips has been observed following retraction of the incisors to a variable degree, changes in upper and lower lip length are another outcome that warrants consideration by clinicians. In addition, this study specified dentoalveolar and soft tissue measurements that can demonstrate the correlation between hard and soft tissues. Among the 29 dentoalveolar and soft tissue variables studied, the current study identifies the seven most influential cephalometric measurements that can aid the clinician in diagnosis and assessment of posttreatment changes.
Conclusion
The position of the upper and lower incisors and inclination of the lower incisors influence upper lip length and lower lip position. The inclination of the upper incisors is associated with lower lip length.
Disclosure
The authors report no conflicts of interest in this work.
References
Oliver BM. The influence of lip thickness and strain on upper lip response to incisor retraction. Am J Orthod. 1982;82(2):141–149. | |
Subtelny JD. Longitudinal study of soft tissue facial structures and their profile characteristics define in relation to underlying skeletal structures. Am J Orthod. 1959;45:481–450. | |
Arnett GW, Bergman RT. Facial keys to orthodontic diagnosis and treatment planning. Part I. Am J Orthod Dentofacial Orthop. 1993;103(4):299–312. | |
Kasai K. Soft tissue adaptability to hard tissues in facial profiles. Am J Orthod Dentofacial Orthop. 1998;113(6):674–684. | |
Saxby PJ, Freer TJ. Dentoskeletal determinants of soft tissue morphology. Angle Orthod. 1985;55(2):147–154. | |
Sodagar A, Borujeni DG, Amini G. Prediction of soft tissue profile changes following orthodontic retraction of incisors in Iranian girls. World J Orthod. 2010;11(3):262–268. | |
Marsan G, Oztas E, Kuvat SV, Cura N, Emekli U. Changes in soft tissue profile after mandibular setback surgery in Class III subjects. Int J Oral Maxillofac Surg. 2009;38(3):236–240. | |
Khan M, Fida M. Soft tissue profile response in extraction versus non-extraction orthodontic treatment. J Coll Physicians Surg Pak. 2010; 20(7):454–459. | |
Sharma JN. Skeletal and soft tissue point A and B changes following orthodontic treatment of Nepalese Class I bimaxillary protrusive patients. Angle Orthod. 2010;80(1):91–96. | |
Whisth PJ. Soft tissue response to upper incisors retraction in boys. Br J Orthod. 1974;1:199–204. | |
Proffit WR, Fields HW, Sarver DM. Contemporary Orthodontics. 3rd ed. Saint Louis, MO, USA: Mosby, Inc.; 2006. | |
Al-Jasser NM. Facial esthetics in a selected Saudi population. Saudi Med J. 2003;24(9):1000–1005. | |
Hashim HA, AlBarakati SF. Cephalometric soft tissue profile analysis between two different ethnic groups: a comparative study. J Contemp Dent Pract. 2003;4(2):60–73. | |
Hassan AH. Cephalometric norms for Saudi adults living in the western region of Saudi Arabia. Angle Orthod. 2006;76(1):109–113. | |
Farrow AL, Zarrinnia K, Azizi K. Bimaxillary protrusion in black Americans – an esthetic evaluation and the treatment considerations. Am J Orthod Dentofacial Orthop. 1993;104(3):240–250. | |
Dawjee SM, Becker PJ, Hlongwa P. Is orthodontics an option in the management of bimaxillary protrusion? SADJ. 2010;65(9):404–408. | |
Marques LS, Chaves KC, Ramos-Jorge ML, Pereira LJ. Extraction of four premolars in Black patients with bi-protrusion: aesthetic perceptions of professionals and lay people. J Orthod. 2011;38(2):107–112. | |
Fogle LL, Glaros AG. Contributions of facial morphology, age, and gender to EMG activity under biting and resting conditions: a canonical correlation analysis. J Dent Res. 995;74(8):1496–1500. | |
Morrison DF. Multivariate Statistical Methods. New York, NY, USA: McGraw-Hill; 1976. | |
Takada K, Lowe AA, Freund VK. Canonical correlations between masticatory muscle orientation and dentoskeletal morphology in children. Am J Orthod. 1984;86(4):331–341. | |
Lupacheva NV. Orthodontic status and head morphology in young males. J Physiol Anthropol. 2007;26(3):387–402. | |
Gleerup A, Bjerklin K, Kurol J. Discriminant analysis in treatment evaluation of ectopic eruption of the maxillary first permanent molars. Eur J Orthod. 1995;17(4):281–291. | |
Lowe AA, Takada K, Yamagata Y, Sakuda M. Dentoskeletal and tongue soft-tissue correlates: a cephalometric analysis of rest position. Am J Orthod. 1985;88(4):333–341. | |
Lestrel PE, Takahashi O, Kanazawa E. A quantitative approach for measuring crowding in the dental arch: Fourier descriptors. Am J Orthod Dentofacial Orthop. 2004;125(6):716–725. | |
Shalhoub SY, Sarhan OA, Shaikh HS. Adult cephalometric norms for Saudi Arabians with a comparison of values for Saudi and North American Caucasians. Br J Orthod. 1987;14(4):273–279. | |
Al-Jasser NM. Cephalometric evaluation of craniofacial variation in normal Saudi population according to Steiner analysis. Saudi Med J. 2000;21:746–750. | |
Al-Jasser NM. Cephalometric evaluation for Saudi population using the Downs and Steiner analysis. J Contemp Dent Pract. 2005;6(2):52–63. | |
Al-Showial YM. Skeleto-dental features of anterior open bite in a Saudi sample: a cephalometric study. PhD Thesis; Riyadh, Saudi Arabia: College of Dentistry, King Saud University; 2000. | |
Subtelny JD, Sakuda M. Open bite: diagnosis and treatment. Am J Orthod. 1964;50:337–356. | |
Hardoon DR, Szedmak S, Shawe-Taylor J. Canonical correlation analysis; An overview with application to learning methods. Technical Report CSD-TR-03-02. London, UK: Computer Science Department, Royal Holloway, University of London; 2003. Available from: http://eprints.ecs.soton.ac.uk/9225. Accessed November 7, 2014. | |
Yogosawa F. Predicting soft tissue profile changes concurrent with orthodontic treatment. Angle Orthod. 1990;60(3):199–206. | |
Yasutomi H, Ioi H, Nakata S, Nakasima A, Counts AL. Effects of retraction of anterior teeth on horizontal and vertical lip positions in Japanese adult with the bimaxillary dentoalveolar protrusion. Orthod Waves. 2006;65:141–147. |
 © 2015 The Author(s). This work is published and licensed by Dove Medical Press Limited. The full terms of this license are available at https://www.dovepress.com/terms.php and incorporate the Creative Commons Attribution - Non Commercial (unported, v3.0) License.
By accessing the work you hereby accept the Terms. Non-commercial uses of the work are permitted without any further permission from Dove Medical Press Limited, provided the work is properly attributed. For permission for commercial use of this work, please see paragraphs 4.2 and 5 of our Terms.
© 2015 The Author(s). This work is published and licensed by Dove Medical Press Limited. The full terms of this license are available at https://www.dovepress.com/terms.php and incorporate the Creative Commons Attribution - Non Commercial (unported, v3.0) License.
By accessing the work you hereby accept the Terms. Non-commercial uses of the work are permitted without any further permission from Dove Medical Press Limited, provided the work is properly attributed. For permission for commercial use of this work, please see paragraphs 4.2 and 5 of our Terms.