")
Back to Journals » Biologics: Targets and Therapy » Volume 18
Gene Expression, Morphology, and Electrophysiology During the Dynamic Development of Human Induced Pluripotent Stem Cell-Derived Atrial- and Ventricular-Like Cardiomyocytes
Authors Zhou Y, Zhou R, Huang W, Wang J, Jiang C, Li A, Huang CLH, Zhang Y
Received 17 November 2023
Accepted for publication 23 April 2024
Published 10 May 2024 Volume 2024:18 Pages 115—127
DOI https://doi.org/10.2147/BTT.S448054
Checked for plagiarism Yes
Review by Single anonymous peer review
Peer reviewer comments 2
Editor who approved publication: Professor Shein-Chung Chow
Yafei Zhou,1,2 Rui Zhou,1,2 Wenjun Huang,1,2 Jie Wang,1,2 Congshan Jiang,1,2 Anmao Li,1,2 Christopher LH Huang,3 Yanmin Zhang1,2,4
1Key Laboratory of Precision Medicine to Pediatric Diseases of Shaanxi Province, Affiliated Children’s Hospital of Xi’an Jiaotong University, Xi’an, Shaanxi, People’s Republic of China; 2Shaanxi Institute for Pediatric Diseases, Affiliate Children’s Hospital of Xi’an Jiaotong University, Xi’an, Shaanxi, People’s Republic of China; 3Physiological Laboratory, University of Cambridge, Cambridge, UK; 4Department of Cardiology, Xi’an Children’s Hospital, Affiliated Children’s Hospital of Xi’an Jiaotong University, Xi’an, Shaanxi, People’s Republic of China
Correspondence: Yanmin Zhang, Key Laboratory of Precision Medicine to Pediatric Diseases of Shaanxi Province, Affiliate Children’s Hospital of Xi’an Jiaotong University, No. 69 Xi Ju Yuan Xiang, Xi’an, Shaanxi, 710000, People’s Republic of China, Tel +86 029-87692527, Fax +86 029-87692000, Email [email protected]
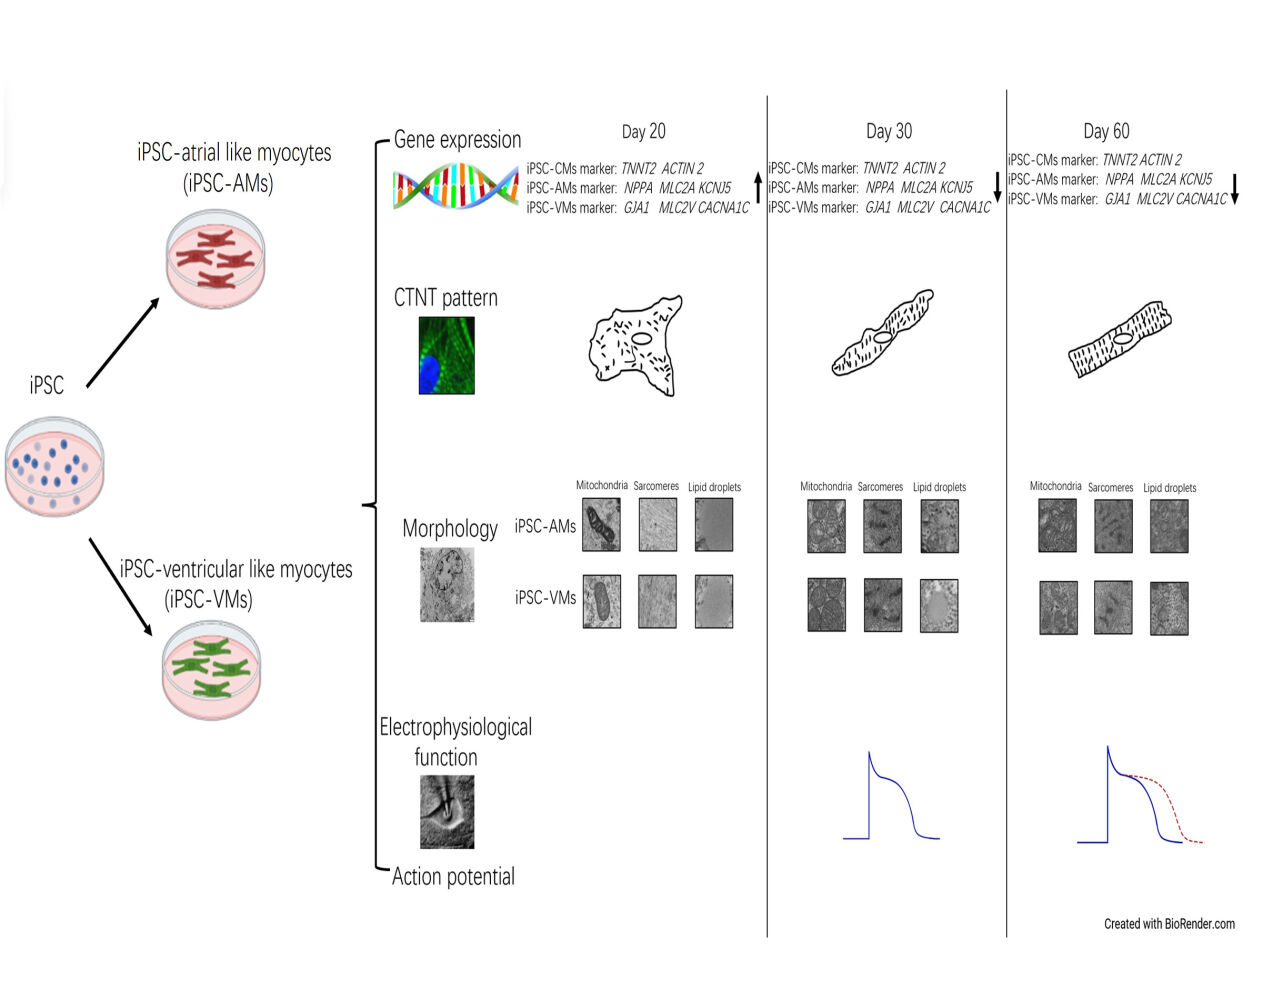
Background and Objectives: Gene expression, morphology, and electrophysiological combination are essential for assessing the dynamic development of human induced pluripotent stem cell-derived atrial- and ventricular-like cardiomyocytes (iPS-AM and iPS-VM, respectively).
Methods: For iPS-AM/VM differentiation, we performed the small molecule-based temporal modulation of the retinoic acid and bone morphogenetic protein signaling pathways. We investigated the gene expression and morphology using immunofluorescence, quantitative real-time polymerase chain reaction, flow cytometry, and transmission electron microscopy as well as registered electrophysiological functions using a whole-cell patch clamp on days 20, 30, and 60 post-differentiations.
Results: Pan-cardiomyocyte marker, including troponin T2 (TNNT2) and alpha-actinin-2 (ACTN2), expressions increased both in iPS-AMs and iPS-VMs. Similarly, the mRNA expression of both iPS-AM-specific markers, ie, natriuretic peptide A (NPPA), myosin light chain 7 (MYL7), and K+ channel Kir3.4 (KCNJ5), and iPS-VM-specific markers, ie, gap junction α-1 (GJA1), myosin light chain 2 (MYL2), and alpha-1-subunit of a voltage-dependent L-type calcium channel (CACNA1C), increased from 0 to 20 days, and then decreased from 30 to 60 days. Concerning morphology, cardiac troponin-T (cTnT) arrangement was progressively organized and developed from a disorderly myofibrillar distribution to an organized sarcomere pattern both in iPS-AMs and iPS-VMs. Mitochondrial numbers gradually increased and those of lipid droplets decreased during dynamic development. Regarding physiological function, the resting and action potential amplitudes remained statistically indifferent in both cell types, and the action potential duration was prolonged during the development.
Conclusion: IPS-AMs/VMs displayed dynamic development concerning their gene expression, morphology, and electrophysiological function. The discoveries of this study could provide novel insights into heart development and encourage further research.
Keywords: cardiomyocytes, induced pluripotent stem cells, dynamic development, gene expression, morphology, action potential
Graphical Abstract:
Introduction
The advent of the induced pluripotent stem cell (iPSC) technology and accurate iPSC differentiation methods to produce iPSC-derived cardiomyocytes (iPS-CMs), in vitro models for human development, significantly facilitated human heart development research.1 IPS-CMs carry personalized genetic information with intact physiological functions and are widely used in fundamental studies in various fields from cellular biochemistry to electrophysiology.2 Importantly, iPS-CMs display the capacity to mature upon integration into the host myocardium, as recently described in the case of embryonic stem cell-derived cardiomyocytes,3,4 thereby conferring advantages in therapeutic applications. However, iPS-CMs are structurally and functionally immature, resembling neonatal cardiomyocytes,5 limiting their application potential.6,7 In regenerative medicine, the iPS-CM maturity degree is a major bottleneck. For example, excitation-contraction coupling and efficient energy conversion (requiring transverse tubules (T-tubules) and oxidative metabolism, respectively) are unavailable in immature iPS-CMs.7–9 Various artificial interventions, eg, electrical stimulation, fatty acid addition,10,11 and culture time prolongation,5,10 have been established to promote iPS-CM maturity.
The phenotypic discrimination of the generated iPS-AMs and iPS-VMs could rely on various aspects, such as gene expression, morphology, and electrophysiological function.12 The natriuretic peptide precursor A (NPPA) gene, encodes the atrial natriuretic peptide (ANP) hormone. NPPA is primarily expressed in the atria of the heart and is released in response to increased blood volume or pressure.13 The GJA1 gene encodes connexin 43, which is involved in the development of ventricular structure and organization as well as ventricular cardiomyocyte differentiation and ventricular myocardium formation.14 Characterizing the dynamic changes of these regulators is pivotal for distinguishing cardiac subtype specifications.15 Various methods have been established to guide iPSC differentiation toward the desired cardiomyocyte subtypes.15,16
During cardiac maturation, iPS-AMs and iPS-VMs undergo development involving both mRNA transcriptional activation and structural changes, such as more aligned sarcomere formation and mature electrophysiological function establishment.17 The significant structural rearrangements during the dynamic differentiation stages could be visually classified using image-based analysis.8 IPS-CMs at approximately 14–20 days are reportedly small, round to slightly oblong, and are approximately 5–10 μm in diameter.7,18 Beyond 35 days, iPS-CMs acquire a more oblong morphology (30 × 10 μm) with dimensions similar to those of human embryonic CM, although they remain below the adult size.16 PSC differentiation toward the cardiomyocyte lineage could be planned by the sequential expression of different genes (such as MYL2, MYL7, ACTIN, and TNNT2) at specific stages, in a pattern consistent with physiological cardiac development. These genes are crucial for cardiomyocyte structure and function. The proteins they encode (eg, actin, myosin, and troponin) are crucial for cardiomyocyte contraction and relaxation.18–20 The GJA1 gene, which encodes connexin 43, is important in the development of ventricular structure and organization, and it is involved in ventricular cardiomyocyte differentiation and ventricular myocardium formation.14 Ion channel isoform shifts were measured using transcriptomics, and ion channel-coding gene transcriptional expression levels increased in iPS-CMs compared with those in iPSCs.21 KCNJ5 (potassium inwardly-rectifying channel, subfamily J, member 5) is an important gene that encodes the Kir3.4 subunit of the G protein-activated inward rectifier potassium channel, which is crucial for the regulation of cardiomyocyte excitability and repolarization in atrial myocytes. The KCNJ5 gene is involved in various cardiac arrhythmia-related pathogeneses, such as atrial fibrillation.7 CACNA1C encodes the alpha-1C subunit of the voltage-dependent L-type calcium channel, being central to the regulation of cardiomyocyte excitability, contraction, and intracellular calcium homeostasis, particularly in ventricular myocytes. The CACNA1C gene is involved in the pathogenesis of various cardiac arrhythmias, such as that of Timothy syndrome.2 Furthermore, mature cardiomyocytes harness elaborate mechanisms to achieve efficient coordinated excitation-contraction coupling. The electrophysiological properties of iPS-CMs include action potential (AP)- and ion channel current-related changes. These characteristics vary among various stages of iPS-CM development, such as changes in the resting action potential (RMP) and action potential duration (APD).22,23 However, the simultaneous application of these techniques within the same study is rare as researchers often focus on a single aspect to assess iPS-CM development instead of combining them with more holistic approaches.
To the best of our knowledge, neither a comprehensive characterization concerning the aforementioned dynamic changes nor a direct comparison of iPS-AMs and iPS-VMs has been performed so far.24 In this study, we thus aimed at investigating the dynamic development of iPS-AMs and iPS-VMs. The combined application of impressive morphology, gene expression transformation, and electrophysiological function could result in clearer and more meaningful descriptions of cell development than the separate use of these approaches. Nevertheless, our study provides valuable information for future cardiomyocyte maturation research.
Methods
iPSC Culture
In this study, we used LHpb-YaabC3 iPSCs (HNFP30-P11, OSINGLAY BIO, China, link of the webpage: https://www.bio-equip.com/show1equip.asp?equipid=4276461). We coated the dishes with MatrigelTM (Cat#354,277, Corning, UK) feeder-free plates in DMEM/F12 medium (Cat#11,320,082, Thermo Fisher Scientific, USA) at 1:50 dilution. We cultured the iPSCs in fresh mTeSRTM1 medium and its supplements (Cat#85,850, STEMCELLTM Technologies, USA) every day and passaged them routinely using Accutase (Cat#7920, Gibco, USA) at 80% confluence with 5 mM ROCK inhibitor Y27632 (Cat#1254, Tocris Bioscience, UK). We maintained the cell cultures in an incubator at 37°C under 5% CO2. This study was approved by the Human Research Ethics Committee of Xi’an Jiaotong University (No.2019–599).
iPSC-Derived Cardiomyocyte Differentiation
Prior to differentiation, we seeded iPSCs onto Matrigel-coated plates and resuspended them at 80–90% of confluency in mTeSRTM1 medium at 5×10⁴ cells/mL. We seeded 1 mL of the cell suspension per well in a Matrigel-coated 12-well plate, supplemented with 1 mL of iPSC medium on day 4.
We used the standard protocol for restricting retinoic acid (RA) signaling with small-molecule drugs for iPS-AM differentiation.15 Briefly, we treated the cells with 25 ng/mL bone morphogenetic protein-4 (BMP4, Cat#120-05ET, PEPROTECH, USA) and 6 ng/mL b-fibroblast growth factor (Cat#SRP4037, SIGMA, USA) on day 1, 100 ng/mL activin A on day 2, and 200 ng/mL dickkopf homolog 1 (DKK1, Cat#O94907, Feiyue, China) between days 6–11. We changed the medium every three days after day 11 with the addition of 1 µM RA, (Cat#302-79-4, Sigma, Japan). We typically observed spontaneous contracting clusters on days 10 and 11. We selected iPS-AMs on days 20, 30, and 60 for analysis.
Between days 0–2, we supplemented the medium with 6 µM CHIR99021 (Cat#2372S1263, Sigma, USA) in RPMI/B-27 (Cat#17,504-044, Thermo Fisher Scientific, USA). On day 3, we replaced the medium with RPMI/B-27 containing the 5 µM IWP2 (Wnt processing inhibitor, Cat#3533, Tocris Bioscience, UK). Next, we replaced this medium with RPMI/B-27 without insulin for days 5–7. We observed contracting cells on days 7–1016 and selected iPS-VMs for analysis on days 20, 30, and 60.
Flow Cytometry
At passage 40, we validated iPSC purity based on TRA-1-60 and NANOG protein expression. We submitted the iPSCs to Accutase digestion in 6-cm plates for approximately 2.5 min at 37°C to obtain a single-cell suspension, which we washed with PBS. Next, we fixed the cells with 4% formaldehyde for 15 min at room temperature and chilled them on ice for 1 min, followed by permeabilization with 0.1% Triton X-100 for 30 min and resuspension in anti-TRA-1-60 (Cat#2372 54,746, Cell Signaling Technology, USA) and anti-NANOG (Cat#3580, Cell Signaling Technology, USA) primary antibodies. We then washed the cells with Dulbecco’s Phosphate-Buffered Saline (DPBS, Cat#21,600,010, Invitrogen, USA), followed by incubation with the corresponding species-specific fluorescence-conjugated Alexa Fluor 488-labeled goat anti-mouse IgG secondary antibody (Cat#2372A-11029, Invitrogen, USA). We performed each step at room temperature, followed by washing with DPBS. We analyzed the positively stained cells using a flow cytometer (Cat#651,155, BD FACS Verse, BD Bioscience, USA) according to the manufacturer’s protocol and performed the flow cytometry experiment and data analysis using Attune CytPix (Invitrogen, USA) and FlowJo_v10.9.0 (Flowserve, USA).
qRT-PCR
We extracted total RNA from 0.5–1 × 10⁶ cells with TRIzol (Cat#15,596-026, ThermoFisher, USA) and used it for cDNA reverse transcription using the commercial 5 × PrimeScript RT Master Mix (Cat#2372RR036A-1, Takara, Japan) with cycling conditions as follows: 37°C for 15 min, 50°C for 5 min, and 98°C for 5 min. Subsequently, we qRT-PCR-quantified the TNNT2, ACTN2, NPPA, MYL7, KCNJ5, GJA1, MYL2, and CACNA1C expression levels in iPS-Ams and iPS-VMs using 2 × TB Green Faster qPCR Mix (Cat#2372RR430, TaKaRa, Japan) with cycling conditions as follows: 95°C for 10s, 52°C for 10s, and 72°C for 10s for 40 cycles. Table 1 summarizes the primer pairs we used in this study. We normalized the mRNA expression levels to those of GAPDH, performed the calculations using the 2−ΔΔCt formula, and analyzed the data using GraphPad Prism (GraphPad Software, USA).
 |
Table 1 Primer Sets for qRT-PCR Analysis |
Immunostaining and Image Analysis
We washed iPSCs, iPS-AMs, and iPS-VMs thrice with precooled DPBS, then fixed, permeabilized, and blocked them with 4% PFA for 15 min, 0.5% Triton X-100 (Cat#2372A600198-0500, BBI, China) for 15 min, and 2% BSA (Cat#2372A600332-0025, BBI, China) in DPBS for 60 min, respectively, at room temperature. Next, we incubated the cells overnight at 4°C with rabbit anti-cTnT (Cat#15,513-1-AP, Proteintech, USA) and mouse anti-NPPA (Cat#2372PP-H7147-00, R&D Systems, USA) primary antibodies, diluted at 1:200 with 1% BSA. After washing thrice with DPBS, we incubated the cells for 1 h at room temperature in the dark with Alexa Fluor 488-labeled goat anti-rabbit (Cat#2372A11070, Invitrogen, USA) and Alexa Fluor 555-conjugated goat anti-mouse (Cat#2372A21425, Invitrogen, USA) secondary antibodies, diluted at 1:500 in DPBS. After counterstaining with DAPI (Cat#2372D1306, Thermo Fisher, USA) for 10 min, we acquired fluorescence images (OLYMPUS FLUOVIEW, FV3000, Japan) and analyzed them using ImageJ (Rawak Software, Germany).
Transmission Electron Microscopy (TEM)
We fixed iPS-AMs and iPS-VMs with 3% glutaraldehyde (Cat#111-30-8, SIGMA, USA) followed by 2% osmium tetroxide (Cat#20,816-12-0, SIGMA, USA), dehydrated the samples in graded ethanol series, and embedded them in epoxy resin. We performed ultrathin sectioning, stained the sample sections with uranyl acetate and lead citrate, and observed the samples under a transmission electron microscope (JEM-1400FLASH, Japan).
Patch-Clamp Experiments
We dispersed the iPS-AMs and iPS-VMs on days 30 and 60 using collagenase I for 35 min, washed them with DPBS, then treated them with trypsin-EDTA (Cat#T4049, SIGMA, USA) for 3 min to dissociate the cells, which we then reseeded at a density of 1:50 onto Matrigel-coated glass coverslips and cultured for 2–3 days. For AP recordings, we applied the whole-cell patch-clamp technique using a Multiclamp 700 B amplifier (Axon Instruments, USA). The access resistance was typically ~ 3–5 MΩ after patch rupture. The APs were continuously elicited by square current pulses of 0.8–1-nA amplitude and 1–5-ms duration at a frequency of 1 Hz. First, we dissociated the iPS-AMs and iPS-VMs into single-cell suspensions by type I collagenase (2 mg/mL) (Cat#SCR103, SIGMA, USA) treatment for 30 min, followed by a 3-min treatment of trypsin (0.25%) without EDTA (Cat#03-052-1A/B, Biological Industries, Israel). Next, we plated the cells onto 13-mm glass coverslips and performed current recording 48–72 h later. For the AP recording, we used the bath solution as follows:140 mM NaCl, 1 mM MgCl2, 5 mM KCl, 1.8 mM CaCl2, 5 mM 4-(2-hydroxyethyl)-1-piperazineethanesulfonic acid (HEPES), and 10 mM glucose (pH 7.40). The pipette solution comprised 110 mM K-gluconate, 20 mM KCl, 1 mM CaCl2, 1 mM MgCl2, 10 mM HEPES, 5mM ethylene glycol tetraacetic acid potassium chloride (EGTA-KOH), 5 mM ATP-Mg2+, and 5 mM sodium phosphocreatine. We adjusted the pH to 7.2 using KOH. We performed all experiments at 34°C ± 1°C and assessed the action potential amplitude (APA), APD, and resetting potential (RP) in the different groups.
Statistical Analysis
The data are expressed as the mean ± standard error of the mean (SEM). We used one-way ANOVA for comparisons between multiple groups and considered P-values of P < 0.05 statistically significant.
Results
iPSC Pluripotency Markers Characterization
We validated the molecular iPSC pluripotency markers using flow cytometry and IF. At passage 45, our IF results revealed that the iPSC clones positively expressed PAX6, BRA, and AFP proteins, displaying directed ectodermal, mesodermal, and endodermal differentiation potential (Figure 1A). NANOG and OCT4 were localized in the nuclei and TRA1-60 in the plasma membrane (Figure 1B and C). The TRA-1-60+ and NANOG+ cell percentages were 95.28% and 96.56%, respectively (Figure 1D).
 |
Figure 1 iPSC characterization. (A) (I) Representative image of iPSCs. Scale bar: 100 μm; A(II–IV), immunofluorescence (IF) results of PAX6 (ectoderm marker), BRA (mesoderm marker), and AFP (endoderm marker); Scale bar: 50 μm; (B). iPSC pluripotency markers (I, DAPI; II, NANOG; III, TRA-1-60; IV, merge of I–III); (C). The iPSC pluripotency markers (I, DAPI; II, OCT4; III, TRA-1-60; IV, merge of I–III) were confirmed by the IF assay. Scale bars: 50 μm; (D). Representative flow cytometry analysis of iPSCs. (D) (I), isotype control of TRA-1-60; (II), TRA-1-60-positive cells were 95.28%; (III), isotype control of NANOG; (IV), NANOG-positive cells were 96.56%. |
Dynamic Expression of Cardiomyocyte-Specific Genes
The iPS-AMs and iPS-VMs started to contract for approximately 7–10 days. By day 20, approximately 70–90% of the cardiomyocytes were contracting. We used undifferentiated iPS cells as a control for our qPCR. The mRNA expressions of cardiomyocyte-specific genes TNNT2 (encoding human muscle type-specific TnT protein) and ACTN2 (encoding cmd1aa protein) significantly increased in iPS-AMs and iPS-VMs on day 20 post-differentiation compared with those in iPSCs (Figure 2A and B). The mRNA expression of atria-specific marker genes, including NPPA (encoding ANP protein), MYL7 (encoding mylc2a protein), and KCNJ5 (encoding Kir3.4 protein), significantly increased from day 0 to 20, then decreased from day 30 to 60 in the iPS-AMs (Figure 2C–E). Finally, the mRNA expression of ventricular cardiomyocyte marker genes, including GJA1, MYL2, and CACNA1C,17,24 markedly increased from day 0 to 20, although we observed a reduction on days 30 and 60 (Figure 2F–H).
 |
Figure 2 Dynamic changes in cardiomyocyte-specific gene expression in iPS-AMs and iPS-VMs. (A and B). Relative TNNT 2 and ACTN2 mRNA expression in atrial- and ventricular-like myocytes (iPS-AMs and iPS-VMs) compared with the control. *P < 0.05 and **P < 0.01, n=4. The data represent the mean fold change ± SEM, One-way ANOVA. (C–E). Relative mRNA expression of atrium-specific genes including NPPA, MYL7, and KCNJ5. *** P < 0.001, Day 20 compared with the control; ## P < 0.01; days 30 and 60 compared with day 20, ### P < 0.001, days 30 compared with day 20, n = 4. The data represent the mean fold change ± SEM, One-way ANOVA. F–H. Relative mRNA expression of ventricular-specific genes including GJA1, MYL2, and CACNA1C. *** P < 0.001. Day 20 compared with the control; # P < 0.05, ## P < 0.01, and ### P < 0.001, days 30 and 60 compared with day 20, n = 4. The data represent the mean fold change ± SEM, One-way ANOVA. |
Dynamic Location and Arrangement Patterns of NPPA and cTnT
Cardiomyocyte morphology is functionally significant for cell structure and contraction. Our IF results demonstrated that NPPA protein expression increased over time in atrial myocytes (Figure 3A–C (II) and I). In contrast, we could not detect any NPPA protein expression in iPS-VMs (Figure 3D–F (II)).
 |
Figure 3 NPPA and cTnT protein location and arrangement in iPS-AMs and iPS-VMs. (A–F). Immunofluorescence results of NPPA, cTnT, and DAPI in iPS-AMs (A–C, I–IV) and iPS-VMs (D–F, I–IV) from day 20 to 60. G–H. Representative and quantitative iPS-AM (G) and iPS-VM (H) data of the cTnT pattern area organization. I. Fluorescence intensity 3D waterfall figure of NPPA in iPS-AMs from day 20 to 60. Scale bars: 100 μm. |
Specific cardiac troponin-T protein (cTnT) arrangement (ie, that of a representative pan-cardiomyocyte marker) is key in promoting iPS-CM contraction and energy exchange as well as in providing a framework for crucial protein distribution, such as that of voltage-gated L-type Ca2+ channels (LTCC) and sodium-calcium exchangers.25 Next, we thus analyzed the cTnT striated pattern distribution and number in iPS-AMs and iPS-VMs (Figure 3). We observed a cTnT expression pattern organization, which indicated dynamic development (Figure 3A–C (III)). Our data demonstrated that striated cTnT pattern areas covered 2000, approximately 2000–4000, and 6000 μm2 on days 20, 30, and 60, respectively (Figure 3G). The number of striated structures increased over time (n = 12, 23, and 47 on days 20, 30, and 60, respectively). On day 20, the cTnT distribution arrangement was disordered and indistinct in the iPS-VMs (Figure 3D (III)). The striated cTnT pattern areas covered 1500 μm2 approximately and the striated area number was 12. The culture time extension to 30 and 60 days yielded 2000–4000-μm2 organized striated cTnT pattern areas (Figure 3E and F (III)). The striated area numbers reached 36 and 43 on days 30 and 60, respectively.
Ultrastructural Development of iPS-AMs and iPS-VMs
To optimize the potential iPS-CM applications in cardiovascular research, the accurate replication of adult cardiomyocyte ultrastructural characteristics is imperative. Early-stage iPS-CMs exhibit a diminutive morphology and an immature ultrastructure closely resembling that of fetal CMs. However, prolonged culture yields significant enhancements in myofibril alignment, density, and morphology with mature-like Z-disc, A-band, I-band, and H-zone appearance.1,5 In addition, ultrastructural iPS-CM features appeared approximately 30 days after cardiac differentiation in a previous study.26 We performed the TEM analysis of both iPS-AMs and iPS-VMs on days 20, 30, and 60 and discovered a dynamic development over time. The endoplasmic reticulum (ER) and mitochondria formed around the nucleus randomly and became denser with increasing culture time (Figure 4A and B, yellow and red arrows, respectively). In iPS-AMs, the number of mitochondria was 13 on day 20 and it was visually similar on days 30 and 60 (both n = 37) with random and irregular mitochondrial sizes (Figure 4C and D). We observed multiple free ribosomes throughout the cytoplasm on days 20 and 30, certain of which were arranged in a uniform spotty distribution on day 60, suggesting active protein synthesis (Figure 4A and B, green arrows).
 |
Figure 4 Morphological development of cardiac ultrastructure, bioenergetics, and microfilament structure formation in iPS-AMs and iPS-VMs. (A and B). Transmission electron microscopy of iPS-AMs (A) and iPS-VMs (B) on days 20 (I), 30 (II), and 60 (III). Red arrows: mitochondria, blue arrows: microfilament and sarcomeres-like structure, Orange arrows: lipid droplets, yellow arrows: endoplasmic reticulum, green arrows: glycogen, and purple arrows: autophagy. Scale bars, 1 µm. (C-D). Mitochondrial area dynamic changes in iPS-AMs (C) and iPS-VMs (D) from day 20 to 60. E and F. Sarcomere-like structure area in iPS-AMs (E) and iPS-VMs (F) from day 20 to 60. G and H. Lipid droplet-like areas in iPS-AMs (G) and iPS-VMs (H) from day 20 to 60. The results of the experiment were analyzed by selecting three different fields of view from one experiment. |
On day 20, a few delicate myofibrils exhibited aligned or organized sarcomere patterns in the cells. Moreover, the myofibrils appeared disoriented throughout the cytoplasm (Figure 4A and B I, blue arrows). On day 30, the sarcomere number significantly increased compared with that on days 20 (iPS-Ams and iPS-VMs, n = 16 and 15 vs none, respectively). The sarcomere-like pattern number increased with time (Figure 4E and F). In iPS-AMs, we observed 16 and 28 sarcomere-like patterns, while in iPS-VMs, we registered 15 and 25 on days 30 and 60, respectively. The sarcomere areas changed inconspicuously, although their arrangement was regular on day 60 compared with those on day 30 in iPS-AMs and iPS-VMs (Figure 4A and B, blue arrows).
Autophagy appeared through dynamic development (Figure 4A and B, purple arrows), suggesting lysosomal activity and participation in cell growth and development. Lipid droplets (LDs) are intracellular organelles that store energy in the form of neutral lipids, growing through local synthesis upon formation during dynamic maturation.27 LDs are then delivered for autophagy or used for mitochondrial energy production.28 LDs (orange arrows) displayed clear outlines and extended areas in the iPS-AMs and iPS-VMs on day 20, illustrating the lack of their absorption or use (Figure 4A and B I, G and H). LDs were absorbed by other organelles on days 30 and 60, and the LD number and area decreased after day 20 (Figure 4A and B II and III, and G and H). Our results revealed that the assembly of highly dynamic organelles characteristic of LDs involved multiple steps, occurring in several organelles (eg, the ER).28
Dynamic Electrophysiological Function of iPS-AMs and iPS-VMs
Electrophysiological function recording is essential for assessing cardiomyocyte development.24 A previous study described that iPSC-derived cardiomyocytes were immature to exhibit classical electrophysiological characteristics on days 18–20.5,7,29 We recorded the AP of iPS-AMs and iPS-VMs on days 30 and 60 using whole-cell patch clamp and summarized the statistics in Table 2. The iPS-AM RP on days 30 and 60 were −68.7 ± 4.43 mV and −77.31 ± 2.37 mV, respectively (n = 4). The APA on days 30 and 60 were 118.1 ± 5.03 mV and 123.8 ± 8.69 mV, respectively (n = 4), with no statistically significant difference between the two groups (Figure 5A–C). The AP duration at 90%, 70%, and 50% repolarization (APD90, APD70, and APD50, respectively) indicated that APD on day 60 was prolonged than that on day 30 (APD90: 168.60 ± 20.75 ms on day 60 vs 73.84 ± 12.19 ms on day 30; APD70: 80.00 ± 17.12 ms on day 60 vs 32.97 ± 6.03 ms on day 30; APD50: 44.25 ± 16.79 ms on day 60 vs 16.12 ± 4.13 ms on day 30, n = 4 in all cases) (Figure 5D–F).
 |
Table 2 The Dynamic Electrophysiological Function of iPS-AMs and iPS-VMs |
 |
Figure 5 Action potential of iPS-AMs. (A). The original curve of the action potential of iPS-AMs recorded using whole-cell patch clamp with 1 Hz stimulation. B–F. RP (B), APA (C), APD90 (D), APD70 (E), and APD50 (F) of iPS-AMs on days 30 and 60. The data represent the mean fold change ± SEM, n = 4, * P < 0.05, day 60 vs day 30; ** P < 0.01, day 60 vs day 30. |
The RP of iPS-VMs were-78.48 ± 2.36 mV and −70.51 ± 2.96 mV while their APA were 122.10 ± 8.06 mV and 121.8 ± 15.86 mV on days 30 and 60, respectively (n = 4 for both groups). We observed no statistical difference between the two time points for RP and APA in iPS-VMs (Figure 6A–C). APD90 was significantly longer on day 60 than that on day 30 (259.2 ± 27.28 ms vs 128.3 ± 18.02 ms, **P < 0.01, n = 4), while APD70 (153.70 ± 15.55 ms vs 70.51 ± 10.51 ms, **P < 0.01, n = 4) and APD50 (120.40 ± 15.33 ms vs 42.21 ± 4.25 ms, **P < 0.01, n = 4) also prolonged from day 30 to 60 (Figure 6D–F).
 |
Figure 6 Action potential of iPS-VMs. (A). The original curve of the iPS-VM action potentials recorded using whole-cell patch clamp with 1 Hz stimulation. B–F. RP (B), APA (C), APD90 (D), APD70 (E), and APD50 (F) of iPS-VMs on days 30 and 60. The data represent the mean fold change ± SEM, n = 4–5 as indicated in the figures, ** P < 0.01, day 60 vs day 30, t-test. |
Discussion
To date, the comprehensive characterization of iPS-AMs/VMs has revealed that their molecular, ultrastructural, and electrophysiological properties align well with those of primary human cardiomyocytes. However, they also exhibit a dynamic functional characteristic. In this study, we investigated iPS-CM development under monolayer culture conditions using simplified and efficient molecular and functional approaches. Our data demonstrated that the gene expression-, protein location-, ultrastructure development-, and electrophysiological function-related changes in iPS-CMs were not synchronized but developed dynamically during the 60-day culture.
Despite their short half-life, mRNA transcripts dynamically direct cell shape-, cytoskeleton-, and ion channel-related changes.30,31 Previous studies described that cardiomyocyte-specific gene expression gradually increased from day 14 to 20 of differentiation.18 Our study demonstrated that NPPA, KCNJ5, MYL7, MYL2, GJA1, and CACNA1C expression increased considerably from day 0 to 20 and decreased from day 30 to 60, accompanied by protein maturation. Thyroid and glucocorticoid hormones enhance such gene expressions during early cardiomyocyte development, although these effects decrease when cardiomyocytes become terminally differentiated soon after maturation.32,33 Therefore, translation efficiency decreases to a certain degree, and the differential protein expression levels of downstream targets could explain the RNA-to-protein phenotypes.34 The GJA1 expression levels significantly decreased in 180-day and 360-day iPS-CMs compared to those in 30-day iPS-CMs, suggesting that transcript abundance alone is insufficient for classifying cell development over time.
The longitudinally striated cTnT reportedly arranged in mature iPS-CMs and T-tubes are important elements for calcium handling or ion channel formation.19 Therefore, iPS-CMs exhibit strong contractile function and other electrophysiological properties. iPS-AMs and iPS-VMs underwent stereotypical structural changes during differentiation. We focused our image-based analysis on cTnTs, a cardiomyocyte structure essential for cardiac contractile function. We provided rigorous time-quality-controlled and image-based measurements of the structural organization based on manual scoring.24 We manually scored the striated cTnT positive area and individual cell numbers to assess the cTnT amount and arrangement during development from day 20 to 60. Therefore, the number of iPS-CMs with striated organization increased significantly, demonstrating an enhanced extent of iPS-CMs maturation.
The significant structural rearrangements in the maturation stages of differentiation might be more readily classified using morphological analysis.8,25 Gradual myofilament and sarcomere maturation involve multiple proteins that form highly regular structures. Sarcomeres become increasingly organized over time during differentiation and maturation, both in vivo and in vitro. Therefore, the number and extent of organelle maturation, such as those of mitochondria and lysosomes packed between sarcomeres, progressively increased as well. With an increased workload, mature iPS-CMs are optimized for their ability to perform oxidative metabolism using fatty acids. Therefore, LDs decrease in later developmental stages.19 Regardless of the maturation stage, cells with different organizational patterns concurrently existed in the neighboring cells. However, notably, as described in this study, the iPS-AMs and iPS-VMs developmental patterns did not achieve the level of maturity and function typical of adult cardiomyocytes.8
A notable result of our study is that the dynamic development of molecular biology and structure is also correlated with electrophysiological function. Ryanodine receptors release calcium ions from the sarcoplasmic reticulum, and the T-tube provides fast delivery of the stored calcium ions to the contractile proteins.19 ATPase maturation promotes sodium–potassium pump function. These factors promote ion channel formation that influences morphology, duration, and propagation of AP.29
Functionally responsible AP is required to maintain cardiomyocyte automaticity during differentiation and to generate complete biological pacemakers. The functional assessment of individual differentiating iPS-AMs and iPS-VMs using our two-dimensional differentiation system successfully reproduced the early differentiation and diversification of cardiomyocytes. Both iPS-AMs and iPS-VMs typically display rapid AP upstrokes and repolarization durations. The APD90 of iPS-CMs on days 18–30 was approximately 50–60 ms in a previous study,29 and our results demonstrated remarkably prolonged APD90 in iPS-AMs and iPS-VMs when the cells were cultured for 60 days. IPS-VMs were distinguished from iPS-AMs by a relatively distinct plateau during repolarization and a longer APD. AP morphology and time points could be used as indicators for subtype differentiation and developmental stage classification.
Our study suggests that defining iPS-AMs and iPS-VMs biological maturation requires multidimensional observations, including gene expression as well as structural and electrophysiological functions. Furthermore, our study provides reference values for cell development and maturation from time gradients. We demonstrated that mRNA expression increased, then decreased from day 20 to 60, with large dynamic ranges. These morphological changes were consistent with electrophysiological functional maturation, which increased over time in the culture. In our follow-up study, we would continue to study the cardiomyocyte maturity-related changes over 60 days. Hopefully, this study could shed light on further studies of myocardial cell development and provide novel insights into personalized cardiovascular disease diagnosis and treatment.
Conclusion
In summary, the gene expression-, protein location-, ultrastructure development-, and electrophysiological function-related changes in iPS-AMs or iPS-VMs were not synchronized but dynamic with culture time. These results could serve as a potential basis for in vitro research on human cardiac myocyte development. We are cautiously optimistic about this new chapter in stem cell use for cardiac tissue and organ reconstruction.
Data Sharing Statement
The data underlying this article will be shared upon reasonable request by the corresponding author.
Acknowledgments
Graphical abstract created with BioRender.
Funding
This work was supported in part by the Natural Science Foundation of China [No. 82211530115 and 81974014, No. 82200399], Xi’an Talent Program [XAYC200023], Natural Science Foundation of Shaanxi Province [2022JQ-968, 2023-JC-YB-747, 2023-JC-YB-752, 2021JQ-024, 2022JQ-877], Ministry of Science and Technology [G2022040006L and DL2022040004L], Shaanxi Provincial International Science and Technology Cooperation Program Key Project [2024GH-ZDXM-38], Natural Science Foundation of Xi’an Health Commission [No.2022qn10], and Natural Science Foundation of Xi’an Children’s Hospital [No. 2021H02].
Disclosure
The authors declare that this research was conducted in the absence of any commercial or financial relationships that could be construed as potential conflicts of interest.
References
1. Mummery C, Ward-van Oostwaard D, Doevendans P, et al. Differentiation of human embryonic stem cells to cardiomyocytes: role of coculture with visceral endoderm-like cells. Circulation. 2003;107(21):2733–2740. doi:10.1161/01.CIR.0000068356.38592.68
2. Yazawa M, Hsueh B, Jia X, et al. Using induced pluripotent stem cells to investigate cardiac phenotypes in timothy syndrome. Nature. 2011;471(7337):230–234. doi:10.1038/nature09855
3. Nunes SS, Miklas JW, Liu J, et al. Biowire: a platform for maturation of human pluripotent stem cell–derived cardiomyocytes. Nature Methods. 2013;10(8):781–787. doi:10.1038/nmeth.2524
4. Yoshida Y, Yamanaka S. Induced pluripotent stem cells 10 years later: for cardiac applications. Circula res. 2017;120(12):1958–1968. doi:10.1161/CIRCRESAHA.117.311080
5. Robertson C, Tran DD, George SC. Concise review: maturation phases of human pluripotent stem cell-derived cardiomyocytes. Stem Cells. 2013;31(5):829–837. doi:10.1002/stem.1331
6. Yang X, Pabon L, Murry CE. Engineering adolescence: maturation of human pluripotent stem cell-derived cardiomyocytes. Circula res. 2014;114(3):511–523. doi:10.1161/CIRCRESAHA.114.300558
7. Zhang J, Wilson GF, Soerens AG, et al. Functional cardiomyocytes derived from human induced pluripotent stem cells. Circula res. 2009;104(4):30–41. doi:10.1161/CIRCRESAHA.108.192237
8. Artesi M, Bontems S, Göbbels P, et al. A recurrent mutation at position 26340 of SARS-CoV-2 is associated with failure of the E gene quantitative reverse transcription-PCR utilized in a commercial dual-target diagnostic assay. J Clin Microbiol. 2020;58(10):1595. doi:10.1128/JCM.01598-20
9. Rossini M, Filadi R. Sarcoplasmic reticulum-mitochondria kissing in cardiomyocytes: ca(2+. ATP Undis Sec Front Deve Bio. 2020;8:532. doi:10.3389/fcell.2020.00532
10. Tu C, Chao BS, Wu JC. Strategies for improving the maturity of human induced pluripotent stem cell-derived cardiomyocytes. Circula res. 2018;123(5):512–514. doi:10.1161/CIRCRESAHA.118.313472
11. Yang X, Rodriguez ML, Leonard A, et al. Fatty acids enhance the maturation of cardiomyocytes derived from human pluripotent stem cells. Stem Cell Rep. 2019;13(4):657–668. doi:10.1016/j.stemcr.2019.08.013
12. Lumley SF, Donnell OD, Stoesser NE, et al. Antibody status and incidence of SARS-CoV-2 infection in health care workers. N Engl J Med. 2021;384(6):533–540. doi:10.1056/NEJMoa2034545
13. Forte M, Marchitti S, Di Nonno F, et al. NPPA/atrial natriuretic peptide is an extracellular modulator of autophagy in the heart. Autophagy. 2023;19(4):1087–1099. doi:10.1080/15548627.2022.2115675
14. Xiao S, Shimura D, Baum R, et al. Auxiliary trafficking subunit GJA1-20k protects connexin-43 from degradation and limits ventricular arrhythmias. J Clin Invest. 2020;130(9):4858–4870. doi:10.1172/JCI134682
15. Zhang Q, Jiang J, Han P, et al. Direct differentiation of atrial and ventricular myocytes from human embryonic stem cells by alternating retinoid signals. Cell Res. 2011;21(4):579–587. doi:10.1038/cr.2010.163
16. Li Y, Chang Y, Li X, et al. RAD-deficient human cardiomyocytes develop hypertrophic cardiomyopathy phenotypes due to calcium dysregulation. Front Cell Develop Biol. 2020;8:585879. doi:10.3389/fcell.2020.585879
17. El-Battrawy I, Lan H, Cyganek L, et al. Modeling short qt syndrome using human-induced pluripotent stem cell-derived cardiomyocytes. J American Heart Assoc. 2018;7(7):e007394. doi:10.1161/JAHA.117.007394
18. Liu F, Fang Y, Hou X, et al. Enrichment differentiation of human induced pluripotent stem cells into sinoatrial node-like cells by combined modulation of BMP, FGF, and RA signaling pathways. Stem Cell Res Ther. 2020;11(1):284. doi:10.1186/s13287-020-01794-5
19. Ronaldson-Bouchard K, Ma SP, Yeager K, et al. Advanced maturation of human cardiac tissue grown from pluripotent stem cells. Nature. 2018;556(7700):239–243. doi:10.1038/s41586-018-0016-3
20. Mummery CL, Zhang J, Ng ES, Elliott DA, Elefanty AG, Kamp TJ. Differentiation of human embryonic stem cells and induced pluripotent stem cells to cardiomyocytes: a methods overview. Circula res. 2012;111(3):344–358. doi:10.1161/CIRCRESAHA.110.227512
21. Yanagi K, Takano M, Narazaki G, et al. Hyperpolarization-activated cyclic nucleotide-gated channels and T-type calcium channels confer automaticity of embryonic stem cell-derived cardiomyocytes. Stem Cells. 2007;25(11):2712–2719. doi:10.1634/stemcells.2006-0388
22. Wang K, Terrenoire C, Sampson KJ, et al. Biophysical properties of slow potassium channels in human embryonic stem cell derived cardiomyocytes implicate subunit stoichiometry. J Physiol. 2011;589(24):6093–6104. doi:10.1113/jphysiol.2011.220863
23. Fu JD, Jiang P, Rushing S, Liu J, Chiamvimonvat N, Li RA. Na+/Ca2+ exchanger is a determinant of excitation-contraction coupling in human embryonic stem cell-derived ventricular cardiomyocytes. Stem Cells Develop. 2010;19(6):773–782. doi:10.1089/scd.2009.0184
24. Gerbin KA, Grancharova T, Donovan-Maiye RM, et al. Cell states beyond transcriptomics: integrating structural organization and gene expression in hiPSC-derived cardiomyocytes. Cell Systems. 2021;12(6):670–687. doi:10.1016/j.cels.2021.05.001
25. Adamcova M, Skarkova V, Seifertova J, Rudolf E. Cardiac troponins are among targets of doxorubicin-induced cardiotoxicity in hiPCS-CMs. Int J Mol Sci. 2019;20(11):2638. doi:10.3390/ijms20112638
26. Fijnvandraat A. Cardiomyocytes derived from embryonic stem cells resemble cardiomyocytes of the embryonic heart tube. Cardio Rese. 2003;58(2):399–409. doi:10.1016/s0008-6363(03)00282-7
27. Welte MA, Gould AP. Lipid droplet functions beyond energy storage. Biochim Biophys Acta Mol Cell Biol Lipids. 2017;1862(10):1260–1272. doi:10.1016/j.bbalip.2017.07.006
28. Olzmann JA, Carvalho P. Dynamics and functions of lipid droplets. Nat Rev Mol Cell Biol. 2019;20(3):137–155. doi:10.1038/s41580-018-0085-z
29. Peinkofer G, Burkert K, Urban K, et al. From early embryonic to adult stage: comparative study of action potentials of native and pluripotent stem cell-derived cardiomyocytes. Stem Cells Develop. 2016;25(19):1397–1406. doi:10.1089/scd.2016.0073
30. Clark KL, Ganesan S, Keating AF. Impact of toxicant exposures on ovarian gap junctions. Reprod Toxicol. 2018;81:140–146. doi:10.1016/j.reprotox.2018.07.087
31. Binas S, Knyrim M, Hupfeld J, et al. miR-221 and −222 target CACNA1C and KCNJ5 leading to altered cardiac ion channel expression and current density. Cell Mol Life Sci. 2019;77(5):903–918. doi:10.1007/s00018-019-03217-y
32. Li M, Iismaa SE, Naqvi N, Nicks A, Husain A, Graham RM. Thyroid hormone action in postnatal heart development. Stem Cell Res. 2014;13(3):582–591. doi:10.1016/j.scr.2014.07.001
33. Parikh SS, Blackwell DJ, Gomez-Hurtado N, et al. Thyroid and glucocorticoid hormones promote functional t-tubule development in human-induced pluripotent stem cell-derived cardiomyocytes. Circula res. 2017;121(12):1323–1330. doi:10.1161/CIRCRESAHA.117.311920
34. Menon A, Hong L, Savio-Galimberti E, et al. Electrophysiologic and molecular mechanisms of a frameshift NPPA mutation linked with familial atrial fibrillation. J Mol Cell Cardiol. 2019;132:24–35. doi:10.1016/j.yjmcc.2019.05.004
 © 2024 The Author(s). This work is published and licensed by Dove Medical Press Limited. The full terms of this license are available at https://www.dovepress.com/terms.php and incorporate the Creative Commons Attribution - Non Commercial (unported, v3.0) License.
By accessing the work you hereby accept the Terms. Non-commercial uses of the work are permitted without any further permission from Dove Medical Press Limited, provided the work is properly attributed. For permission for commercial use of this work, please see paragraphs 4.2 and 5 of our Terms.
© 2024 The Author(s). This work is published and licensed by Dove Medical Press Limited. The full terms of this license are available at https://www.dovepress.com/terms.php and incorporate the Creative Commons Attribution - Non Commercial (unported, v3.0) License.
By accessing the work you hereby accept the Terms. Non-commercial uses of the work are permitted without any further permission from Dove Medical Press Limited, provided the work is properly attributed. For permission for commercial use of this work, please see paragraphs 4.2 and 5 of our Terms.