")
Back to Journals » Diabetes, Metabolic Syndrome and Obesity » Volume 17
Fractional Excretion of Urate is Positively Associated with Type 2 Diabetes in HUA Patients: A Cross-Sectional Study
Authors Huang B, Li X, Zhang X, Li S, Liu Y, Zhang M, Cui J
Received 13 December 2023
Accepted for publication 6 April 2024
Published 13 April 2024 Volume 2024:17 Pages 1701—1713
DOI https://doi.org/10.2147/DMSO.S454711
Checked for plagiarism Yes
Review by Single anonymous peer review
Peer reviewer comments 4
Editor who approved publication: Dr Konstantinos Tziomalos
Bo Huang,* Xin Li,* Xinxin Zhang, Shiwei Li, Yue Liu, Mengjuan Zhang, Jingqiu Cui
Department of Endocrinology and Metabolism, Tianjin Medical University General Hospital, Tianjin, People’s Republic of China
*These authors contributed equally to this work
Correspondence: Jingqiu Cui, Department of Endocrinology and Metabolism, Tianjin Medical University General Hospital, Tianjin, 300052, People’s Republic of China, Tel +86 13920765604, Email [email protected]
Purpose: People with hyperuricemia (HUA) are often related to metabolic disorders such as diabetes, metabolic syndrome (MetS), and obesity. However, the correlation between excretion of uric acid and these diseases is unclear. Our study aimed to explore the relationship between uric acid excretion and type 2 diabetes (T2D).
Methods: A total of 228 HUA patients from Tianjin Medical University General Hospital from 2022 to 2023 were included in this study. We collected demographic, biochemical, and anthropometric data on each subject. Urine uric acid excretion (UUAE) was calculated enzymatically from a single urine collection that lasted 24 hours. And fractional excretion of uric acid (FEUA) was calculated from serum uric acid and creatinine and uric acid and creatinine. Binary logistic regression modeling assessed the association between uric acid excretion and T2D.
Results: Of the 228 subjects, 13.4% had T2D and 48.7% had obesity. The obesity group had a lower FEUA (p< 0.05) and a higher UUAE compared to the control group (p< 0.05). And FEUA had a stronger correlation with the risk of T2D (p< 0.001). Also, there was a negative association between BMI and FEUA and a positive link between BMI and UUAE in the outpatients.
Conclusion: Increased FEUA levels were significantly associated with T2D in HUA patients. Therefore, routine calculating of FEUA is essential for proper diagnosis and appropriate treatment T2D of in HUA patients.
Keywords: urine uric acid excretion, hyperuricemia, obesity, Type 2 diabetes, fractional excretion of urate
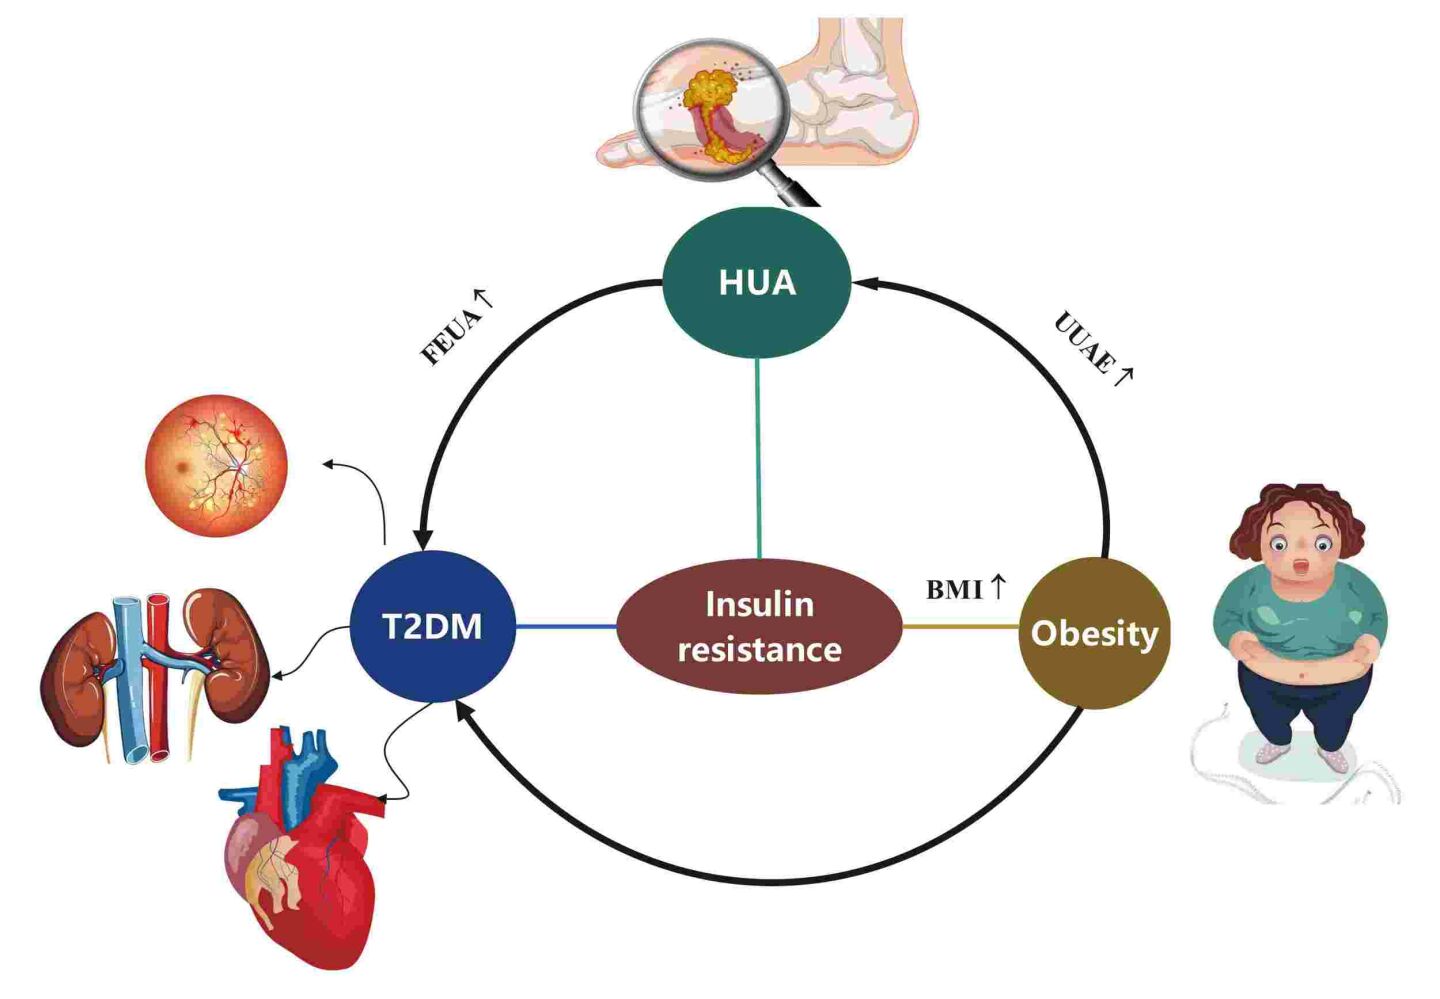
Graphical Abstract:
Introduction
HUA constitutes a metabolic disorder primarily attributed to disturbances in purine metabolism, which the prevalence of in Chinese adults was 14.0%.1 In humans, purines are ultimately metabolized into uric acid, which can further convert uric acid into allantoin by the enzyme uricase, readily excretable through urine. However, the enzyme uricase is absent in the human body.2 The kidneys play a pivotal role in regulating amounts of uric acid in the circulation. Nearly two-thirds of uric acid goes away via the kidneys, while the remaining one-third leaves the body through the intestinal tract uricolysis.3 Renal capacity, though, is finite. HUA may arise from a disturbance in the balance between the production and excretion of uric acid.
All the time, research is being done on the link between serum uric acid (SUA) and several metabolic disorders, including diabetes,4,5 hypertension,6,7 obesity,8 metabolic syndrome,9 dyslipidemia,10 kidney dysfunction,11 liver dysfunction,12 and cardiovascular disease.13 A prospective study demonstrated that higher SUA levels increase the risk of developing diabetes.14 Recently lower cut-offs for HUA have been defined since they are more strongly associated with CV diseases. HUA was diagnosed both with the classic cut-off of 6.0 mg/dl for females and 7.0 mg/dl for males, but also with the newly identified one in the URRAH (Uric Acid Right for Heart Health) study that is 5.1 mg/dl for females and 5.6 mg/dl for males.15 The threshold of 5.6 mg/dl previously proposed by the URRAH Study Group, is predictive of an increased risk of total and CV mortality in people with diabetes.16 The newly reported URRAH cutoff values for HUA better relate to atherogenic lipoprotein (LDL and non-HDL) when compared to the classic one.17 Also, treating hyperinsulinemia and diabetes-related insulin resistance with troglitazone or a low-energy diet in overweight hypertensive patients lowers serum UA levels.18 Additionally, several publications have shown the independent impact of SUA on the onset of MetS and hypertension in Chinese hospitalized type 2 diabetic patients.19 A population-based longitudinal epidemiological investigation found a link between raised concentrations of SUA and an elevated risk of obesity.20 In healthy patients, a prior Chinese study likewise revealed a favorable correlation between BMI and SUA.21 Overall, these investigations repeatedly show that higher SUA levels are strongly associated with metabolic problems in individuals with and without diabetes.
The UUAE test is commonly employed in clinical practice as a non-invasive method to quantify uric acid excretion levels. Elevated SUA levels typically coincide with heightened uric acid concentrations in urine. Despite multiple studies investigating the connections of SUA with diabetes, MS, and obesity, there exists an absence of data concerning the associations between UUAE, FEUA, and diabetes in populations with HUA. A few studies looked into the link between FEUA and the development of simple renal cysts22 and gout.23 In both men and postmenopausal women with type 2 diabetes, HUA and high levels of FEUA were independent risk factors for the growth of simple renal lesions.22 Further, higher excretion of urine uric acid was linked to lower SUA levels during the acute gout flare.23 However, among populations with HUA, the relationship between uric acid excretion and T2D has not yet been studied. Therefore, our primary aim is to explore the association between uric acid excretion and T2D in Chinese outpatients with HUA.
Methods and Materials
Subjects
The study included 228 patients with HUA in total. Between 2022 and 2023, Tianjin Medical University General Hospital attracted outpatients (Figure 1). The following were the exclusion criteria: 1) a history of severe hypoglycemia, type 1 diabetes, other kinds of diabetes, or acute complications of diabetes; 2) Use of drugs affecting uric acid excretion, including diuretic, losartan, aspirin, glucocorticoids, cyclosporine, immunosuppressive agents, anti-tuberculosis drugs, sodium bicarbonate, levodopa, metformin, fenofibrate and UA-lowering agents, such as febuxostat, benzbromarone or allopurinol24; 3) Autoimmune diseases, acute and chronic infections; 4) Tumor and blood system diseases; 5) Incomplete information.
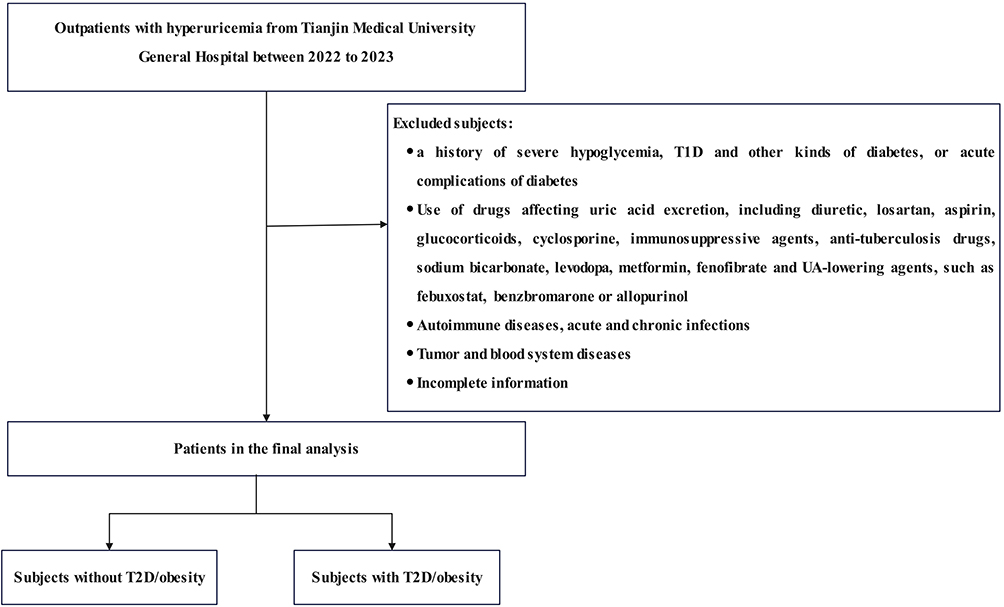 |
Figure 1 Flowchart of the cross-sectional study. |
Definition
HUA was defined differently in males and females; SUA levels >7.0 mg/dL (420 mol/L) in males and SUA levels 6.0 mg/dL (360 mol/L) in females.25 The 1999 World Health Organization standard served as a basis for the diagnosis of T2D.26 Following the criteria established for the Chinese population, individuals with a Body Mass Index (BMI) of 28 or greater are classified as obese.27 And weight (kg) / height (m2) was used to compute BMI. Additionally, formula [100×UUE×Scr/(SUA×urine creatinine)] was used to compute the fractional excretion of urate (FEUA).28 Based on the equation developed by the Chronic Kidney Disease Epidemiology Collaboration (CKD-EPI), the estimated glomerular filtration rate (eGFR) was determined.29 EGFR above the upper quartile of all study subjects, that is, EGFR > 112mL/min·1.73m2, was defined as glomerular hyperfiltration group (GH) and <112mL/min·1.73 m2 as a glomerular non-hyperfiltration group (non-GH).
Data Collection
All subjects’ demographic information was gathered, including the subject’s gender, age, previous diagnosis of hypertension, or diabetes, the length of their HUA, and any comorbidities (including gout and renal calculi) associated with it. Outpatient staff measured anthropometric indicators including weight and height. All subjects were on a normal purine diet for at least 3 days before collecting blood and urine samples. Venous blood specimens were obtained after overnight fasting to measure the serum concentrations of the fasting plasma concentrations of glucose, total cholesterol (TC), triglycerides (TG), high-density lipoprotein cholesterol (HDL), low-density lipoprotein cholesterol (LDL), alanine aminotransferase (ALT), aspartate aminotransferase (AST), glutamyl transpeptidase (GGT), creatinine (Cr), and uric acid (UA) using a type ARCHITECT i2000 immunoassay analyze (Abbott, America). A single 24-hour urine sample was collected for measuring the 24-hour urine uric acid, creatinine, and microalbuminuria using a type IMMULITE 2000 XPi Immunoassay System (Siemens Healthineers, Germany).
Statistical Analysis
We used IBM SPSS Statistics (version 26) to analyze the data. Data normality was evaluated using the nonparametric Kolmogorov–Smirnov (K-S) test. While categorical data were shown as percentages (%), continuous variables were given as either the mean standard deviation (SD) or the median with an interquartile range (25%, 75%). The comparison of normally distributed variables among groups was carried out using the independent sample t-test and one-way analysis of variance. Additionally, to compare data that is not normally distributed between groups, the Mann–Whitney U-test and the Kruskal–Wallis H-test were done. Categorical variables are presented as percentages and the Chi-square test was used to look for group differences. Utilizing Spearman correlation analysis, the links between UUAE, FEUA, and other factors were evaluated. To examine the relationships between FEUA and illnesses, logistic regression calculations were applied.
Results
Baseline Characteristics
Tables 1 and 2 exhibits the clinical and biochemical features of the individuals. Compared with non-diabetes, participants with diabetes were older than non-diabetes (p=0.001). Participants with diabetes presented with a higher volume of urine, urine uric acid excretion (UUAE), urine creatinine excretion (UCE), and higher levels of TG (p=0.016), FPG (p<0.001), and TC (p=0.025). They also showed lower levels of fractional excretion of urate than the non-diabetes individuals (p=0.006, Figure 2). The prevalence of underexcretion HUA was lower in the Diabetes group (p=0.027). Participants with GH presented with lower FEUA and Cr (p<0.05). The prevalence of hypertension was higher in the non-GH group (p<0.05). The prevalence of HUA was lower in the non-GH group (p<0.05). Tables 3 and 4 provided a snapshot of the general characteristics of the study’s participants according to the quartile of UUAE, and FEUA (%). In Table 3, compared to Q1–Q2, the BMI of Q4 was higher (p<0.001), and Q3 had a higher BMI than Q1. For each additional unit of ALT, there is a difference between the groups (p=0.007).
 |
Table 1 General Characteristics of the Study Population |
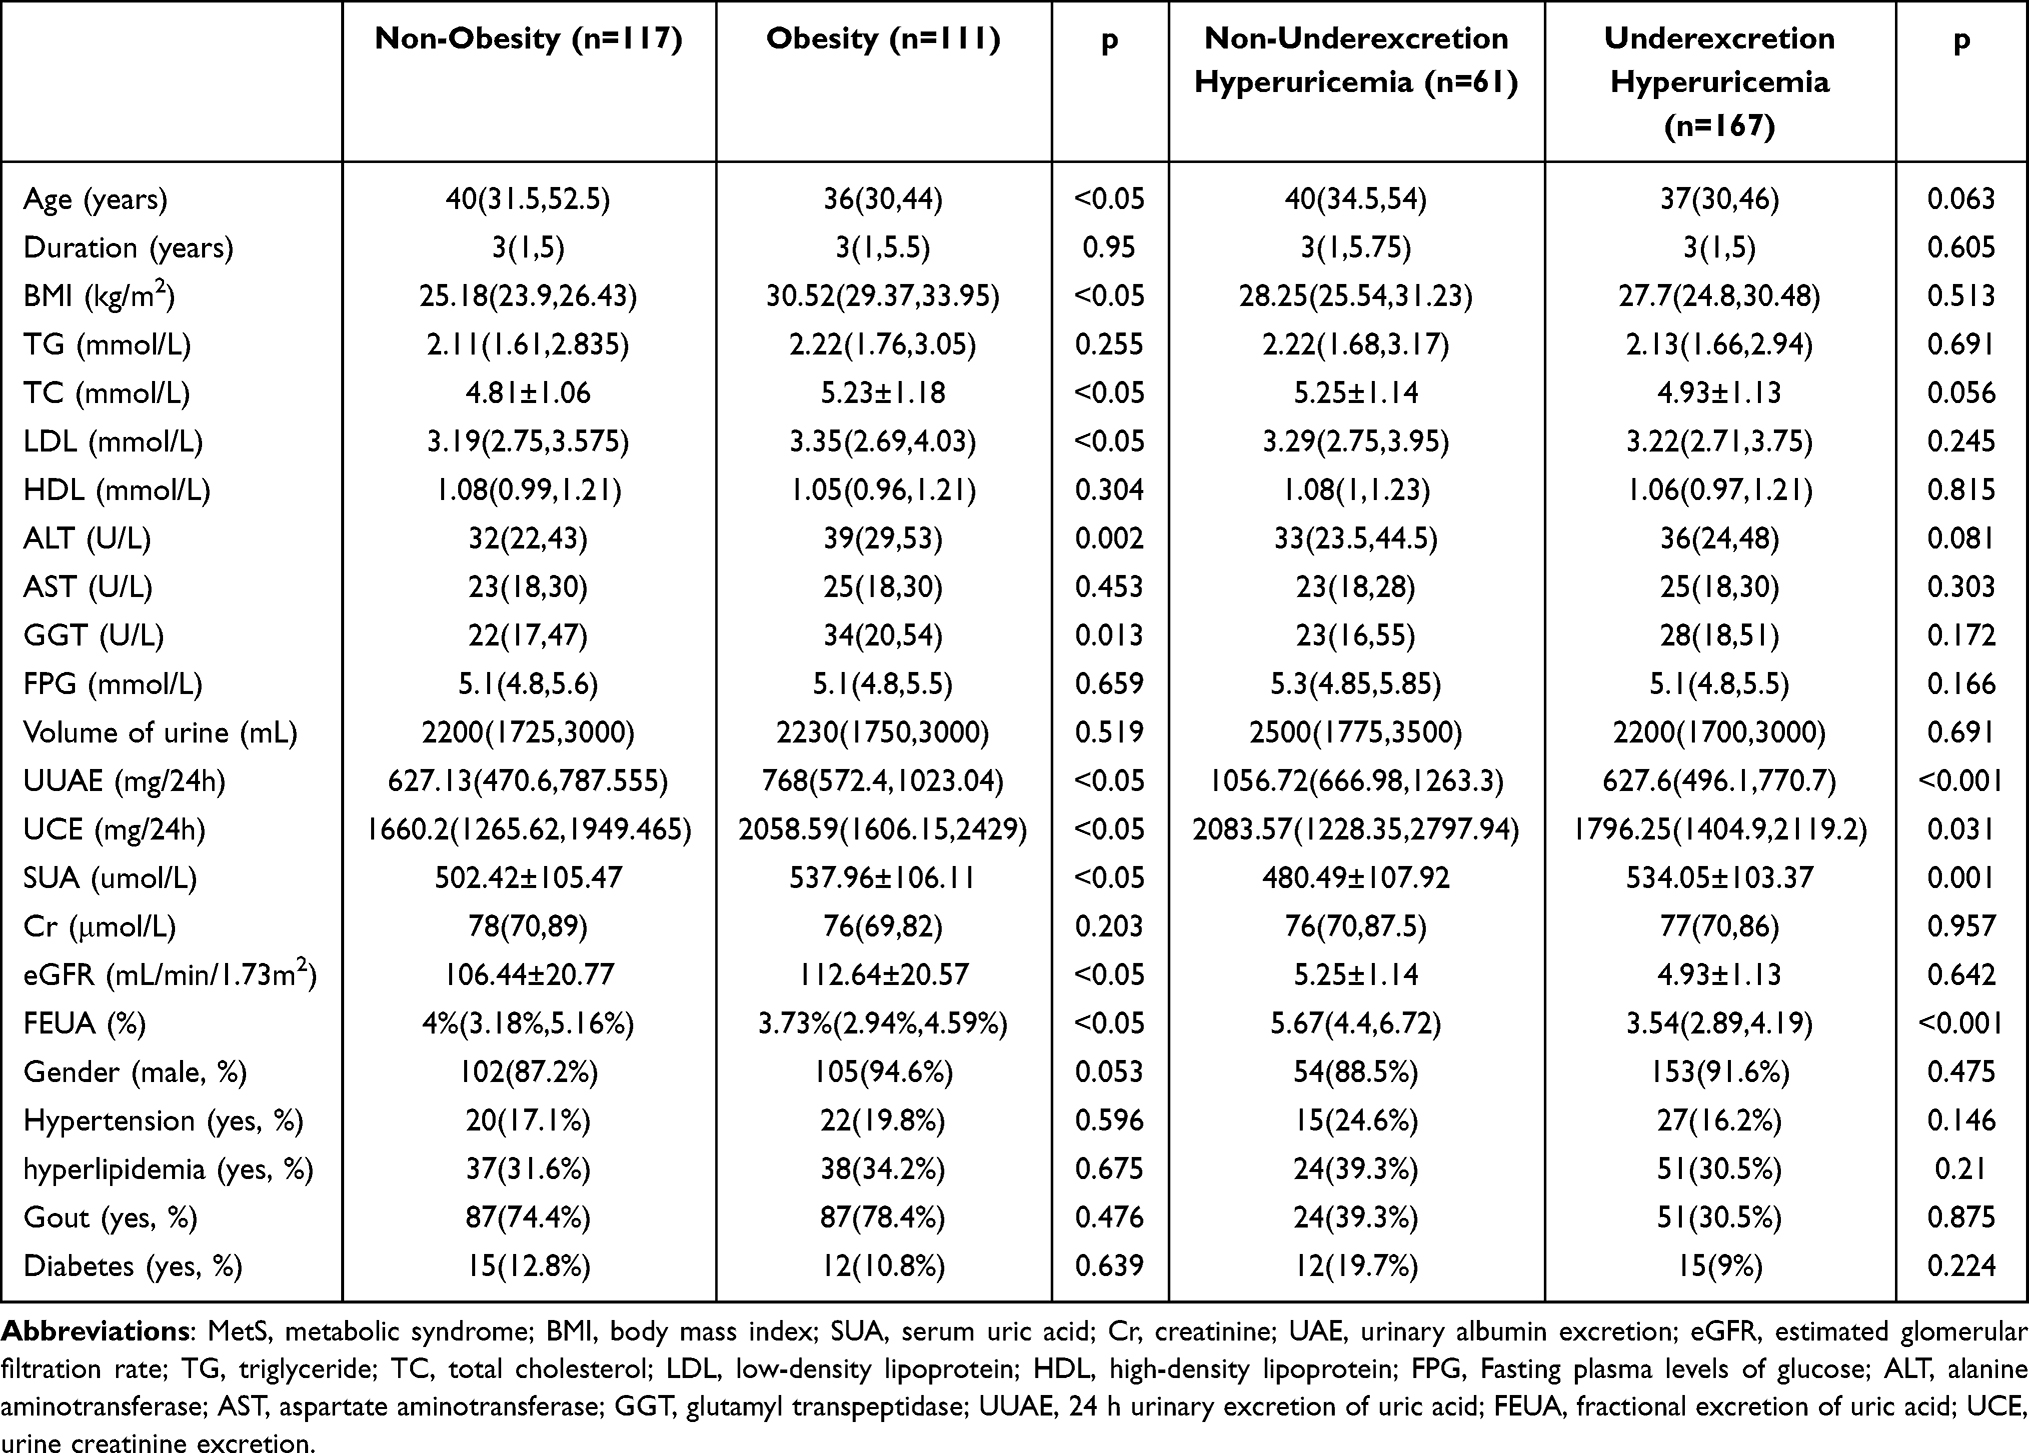 |
Table 2 General Characteristics of the Study Population |
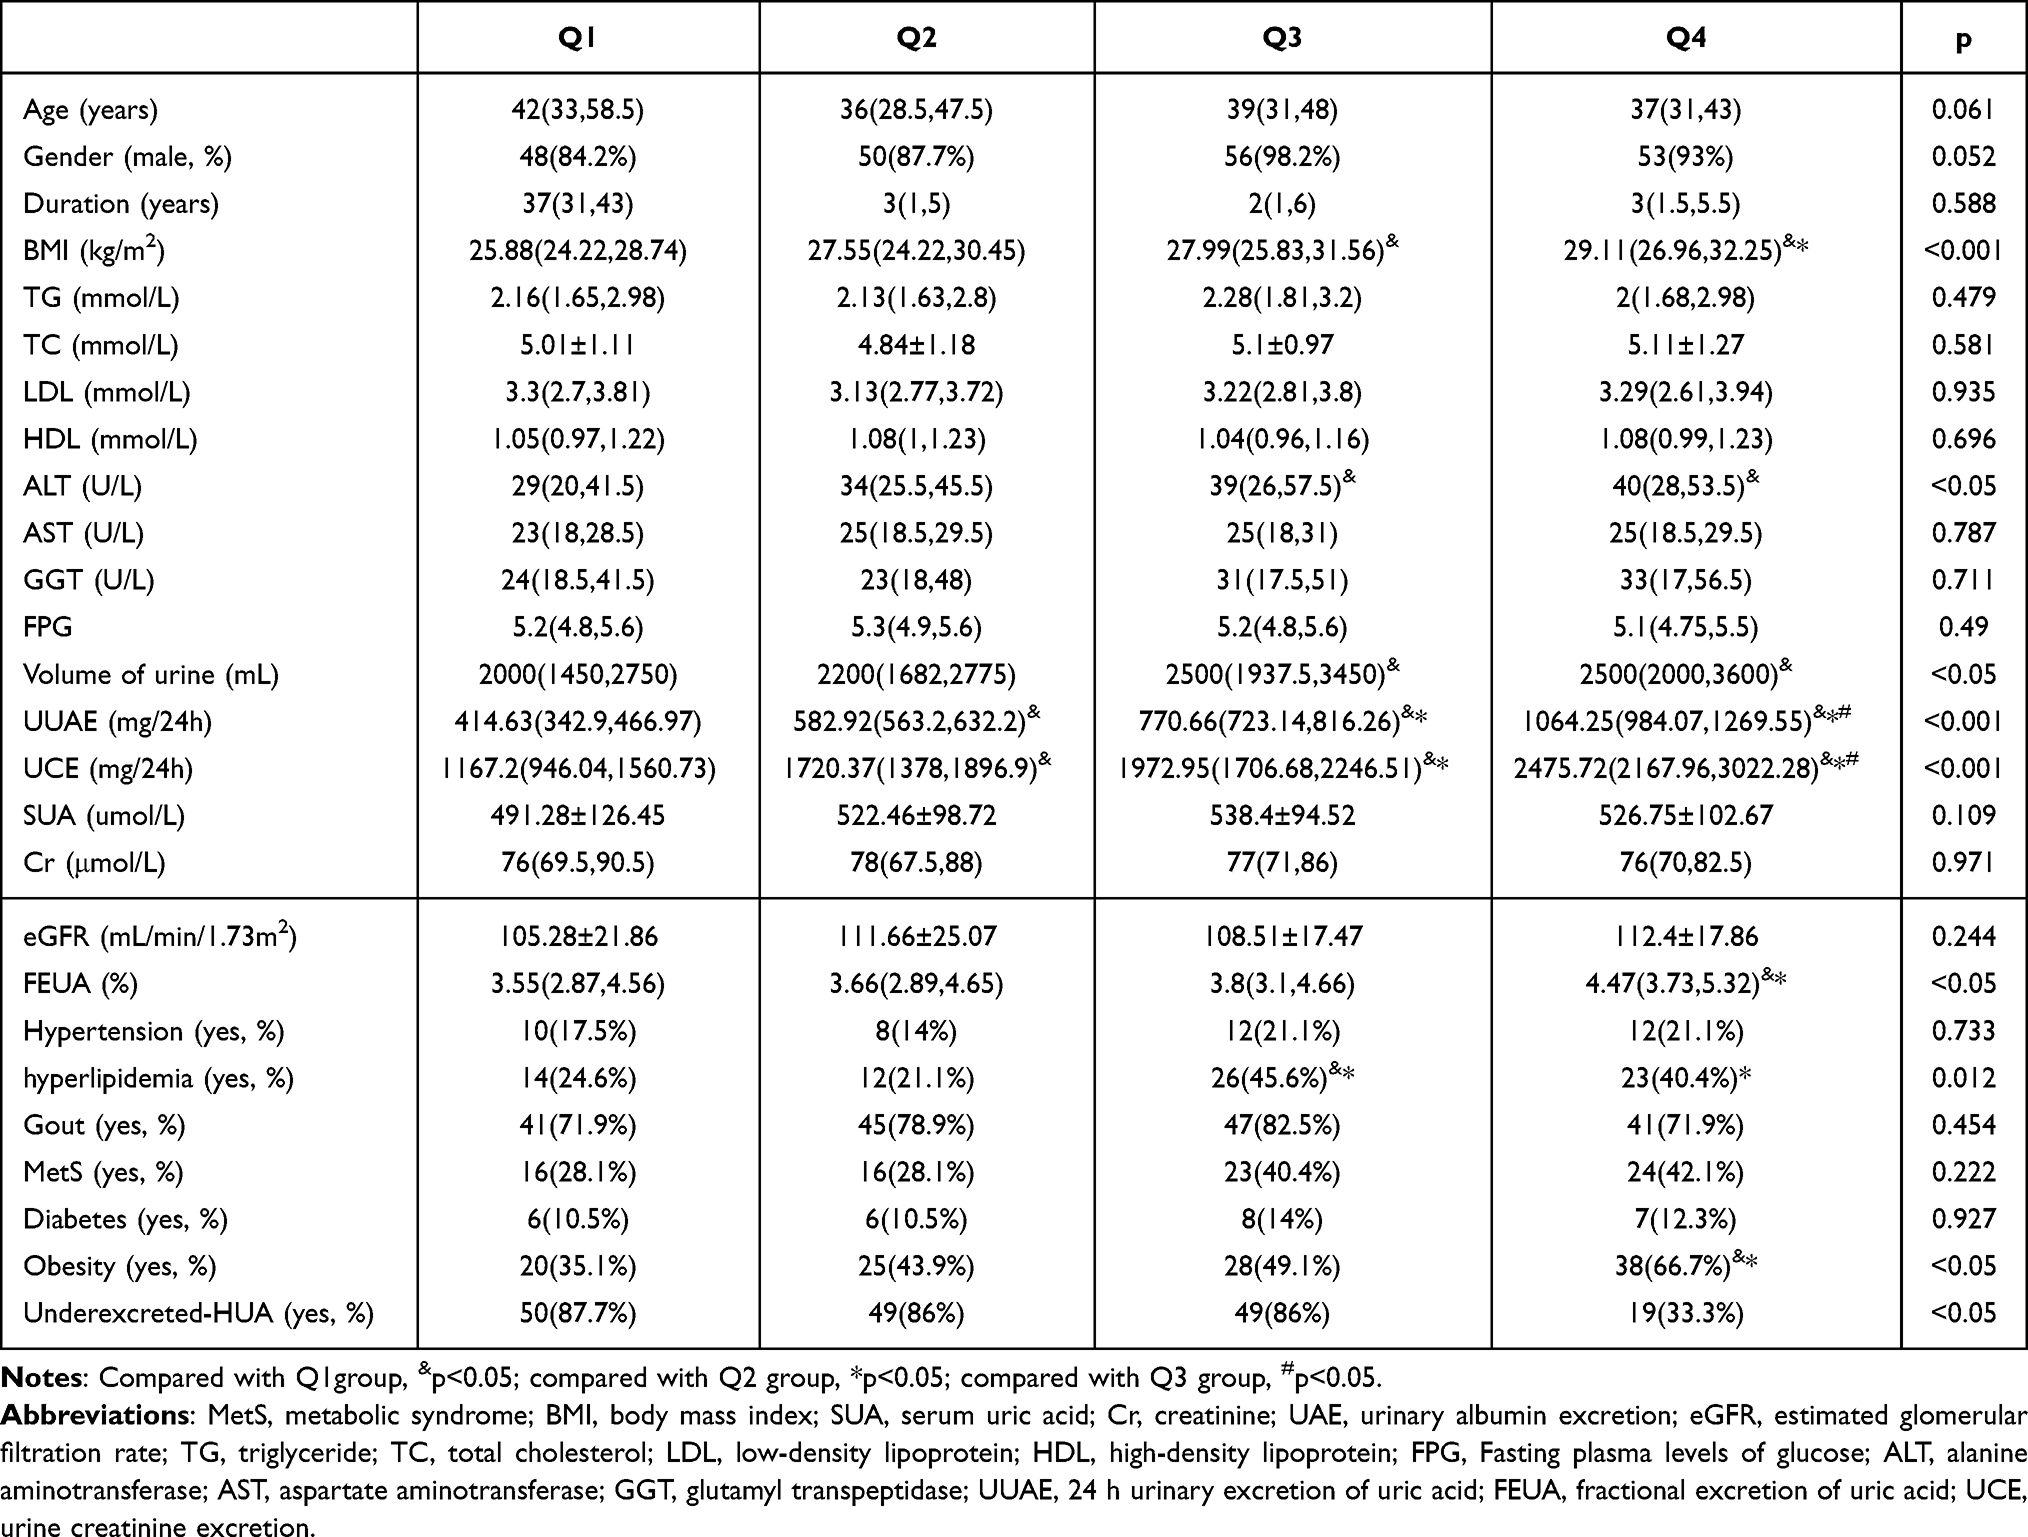 |
Table 3 Characteristics of the Patients According to UUAE Quartiles |
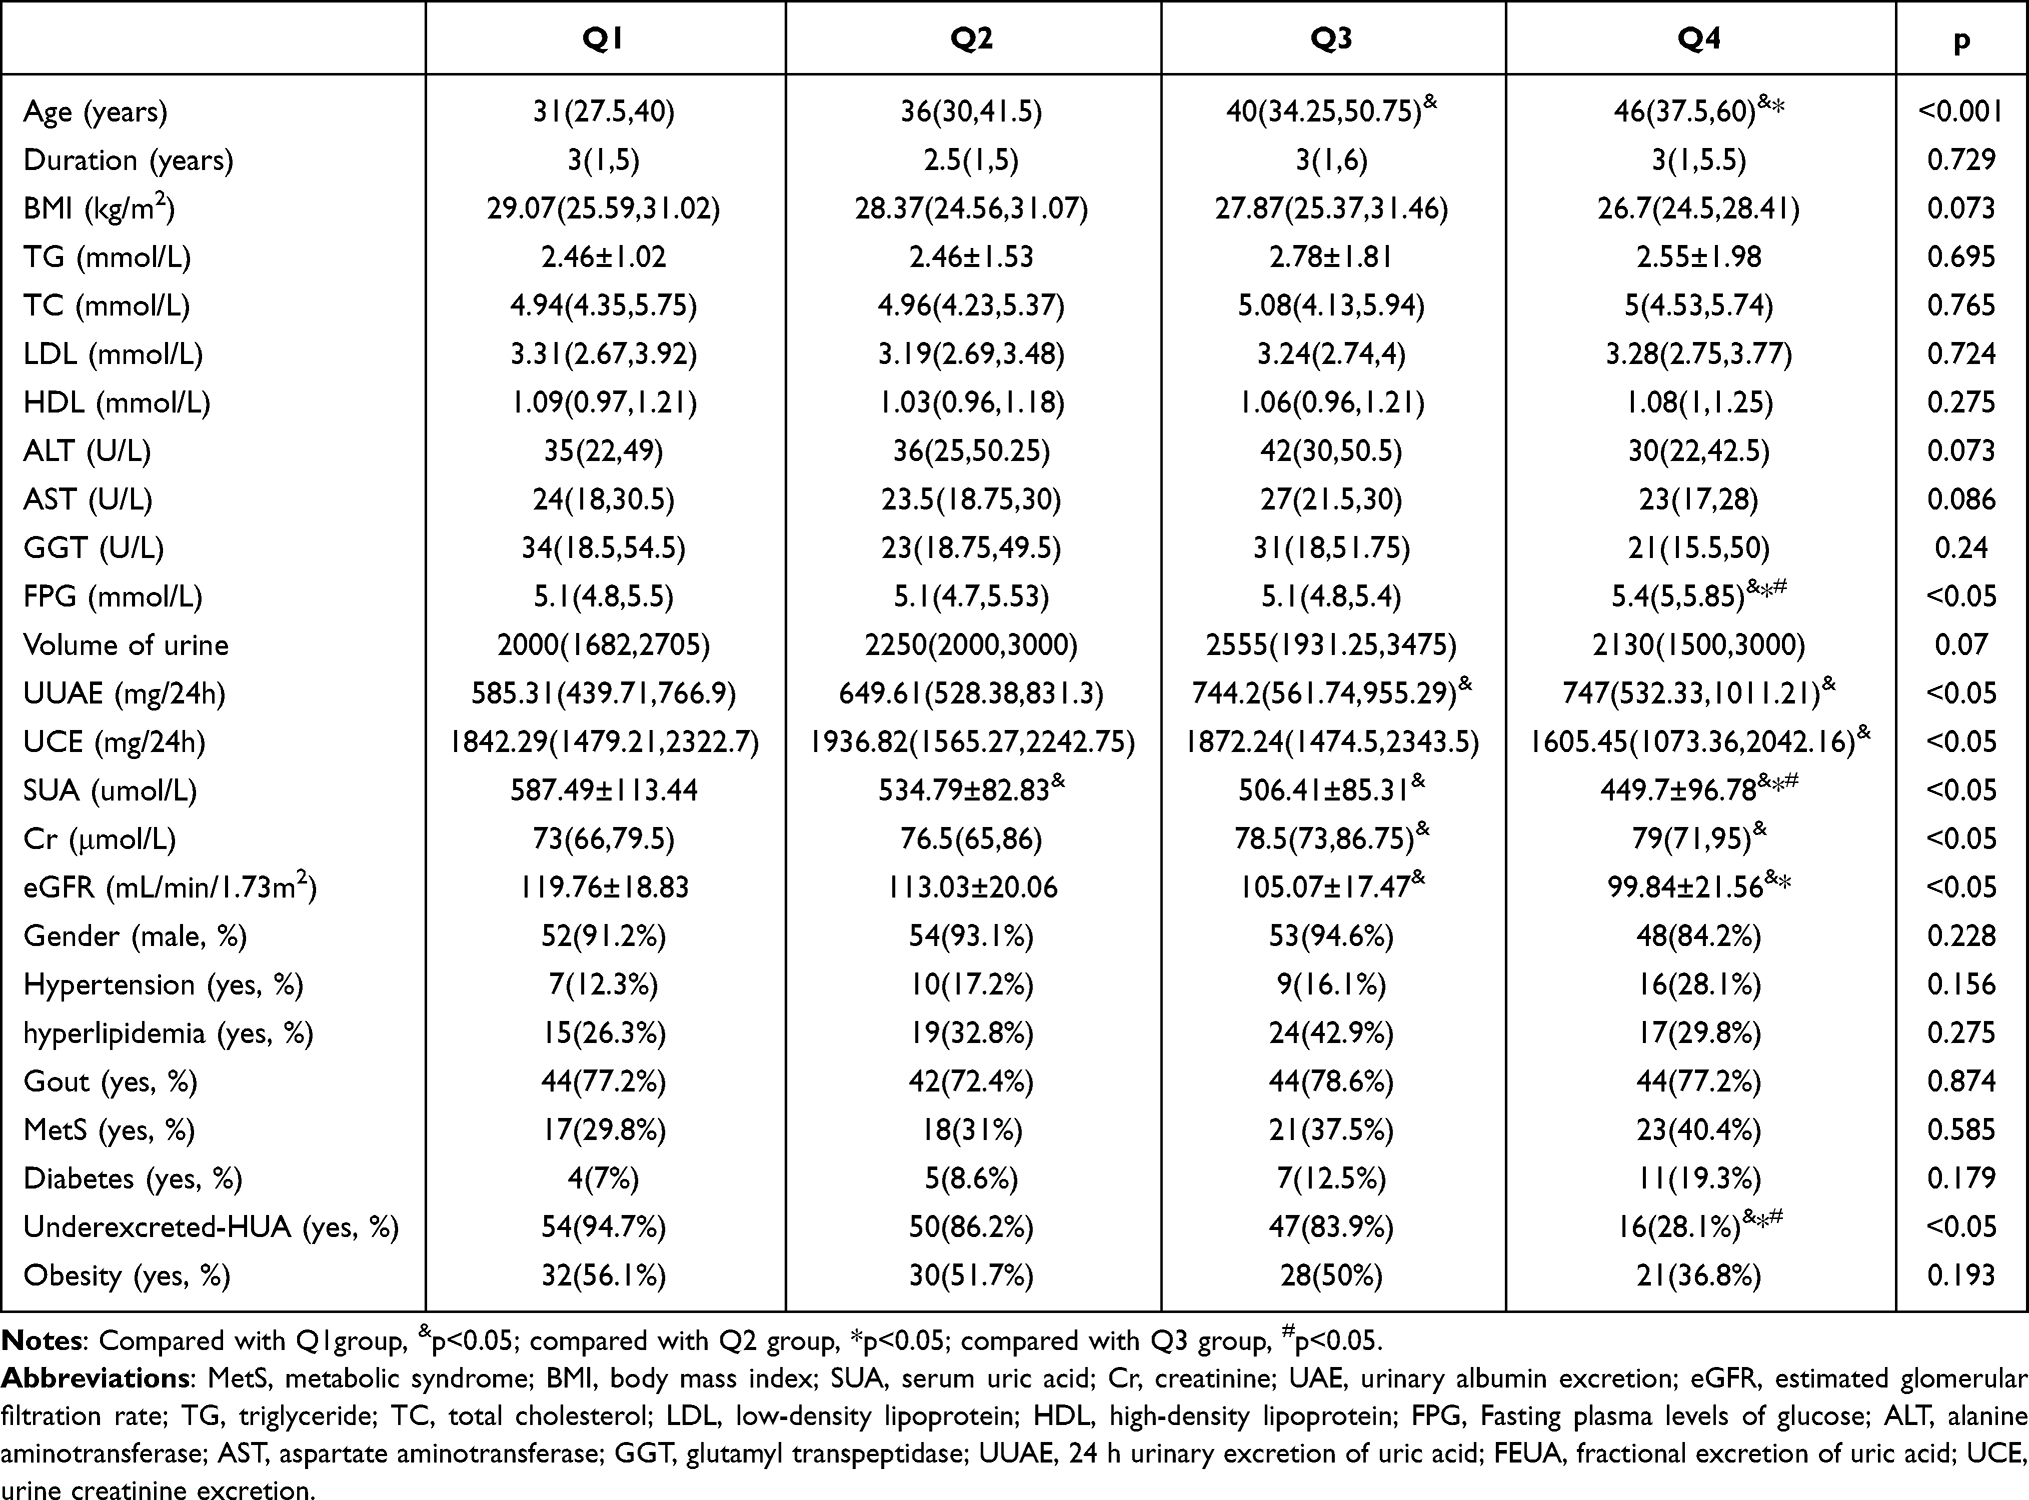 |
Table 4 Characteristics of the Patients According to FEUA Quartiles |
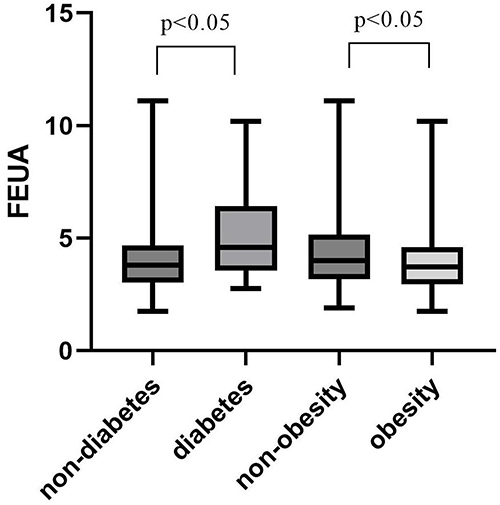 |
Figure 2 Comparison of FEUA levels between the patients with and without T2D and obesity. |
In Table 3 according to UUAE quartiles, the prevalence rate of obesity was 35.1%, 43.9%, 49.1%, and 66.7% in the Q1-Q4 group. And the prevalence rate of T2D was 10.5%, 10.5%, 14.0%, and 12.3% in the Q1-Q4 group. The prevalence of obesity was higher in the fourth quarter group than in the Q1-Q2 group (p<0.05, Figure 3A). The incidence of hyperlipidemia was higher in the Q3-Q4 group than in the Q2 unit and the Q3 group than the Q1 group (p=0.012). However, no appreciable variations were found in age, TG, TC, HDL, LDL, AST, GGT, FPG, SUA, Cr, or eGFR, and there was no discernible difference in the incidence of diabetes or MetS across the four groups (p>0.05).
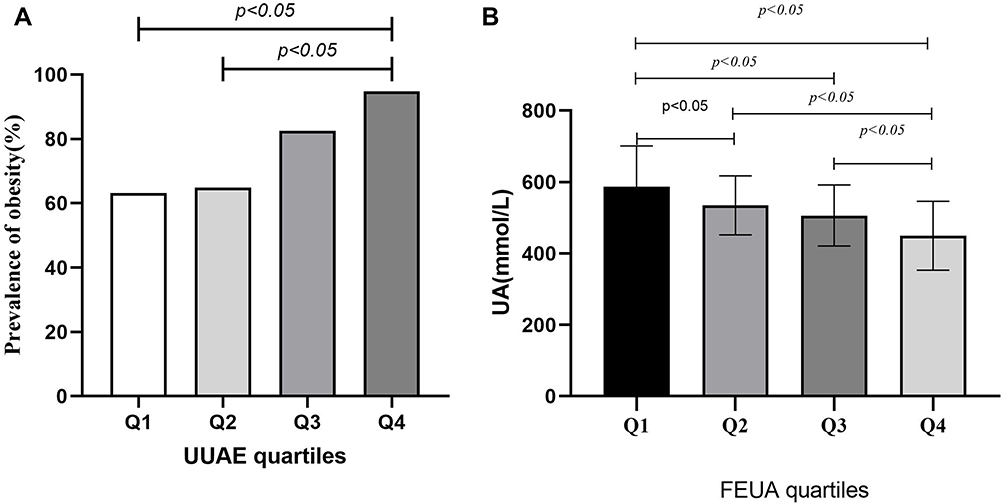 |
Figure 3 (A) Prevalence of obesity stratified by UUAE quartile in HUA. (B) Comparison of UA levels stratified by FEUA quartile in HUA. |
In Table 4, according to FEUA quartiles, the prevalence rate of obesity was 56.1%, 51.7%, 50%, and 36.8% in the Q1-Q4 group. And the prevalence rate of T2D was 7%, 8.6%, 12.5%, and 19.3% in the Q1-Q4 group. There was a substantial variance in patient age between the Q4 and Q2-Q3 groups (p<0.001), as well as between the Q3 and Q1 groups. Q4’s FPG was higher than the one for Q1–Q3’s (p<0.05). Likewise, the Q4 group’s SUA levels were lower than the Q1-Q3 group’s (p<0.05, Figure 3B), and the Q2-Q3 group’s SUA levels were lower than the Q1 group’s (p<0.05, Figure 3B). But there were no appreciable variations in TG, TC, HDL, LDL, AST, ALT, GGT, the volume of urine, gender, and the incidence of obesity, MetS, gout, and diabetes in the four groups (p>0.05).
Relationships Between UUAE, FEUA, and Other Variables
The correlations between FEUA, UUAE, and other factors are displayed in Tables 5 and 6. UUAE is strongly positively correlated with BMI (r = 0.353, p<0.001), SUA (r = 0.143, p<0.001), urine volume (r = 0.304, p<0.001), and UCE (r = 0.770, p<0.001). Yet, there is a substantial inverse relationship (r = −0.139, p=0.036) between age and UUAE. There is a substantial positive relationship between FEUA and age (r=0.402, p <0.001), FPG (r=0.135, p<0.001), and Cr (r=0.235, p<0.001). There is a substantial negative correlation between FEUA and BMI (r=−0.159, p<0.001), UCE (r=--0.144, p <0.001), SUA (r=−0.493, p<0.001), and eGFR (r=--0.349, p<0.001).
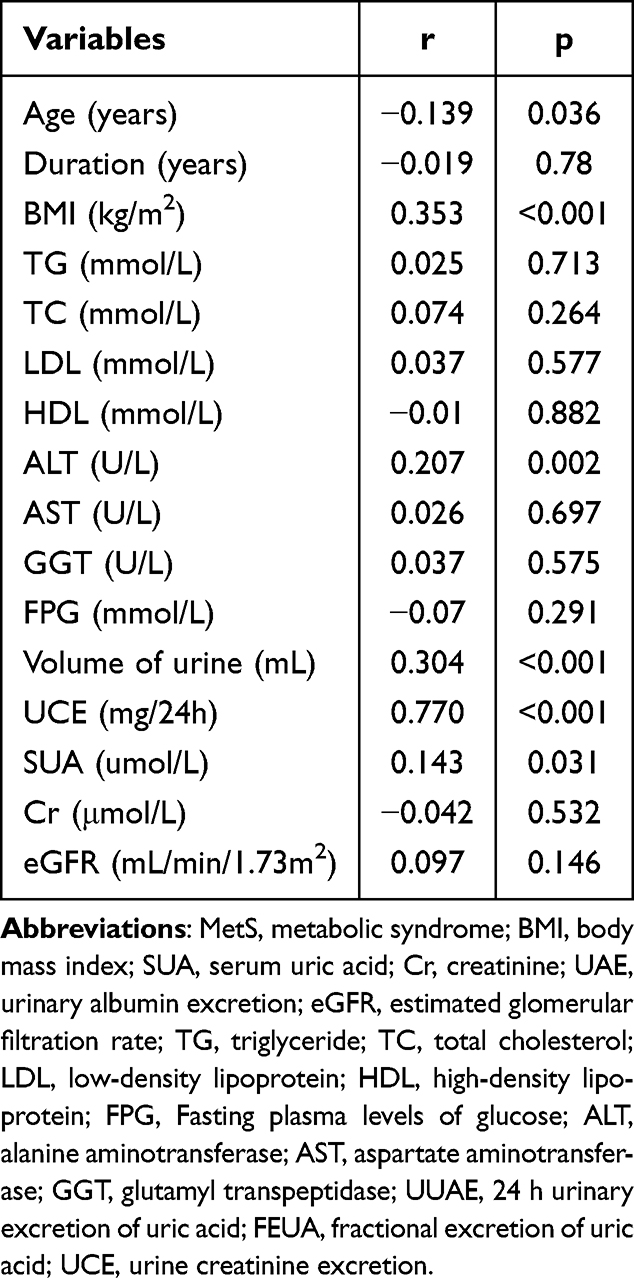 |
Table 5 Relationships Between UUAE and Other Variables |
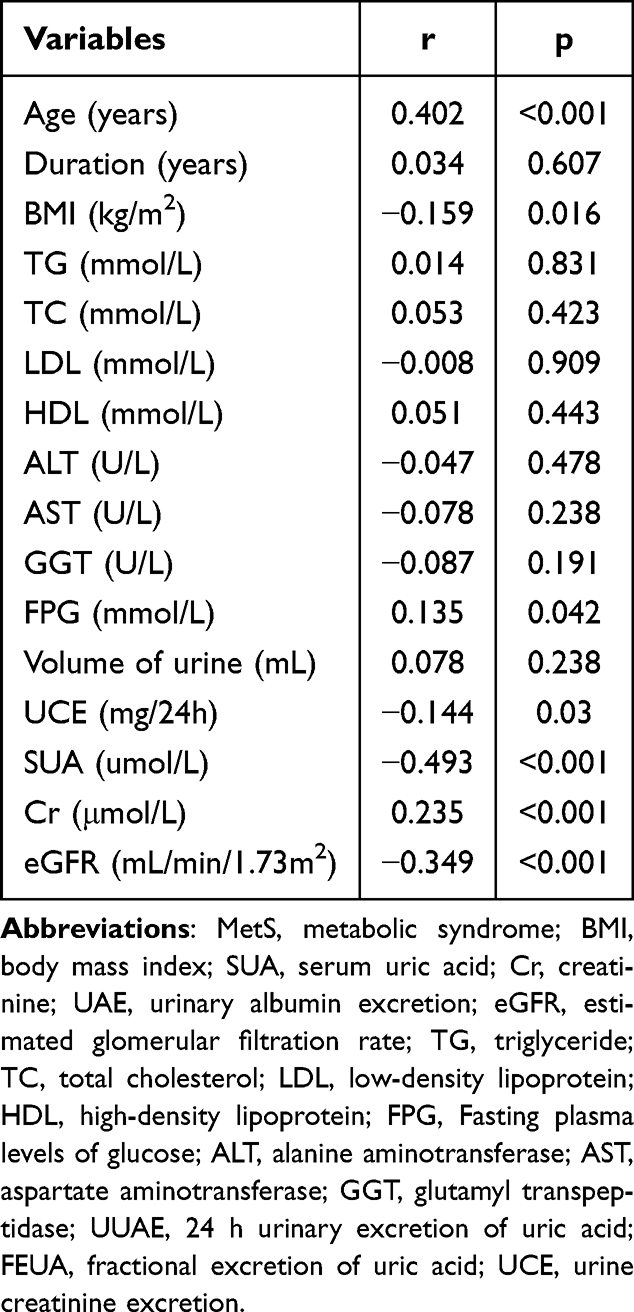 |
Table 6 Relationships Between FEUA and Other Variables |
Association Between FEUA and Diabetes
Table 7 shows the relationship between FEUA and Diabetes. In model 1, we found that a unit increase in FEUA (OR=1.428, 95% CI=1.134–1.799) was significantly associated with the risk of T2D (p=0.002). Model 2’s age, duration, gender, and BMI corrections did not change the association between FEUA and the risk of T2D (p=0.04). After adjusting for TG, TC, LDL, HDL, SUA, Cr, volume of urine, glomerular hyperfiltration (GH), and hypertension in model 3, FEUA was still linked to an elevated risk of T2D (OR=1.512, 95% CI=1.083–2.111, p=0.015).
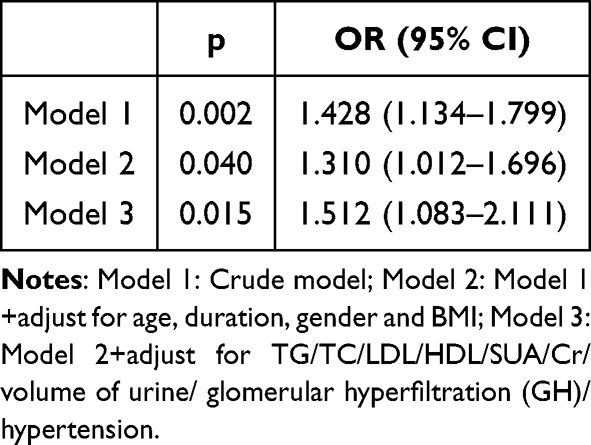 |
Table 7 Association Between FEUA and T2D |
Discussion
According to the newest research, 34.8% of individuals were classified as overweight, while 14.1% were classified as obese in China.30 Meanwhile, MetS, T2D, HUA, and hypertension31 are common complications of obesity. Growing clinical evidence underscores high SUA levels were a potential predictor for a wide range of metabolic disorders, including T2D,14 obesity,32 metabolic syndrome,19 and obesity-related fatty liver.33 Since HUA is more strongly linked to cardiovascular problems17 and metabolic disorders,16 lower cut-offs for HUA have recently been established. However, studies examining the link between uric acid excretion and illnesses were lacking. This cross-sectional study was done to determine whether T2D in HUA outpatients is tied to uric acid excretion levels.
In our study, FEUA was linked to obesity and T2D. Furthermore, as opposed to the non-obesity group, UUAE was higher and FEUA was lower in the obesity group. This study’s prevalence of UA underexcretion, which was 73.2%, was considerably lower than the rate of 85% reported in the previous study.34 It may be due to the different severity of HUA or gout in various individuals. Meanwhile, 13.4% of outpatients with HUA were diagnosed with T2D in our study. A meta-analysis encompassed 38 studies, the prevalence of diabetes was observed to be 19.10% in HUA.35 The observed variation may be attributed to the differences in the selected populations and the smaller number of samples included in our study.
One credible hypothesis posits that insulin resistance serves as a shared pathophysiological underpinning for both diabetes and HUA.36 Adipocytokines or inflammatory mediators may be formed more easily as a result of uric acid, which is believed to reduce the bioactivity of nitric oxide (NO), thereby impacting glucose uptake under insulin stimulation.14 The development and progression of HUA may be driven by hyperinsulinemia following the onset of IR because it transforms the expression of uric acid transporters.25,37 To compensate for elevated blood sugar, diabetic patients often have increased renal glucose excretion. The reduction in SUA levels may help to explain how glycosuria, a given criterion where blood glucose levels rise above the limit of renal reabsorption, has an impact on uricosuric activity.38,39 Furthermore, a study specifically demonstrated a direct correlation between elevated urinary glucose excretion rate (UEGL) and urinary uric acid excretion rate (UEUA).40 As a facilitative glucose transporter, the GLUT9-S transporter is well known for its considerable contribution to the uricosuric impact of glycosuria.41–43 Meanwhile, the production of a hyperfiltration of the glomerular system condition by glycosuria and/or osmotic diuresis may have enormous consequences.44 The current investigation discovered that FEUA was positively connected with a higher risk of diabetes, which is consistent with earlier studies.
Another credible hypothesis posits that inflammation serves as a shared pathophysiological underpinning for both diabetes and HUA. SUA is an inflammatory marker as well and it is a metabolic indicator. Type 2 diabetes mellitus is an inflammatory condition.45 Elevated uric acid has been correlated with glycated hemoglobin.46 Uric acid and uric acid-based markers were also related to diabetes-related disorders such as hypertension,47 hepatic steatosis,48 metabolic syndrome,49 prediabetes,50 and diabetic kidney disease51 and even new-onset diabetes.52 Thus, inflammation could be the common pathway between SUA and diabetes.
One potential factor contributing to HUA in patients with T2D could be a reduced urinary excretion of uric acid (UA), which may result from the compromised impact of insulin.53 Indicators of insulin resistance are closely correlated with blood uric acid levels.39 Furthermore, it is suggested that insulin will increase the reabsorption of uric acid, accompanied by an elevated sodium (Na+) reabsorption within the proximal tubule.54 If insulin is deficient, It may result in a reduction in uric acid reabsorption, which might be the reason why T2D individuals produce more uric acid than usual.
There is a suggestion that insulin resistance could serve as a mediator in the relationship between obesity and HUA. This is because adipocytes are known to potentially exacerbate insulin expression, and insulin itself has been recognized as a contributor to HUA by impeding the excretion of uric acid. Obesity might lead to an augmentation of catabolism within adipose tissue.55 In response to a substantial purine influx, insulin resistance intensifies the reabsorption of uric acid (UA) in Otsuka-Long-Evans-Tokushima Fatty (OLETF) rats, as evidenced by the up-regulation of URAT1 expression. Simultaneously, insulin resistance diminishes UA excretion in these animals.56
At present, there is no uniform boundary for glomerular hyperfiltration (GH) at home and abroad, and a meta-analysis of the GH threshold in 2015, which included 405 studies, showed that different researchers used different thresholds, the 75th-95th percentile above the population was typically chosen to define GH, with a threshold range of 90.7–175mL/min/1.73 m2.57 In our study, greater than the upper quartile of EGFR, that is, EGFR > 112 mL/min/1.73 m2, was defined as GH, and that’s close to the GH threshold of 118 milliliters per minute, or 1.73 m2, set in a large 2018 study by the Mayo Clinic and Cleveland Clinic.58
The exact cause of the high filtration rate in diabetes is unknown. Structural alterations brought on by increased glomerular hemodynamics, vascular activity, and metabolic factors—including mesangial dilation and thickening of the glomerular basement membrane—may be to blame.59 Although it is known that diabetes increases uric acid excretion in the urine through voiding effects, it is unknown whether high filtration also raises the uric acid excretion fraction (FEUA). To rule out any impact that renal hyperfiltration may have on patients with diabetes’ excretion of uric acid, we grouped patients to explore whether renal hyperfiltration rate affects uric acid excretion, interestingly, the high-filtration group had a lower FEUA which was in contrast to the greater FEUA in diabetic patients. On the contrary, a study that included 238 nondiabetic adolescents and 75 adolescents with type 1 diabetes(T1D) showed that FEUA was larger in teenagers with T1D and ultrafiltration compared to counterparts without hyperfiltration.60 The difference in conclusion may be attributed to the type of diabetes, the choice of race, and the duration of the disease. In conclusion, our results indicate that the rise in uric acid excretion in diabetes individuals may not be caused by a rise in renal filtration rate.
Limitations and Future Perspectives
Our study does have certain drawbacks, though. First of all, because this study was cross-sectional, it was unable to establish a link between disease and the amount of uric acid excretion. Secondly, given that the study participants exclusively consisted of individuals with HUA, the findings may not be generalizable to broader populations, thereby lacking in representativeness. Thirdly, numerous variables, such as dietary practices, pharmaceutical use, and genetic predispositions, affected the levels of UUAE. The study’s sample size is quite limited. Large-scale multidisciplinary prospective studies will be required in the future to confirm the link between metabolic illnesses and uric acid excretion.
Conclusion
Increased FEUA Levels Were Significantly Associated with T2D in HUA Patients. And there is a negative correlation between FEUA and BMI, and a positive correlation between UUAE and BMI. Therefore, routine calculating of FEUA is essential for proper diagnosis and appropriate treatment of diabetes in HUA patients. A future longitudinal study with a larger sample size is needed to explore this association further.
Data Sharing Statement
The data set generated and analyzed during the current study is available from the corresponding author upon reasonable request.
Acknowledgments
We would like to gratitude the Ethics Committee of Tianjin Medical University General Hospital for granting permission for this study following the Declaration of Helsinki (approval number: IRB2020-YX-027-01). We are grateful for all participants supplying their informed consent.
Funding
The National Natural Science Foundation of China provided funding for this work (82070854).
Disclosure
The authors report no conflicts of interest in this work.
References
1. Zhang M, Zhu X, Wu J. Prevalence of HUA among Chinese adults: findings from two nationally representative cross-sectional surveys in 2015–16 and 2018–19. Front Immunol. 2021;12:791983. doi:10.3389/fimmu.2021.791983
2. Maiuolo J, Oppedisano F, Gratteri S. Regulation of uric acid metabolism and excretion. Int J Cardiol. 2016;213:8–14.
3. Jalal DI. HUA, the kidneys, and the spectrum of associated diseases: a narrative review. Curr. Med. Res. Opin. 2016;32(11):1863–1869. doi:10.1080/03007995.2016.1218840
4. Dehghan A, van Hoek M, Sijbrands EJ, et al. High serum uric acid as a novel risk factor for type 2 diabetes. Diabetes Care. 2008;31(2):361–362. doi:10.2337/dc07-1276
5. Haque T, Rahman S, Islam S, et al. Assessment of the relationship between serum uric acid and glucose levels in healthy, prediabetic and diabetic individuals. Diabetol Metab Syndr. 2019;11(1):49. doi:10.1186/s13098-019-0446-6
6. Singh SK, Singh R, Singh SK, et al. Prevalence of HUA and the relationship between serum uric acid and hypertension in new onset diabetic patients: a cross-sectional Indian study. Diabetes Metab Syndr Obes. 2022;15:1809–1817. doi:10.2147/DMSO.S363311
7. Ali N, Mahmood S, Islam F, et al. Relationship between serum uric acid and hypertension: a cross-sectional study in Bangladeshi adults. Sci Rep. 2019;9(1):9061. doi:10.1038/s41598-019-45680-4
8. Duan Y, Liang W, Zhu L, et al. Association between serum uric acid levels and obesity among university students (China). Nutr Hosp. 2015;31(6):2407–2411.
9. Ali N, Miah R, Hasan M, et al. Association between serum uric acid and metabolic syndrome: a cross-sectional study in Bangladeshi adults. Sci Rep. 2020;10(1):7841. doi:10.1038/s41598-020-64884-7
10. Ali N, Rahman S, Islam S, et al. The relationship between serum uric acid and lipid profile in Bangladeshi adults. BMC Cardiovasc Disord. 2019;19(1):42. doi:10.1186/s12872-019-1026-2
11. Chen YC, Liu YH, Wu PY, et al. Synergetic association between anemia and HUA on new-onset chronic kidney disease in a large Taiwanese population follow-up study. Int J Environ Res Public Health. 2023;20(2):1421.
12. Toledo-Ibelles P, Gutiérrez-Vidal R, Calixto-Tlacomulco S, et al. Hepatic accumulation of hypoxanthine: a link between HUA and nonalcoholic fatty liver disease. Arch Med Res. 2021;52(7):692–702. doi:10.1016/j.arcmed.2021.04.005
13. Qin L, Yang Z, Gu H, et al. Association between serum uric acid levels and cardiovascular disease in middle-aged and elderly Chinese individuals. BMC Cardiovasc Disord. 2014;14(1):26. doi:10.1186/1471-2261-14-26
14. Wang T, Bi Y, Xu M, et al. Serum uric acid associates with the incidence of type 2 diabetes in a prospective cohort of middle-aged and elderly Chinese. Endocrine. 2011;40(1):109–116. doi:10.1007/s12020-011-9449-2
15. Virdis A, Masi S, Casiglia E, et al. Identification of the uric acid thresholds predicting an increased total and cardiovascular mortality over 20 years. Hypertension. 2020;75(2):302–308. doi:10.1161/HYPERTENSIONAHA.119.13643
16. Maloberti A, Mengozzi A, Russo E, et al. The Results of the URRAH (Uric Acid Right for Heart Health) project: a focus on HUA in relation to cardiovascular and kidney disease and its role in metabolic dysregulation. High Blood Press Cardiovasc Prev. 2023;30(5):411–425. doi:10.1007/s40292-023-00602-4
17. Maloberti A, Vanoli J, Finotto A, et al. Uric acid relationships with lipid profile and adiposity indices: impact of different hyperuricemic thresholds. J Clin Hypertens. 2023;25(1):78–85. doi:10.1111/jch.14613
18. Tsunoda S, Kamide K, Minami J, Kawano Y. Decreases in serum uric acid by amelioration of insulin resistance in overweight hypertensive patients: effect of a low-energy diet and an insulin-sensitizing agent. Am J Hypertens. 2002;15(8):697–701. doi:10.1016/S0895-7061(02)02953-9
19. Li LX, Dong XH, Li MF, et al. Serum uric acid levels are associated with hypertension and metabolic syndrome but not atherosclerosis in Chinese inpatients with type 2 diabetes. J Hypertens. 2015;33(3):482–490. discussion 490. doi:10.1097/HJH.0000000000000417
20. Zheng R, Chen C, Yang T, et al. Serum uric acid levels and the risk of obesity: a longitudinal population-based epidemiological study. Clin Lab. 2017;63(10):1581–1587.
21. Wang H, Wang L, Xie R, et al. Association of serum uric acid with body mass index: a cross-sectional study from Jiangsu Province, China. Iran J Public Health. 2014;43(11):1503–1509.
22. Han Y, Zhang M, Lu J, et al. HUA and overexcretion of uric acid increase the risk of simple renal cysts in type 2 diabetes. Scientific Reports. 2017;7(1):3802. doi:10.1038/s41598-017-04036-6
23. Zhang J, Sun W, Gao F, et al. Changes of serum uric acid level during acute gout flare and related factors. Front Endocrinol. 2023;14:1077059. doi:10.3389/fendo.2023.1077059
24. Xu Y, Zhou X, Zheng Y, et al. The association of urinary uric acid excretion with ambulatory blood pressure values in patients with chronic kidney disease. Clin Hypertens. 2020;26(1):4. doi:10.1186/s40885-020-0136-6
25. Choi HK, De Vera MA, Krishnan E. Gout and the risk of type 2 diabetes among men with a high cardiovascular risk profile. Rheumatology. 2008;47(10):1567–1570. doi:10.1093/rheumatology/ken305
26. Alberti KG, Zimmet PZ. Definition, diagnosis and classification of diabetes mellitus and its complications. Part 1: diagnosis and classification of diabetes mellitus provisional report of a WHO consultation. Diabetic Med. 1998;15(7):539–553. doi:10.1002/(SICI)1096-9136(199807)15:7<539::AID-DIA668>3.0.CO;2-S
27. Zhou BF. Predictive values of body mass index and waist circumference for risk factors of certain related diseases in Chinese adults--study on optimal cut-off points of body mass index and waist circumference in Chinese adults. Biomed Environ Sci. 2002;15(1):83–96.
28. Iwata Y, Notsu S, Kawamura Y, et al. The effect of dapagliflozin on uric acid excretion and serum uric acid level in advanced CKD. Sci Rep. 2023;13(1):4849. doi:10.1038/s41598-023-32072-y
29. Levey AS, Stevens LA, Schmid CH, et al. A new equation to estimate glomerular filtration rate. Ann Internal Med. 2009;150(9):604–612. doi:10.7326/0003-4819-150-9-200905050-00006
30. Chen K, Shen Z, Gu W, et al. Prevalence of obesity and associated complications in China: a cross-sectional, real-world study in 15.8 million adults. Diabetes Obesity Metab. 2023;25(11):3390–3399. doi:10.1111/dom.15238
31. Shah W, Ali I, Shahid W, et al. Obesity prevalence factors associated with sympathetic overactivity and hypertension. Neurol Clin Neurosci. 2023;11(6):310–315. doi:10.1111/ncn3.12765
32. Chen MY, Zhao CC, Li TT, et al. Serum uric acid levels are associated with obesity but not cardio-cerebrovascular events in Chinese inpatients with type 2 diabetes. Sci Rep. 2017;7(1):40009. doi:10.1038/srep40009
33. Liu CQ, He CM, Chen N, et al. Serum uric acid is independently and linearly associated with risk of nonalcoholic fatty liver disease in obese Chinese adults. Sci Rep. 2016;6(1):38605. doi:10.1038/srep38605
34. Nakamura T, Takagi K, Ueda T. Dynamics of uric acid metabolism in HUA. Nihon rinsho Japan J Clin Med. 1996;54(12):3230–3236.
35. Jiang J, Zhang T, Liu Y, et al. Prevalence of diabetes in patients with HUA and gout: a systematic review and meta-analysis. Current Diabetes Reports. 2023;23(6):103–117. doi:10.1007/s11892-023-01506-2
36. Nutmakul T. A review on benefits of quercetin in HUA and gouty arthritis. Saudi Pharm J. 2022;30(7):918–926. doi:10.1016/j.jsps.2022.04.013
37. Chen-Xu M, Yokose C, Rai SK, et al. Contemporary prevalence of gout and HUA in the United States and decadal trends: the national health and nutrition examination survey, 2007–2016. Arthritis Rheumatol. 2019;71(6):991–999. doi:10.1002/art.40807
38. Herman JB, Goldbourt U. Uric acid and diabetes: observations in a population study. Lancet. 1982;2(8292):240–243. doi:10.1016/S0140-6736(82)90324-5
39. Choi HK, Ford ES. Haemoglobin A1c, fasting glucose, serum C-peptide and insulin resistance in relation to serum uric acid levels--the third national health and nutrition examination survey. Rheumatology. 2008;47(5):713–717. doi:10.1093/rheumatology/ken066
40. Qin Y, Zhang S, Cui S, et al. High urinary excretion rate of glucose attenuates serum uric acid level in type 2 diabetes with normal renal function. J Endocrinol Invest. 2021;44(9):1981–1988. doi:10.1007/s40618-021-01513-8
41. Augustin R, Carayannopoulos MO, Dowd LO, et al. Identification and characterization of human glucose transporter-like protein-9 (GLUT9): alternative splicing alters trafficking. J Biol Chem. 2004;279(16):16229–16236. doi:10.1074/jbc.M312226200
42. Lytvyn Y, Škrtić M, Yang GK, et al. Glycosuria-mediated urinary uric acid excretion in patients with uncomplicated type 1 diabetes mellitus. Am J Physiol Renal Physiol. 2015;308(2):F77–F83. doi:10.1152/ajprenal.00555.2014
43. Chino Y, Samukawa Y, Sakai S, et al. SGLT2 inhibitor lowers serum uric acid through alteration of uric acid transport activity in renal tubule by increased glycosuria. Biopharm Drug Dispos. 2014;35(7):391–404. doi:10.1002/bdd.1909
44. Gilbert RE. Sodium-glucose linked transporter-2 inhibitors: potential for renoprotection beyond blood glucose lowering? Kidney Int. 2014;86(4):693–700. doi:10.1038/ki.2013.451
45. Aktas G, Atak Tel BM, Tel R, Balci B. Treatment of type 2 diabetes patients with heart conditions. Expert Rev Endocrinol Metab. 2023;18(3):255–265. doi:10.1080/17446651.2023.2204941
46. Duman TT, Kocak MZ, Atak BM, Erkus E. Serum Uric acid is correlated with HbA1c levels in type 2 diabetes mellitus. Exp Biomed Res. 2018;1(1):6–9. doi:10.30714/j-ebr.2018136918
47. Aktas G, Khalid A, Kurtkulagi O, et al. Poorly controlled hypertension is associated with elevated serum uric acid to HDL-cholesterol ratio: a cross-sectional cohort study. Postgrad Med. 2022;134(3):297–302. doi:10.1080/00325481.2022.2039007
48. Kosekli M, Kurtkulagii O, Kahveci G, et al. The association between serum uric acid to high density lipoprotein-cholesterol ratio and non-alcoholic fatty liver disease: the abund study. Revista da Associacao Medica Brasileira. 2021;67(4):549–554. doi:10.1590/1806-9282.20201005
49. Kocak MZ, Aktas G, Erkus E, et al. Serum uric acid to HDL-cholesterol ratio is a strong predictor of metabolic syndrome in type 2 diabetes mellitus. Rev Assoc Med Bras. 2019;65(1):9–15. doi:10.1590/1806-9282.65.1.9
50. Balci SB, Atak BM, Duman T, et al. A novel marker for prediabetic conditions: uric acid-to-HDL cholesterol ratio. Bratisl Med J. 2023;125(3):145–148.
51. Aktas G, Yilmaz S, Kantarci DB, et al. Is serum uric acid-to-HDL cholesterol ratio elevation associated with diabetic kidney injury? Postgrad Med. 2023;135(5):519–523. doi:10.1080/00325481.2023.2214058
52. Ali Kosekli M. Serum uric acid to HDL cholesterol ratio is associated with diabetic control in new onset Type 2 diabetic population. Acta Clinica Croatica. 2023. doi:10.20471/acc.2023.62.02.04
53. Corry DB, Eslami P, Yamamoto K, et al. Uric acid stimulates vascular smooth muscle cell proliferation and oxidative stress via the vascular renin-angiotensin system. J Hypertens. 2008;26(2):269–275. doi:10.1097/HJH.0b013e3282f240bf
54. Quiñones Galvan A, Natali A, Baldi S, et al. Effect of insulin on uric acid excretion in humans. A J Physiol. 1995;268(1 Pt 1):E1–5. doi:10.1152/ajpendo.1995.268.1.E1
55. Tsushima Y, Nishizawa H, Tochino Y, et al. Uric acid secretion from adipose tissue and its increase in obesity. J Biol Chem. 2013;288(38):27138–27149. doi:10.1074/jbc.M113.485094
56. Miao Z, Yan S, Wang J, et al. Insulin resistance acts as an independent risk factor exacerbating high-purine diet induced renal injury and knee joint gouty lesions. Inflammation Res. 2009;58(10):659–668. doi:10.1007/s00011-009-0031-9
57. Cachat F, Combescure C, Cauderay M, et al. A systematic review of glomerular hyperfiltration assessment and definition in the medical literature. Clin J Am Soc Nephrol. 2015;10(3):382–389. doi:10.2215/CJN.03080314
58. Chakkera HA, Denic A, Kremers WK, et al. Comparison of high glomerular filtration rate thresholds for identifying hyperfiltration. Nephrol Dial Transplant. 2020;35(6):1017–1026. doi:10.1093/ndt/gfy332
59. Remuzzi G, Benigni A, Remuzzi A. Mechanisms of progression and regression of renal lesions of chronic nephropathies and diabetes. J Clin Invest. 2006;116(2):288–296. doi:10.1172/JCI27699
60. Santucci MP, Muzzio ML, Peredo MS, et al. Different alterations of glomerular filtration rate and their association with uric acid in children and adolescents with type 1 diabetes or with overweight/obesity. Pediatr Diabetes. 2020;21(4):657–663. doi:10.1111/pedi.13008
 © 2024 The Author(s). This work is published and licensed by Dove Medical Press Limited. The full terms of this license are available at https://www.dovepress.com/terms.php and incorporate the Creative Commons Attribution - Non Commercial (unported, v3.0) License.
By accessing the work you hereby accept the Terms. Non-commercial uses of the work are permitted without any further permission from Dove Medical Press Limited, provided the work is properly attributed. For permission for commercial use of this work, please see paragraphs 4.2 and 5 of our Terms.
© 2024 The Author(s). This work is published and licensed by Dove Medical Press Limited. The full terms of this license are available at https://www.dovepress.com/terms.php and incorporate the Creative Commons Attribution - Non Commercial (unported, v3.0) License.
By accessing the work you hereby accept the Terms. Non-commercial uses of the work are permitted without any further permission from Dove Medical Press Limited, provided the work is properly attributed. For permission for commercial use of this work, please see paragraphs 4.2 and 5 of our Terms.