")
Back to Journals » Therapeutics and Clinical Risk Management » Volume 18
Extensive Radiological Manifestation in Patients with Diabetes and Pulmonary Tuberculosis: A Cross-Sectional Study
Authors Zhan S, Juan X , Ren T, Wang Y, Fu L , Deng G , Zhang P
Received 20 February 2022
Accepted for publication 16 May 2022
Published 23 May 2022 Volume 2022:18 Pages 595—602
DOI https://doi.org/10.2147/TCRM.S363328
Checked for plagiarism Yes
Review by Single anonymous peer review
Peer reviewer comments 2
Editor who approved publication: Dr Deyun Wang
Senlin Zhan,1,* Xiong Juan,2,* Tantan Ren,1 Yuxiang Wang,1 Liang Fu,1 Guofang Deng,1 Peize Zhang1
1Department of Pulmonary Medicine and Tuberculosis, The Third People’s Hospital of Shenzhen, Shenzhen, Guangdong, People’s Republic of China; 2School of Public Health, Health Science Center, Shenzhen University, Shenzhen, Guangdong, People’s Republic of China
*These authors contributed equally to this work
Correspondence: Guofang Deng; Peize Zhang, Email [email protected]; [email protected]
Background: Diabetes mellitus (DM) is believed to affect tuberculosis (TB) at multiple levels in disease control and treatment efficacy, but clinical and radiological presentation resulting from interaction of the two diseases is not known.
Methods: A cross-sectional study was conducted on data obtained from medical records of 438 patients confirmed with TB-DM comorbidity at the Third people’s hospital of Shenzhen from May 01, 2014, to April 30, 2019. Their CT images were reviewed, and patients were divided into subgroups according to lung cavitation: with and without cavities, and number of segments showing pulmonary infiltration: < 4 segment, 4– 8 segment, > 8 segment infiltrates. We then compared clinical parameters between these groups.
Results: The median age of the patients was 50.0 years (IQR 43.3– 56.0) and 86% (n=375) of them were male. Pulmonary cavities were found in 80.8% patients. About 42.7% and 27.2% patients were seen to have infiltration involving 4– 8 and > 8 lung segments, respectively. Patients presented with cavitation and infiltration involving a greater number of lung segments had significantly higher values of WBC, MONO%, GRA%, CRP, lower LYN% level and higher bacterial burden in sputum (P< 0.001). Higher HbA1c and FBG were only observed in patients with lung cavities (P< 0.001). There was no difference in positive ELISPOT.TB and PCT level between the groups regardless of presence or absence of lung cavity (P> 0.9 and P=0.1 respectively). Lower HGB, ALB and higher PCT were observed in patients with infiltration involving more lung segments.
Conclusion: Hyper-inflammation in peripheral blood was significantly associated with cavity and the number of lung lesions. Hyperglycemia was significantly associated with the development of lung cavity. Glycemic control and inflammation influenced radiographic manifestations in patients with TB-DM.
Keywords: diabetes mellitus, tuberculosis, lung cavity, lung infiltration, radiography
Background
Diabetes mellitus (DM) and Tuberculosis (TB) are converging health conditions and represents an immense public health concern across the globe. DM has been reported to be a known risk factor for TB and complicates disease management and control.1 DM is also believed to affect clinical and radiological manifestations of pulmonary tuberculosis. It has been demonstrated in numerous studies that co-existing DM and TB conditions may induce an increased frequency of pulmonary atypical manifestation, including lower lobe lung opacity, occurrence of more lung lesions, cavity and extensive parenchymal involvement. Moreover, it was indicated that radiological manifestations are potentially correlated with glycemic control in DM.2–4 Cavitation is a rather severe event of pulmonary tuberculosis and is mostly associated with an increased risk of disease transmission and poor treatment outcomes, including delayed sputum culture conversion, relapse, development of drug resistance.5 Impaired immune response in patients with diabetes increased bacterial load and inflammation, thus leaded to necrosis and bacterial dissemination.6 In this study, we analyzed laboratory results and thoracic computed tomographic (CT) scan findings recorded at the time diagnosis was confirmed from patients with co-existing DM and TB to find out related inflammation factors associated with severe pulmonary manifestation.
Methods and Materials
Study Design and Participants
We conducted a cross-sectional study to explore the relationship between pulmonary CT scan features and clinical characteristics. We reviewed 1106 patients that were diagnosed with DM and TB at the Third People’s Hospital of Shenzhen from May 1, 2014 to April 30, 2019. Diabetes and active pulmonary tuberculosis are defined according to the WHO diagnostic criteria launched between 1999 and 2013.7,8 The inclusion criteria of this study are (1) age ≥ 18 years, (2) newly confirmed diagnosis of DM-TB followed national standard, (3) patients who were not already on anti-TB treatment or had started regime in no more than 3 days prior to enrollment, (4) chest CT performed in our hospital and complete results recorded. The exclusion criteria are (1) HIV co-infection, corticosteroid/cytotoxic drugs taken within 3 months before disease onset. (2) pulmonary tuberculosis relapse (3) No pulmonary CT scans taken at diagnosis confirmation. Reason for excluding patients with HIV and immune compromised conditions is that impaired immune states has been shown to impact the CT image performance.9 Patients with previous tuberculosis were excluded as pulmonary structural damage could remain and lead to misjudgment of CT manifestation. Finally, 438 patients were enrolled in this study (Figure 1). This study was approved by the Ethical Committee of the third people’s hospital of Shenzhen (IRB number: 2021-014-02). Written informed consent of patients were waived by the Ethic Committee as all clinical data were extracted from the medical system and personal information of any patient was masked. The hospital undertook that in using these data no personal information of any patients was involved and complied with the Declaration of Helsinki in regard to confidentiality and ethical standards.
 |
Figure 1 Flowchart of the participants. |
Data Collection
Demographic, clinical and laboratory data were obtained from medical records for all eligible patients. The information recorded included patient demographics, medical history, underlying comorbidities, laboratory findings and glycemic control status. Laboratory findings included white blood cell (WBC) count, neutrophilic granulocyte (GRA), lymphocyte (LYN), C-reactive protein (CRP), procalcitonin (PCT), hemoglobin (HGB), Monocyte (MONO) and serum albumin (ALB). Glycemic control status included free blood glucose (FBG) and the level of Hemoglobin A1C (HbA1c) when diagnosis was confirmed.
Patients with suspected pulmonary tuberculosis were sent for chest thin-section CT scan at administration. The CT scanners used in our study included General Electric (GE) Revolution CT256, LightSpeed 16 and CT64 from United Imaging. The scanning protocols were as follows: tube voltage, 120 kV; automatic tube current (180–400 mA); iterative reconstruction; 64 mm detector; rotation time, 0.35 s; slice thickness, 1 mm; collimation, 0.625 mm; pitch, 1.5; matrix, 512 × 512; and breath hold at full inspiration. Reconstruction kernel used was lung smooth with a thickness of 1 mm and an interval of 0.8 mm. Lung windows with window width 1200 HU and window level-600 HU were used for image reading.
All patients’ CT images were reviewed by a trained team of physicians and radiologists at The Third People’s Hospital of Shenzhen. Chest CT scans were examined on the occurrence and number of lung cavity. The definition of lung cavity was as below: 1. caseous consolidation with multiple cavities (diameter≥5mm) without walls (Figure 2A), 2. Nodule with cavity diameter≥5mm, cavity wall≥1mm (Figure 2B). Lung infiltration was defined as consolidation, nodule, opacity and tree-in-bud in every lobe (Figure 2C and D), which were confirmed with the commonly used definition.10 The 438 eligible patients were categorized into cavity and non-cavity group based on lung cavitation status. Based on the number of segments showing lung infiltration, we also stratified these patients into three clinically distinctive subgroups: <4 segment infiltration, 4–8 segment infiltration and >8 segment infiltration. We then compared clinical characteristics variations across these subgroups.
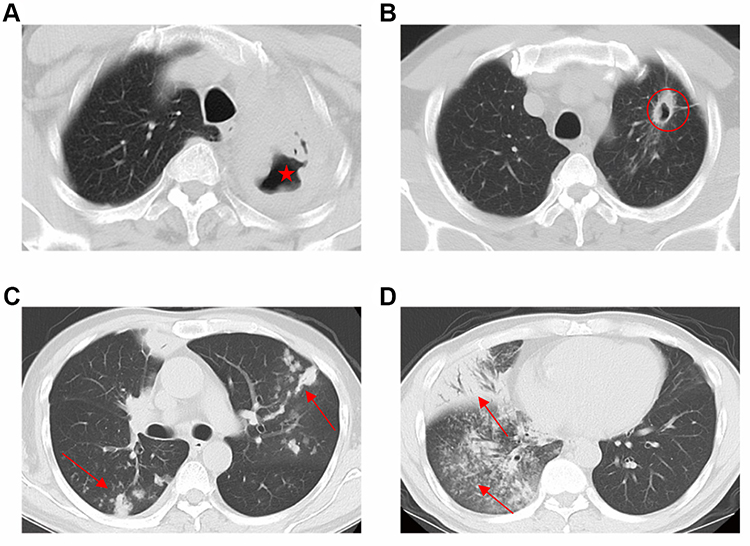 |
Figure 2 Cavities and multi-lobe infiltration on chest CT. (A) caseous consolidation with multiple cavities (diameter≥5mm) without walls (red star); (B) Nodule with cavity diameter≥5mm, cavity wall≥1mm (red circle). (C and D) Lung infiltration was defined as consolidation, nodule, opacity in every lobe (red arrow). |
Statistical Analyses
All statistical analyses were performed by the R software program (version 4.1.0; R Project for Statistical Computing, Vienna, Austria). Descriptive statistics were calculated for each variable. All continuous variables were examined for normality by Shapiro–Wilk test. We present all continuous variables as median and interquartile range (IQR). Categorical variables were expressed as percentage and frequency. Wilcoxon rank sum or Kruskal–Wallis test was used to compare continuous variables among different groups. Chi-squared tests of independence were used to explore the relationship between the subgroups and categorical variables. P-value < 0.05 was considered statistically significant, and all reported P-values were two-sided.
Results
Baseline demographic and clinical characteristics of the 438 patients included in the study were presented in Table 1. The median age was 50.0 years (IQR 43.3–56.0) and 86% (n=375) of them were male. 11.6% were hepatitis B virus (HBV)-coinfected, 17.1% had cardiac diseases and 1.1% were on dialysis. More than 80% patients had microbial results and glycemic results. 86.8% patients had enzyme-linked immune-spot tuberculosis (ELISPOT.TB) assay. Chest CT Imaging revealed lung cavities in 80.8% patients. 42.7% patients exhibited infiltration involving 4–8 lung segments. Comparison of clinical parameters based on cavitation status (Table 2) revealed a significant gender difference between patients with and without lung cavity (P=0.006). Proportion of sputum smear, DNA and culture positive patients were significantly higher in the cavity group than non-cavity group (P<0.001). Patients with cavity were also noted to have significantly higher values of WBC, MONO%, GRA%, HbA1c, FBG and CRP. Intriguingly, the cavity group had lower LYN level. No significant differences were observed between the two groups in age, ELISPOT.TB, HGB and ALB.
 |
Table 1 Sociodemographic and Clinical Characteristics of the Participants |
 |
Table 2 Characteristics of Participants Stratified by Presence or Absence of Lung Cavity |
In addition to the above comparison, patients were also divided into 3 subgroups according to the number of lung segments involving infiltration: <4 segment (n=132), ≥4 and ≤8 segment (n=187), and >8 segment (n=119). The severity of disease was shown to be positively related to the number of segments involved. The difference in patients’ characteristic amongst the three subgroups are summarized in Table 3. There was significant difference amongst three subgroups in bacterial positivity, WBC, GRA, LYN, MONO, HGB, CRP, PCT and ALB. Patients with more segment involvement tend to have higher value of WBC, GRA, CRP and PCT, lower level of LYN, HGB and ALB. However, there were no significant differences amongst the three subgroups for HbA1c and FBG.
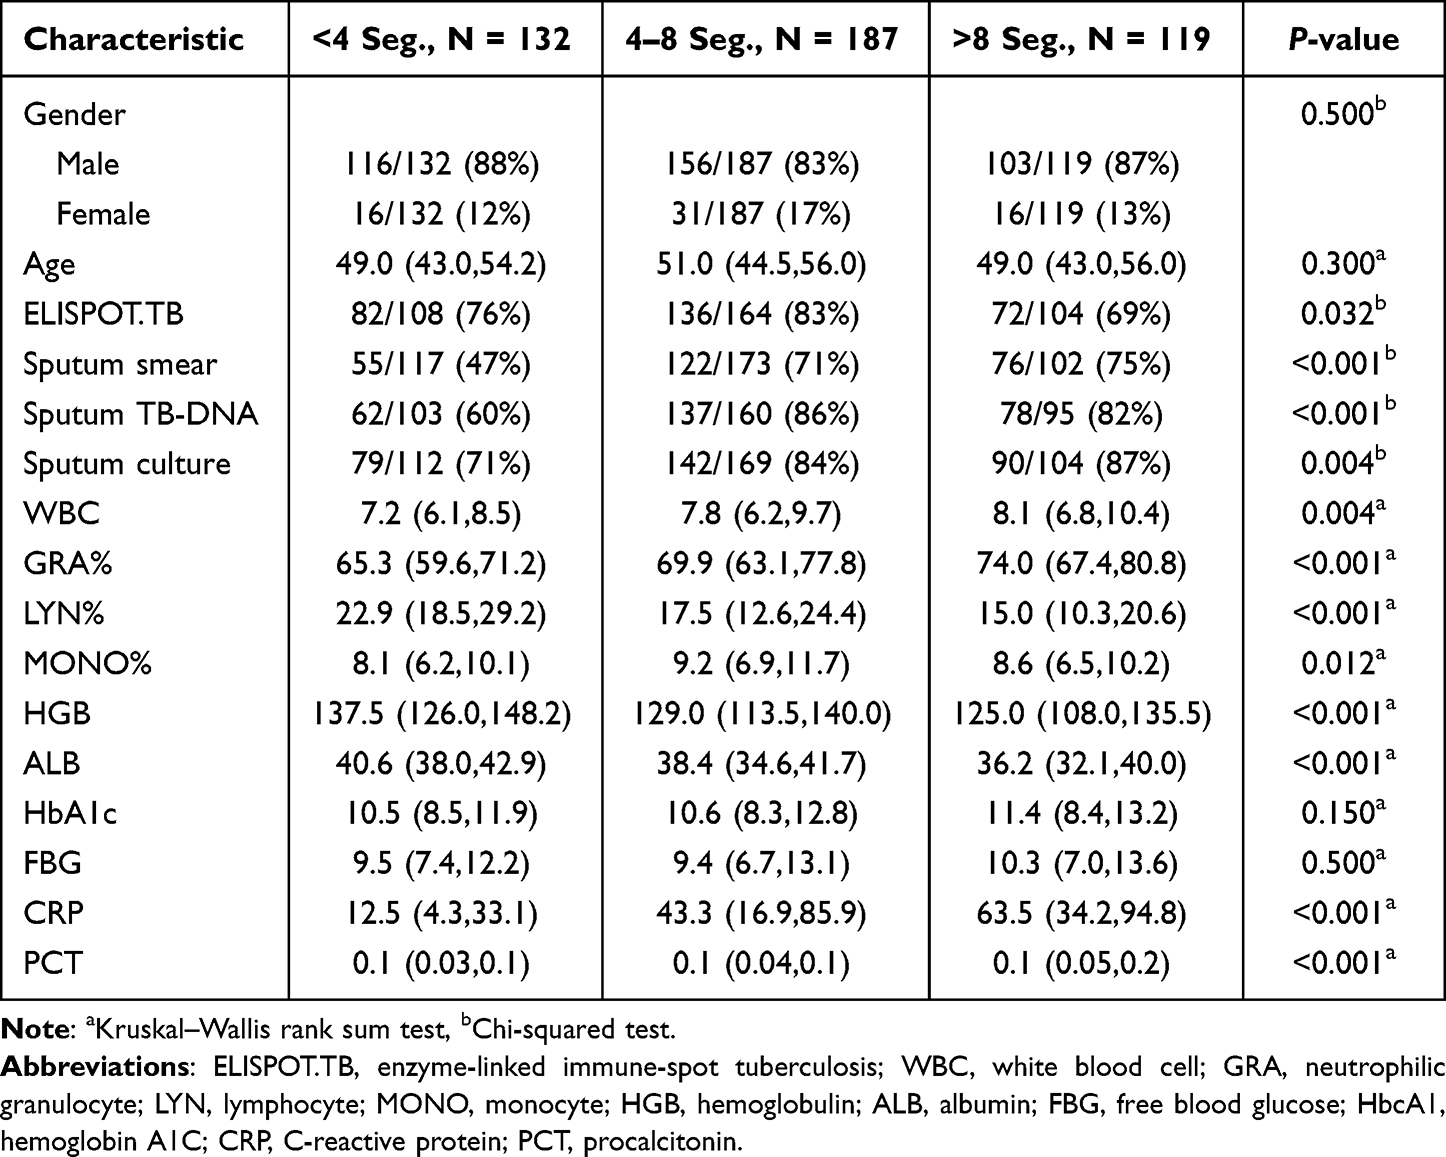 |
Table 3 Characteristics of Participants Stratified by Number of Lung Segments Showing Infiltrates |
Discussion
The dual disease burden of tuberculosis and diabetes (DM-TB) poses substantial challenges to diagnosis and treatment approach. Hyperglycemia is shown to be associated with severe tuberculosis, delayed culture conversion and poor prognosis. How diabetes impact pulmonary radiological manifestations is still unclear.
Previous studies demonstrated that hyperglycemia increased the risk of pulmonary TB incidence and was strongly associated with worsen pulmonary radiographic manifestation in TB patients.11 TB patients with hyperglycemia presented with cavities and alveolar infiltrates more frequently than those with normoglycemia.12,13 Patients with uncontrolled diabetes with HbA1c > 9% were more likely to exhibit an increased number of cavities in lower lung field and more lobe involvement on chest CT.12 Our findings indicated that multiple pulmonary cavities were often associated with HbA1c and FBG, which were commonly taken as indexes for glycemia control. We also indicated that severe radiographic manifestations were associated with a systemic hyper-inflammation state characterized by elevation of WBC counts, neutrophil, monocyte, CRP and decreased lymphocyte and in serum. Impaired innate immune responses had been described in many studies for patients with diabetes.6,14 Hyperglycemia combined with oxidative stress induce higher cytokines IL-17A, IL-8, and IL-10 in the lung, which contributes to an exacerbated proinflammatory response.15,16 Some other components of innate immunity such as the function of neutrophils, macrophages, DC, NK cells are drastically compromised in individuals with DM, which leads to delayed antigen presentation and impaired microbicidal activity.14–17 Persistent inflammation has been observed during anti-TB treatment in patients with diabetes.18 We then inferred that over-expression of cytokines, such as CRP in TB-DM patients were associated with escalating neutrophil recruitment and infiltration, which led to more inflammation and necrosis, and then potentially resulted in cavity formation.
Another mechanism contributing to the severe inflammation is adaptive immune dysfunction. Impaired T helper 1 cell lowers production of IFNγ, which weaken the killing activity of macrophages and leads to failing control of mycobacterium growth.6 High bacterial load and over inflammation in turn gives rise to development of more extensive lung lesions, cavitation and infiltration extending to more lobes.19 Of note, our findings also indicated that decreased serum lymphocyte was linked to severe radiographic presentation of pulmonary TB, which also suggested that compromised adaptive immune might play an important role in the onset of active TB in patients with diabetes.20
In addition, we noted from the findings that the level of HGB and ALB were lower in patients with multi-fragment infiltration. Individuals with malnutrition have been reported to be associated with severe pulmonary manifestation.21 We believed that lower HGB and ALB in serum are indicative biomarkers of malnutrition and severe disease. It is also noteworthy that PCT level is seen to increase slightly in patients with more lung infiltration. PCT used to be taken as a robust biomarker for bacterial infection and sepsis.22 It has been used to differentiate pulmonary tuberculosis from other pulmonary infections.23 We thus speculated that bacterial co-infection should be noticed in patients with diffuse lung infiltration. Previous studies showed that increased mycobacterial loads and higher proportions of smear positivity in hyperglycemic patients,3,24,25 our findings were in agreement and demonstrated that positive microbial results were frequently found in DM patients with pulmonary cavity and severe segment infiltration. The more severe the radiological manifestations, the heavier the bacterial burden.
There are some limitations in our study. Firstly, causal relationship between diabetes and severe radiological manifestation could not be set up according to our cross-sectional study design. Secondly, discrepancies driven by age, from symptom onset to diagnosis, clinical presentation and even other immune compromised factors were not stratified and further analyzed. Nevertheless, this internal analysis demonstrated an association between glycemic status, hyper-inflammation and the presentation of pulmonary lesions in TB-DM comorbidities.
Conclusions
In summary, our findings revealed that severe radiological presentation in pulmonary TB patients with diabetes was associated with both hyperglycemia and a systemic pro-inflammatory state characterized by elevation in the level of WBC counts, neutrophil and serum CRP, whereas lymphocyte levels were decreased, suggesting immune disorder. Strict glycemic control and inflammation alleviation are crucial in lung protection.
Abbreviations
DM, diabetes mellitus; TB, tuberculosis; CT, computed tomographic; WBC, white blood cell; GRA, neutrophilic granulocyte; LYN, lymphocyte; CRP, C-reactive protein; PCT, procalcitonin; HGB, hemoglobulin; MONO, monocyte; ALB, albumin; FBG, free blood glucose; HbcA1, hemoglobin A1C; IQR, interquartile range; ELISPOT.TB, enzyme-linked immune-spot tuberculosis; HBV, hepatitis B virus.
Data Sharing Statement
All original data used in the study has been de-identified and are available from the corresponding author on request.
Ethics Approval and Consent to Participate
This study was approved by the Ethical Committee of the third people’s hospital of Shenzhen for the national key project for infectious diseases. Informed consents were waived by the Ethic Committee as all clinical data were extracted from the medical system and personal information of any patient was masked. The hospital undertook that in using these data no personal information of any patients was involved and complied with the Declaration of Helsinki in regard to confidentiality and ethical standards.
Acknowledgments
The authors thank all participants for their participation in this study. The authors are grateful for the continued academic support from the National Clinical Research Center for Infectious Disease in China and Clinical Research Center for Infectious Diseases (tuberculosis) of Guangdong Province.
Funding
This study was funded by Technology Project of Guangdong Province (2020B1111170014) a Research Project of Shenzhen Third People's Hospital (G2021010)which are government funds for the research of tuberculosis treatment and control. JX was supported by the Medical Scientific Research Foundation of Guangdong Province of China (A2020405).
Disclosure
The authors declare no conflicts of interest in this study.
References
1. Kyu HH, Maddison ER, Henry NJ; GBD Tuberculosis Collaborators. Global, regional, and national burden of tuberculosis, 1990–2016: results from the global burden of diseases, injuries, and risk factors 2016 study. Lancet Infect Dis. 2018;18(12):1329–1349. doi:10.1016/S1473-3099(18)30625-X
2. Huang LK, Wang HH, Lai YC, Chang SC. The impact of glycemic status on radiological manifestations of pulmonary tuberculosis in diabetic patients. PLoS One. 2017;12(6):e0179750. doi:10.1371/journal.pone.0179750
3. Magee MJ, Kempker RR, Kipiani M, et al. Diabetes mellitus is associated with cavities, smear grade, and multidrug-resistant tuberculosis in Georgia. Int J Tuberc Lung Dis. 2015;19(6):685–692. doi:10.5588/ijtld.14.0811
4. Chiang CY, Lee JJ, Chien ST, et al. Glycemic control and radiographic manifestations of tuberculosis in diabetic patients. PLoS One. 2014;9(4):e93397. doi:10.1371/journal.pone.0093397
5. Urbanowski ME, Ordonez AA, Ruiz-Bedoya CA, Jain SK, Bishai WR. Cavitary tuberculosis: the gateway of disease transmission. Lancet Infect Dis. 2020;20(6):117–128. doi:10.1016/S1473-3099(20)30148-1
6. Ayelign B, Negash M, Genetu M, Wondmagegn T, Shibabaw T. Immunological Impacts of diabetes on the susceptibility of mycobacterium tuberculosis. J Immunol Res. 2019;2019:6196532. doi:10.1155/2019/6196532
7. WHO. Use of glycated haemoglobin (HbA1c) in the diagnosis of diabetes mellitus. 2011. www.who.int/diabetes/publications/report-hba1c_2011.pdf.
8. WHO. Systematic Screening for Active Tuberculosis. Principles and Recommendations. 2013. https://www.who.int/publications/i/item/9789241548601.
9. Han S, Yoon SH, Goo JM, Yim JJ. Radiological features and progression of incipient active pulmonary tuberculosis according to risk factors. Int J Tuberc Lung Dis. 2019;23(6):698–706. doi:10.5588/ijtld.18.0541
10. Richard Webb W, Nestor LM, Naidich DP. High-Resolution CT of the Lung.
11. Viney K, Mills T, Harley D. Tuberculosis and diabetes mellitus: a dose-response relationship between the odds of tuberculosis and HbA1c. Int J Tuberc Lung Dis. 2019;23(10):1055–1059. doi:10.5588/ijtld.18.0657
12. Zafar MI, Chen LL, Xiaofeng Y, Gao F. Impact of diabetes mellitus on radiological presentation of pulmonary tuberculosis in otherwise non-immunocompromised patients: a systematic review. Curr Med Imaging Rev. 2019;15(6):543–554. doi:10.2174/1573405614666180806124416
13. Barreda NN, Arriaga MB, Aliaga JG, et al. Severe pulmonary radiological manifestations are associated with a distinct biochemical profile in blood of tuberculosis patients with dysglycemia. BMC Infect Dis. 2020;20(1):139. doi:10.1186/s12879-020-4843-0
14. Kumar Nathella P, Babu S. Influence of diabetes mellitus on immunity to human tuberculosis. Immunology. 2017;152(1):13–24. doi:10.1111/imm.12762
15. Podell BK, Ackart DF, Obregon-Henao A, et al. Increased severity of tuberculosis in Guinea pigs with type 2 diabetes: a model of diabetes-tuberculosis comorbidity. Am J Pathol. 2014;184(4):1104–1118. doi:10.1016/j.ajpath.2013.12.015
16. Yew WW, Leung CC, Zhang Y. Oxidative stress and TB outcomes in patients with diabetes mellitus? J Antimicrob Chemother. 2017;72(6):1552–1555. doi:10.1093/jac/dkx046
17. Martinez N, Kornfeld H. Diabetes and immunity to tuberculosis. Eur J Immunol. 2014;44(3):617–626. doi:10.1002/eji.201344301
18. Kumar NP, Fukutani KF, Shruthi BS, et al. Persistent inflammation during anti-tuberculosis treatment with diabetes comorbidity. Elife. 2019;8:e46477. doi:10.7554/eLife.46477
19. Orme IM, Robinson RT, Cooper AM. The balance between protective and pathogenic immune responses in the TB-infected lung. Nat Immunol. 2015;16(1):57–63. doi:10.1038/ni.3048
20. Li K, Ran R, Jiang Z, Fan C, Li T, Yin Z. Changes in T-lymphocyte subsets and risk factors in human immunodeficiency virus-negative patients with active tuberculosis. Infection. 2020;48(4):585–595. doi:10.1007/s15010-020-01451-2
21. Hoyt KJ, Sarkar S, White L, et al. Effect of malnutrition on radiographic findings and mycobacterial burden in pulmonary tuberculosis. PLoS One. 2019;14(3):e0214011. doi:10.1371/journal.pone.0214011
22. Westwood M, Ramaekers B, Whiting P, et al. Procalcitonin testing to guide antibiotic therapy for the treatment of sepsis in intensive care settings and for suspected bacterial infection in emergency department settings: a systematic review and cost-effectiveness analysis. Health Technol Assess. 2015;19(96):1–236. doi:10.3310/hta19960
23. Huang SL, Lee HC, Yu CW, et al. Value of procalcitonin in differentiating pulmonary tuberculosis from other pulmonary infections: a meta-analysis. Int J Tuberc Lung Dis. 2014;18(4):470–477. doi:10.5588/ijtld.13.0449
24. Park SW, Shin JW, Kim JY, et al. The effect of diabetic control status on the clinical features of pulmonary tuberculosis. Eur J Clin Microbiol Infect Dis. 2012;31(7):1305–1310. doi:10.1007/s10096-011-1443-3
25. Hongguang C, Min L, Shiwen J, et al. Impact of diabetes on clinical presentation and treatment outcome of pulmonary tuberculosis in Beijing. Epidemiol Infect. 2015;143(1):150–156. doi:10.1017/S095026881400079X
 © 2022 The Author(s). This work is published and licensed by Dove Medical Press Limited. The full terms of this license are available at https://www.dovepress.com/terms.php and incorporate the Creative Commons Attribution - Non Commercial (unported, v3.0) License.
By accessing the work you hereby accept the Terms. Non-commercial uses of the work are permitted without any further permission from Dove Medical Press Limited, provided the work is properly attributed. For permission for commercial use of this work, please see paragraphs 4.2 and 5 of our Terms.
© 2022 The Author(s). This work is published and licensed by Dove Medical Press Limited. The full terms of this license are available at https://www.dovepress.com/terms.php and incorporate the Creative Commons Attribution - Non Commercial (unported, v3.0) License.
By accessing the work you hereby accept the Terms. Non-commercial uses of the work are permitted without any further permission from Dove Medical Press Limited, provided the work is properly attributed. For permission for commercial use of this work, please see paragraphs 4.2 and 5 of our Terms.