")
Back to Journals » Integrated Pharmacy Research and Practice » Volume 13
Evaluation of Rational Medicines Use Based on World Health Organization Core Indicators: A Cross-Sectional Study in Five Health Districts in Mauritania
Authors Ag Ahmed MA , Ravinetto R, Diop K, Trasancos Buitrago V, Dujardin C
Received 1 November 2023
Accepted for publication 18 March 2024
Published 28 March 2024 Volume 2024:13 Pages 17—29
DOI https://doi.org/10.2147/IPRP.S447664
Checked for plagiarism Yes
Review by Single anonymous peer review
Peer reviewer comments 2
Editor who approved publication: Dr Walid Al-Qerem
Mohamed Ali Ag Ahmed,1,2 Raffaella Ravinetto,3,4 Khadijetou Diop,5 Verónica Trasancos Buitrago,6 Catherine Dujardin6
1Sherpa University Institute, Montreal, Québec, Canada; 2Management, Evaluation and Health Policy Department. University of Montreal, Montreal, Québec, Canada; 3Department of Public Health. Institute of Tropical Medicine, Antwerp, Belgium; 4University of the Western Cape, Cape Town, South Africa; 5Freelance Consultant, Nouachott, Mauritania; 6Mauritania Mission, Enabel, Nouakchott, Mauritania
Correspondence: Mohamed Ali Ag Ahmed, Email [email protected]
Introduction: The rational use of medicines is essential for preventing adverse medicine reactions, achieving therapeutic outcomes, and optimizing treatment costs. While the irrational use of medicines is frequently reported in sub-Saharan Africa, to the best of our knowledge no formal studies have taken place in Mauritania thus far. The main objective of this study was therefore to analyze the rational use of medicines in public and private not-for-profit health facilities, in five health districts in Mauritania.
Methods: We conducted a cross-sectional study to assess the rational use of medicines. We used the standard indicators derived from the methodologies of the World Health Organization (WHO) and International Network for Rational Use of Drugs (INRUD). Data were prospectively collected from 1050 prescriptions/patients, in thirty-one public and private not-for-profit health posts/centers in 5 health districts. The data were analyzed using the Statistical Package for the Social Sciences. P value less than 0.05 at 95% confidence interval considered for significance of relationships for associations in statistical test.
Results: The average number of medicines per prescription was 2.21; 83.1% (1931/2325) of medicines were prescribed by generic name, but only 54% (1253/2325) were on the National Essential Medicine List (NEML). Antibiotics were prescribed in 62.4% (655/1050) of the consultations, and injectable medicines were prescribed in 15.6% (164/1050) of the consultations. The average consultation time was 16.32 minutes, and the average dispensing time was 97 seconds. Dispensed medicines were correctly labeled, and 83% (871/1050) of patients met the correct administration schedule. The NEML, and the “restricted NEML” for 76 commonly-used medicines, were available in all surveyed health facilities, but the National Therapeutic Guidelines were available in only 60.26% of them.
Conclusion: Our findings indicate a possible excess of antibiotics prescriptions, and a likely lack of knowledge of the National Therapeutic Guidelines. There is a need to investigate in more detail the prescription patterns versus disease-specific therapeutic guidelines, and to qualitatively investigate the factors that contribute to the observed irrational prescribing. Moreover, training local staff in the rational use of medicines seems important.
Keywords: rational use of medicines, essential medicines, safety, antibiotics, Mauritania, sub-Saharan Africa
Introduction
The rational use of medicines requires that patients receive medicines tailored to their clinical needs, in doses that meet their individual needs, over an adequate period and at an affordable cost.1–3 Rational use has also been described as a safe, cost-effective, and economically viable use of medicines - which makes it a central element of health care.1–3 Achieving the rational use of medicines requires coordinated good practices at different levels of a health system, including adequate (ie safe and efficient) prescribing, correct dispensing, and patient adherence to prescription. Irrational use, which occurs when one or more of these conditions are not met,3 represents a global challenge; and is highly prevalent in resource-limited settings (RLSs); in 2002, the World Health Organization (WHO) estimated that more than half of all medicines were prescribed inappropriately; and that half of these were taken incorrectly by patients.3,4 Irrational use is a major cause of poor quality of care, adverse drug reactions (ADRs), unnecessary costs and waste of resources for local health systems,2,5 and drug resistance.6
Monitoring and Evaluation of the Rational Use of Medicines
Over the last two decades, numerous studies have highlighted prescribing practices that do not comply with adequate standards, particularly in sub-Saharan Africa (SSA).5,7 The most commonly reported types of inappropriate use of medicines are polypharmacy (that is, the use of too many medicines per patient), the inappropriate use of antibiotics and injectable medicines, the failure to prescribe according to clinical guidelines, and inappropriate self-medication.1 Among the reported reasons for, specifically, poor prescription, there is limited knowledge of medicines and guidelines; and unethical medicines promotion by the industry. However, prescription is only a part of the problem; despite the gradual improvements observed in the pharmaceutical systems of many RLSs in recent years, initiatives to monitor and evaluate the rational use of medicines are still insufficient.8
The best-known and most commonly used indicators of the rational use of medicines were first published by the WHO back in 1993.9 These indicators comprise a set of standardized indices that allow objective assessments of the use of medicines in three complementary areas: prescribing practices, patient care and factors specific to health facilities.9–11 In addition, as they are standardized, these indicators can be used to consistently describe the medicines use in a country, region or health facility,9 and to conduct comparisons across contexts or over time.5,7,12 In SSA, studies using these indicators have multiplied and the most recent include countries such as Nigeria,13,14 Ethiopia,15–17 Uganda,18 Eritrea19 and South Africa.20 A recent systematic review to evaluate prescriptions for antimicrobials in East Africa included 26 articles, the majority of which were found in Ethiopia (30.8%), followed by Sudan, Kenya, and Tanzania.21 In Ethiopia alone, a systematic review aimed to review the prescribing, health-facility, and patient-care indicators included 21 studies.22 The results of these studies, which mainly focus on the English-speaking countries of SSA, vary widely but reveal major gaps in rational drug prescribing in these countries.
Rational Use of Medicines in Mauritania
An analysis of the national pharmaceutical sector carried out in 2020 by the WHO, and a survey on Services, Availability and Readiness Assessment (SARA) carried out by the Ministry of Health (MoH) in 2016 and 2018, indicate that there is little or no monitoring or evaluation of the rational use of medicines in Mauritania.23 Both documents point to the lack of policies that promote the rational use of medicines, the absence of therapeutic committees within health facilities, the lack of (independent) information for prescribers and dispensers, and the insufficient training of health care staff in the rational use of medicines. The WHO analysis of 2020, in particular, indicates the lack of a service providing structured, continuous, independent information on medicines and on their use, either for health professionals or for patients, de facto leaving the field open to commercial and potentially biased sources of information.23 Furthermore, the level of public knowledge and awareness of the correct use of (generic) medicines is very low, resulting in excessive self-medication. These factors suggest that medicines are not used optimally in Mauritania.
Among the positive achievements toward the rational use of medicines, we note that a National Essential Medicines List (NEML) was drawn up for the first time in 2012; and revised in 2019–2020.24 Essential medicines are defined by each level of care in the health pyramid, ie, hospitals, regional hospitals, health centers and health posts. Moreover, since 2021, Mauritania developed a National Therapeutic Guide called “Strategies, Complaints and Treatment” which, although not yet validated, has been used in health facilities and can help to improve the rational use of medicines. The new National Pharmaceutical Policy (2022) has a strategic focus on promoting the rational use of medicines by prescribers, dispensers and consumers; for optimizing therapeutic outcomes, and reducing the waste of resources spent on irrational prescriptions and/or treating the resulting ADRs.24
Evaluating the Rational Use of Medicines for Strengthening the Health System
Since 2017, Mauritania has hosted the Institutional Support for the Health Sector Support Program (AI-PASS),25,26 which is funded by the European Union and implemented by the Belgian Development Agency Enabel, with the support of the Institute of Tropical Medicine (ITM) in Antwerp, Belgium, and the Belgian NGO Memisa. It assists the MoH in strengthening the national health system, within the framework of the MoH Sectoral Strategy and of the National Health Development Plan, with the ultimate aim of promoting equitable access to quality health care. Strengthening the pharmaceutical sector, including the rational use of medicines, is an important part of the AI-PASS program. To the best of our knowledge, no studies on the rational use of these medicines have been conducted in Mauritania. Therefore, AI-PASS funded the present study, with the objectives of evaluating the rational use of medicines in public and private not-for-profit health facilities in five health districts (known as moughataas); raising local stakeholders’ awareness of the rational use of medicines; providing policy-makers with data that can inform the improvement of pharmaceutical policies and practices; and suggesting priorities for future research in this field.
Methodology
Study Design, Area, and Period
We Adopted a Quantitative, Nonexperimental, Cross-Sectional Study Design.
The study was conducted in Mauritania, which is a vast desert country covering an area of 1,030,700 km². With a population of 4,649,660 (2020),24 Mauritania is one of the least populated countries in the world. It is ranked 157 out of 189 on the Human Development Index (HDI). Its health system is pyramidal, with three levels: central, regional and operational. The key operational unit is the health district, commonly known as a moughataa. Moughataas include two levels of care, ie, health centers and health posts, which offer a very similar package of care.
The study was conducted in the thirty-one public and private not-for-profit health facilities in the five moughataas supported by the AI-PASS project in three health regions: Brakna, Nouakchott North and Nouakchott West. Two of the selected moughataas, namely, Dar-naim and Sebkha, are located in the country’s capital of Nouakchott, while the other three, Aleg, Bogué and Bababé are in the Brakna region in the central-southern region of the country, some 300 km away from the capital. The data collection were collected from December 2022 to April 2023.
Sample Size, Inclusion Criteria and Data Collection
To evaluate the rational use of medicines, we adopted three groups of indicators based on the recommendations of the WHO and INRUD,9 to evaluate the determinants of rational use at, respectively, prescribing level, patient-care level and health facility level (Table 1).27,28 The first group comprises six indicators related to medicines prescription and aims to assess whether or not medicines are prescribed appropriately (rationally). The second group comprises five indicators related to patient care and aims to understand how medicines are obtained/procured and used by patients. The third group comprises three indicators related to health facilities and aims to assess the adequacy of the conditions for consulting and dispensing, the supply of essential medicines and the available medicines information. In this manuscript, we use the term “consultation” to describe the interaction between a prescriber and a patient that is aimed at delivering a diagnosis and proposing, if needed, a therapeutic itinerary. Additionally, we use the term “prescription” to indicate the written instructions provided by the prescriber for therapy.
 |
Table 1 WHO Core Drug Use Indicators and Their Optimal Values.27,28 |
The assessment of the determinants at the prescribing level required access to health facilities’ records, while the assessment of determinants at the patient care and health facility levels required observation and interviews with patients. Therefore, data were independently collected at two different moments, using different data collection methods and tools.
The first round of data collection took place from December 2022 to January 2023, with a focus on the medicines prescription indicators. The surveyed facilities did not have any standardized prescription forms or patient records; therefore standardized prescription forms were designed by the research team and implemented prior to the start of the study. We included in the study all the prescriptions of individuals who had an outpatient consultation for acute or chronic illnesses, excluding specialized services such as immunization or mental health and dental care, during the data collection period. In the study area, there were no scheduled consultations, which means that patients did not come with predefined planning. Overall, we included 1,050 prescriptions. Notably, for these kinds of indicators, the WHO recommends a sample of at least 600 prescriptions.9
The second round of data collection took place in March-April 2023 and focused on patient care and health facilities indicators. Patients were eligible regardless of age and language spoken, provided that they were attending a consultation for acute or chronic illnesses (excluding specialized services such as immunization, dental care etc.), that they had no cognitive impairment; and that they were available to participate and willing to give written informed consent. For minors, consent was given by their caregivers. The data collection primarily consisted of an exit survey, conducted after patients or caregivers had collected their medicines at the facility pharmacy. Interviews took place at a reasonable distance from the health facility, in a place and at a time chosen according to participants’ preferences. The interview questions focused on the main indicators of care, as described in Table 1. Overall, we enrolled the first 1,050 eligible patients or (for minors) caregivers who met the inclusion criteria. The number of inclusions per health facility depended on the size of the facility, which varied from five to 106 patients. We also conducted non-participant observation in the waiting room and in common areas of the health facilities, to observe the timing of the consultation and the dispensing of medicines. For the health facilities level, we conducted short interviews with the prescribers to check the availability of essential guidelines. In particular, we asked them to indicate the presence or absence of a copy of the NEML, the restricted NEML of 76 medicines (Table 2) or the Therapeutic Guide.
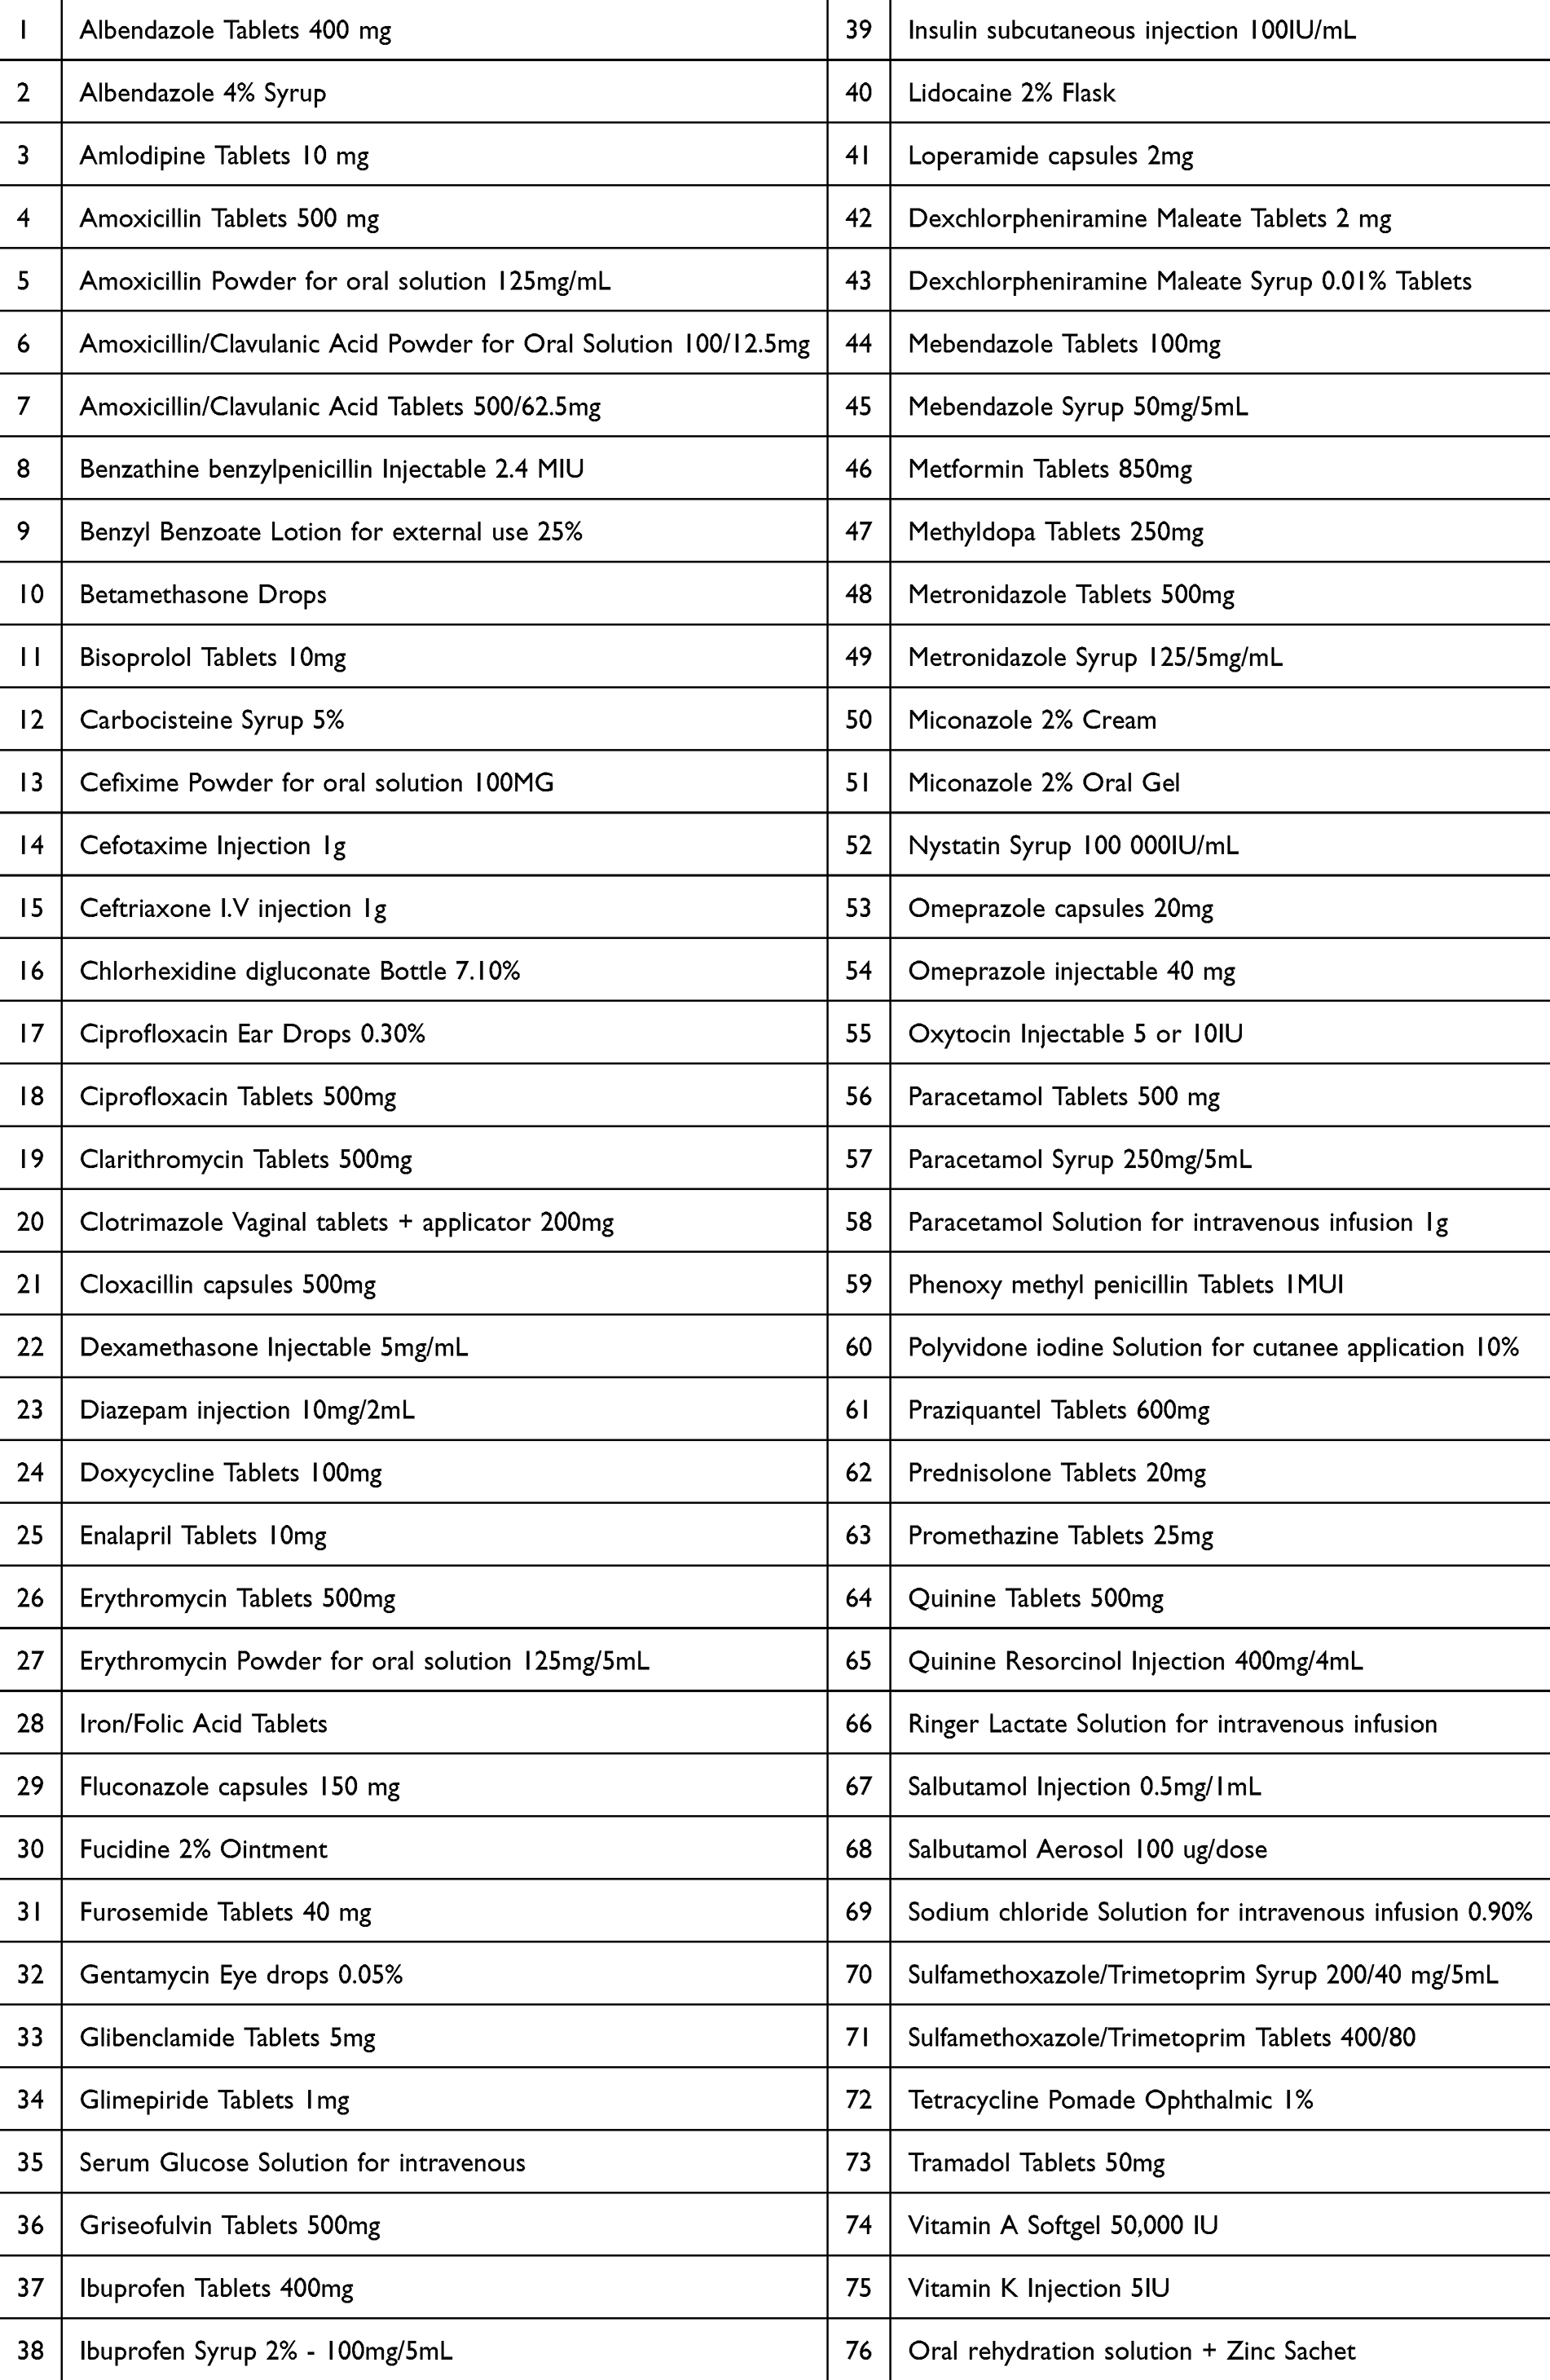 |
Table 2 Restricted List of 76 Medicines |
Data Quality Control
To ensure the quality of the data, the 12 interviewers and three supervisors received three days of training from the principal investigator (MAAA). Informed consent documents and data collection tools were pretested at three health facilities in the Dar-Naim and Sebkha health districts. The data were double entered, ie, on paper, and online using Kobo Toolbox software on smartphones. At the end of each day, the team checked the data entered online against those recorded on paper. Moreover, an internal data monitor checked the completeness and consistency of the data entered in real time. In the event of discrepancies or missing data, the monitor contacted the interviewers to correct, complete or recheck them.
Data Analysis
The data were quantitative. They were analyzed by an experienced statistician (KD) with the support of the PI. First, data were transferred from Kobo collection files to Excel and checked by both a statistician and the PI for quality. Second, the data were analyzed using the Statistical Package for the Social Sciences (SPSS Statistics). The data are presented as the frequency, percentage, mean/average, and standard deviations (SD). In addition, one way analysis of variance (ANOVA) and Pearson’s chi-squared test were performed to check for associations among different variables. A p-value less than 0.05 at the 95% confidence interval (CI) was considered to indicate statistical significance.
Results
Prescription Indicators
The sample for the medicines prescription level, which was evaluated through six indicators, included 1050 prescriptions, from 1050 consultations. 91% of these prescriptions were readable (Table 3). However, the prescriber’s name and qualification were written on only 74.10% of the prescriptions, and a signature was present on only 6%. Conversely, the patient’s first and last name appeared on 99.2% of prescriptions, while the date of prescription appeared on 98.3%. The dosage and daily dose of medicines, and the duration of treatment, were indicated for 73.55% (1710/2474), 92.6% (2155/2474) and 88.6% (2060/2474) of the prescribed medicines, respectively.
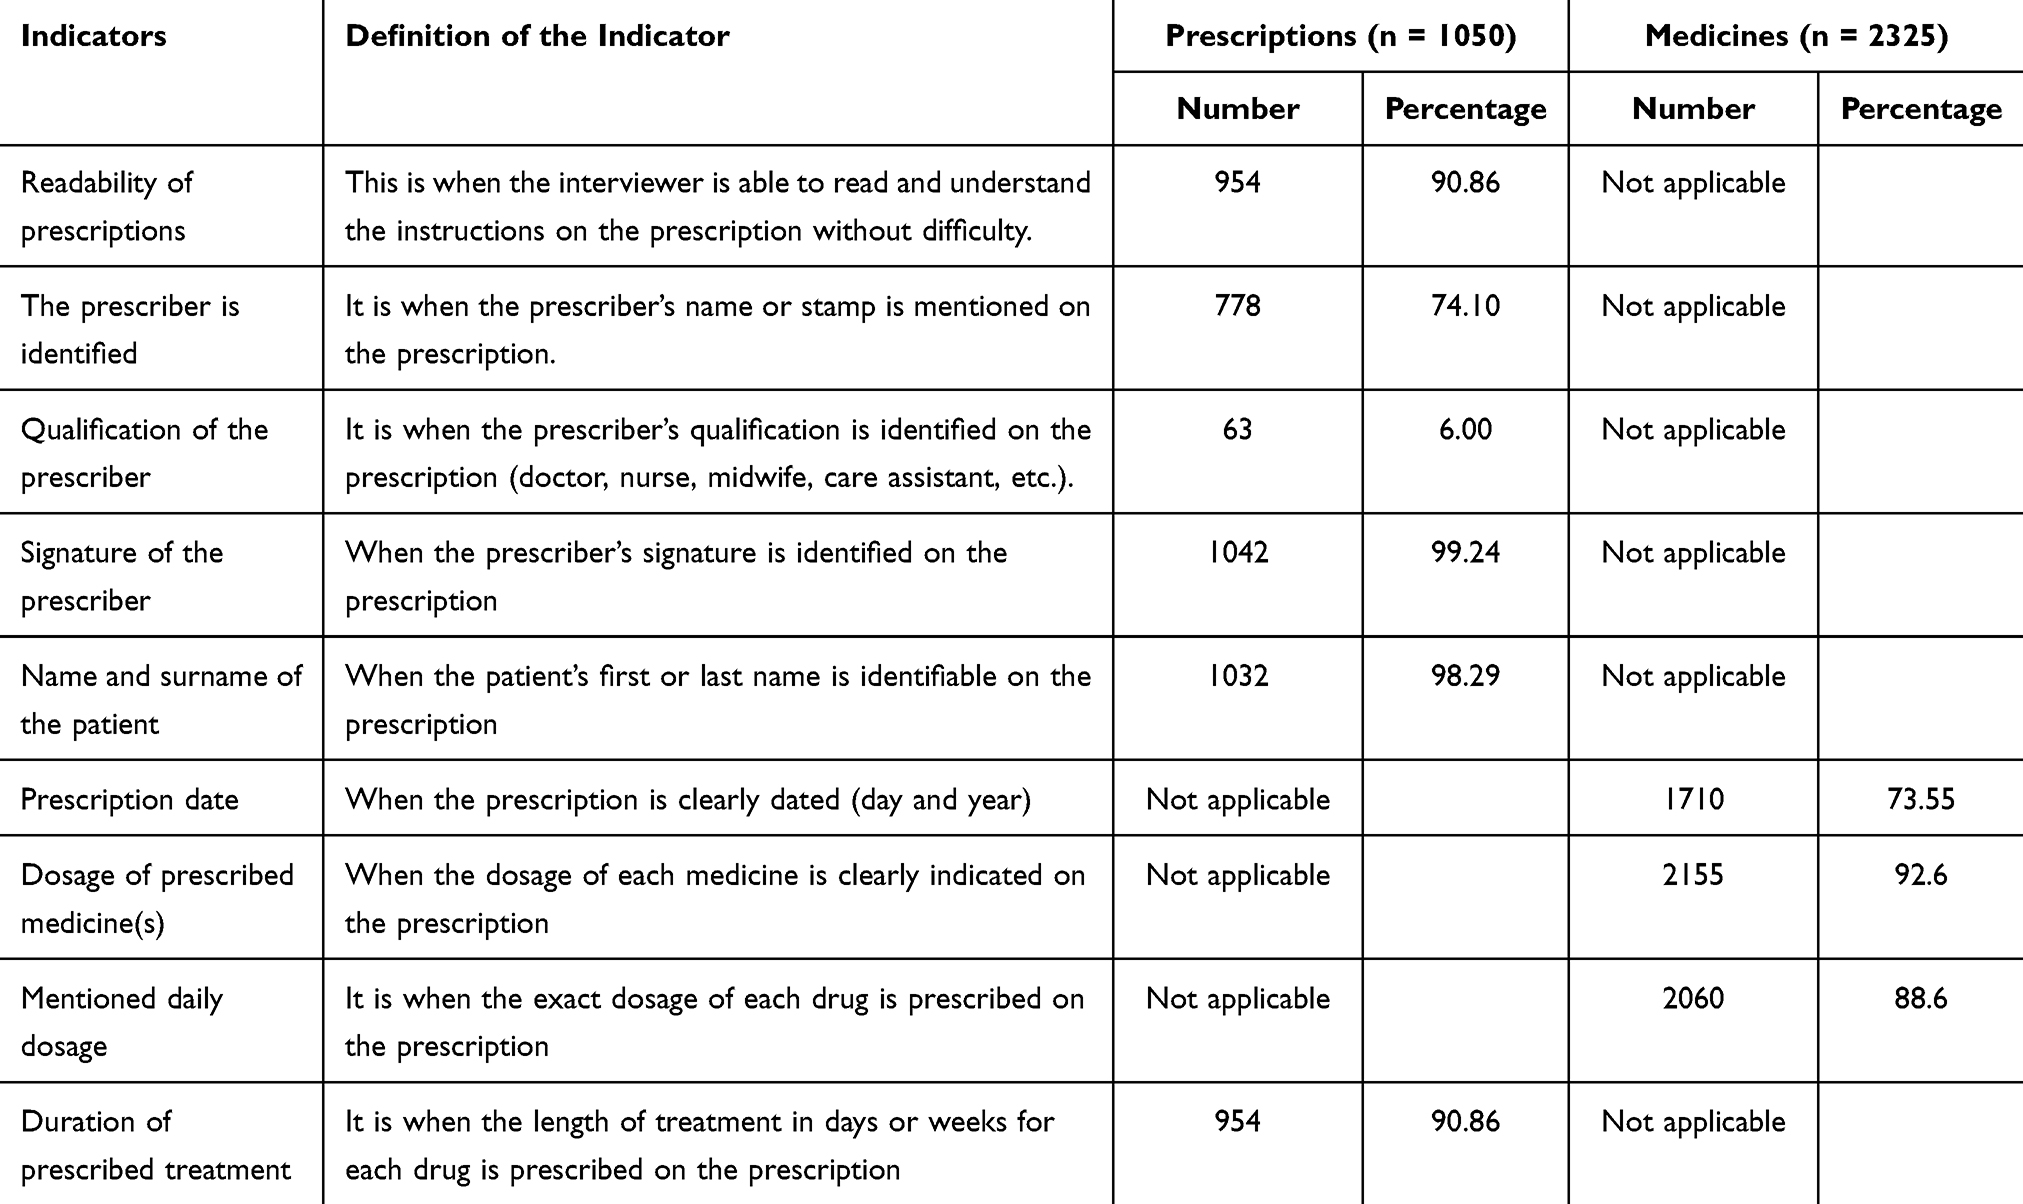 |
Table 3 for Assessing the Quality of Prescriptions |
Overall, 2474 medicines were prescribed to 1050 patients. The average number of medicines per prescription was 2.21, ranging from 2.32 for health facilities in Brakna to 1.93 for those in Nouakchott. The highest average number of medicines per prescription was observed in the moughataas of Bababé (2.63) and Bogué (2.45), with a statistically significant difference (p=0.000). Furthermore, 83.1% (1931/2325) of the medicines were prescribed under a generic name; and only approximately half of these (54%; 1253/2325) were listed in the NEML. Prescribers in the Sebkha moughataa prescribed few generics and fewer medicines from the NEML (30% and 16.7% respectively), while those in Dar-Naim had the highest compliance rate with prescriptions by generic name and medicines from the NEML (90.1% and 66.9% respectively). Additionally, the difference was found to be statistically significant (p=0.000) (Table 4).
 |
Table 4 Summary of Prescription Indicators Obtained in Five Health Districts in Mauritania (n = 1050 Prescriptions |
Overall, antibiotics were prescribed in 62.4% of the consultations (655/1050), and injectable medicines were prescribed in 15.6% (164/1050). The difference in antibiotic prescription between the moughataas was not found to be statistically significant (p=0.114), while the difference was found to be significant for injectables (p=0.000). The most commonly prescribed antibiotics were amoxicillin (360 times/735; 47.9%) and sulfamethoxazol (112 times/735; 14.9%) (Table 4). Eight out of the nine most commonly prescribed antibiotics are classified as “access” according to the WHO AWaRe classification (26), but one of them, ie, ciprofloxacin, classified as “Watch” and should thus be prescribed with great caution. The most commonly prescribed injectable medicines were paracetamol (80/241; 33.2%); dexamethasone (22/241; 9.1%) and ampicillin (21/241; 8.7%) (Table 5).
 |
Table 5 Most Commonly Prescribed Antibiotics and Injectables in Five Health Districts in Mauritania |
Patient Care Indicators
Table 6 shows the findings from non-participant observations and exit interviews. The average consultation time was 16.32 minutes, with the maximum occurring in Aleg (21.94 minutes) and the minimum in Dar-Naim (11.19 minutes). The average dispensing time was 96.90 seconds, with the maximum occurring in Dar-Naim (155.11 seconds) and a minimum in Sebkha (40.21 seconds). Among those prescribed medicines, 80% (n=2474) were dispensed to patients, with the highest percentage in Bababé (93%) and the lowest in Bogué (56%). All the dispensed medicines were correctly labelled, and 83% of patients who received them were informed of the correct dosage. Patients in the moughataas of Bogue (63%) and Aleg (79%) had the lowest level of knowledge. For all these indicators the difference between the moughataas was found to be statistically significant (p=0.000), except for the percentage of medicines correctly labelled, which was high everywhere (p=0.41). (Table 6).
 |
Table 6 Distribution of Patient Care Indicators Obtained in Five Health Districts in Mauritania (n = 1050 Patients) |
Indicators Relating to Factors Specific to Health Facilities
The NEML and the restricted list of 76 medicines used to treat the most common health problems were available at 90.32% of the thirty-one (31) examined health facilities. However, the National Therapeutic Guides “Strategies, Complaints and Treatment” were available at only 60.26% of the health facilities.
Discussion
Prescription Indicators
In our sample of thirty-one health facilities, the average number of medicines per prescription (2.21) was greater than the WHO recommended standard (1.6–1.8),9 but lower than that reported in 2009 in the WHO Factbook for the African region (2.6).29 This figure is also lower than the average value of 2.6 indicated in two published reviews on the rational use of medicines, which covered data from 40 studies/surveys in Africa (138,671 prescriptions),5 and data from 900 studies/surveys conducted in 104 countries.7 The latter, in particular, indicated that the median number of medicines prescribed per consultation increased steadily from 2.1 before 1992, to 2.8 in 2007–2009.7 Taken individually, data from sub-Saharan African countries show varying numbers of medicines per prescription. For example, 2.3 was reported for Tanzania in 2001;30 1.4 for Sudan in 1991;31 and 1.2; 1.7; 1.8 and 1.9 were reported for different regions in Ethiopia at different time points.12,32–34 The differences between countries can be attributed to the lack of adequate training for health care professionals, variations in the health care delivery system, and differences in the socioeconomic and epidemiological profiles of the population.12 Moreover, surveys were conducted over three decades, which means that their findings reflect the evolving characteristics of local health systems.
The percentage of medicines prescribed by generic name was 83.1% (1931) in our sample. This value is lower than the WHO recommended standard (100%),9 but higher than the average rate reported in a systematic analysis of data from African primary care facilities (68.9%).5 Additionally, Also the above-mentioned systematic review reported a lower percentage (65.1%) of medicines prescribed by generic name in the African region;7 country-specific data from Tanzania (75.5%);30 and other African countries35,36 show lower rates of prescription by generic name, than that found in our sample. This can be explained by the increasing awareness of the importance of prescription by generic name over time. However, the main determinant is probably due to the characteristics of our sample: our study was exclusively conducted in public health facilities, where the supply of generic medicines is common practice.
The percentage of prescriptions that included antibiotics (62.4%) in our sample was much greater than the WHO recommended standard (20.0 to 26.8%),9 suggesting a significant risk of irrational use of antibiotics. This is an alarming finding because irrational prescription patterns not only harm individual patient but also trigger antimicrobial resistance at the population level. Of the nine most commonly prescribed antibiotics in our samples, eight are classified as “access” in the WHO AWaRe classification,37 while ciprofloxacin is classified as “watch”, this meaning that it should be prescribed with great caution, and only for confirmed infections for which it is specifically indicated. The outcome of 62.4% is also much greater than the data reported for African countries in the two literature reviews cited above, which give average of antibiotics use per prescription outcomes of 30% and 45.9%, 7,38 respectively; moreover these data point to a (worryingly) increasing change, from 42% before 1992; to 51% in 2007–2009 in some countries.7 The scientific literature reports variable, but generally high rates of antibiotic prescription in different African countries at different time points eg, 58.1%, 63%, 56%, 48% and 29% for Ethiopia, Sudan, Uganda, Nigeria and Zimbabwe, respectively.32,35,36,39,40 The overprescription of antibiotics could be explained by the insufficient training and awareness of prescribers, their uneven distribution, the unethical promotion practices, the presence of comorbidities, and the irrational demands of patients; however, the determinants of overprescriptions can be highly contextual. Thus, addressing them adequately requires an accurate evaluation of the causes of antibiotics in each specific context and health system.
The unnecessary use of injectables should be avoided, given the risks of infections and the higher costs involved.2 In our sample, we observed a percentage of injectables per prescription of 15.6%, which is within the WHO recommended standard (13.4–24.1%),9 and much lower than the 28.4% reported indicated by the previously-cited systematic review for the African region.7 Another systematic review indicated, for the African region, percentages in public and private facilities ranging from 1.15% to 82.9%, with a median rate of 36.8%.38 A systematic review of 32 studies (40,096 prescriptions) also revealed a higher percentage of injectable prescriptions, ie, 25.0% (25.6% and 29.0%, respectively, for the public and private health sectors).5 In individual African countries, high rates were observed at different time points in Uganda (48%) and Sudan (36%), while data from Zimbabwe (11%)32,35,36,39,40 were within WHO recommended standard.
Overall, our results are contradictory, as antibiotics were overprescribed but injectables were adequately prescribed. This can be explained by the typology of care provided at the primary care level, and by the limited stock of injectable medicines.
The percentage of prescribed medicines that are included in the NEML was found to be 53.9% in our sample. This is clearly below the WHO recommended standard, which is 100%,9 and much lower than the findings of several other studies. For instance, two previously cited systematic reviews reported percentages of 89% and 88%.5,7 Our findings might be explained by patient preference, clinician decisions, unethical promotion practices, limited medicines availability and frequent stockouts. However, these findings are surprising, given that public health facilities are expected to mainly procure generic medicines through the public supply system.
Patient Care Indicators
The mean times for consultation and dispensing of medicines observed in our study were found to be 16.32 minutes and 96.90 seconds respectively. The WHO does not provide a gold standard for these indicators, and variable average times have been reported in different African countries. For instance, previous studies have indicated lower average consultation times in Tanzania (3.6 minutes);30 in Nigeria (10.5 minutes)41 and in two studies conducted in Ethiopia (5.8 and 6.14 minutes).42,43 The dispensing times reported in these studies were 39.9 seconds;30,244.9 seconds;41,114 seconds and 77 seconds.42,43 If consultation and dispensing times are too short, it is impossible to provide patients with all the necessary information, which creates a risk of inappropriate use and poor compliance with treatment. These problems might be due to not only poor training or motivation of health care staff, but also -or mainly- shortages of staff, overwork, poor working conditions, inadequate infrastructure and equipment, insufficient dedicated consultation rooms, etc.
The adequate, and complete labelling of medicines, as well as adequate knowledge of their dosage by patients, is a prerequisite for treatment compliance, and the rational use and prevention of ADRs. Our findings showed that, on average, 80% of the medicines prescribed in the health facilities were actually dispensed to the patients; 100% of the medicines that were dispensed were correctly labelled; and 83% of the patients were able to correctly explain their dosage regimen. In a study conducted in Ethiopia, 86.22% (medicines dispensed) and 60.56% (medicines correctly labelled) of the participants met these criteria.42 In Nigeria, 88.8% of all medicines were dispensed, 43% of which were correctly labelled, and 72.4% of patients had adequate knowledge of how to use them.41 The adequacy of labelling was found to be much lower in some studies in Nigeria, Ethiopia, and Kenya (0%, 17.5% and 22.6% respectively).44–46 However, comparisons of these indicators are not necessarily robust, as variations may heavily depend on the different criteria adopted across different studies.
Notably, in our sample 20% of the prescribed medicines were not dispensed to patients at the health facility level. Future research should further investigate the causes (eg, costs to high for the patient/household, out of stock, etc.) and the consequences (eg, did the patient look for the medicine elsewhere, for example in the private or informal sector, or did the disease go untreated?).
Indicators Relating to Factors Specific to Health Facilities
The rate of availability of the NEML and the restricted list in the surveyed health facilities was found to be 98%, whereas the National Therapeutic Guide was available in only 60.26% of the facilities. These results are in line with those of studies conducted in Nigeria (98.6% for the NEML)14 and Ethiopia (100% for the NEML).47 Conversely, two studies in Ghana48 and Nigeria41 showed that all surveyed health facilities lacked a copy of the NEML. The NEML provides essential guidelines for health care staff; however, in some countries, pharmaceutical representatives are the main source of information for prescribers.30,48 This is problematic, as this information may be biased, eg, by over-representing the medicines of a given company or distributor, by discrediting competing brands and by encouraging health care professionals to prescribe outside established guidelines.49,50 The presence of the NEML is important, but it is not a guarantee that prescribers will not be subject to other kinds of influence. For instance, in our study, while the NEML was available in all surveyed facilities, the low percentage of prescriptions by generic name and the overall prescription of antibiotics could be suggestive of other forms of influence.
Limitations
In this study we used the WHO indicators, to provide a first-ever description of the rational use of medicine in Mauritania. However, we did not conduct a qualitative study to identify the determinants of current practices. Furthermore, our study was only conducted in the public and private not-for-profit sectors and not in the private for-profit sector, where the results would probably be different. In addition, there is a risk of observation bias, which mitigated by providing standardized training to data collectors, by pre-testing informed consent documents and data collection tools, and by avoiding as much possible contact between the data collectors and the prescriber during the participant observation. Last, as the healthcare professionals were informed of the study in advance, our results may be more positive than if the study had been conducted in a hidden way.
Conclusion
This study is, to the best of our knowledge, the first to document indicators of the rational use of medicines in Mauritania. Although the results vary across the examined moughataa, we identified certain prescribing practices that may pose a threat to public health. In particular, the observed overuse of antibiotics can trigger the emergence of resistance, and the prescription of medicines outside of the NEML can result in irrational use and unnecessarily high costs. Future research should investigate whether antibiotics and other key essential medicines are correctly prescribed for specific diagnostic indications.
Moreover, not all prescribed medicines were dispensed, raising the question of whether the diagnosed condition went untreated for these patients. Our findings also indicate the need for the retraining of prescribers in the rational use of medicines and the consequences of irrational prescribing. Even if additional (qualitative) research is needed to understand which other factors trigger irrational use, at the prescriber, user and health system levels, our study provides policy-makers in Mauritania with initial guidance to improve policies and practices.
Abbreviations
AI-PASS, project Institutional Support for the Health Sector Support Program; NEML, national Essential Medicines List; HDI, Human Development Index; INRUD, International Network for Rational Use of Drugs; RLSs, resource-limited settings; ADRs, adverse drug reactions; SARA, Services, Availability and Readiness Assessment; MoH, Ministry of Health; WHO, World Health Organization.
Data Sharing Statement
The datasets used and/or analysed during the current study are available from the corresponding author on reasonable request.
Ethics Approval and Consent to Participate
The project was carried out in accordance with the principles set out in the World Medical Association’s Declaration of Helsinki: ethical principles for medical research involving human subjects (2013). It received ethical approval from the Institutional Review Board of the Institute of Tropical Medicine of Antwerp in Belgium (Ref. No. 1640/22). In the absence of an ethical committee in Mauritania, approval was obtained from the Ministry of Health of Mauritania (Ref N ° 000208/2022). All participants gave their approval and signed the informed consent.
Acknowledgments
We would like to thank the Mauritanian health authorities, the national technical assistants (Amadou Kane, Mohamed El Oumrani and Cheikh Tourad Abderrahmane) and the national pharma assistants of the AI-PASS program, who efficiently helped to facilitate this data collection.
Author Contributions
All authors made a significant contribution to the work reported, whether that is in the conception, study design, execution, acquisition of data, analysis and interpretation, or in all these areas; took part in drafting, revising or critically reviewing the article; gave final approval of the version to be published; have agreed on the journal to which the article has been submitted; and agree to be accountable for all aspects of the work.
Funding
This study was financed by the Delegation of the European Union in Mauritania through the AI-PASS program implemented by Enabel.
Disclosure
Dr Mohamed Ali Ag Ahmed reports personal fees, non-financial support from Institute of Tropical Medicine Antwerp, outside the submitted work. Mrs Catherine Dujardin reports C Dujardin worked as an Expert in the project Institutional Support for the Health Sector Support Program (AI-PASS), funded by the European Union and implemented by the Belgian Development Agency Enabel. The authors report no other conflicts of interest in this work.
References
1. Blum NL. Drug Information Development. A Case Study Nepal. Rational pharmaceutical management project. United States pharmacopoeia; 2000. Available from: http://www.usp.org/pdf/EN/dqi/nepalCaseStudy.pdf.
2. Ghimire S, Nepal S, Bhandari S, Nepal P, Palaian S. Students’ corner-A prospective surveillance of drug prescribing and dispensing in a teaching hospital in Western Nepal. J Pak Med Assoc. 2009;59(10):726.
3. World Health Organization. The pursuit of responsible use of medicines: sharing and learning from country experiences. World Health Organization. 2012;2012:1.
4. World Health Organization. Promoting rational use of medicines: core components; 2002.
5. Ofori-Asenso R, Brhlikova P, Pollock AM. Prescribing indicators at primary health care centers within the WHO African region: a systematic analysis (1995–2015). BMC Public Health. 2016;16(1):1–14. doi:10.1186/s12889-016-3428-8
6. Bhartiy S, Shinde M, Nandeshwar S, Tiwari S. Pattern of prescribing practices in the Madhya Pradesh, India. Kathmandu University Medical j. 2008;6(1):55–59.
7. Holloway KA, Ivanovska V, Wagner A, Vialle‐Valentin C, Ross‐Degnan D. Have we improved use of medicines in developing and transitional countries and do we know how to? Two decades of evidence. Tropical Med Intern Health. 2013;18(6):656–664. doi:10.1111/tmi.12123
8. Food DY, Medicine and health care administration and control authority; 2014.
9. World Health Organization. How to investigate drug use in health facilities: selected drug use indicators; 1993.
10. World Health Organization. Using indicators to measure country pharmaceutical situations: fact book on WHO level I and level II monitoring indicators. 2006.
11. Hogerzeil HV, Ross-Degnan D, Laing R, et al. Field tests for rational drug use in twelve developing countries. Lancet. 1993;342(8884):1408–1410. doi:10.1016/0140-6736(93)92760-Q
12. Desalegn AA. Assessment of drug use pattern using WHO prescribing indicators at Hawassa University teaching and referral hospital, south Ethiopia: a cross-sectional study. BMC Health Serv Res. 2013;13:1–6. doi:10.1186/1472-6963-13-170
13. Ogaji D, Nwaejike D, Ebiekuraju O. Quality of drug prescribing and dispensing practices in primary healthcare centres in an urban local government area in Nigeria. West Afr J Med. 2023;40(9):925–934.
14. Adeosun SA, Joda AE, Aderemi-Williams RI, Oyetunde OO. Assessment of drug use in primary health centers in Lagos State, Nigeria. Pan Afr Med J. 2022;43:1.
15. Wendie TF, Ahmed A, Mohammed SA. Drug use pattern using WHO core drug use indicators in public health centers of Dessie, north-east Ethiopia. BMC Med Inf Decis Making. 2021;21(1):197. doi:10.1186/s12911-021-01530-w
16. Sisay M, Mengistu G, Molla B, Amare F, Gabriel T. Evaluation of rational drug use based on World Health Organization core drug use indicators in selected public hospitals of eastern Ethiopia: a cross sectional study. BMC Health Serv Res. 2017;17(1):1–9. doi:10.1186/s12913-017-2097-3
17. Anagaw YK, Limenh LW, Geremew DT, et al. Assessment of prescription completeness and drug use pattern using WHO prescribing indicators in private community pharmacies in Addis Ababa: a cross-sectional study. J Pharm Policy Prac. 2023;16(1):124. doi:10.1186/s40545-023-00607-3
18. Goruntla N, Ssesanga J, Bommireddy BR, et al. Evaluation of rational drug use based on who/inrud core drug use indicators in a secondary care hospital: a cross-sectional study in western Uganda. Drug Health Patient Saf. 2023;Volume 15:125–135. doi:10.2147/DHPS.S424050
19. Siele SM, Abdu N, Ghebrehiwet M, Hamed MR, Tesfamariam EH. Drug prescribing and dispensing practices in regional and national referral hospitals of Eritrea: evaluation with WHO/INRUD core drug use indicators. PLoS One. 2022;17(8):e0272936. doi:10.1371/journal.pone.0272936
20. Akunne OO, Valoyi V, Wehmeyer A, Johnson Y, Coetzee R. Implications of the south African national drug policy on prescribing patterns: a case study of the Limpopo province. J Pharm Policy Prac. 2023;16(1):111. doi:10.1186/s40545-023-00622-4
21. Acam J, Kuodi P, Medhin G, Makonnen E. Antimicrobial prescription patterns in East Africa: a systematic review. Syst Rev. 2023;12(1):18. doi:10.1186/s13643-022-02152-7
22. Mekonnen BD, Ayalew MZ, Tegegn AA. Rational drug use evaluation based on world Health organization core drug use indicators in Ethiopia: a systematic review. Drug Health Patient Saf. 2021;Volume 13:159–170. doi:10.2147/DHPS.S311926
23. OMS. Analyse du sous-secteur pharmaceutique Mauritanie; 2020.
24. Ministere de la santé de Mauritanie. Politique pharmaceutique nationale;2024. Available from: https://www.sante.gov.mr/?wpfb_dl=235#:~:text=La%20Mauritanie%20dispose%20d%27un,de%20santé%20et%2029%20hôpitaux.2022.
25. Enabel. Extension de la Couverture Maladie Universelle en Mauritanie; 2024. Availble from: https://open.enabel.be/en/MRT/2419/p/extension-de-la-couverture-maladie-universelle-en-mauritanie.html2022.
26. Accoe K, Marchal B, Gnokane Y, Abdellahi D, Bossyns P, Criel B. Action research and health system strengthening: the case of the health sector support programme in Mauritania, West Africa. Health Res Policy Sys. 2020;18(1):25. doi:10.1186/s12961-020-0531-1
27. Atif M, Sarwar MR, Azeem M, Naz M, Amir S, Nazir K. Assessment of core drug use indicators using WHO/INRUD methodology at primary healthcare centers in Bahawalpur, Pakistan. BMC Health Serv Res. 2016;16(1):1–9. doi:10.1186/s12913-016-1932-2
28. Bilal AI, Osman ED, Mulugeta A. Assessment of medicines use pattern using World Health Organization’s prescribing, patient care and health facility indicators in selected health facilities in eastern Ethiopia. BMC Health Serv Res. 2016;16(1):1–8. doi:10.1186/s12913-016-1414-6
29. World Health Organization. Medicines use in primary care in developing and transitional countries: fact book summarizing results from studies reported between 1990 and 2006; 2009.
30. Massele A, Nsimbi S, Rimoy G. Prescribing habits in church-owned primary health care facilities in Dar-Es-Salaam and other Tanzanian coast Regions. East Afr Med J. 2001;78(10):510–514. doi:10.4314/eamj.v78i10.8958
31. World Health Organization; Forshaw CJ, Fresle D, Salami AO, Wahab HA. Evaluation of the Nile Province Essential Drugs Project: Mission Report by a WHO Team. Sudan: Bannenberg; 1991.
32. World Health Organization. Assessment of the pharmaceutical sector in Ethiopia; 2003.
33. Bergicho M, Mohammed MA, Wabe NT. Assessment of the pattern of drug prescribing in pediatrics ward in tertiary setting hospital in Addis Ababa, Ethiopia. Gaziantep Med J. 2012;18(2):61–65. doi:10.5455/GMJ-30-2012-73
34. Admassie E, Begashaw B, Hailu W. Assessment of drug use practices and completeness of prescriptions in Gondar University Teaching Referral Hospital. Int J Pharm Sci Res. 2013;4(1):265.
35. Zimbabwe Mo H. Essential Drugs Action Programme: Essential Drugs Survey. In How to Investigate Drug Use in Health Facilities. Geneva; 1993.
36. Bimmo. Report on Nigerian field test. INRUD News. 1992;3(1):9–10.
37. World Health Organization. WHO Access, Watch, Reserve (AWaRe) classification of antibiotics for evaluation and monitoring of use; 2023.
38. Ofori-Asenso R, Agyeman AA. A review of injection and antibiotic use at primary health care (public and private) centers in Africa. J Pharm Bioallied Sci. 2015;7(3):175. doi:10.4103/0975-7406.160008
39. Ilbert J F B, Chris J, Fresle D, et al. Evaluation of the Nile province essential drug project. In: How to Investigate Drug Use in Health Facilities. Geneva: World Helath Organization; 1993:1991.
40. Christensen RF. A strategy for the improvement of prescribing and drug use in rural health facilities in Uganda. In: Ugandan Essential Drugs and Management Program; 2 September-11 October 1990. In How to Investigate Drug Use in Health Facilities. Geneva: World Helath Organization; 1993:74.
41. Odusanya O. Drug use indicators at a secondary health care facility in Lagos, Nigeria. J Community Med Primary Health Care. 2004;16(1):21–24.
42. Angamo MT, Wabe NT, Raju N. Assessment of patterns of drug use by using World Health Organization’s prescribing, patient care and health facility indicators in selected health facilities in Southwest Ethiopia. J Appl Pharm Sci. 2011;1:62–66.
43. Desta Z, Abula T, Beyene L, Fantahun M, Yohannes A, Ayalew S. Assessment of rational drug use and prescribing in primary health care facilities in north west Ethiopia. East Afr Med J. 1997;74(12):758–763.
44. Chedi BA, Abdu-Aguye I, Kwanashie HO. Drug use pattern in out-patient children: a comparison between primary and secondary health care facilities in Northern Nigeria. Afr J Pharm Pharmacol. 2015;9(4):74–81. doi:10.5897/AJPP2014.4262
45. Sema FD, Asres ED, Wubeshet BD. Evaluation of rational use of medicine using WHO/INRUD core drug use indicators at teda and azezo health centers, Gondar town, northwest Ethiopia. Integrat Pharm Res Pract. 2021;10:51–63. doi:10.2147/IPRP.S316399
46. Nyabuti AO, Okalebo FA, Guantai EM. Examination of WHO/INRUD core drug use indicators at public primary healthcare centers in Kisii County, Kenya. Adv Pharm Sci. 2020;2020:1.
47. Bantie L. Assessment of prescribing practice pattern in governmental health centers of Bahir Dar Town, Ethiopia. World Journal of Pharm Sci. 2014;2014:1184–1190.
48. Bosu W, Ofori-Adjei D. An audit of prescribing practices in health care facilities of the Wassa West district of Ghana. West Afr J Med. 2000;19(4):298–303.
49. Narendran R, Narendranathan M Influence of pharmaceutical marketing on prescription practices of physicians; 2013.;
50. Fugh-Berman A, Ahari S. Following the script: how drug reps make friends and influence doctors. PLoS Med. 2007;4(4):e150. doi:10.1371/journal.pmed.0040150
 © 2024 The Author(s). This work is published and licensed by Dove Medical Press Limited. The full terms of this license are available at https://www.dovepress.com/terms.php and incorporate the Creative Commons Attribution - Non Commercial (unported, v3.0) License.
By accessing the work you hereby accept the Terms. Non-commercial uses of the work are permitted without any further permission from Dove Medical Press Limited, provided the work is properly attributed. For permission for commercial use of this work, please see paragraphs 4.2 and 5 of our Terms.
© 2024 The Author(s). This work is published and licensed by Dove Medical Press Limited. The full terms of this license are available at https://www.dovepress.com/terms.php and incorporate the Creative Commons Attribution - Non Commercial (unported, v3.0) License.
By accessing the work you hereby accept the Terms. Non-commercial uses of the work are permitted without any further permission from Dove Medical Press Limited, provided the work is properly attributed. For permission for commercial use of this work, please see paragraphs 4.2 and 5 of our Terms.