")
Back to Journals » Clinical Optometry » Volume 15
Effects of Lens-Induced Astigmatism at Near and Far Distances
Authors Tavazzi S , Vlasak N, Zeri F
Received 19 January 2023
Accepted for publication 13 April 2023
Published 6 May 2023 Volume 2023:15 Pages 105—117
DOI https://doi.org/10.2147/OPTO.S405472
Checked for plagiarism Yes
Review by Single anonymous peer review
Peer reviewer comments 2
Editor who approved publication: Mr Simon Berry
Silvia Tavazzi,1,2 Natalia Vlasak,3 Fabrizio Zeri1,2,4
1Materials Science Department, University of Milano-Bicocca, Milam, I-20125, Italy; 2University of Milano-Bicocca, COMiB Research Centre in Optics and Optometry, Milan, I-20125, Italy; 3Hoya Vision Care, Amsterdam, 1043 NX, the Netherlands; 4College of Health and Life Sciences, Aston University, Birmingham, B4 7ET, UK
Correspondence: Silvia Tavazzi, Department of Materials Science, University of Milano-Bicocca, Via Roberto Cozzi 55, Milan, I-20125, Italy, Tel +39 02 6448 5035, Email [email protected]
Purpose: To investigate and compare the degradation of visual acuity (VA) in myopic presbyopes due to lens-induced astigmatism at near and at far distance.
Patients and Methods: Fourteen corrected myopic presbyopes were recruited. VA (logarithm of the minimum angle of resolution) was measured binocularly for different conditions of lens-induced astigmatism: cylindrical powers of − 0.25, − 0.50, − 0.75, − 1.00, − 1.50, and − 2.00 diopters (and positive spherical power of half the cylindrical power) with two axis orientations (with-the-rule WTR and against-the-rule ATR) were added to their optical correction. Measurements were carried out at far and near distance both in photopic and mesopic conditions, and for high and low contrast (HC/LC) stimuli. The paired Wilcoxon signed-rank statistics test was used to evaluate difference between conditions.
Results: The measured VA as a function of the lens-induced astigmatism was described by regression lines in all investigated experimental conditions. The angular coefficients (slopes) of these lines represent the VA degradation, ie, the variation in logMAR corresponding to the addition of 1.00 diopters of cylindrical power. In photopic HC conditions, the VA degradation is significantly more pronounced at far distance than at near distance (0.22± 0.06 diopters− 1 vs 0.15± 0.05 diopters− 1, p = 0.0061 in WTR conditions; 0.18± 0.06 diopters− 1 vs 0.12± 0.05 diopters− 1, p = 0.0017 in ATR conditions), although VAs at near and at far with zero cylinder were similar (− 0.14± 0.10 vs − 0.14± 0.08, p = 0.824).
Conclusion: The better tolerance to lens-induced astigmatism blur at near than at far distance in photopic conditions with HC stimuli is tentatively attributed to a possible experience-mediated neural compensation associated to the tendency of the eye toward an inherent astigmatism at near.
Keywords: cylindrical power, blur, visual acuity, myopic presbyopes
A Letter to the Editor has been published for this article.
A Response to Letter by Mr Chaurasiya has been published for this article.
Introduction
In the eye, astigmatism produces an alteration of the retinal image. This optical effect may be accompanied by blur, the visual sense of lack of sharpness. Some authors discussed that something may be special about the visual performances in cases of astigmatism.1 Indeed, they compared the effects of “simulated” and “real” spherical defocus on visual acuity (VA) and found that there were only minor differences, while real astigmatism reduced VA by only half compared to simulated astigmatism. In general, a quantification of the astigmatism-induced blur is of interest for those cases of surgically-induced astigmatism (keratoplasty, cataract surgery),2,3 keratoconus,4 and for the optimisation of the design of multifocal and progressive addition lenses (PALs).5 For these reasons, the relationship between astigmatism and VA degradation has been studied by different authors. Some studies concerned the depth of focus (DoF), which is the variation in image distance from the retina which can be tolerated without incurring a lack of sharpness.6–12 Astigmatism typically causes an increase in the DoF extension,8 such as in studies concerning pseudophakic eyes and intraocular lenses.13–21 Other studies took into consideration the drop in visual performances for increasing astigmatism beyond the DoF extension.22–29 In the case of lens-induced astigmatism, the reduction in vision is typically reported to be lower with lens-induced with-the-rule (WTR) compared to against-the-rule (ATR) astigmatism,22–26 but there are also conflicting opinions.27–29 In astigmatic subjects, more than one study found that the visual impact of lens-induced astigmatism is linked to habitual axis due to an effect of adaptation of the astigmatic subjects, which is interpreted as an experience-mediated neural compensation.23,24,30,31 Myopic refractive error must also be taken into consideration. Indeed, many studies report better tolerance to blur of myopes than emmetropes. This is typically interpreted as a consequence of adaptation to the greater ocular aberrations and to an uncorrected level of blur in myopes.32–42 A further comment concerns the age-dependence of the astigmatism-induced blur. It is well known that aging disrupts compensation between corneal and internal astigmatism and there is a trend towards ATR astigmatism with ageing due to the change in corneal curvature.8,43–46 This could result in less astigmatism-blur sensitivity in elderly people.43,47 Some studies concerned the increase of tolerance to spherical defocus blur as a consequence of the increase of the DoF with age (DoF increase was estimated to be about 0.03 diopters per year between about 20 and 50 years48), together with an increased pupillary miosis, and an increase of ocular aberrations.8,48–51 Besides defocus blur, a better understanding of the astigmatism blur in elderly people in different conditions is expected to improve the maintenance of vision quality and the development of PAL designs.
This study aimed to provide additional experimental evidence on this theme by measuring and comparing the VA degradation both at far and at near distance as a function of the lens-induced astigmatism in a group of corrected myopic presbyopes. More specifically, the study aimed to study the effect of different cylindrical powers along two possible orthogonal axes, assessing VA both at far distance and at near distance, at high and at low contrast, in photopic and mesopic environmental conditions.
Materials and Methods
Preliminary Examination
The study was approved by the Ethics Committee of the University of Milano-Bicocca (prot. Int. 0055048/19, classif. II.18, C.IPA unimib C.AOO:AMMU06, C. reg. prot.: RP01). The research followed the tenets of the Declaration of Helsinki. Informed consent was obtained from the subjects after explanation of the nature and possible consequences of the study.
An initial eye and visual examination was performed. Ophthalmoscopy and slit-lamp examinations were carried out. Anomalies in ocular motility were investigated by the H pattern test, dissociated heterophorias through an alternating cover test and a prism bar, fusional reserves at far distance with a prism bar. A possible suppression was evaluated by the Worth 4-Dot test at far distance. Stereoscopic acuity was measured by the circles subtest (Wirt rings) of the Stereo Fly Test (Stereo Optical Co.) at 40 cm with the near optical correction arranged in a trial frame.
Non-cycloplegic subjective refraction at far distance was carried out by a phoropter procedure (monocular refraction by maximum plus to maximum VA and binocular balance by prism dissociated blur balance of accommodation).52 The spherical equivalent (SE) was calculated. The mean value (MSE) of the SEs of the two eyes measured at far distance was calculated. The addition for near (40 cm) was firstly determined according to the age expected procedure53 and then adjusted subjectively to obtain the final near addition by fused cross cylindrical procedure.52 Monocular amplitude of accommodation was evaluated by the push-up test.
The preliminary assessment also included the measurements of the best corrected visual acuity (BCVA) in logarithm of the minimum angle of resolution (logMAR) in different conditions as described in the paragraph 2.2.
Inclusion criteria were: being a presbyope (addition at near ≥2.00 diopters), having no known ocular or systemic pathology, not undergoing any medical therapy, being near-sighted in both eyes with a difference (absolute value) of the spherical equivalents in the two eyes ≤3.00 diopters, having a natural astigmatism <2.00 diopters in both eyes with a difference (absolute value) of the cylindric power in the two eyes ≤1.00 diopters, having a binocular photopic high-contrast (HC) BCVA at far distance ≤0.1 logMAR with a difference (absolute value) between the BCVA of the two eyes ≤0.1 logMAR, the difference (absolute value) between binocular photopic HC BCVA (logMAR) at far and at near being <0.1, and having good binocular vision (no anomalies in ocular motility, heterophorias at far and near and fusional reserves at far distance within the limit of the expected values,54 and a stereoscopic acuity of at least 60 arcsec). Fourteen participants were part of the sample under consideration having met the inclusion criteria.
BCVA
HC and low-contrast (LC) BCVAs were measured in photopic and mesopic conditions with the optical correction at far (4 m) arranged in a trial frame using Sloan letters displayed on a liquid crystal display (LCD) optotype system described in paragraph 2.3. A row of five Sloan letters was presented in descending logarithmic progression of 0.10 logMAR. Every single 5-letter row was randomly generated among twenty-eight different sets of balanced readability and presented in isolation.55
BCVA was also measured at near (40 cm) using a set of thirteen paper charts containing twelve lines of five Sloan-font letters. The row of five letters was reduced in size with a progression of 0.1 logMAR according the ETDRS set up between 0.8 (1.0) and −0.3 (0.1) logMAR at HC (LC). Each single five-letter line was chosen among twenty-eight different sets of five letters balanced for readability.55 The same set of five letters was used only once in the same chart and the sequence of the set of five letters in the different charts was always different.
A forced choice procedure56 and a letter-by-letter (0.02 logMAR) scoring criterion were used to assess the threshold.
Luminance
The illumination in the room was measured by a luxmeter HT307, HT Italia (450±50 lux and 8±2 lux in photopic and mesopic conditions, respectively).
As described in paragraph 2.2, HC and LC BCVA were measured at far using Sloan letters displayed on a LCD optotype system (Vision Chart CSO, Florence, Italy). At near, HC and LC BCVAs were measured using Sloan letters on paper charts, as described in paragraph 2.2. Luminance was measured (photometer Chroma Meter CS-100A, Minolta, Japan) to test the difference between actual (Table 1) versus nominal (100% at HC and 10% at LC) contrast.
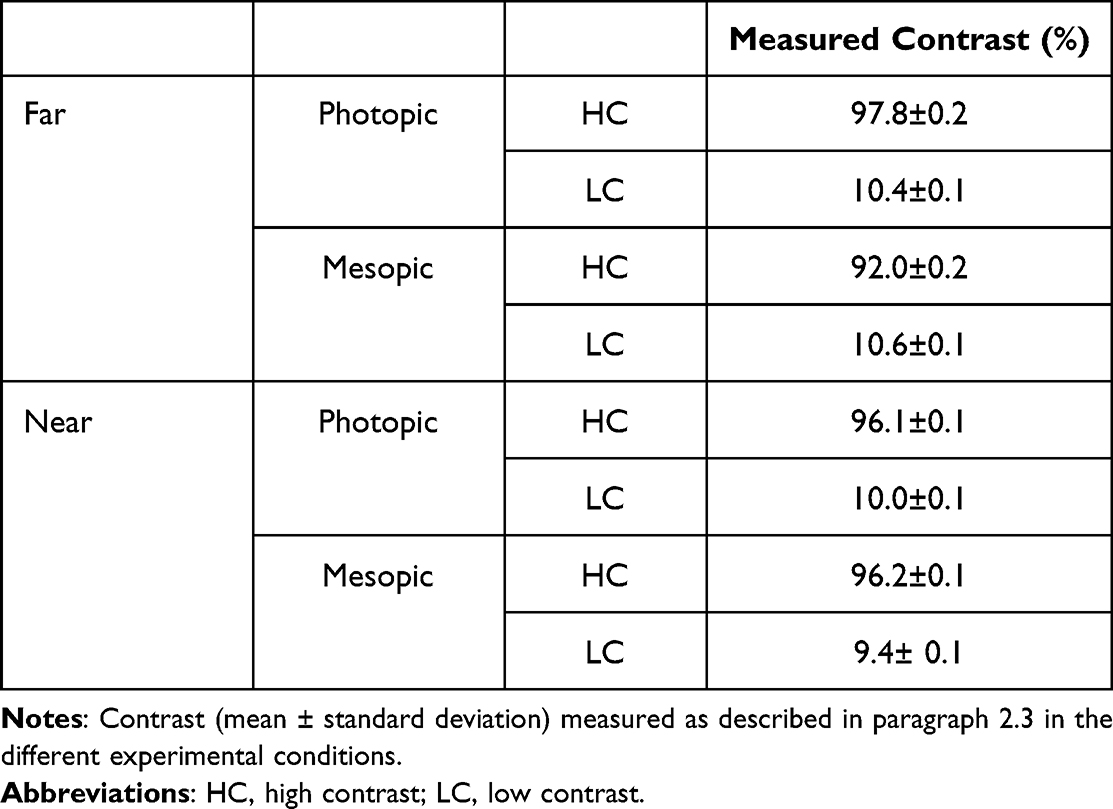 |
Table 1 Measured Contrast |
Lens-Induced Astigmatism
The experimental phase consisted of VA measurements carried out in photopic and mesopic conditions, at far and at near, with HC and LC stimuli, and for different levels and axis orientation of the added lens-induced cylindric power. VA was evaluated by adding, in the trial frame, different cylindrical lenses to the best subjective correction evaluated for each subject during the preliminary examination. For VA assessment at near, the addition in both eyes was also added. Two axis orientations were tested, ie, 90° (negative cylindrical power inducing WTR astigmatism) and 180° (negative cylindrical power inducing ATR astigmatism). For each axis orientation, six levels of cylindrical power were tested (−0.25 diopters, −0.50 diopters, −0.75 diopters, −1.00 diopters, −1.50 diopters, −2.00 diopters). The negative cylindrical power was inserted together with a positive spherical power equal to half the cylindrical power to keep the Sturm’s conoid centred on the retina. Measurement was also taken without any cylindrical power (plano).
The number of conditions under which VA was measured (Figure 1) was one hundred and four for each participant. Different conditions were selected in random order. A single masked crossover study was performed. Participants were masked to the randomisation scheme, but investigators were not. Each participant had to sit six times to be assessed during the two phases of the study. During the first visit, the preliminary examination was carried out. The experimental phase of the study was divided in the second, third, fourth, fifth, and sixth visits lasting about 45 minutes each.
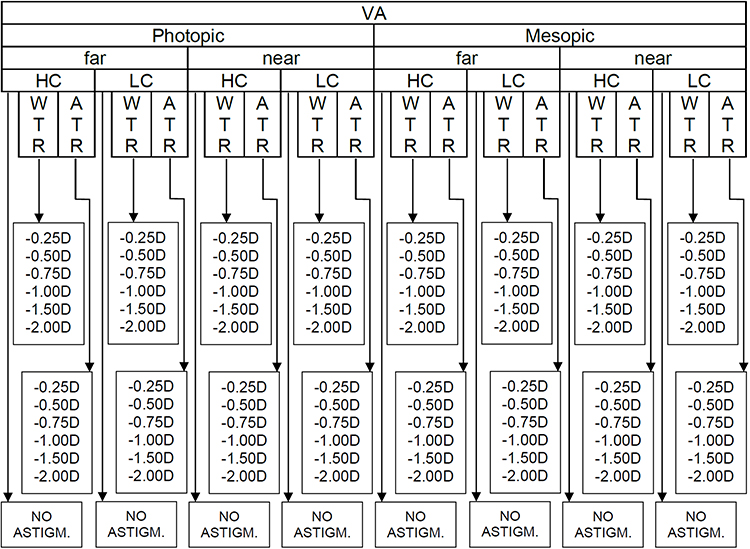 |
Figure 1 Scheme of the study design showing the conditions under which VA was measured, ie at far and at near distance, in photopic and mesopic conditions, at high contrast and low contrast, and for six different level of power and two different axis orientations of the added cylindrical lens. Abbreviations: VA, visual acuity; D, diopters; WTR, astigmatism with-the-rule; ATR, astigmatism against-the-rule; HC, high contrast; LC, low contrast. |
Scatterplots were plotted to evaluate the relationship between VA (logMAR) and the level of the lens-induced astigmatism for each participant and for each condition. For this purpose, the actual cylindrical power affecting the ocular system was determined taking into account the optical correction arranged in a trial frame and the distance between the ocular apex and the frame. Linear regressions were worked out to find the corresponding equations describing the dependence of the VA on the lens-induced cylindric power. The slope of the line was considered as an indicator of the extent of the VA degradation. Indeed, the slope represents the variation in logMAR corresponding to the addition of 1.00 diopters of cylindrical power. Instead, one-tenth of the reciprocal of the angular coefficient can be used as a definition of the DoF because it represents the cylindrical power which produces a 0.1 logMAR worsening of the VA.22
Statistical Analyses
Non-parametric statistics were used to analyse the data. To describe how well the relationship between two variables is described using a monotonic function, the Spearman’s rank correlation coefficient was calculated. For paired comparison, the Wilcoxon signed-rank test was used to evaluate difference between conditions. Statistical significance was set at the overall level (ps) of 0.05. In case of multiple comparisons, the Bonferroni correction was adopted and the significance level was set at ps/n, where n is the number of hypotheses. All statistical analyses were performed using IBM SPSS Statistics 26.
Results
The main outcomes of the preliminary visual assessment are reported in Table 2. The paired comparison between the BCVA at far and at near without any additional cylindrical power showed that no statistical difference was found with HC stimuli. Statistically significant difference was found between far and near BCVA in case of LC stimuli.
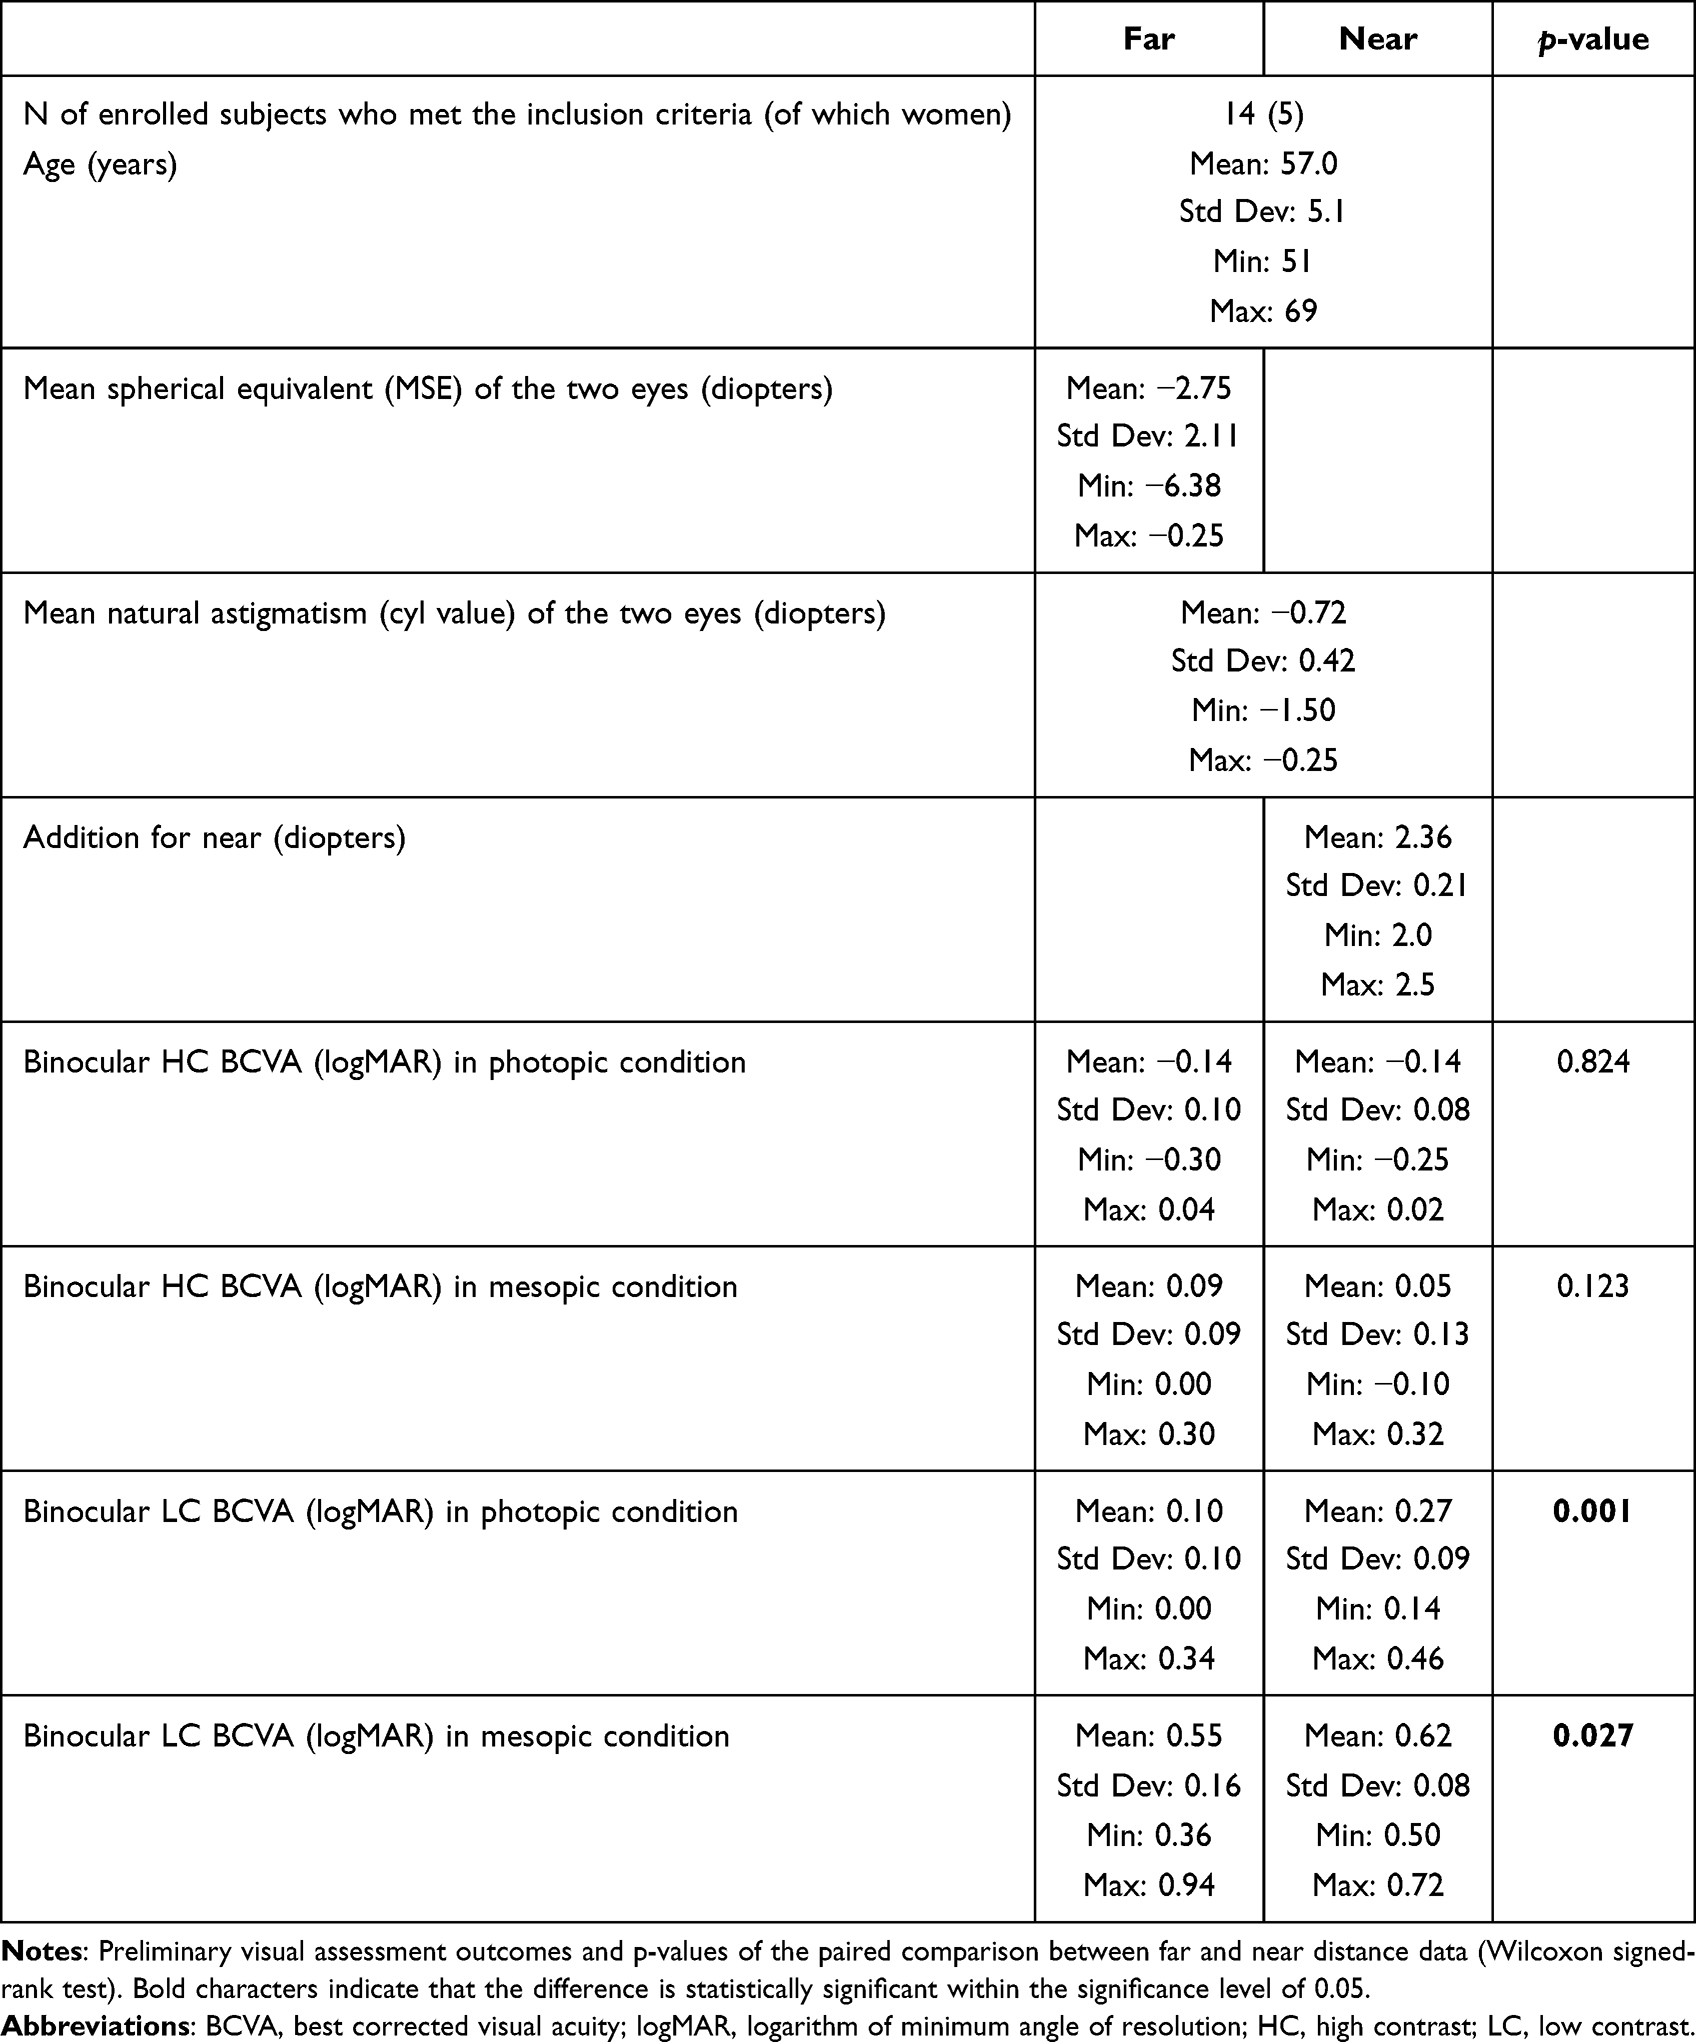 |
Table 2 Preliminary Assessment |
An example of the effect of the lens-induced astigmatism on VA is reported in Figure 2 as obtained on a participant in the different experimental conditions. A positive slope of the regression line indicates a worsening of the VA. For each subject and for each experimental condition, a linear regression of the data was performed, similarly as performed in Figure 2. The fitting made it possible to obtain the slopes of the lines and the DoF as defined above.
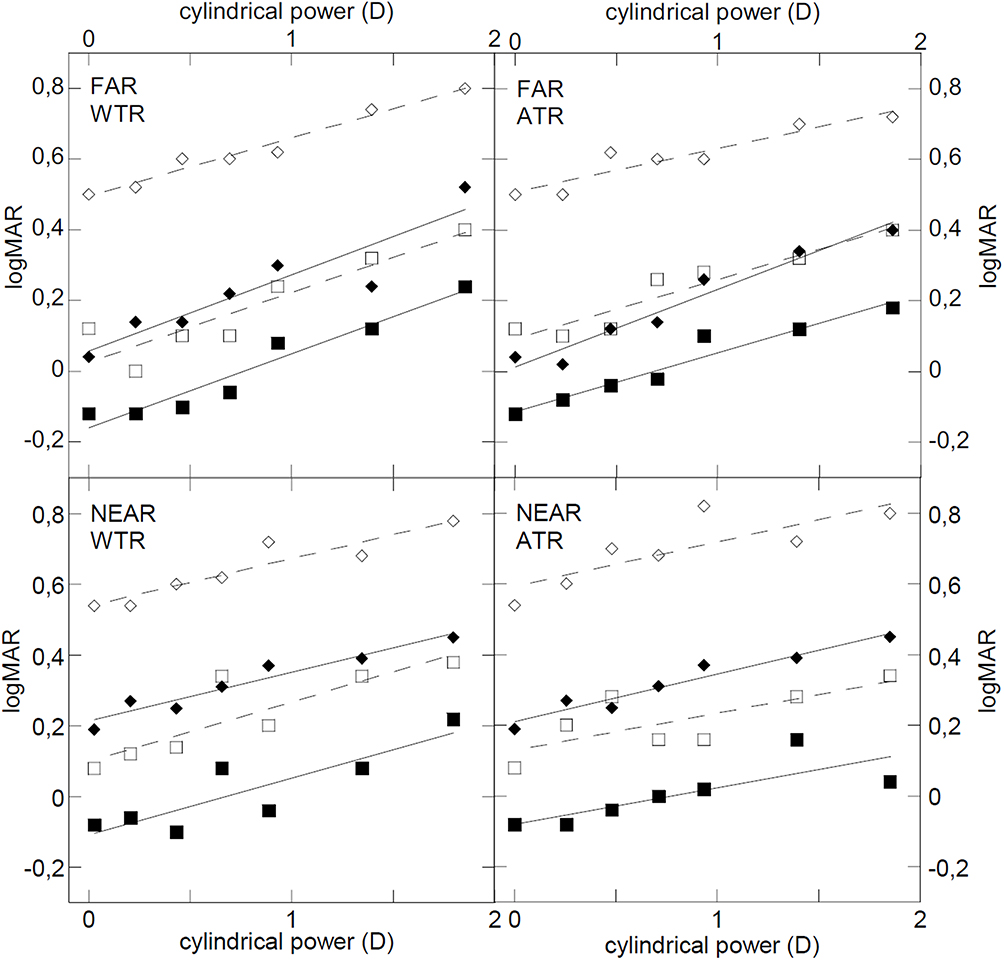 |
Figure 2 Visual acuity (logMAR) of one participant measured at far and at near distance, in photopic (full markers) and mesopic (empty markers) conditions, for HC (squares) and LC (diamonds) stimuli at different levels of induced WTR and ATR astigmatism. The continuous lines show the results of the linear regressions of the data. Abbreviations: D, diopters; logMAR, logarithm of minimum angle of resolution; WTR, with-the-rule; ATR, against-the-rule. |
To study the dependence of the VA degradation on the level of myopia of the subject, the Spearman’s rank correlation coefficient was calculated for the VA slopes with respect to the MSE of each subject (Table 3). No significant correlations were found with p-values all well above the significance threshold.
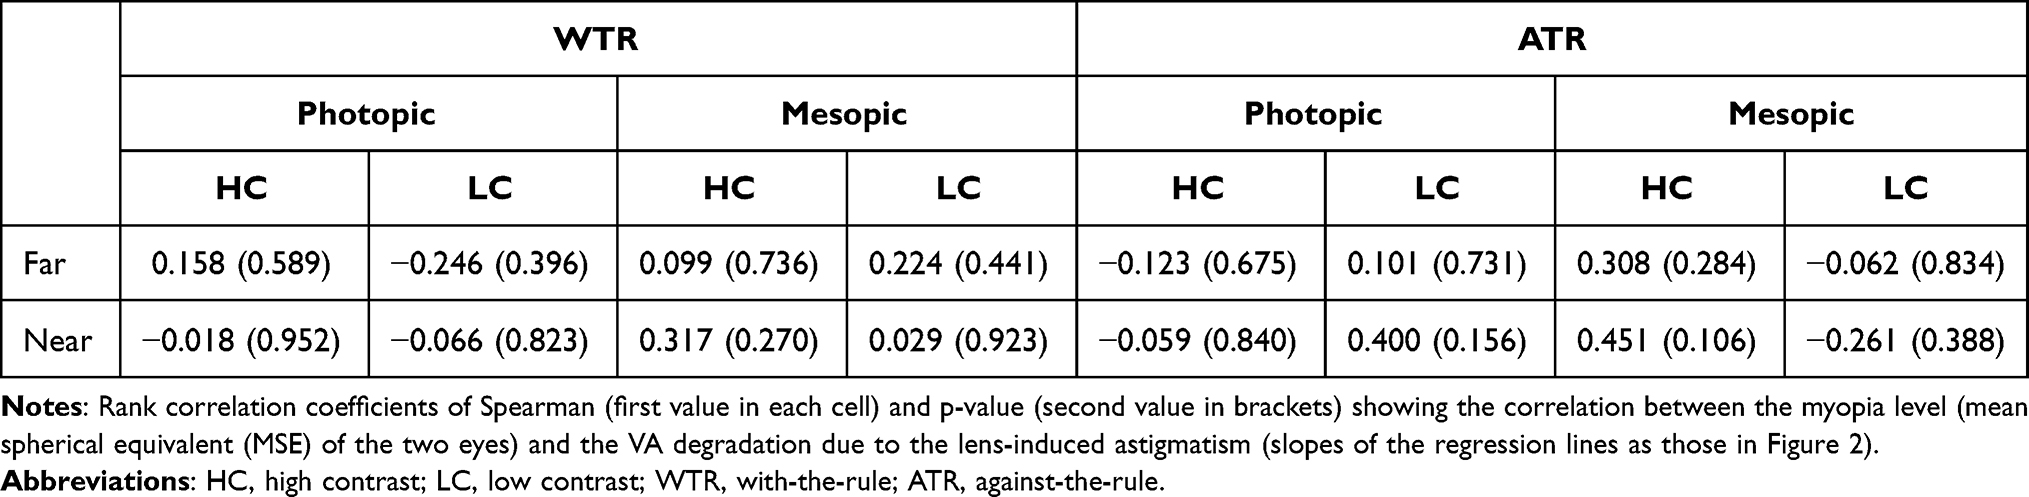 |
Table 3 VA Degradation vs Myopia Level |
Figure 3a shows the mean slope (mean of the angular coefficients of the fourteen subjects) in each experimental condition. The same figure (panel b) also shows the mean of the DoFs calculated as one-tenth of the reciprocal of the slopes.
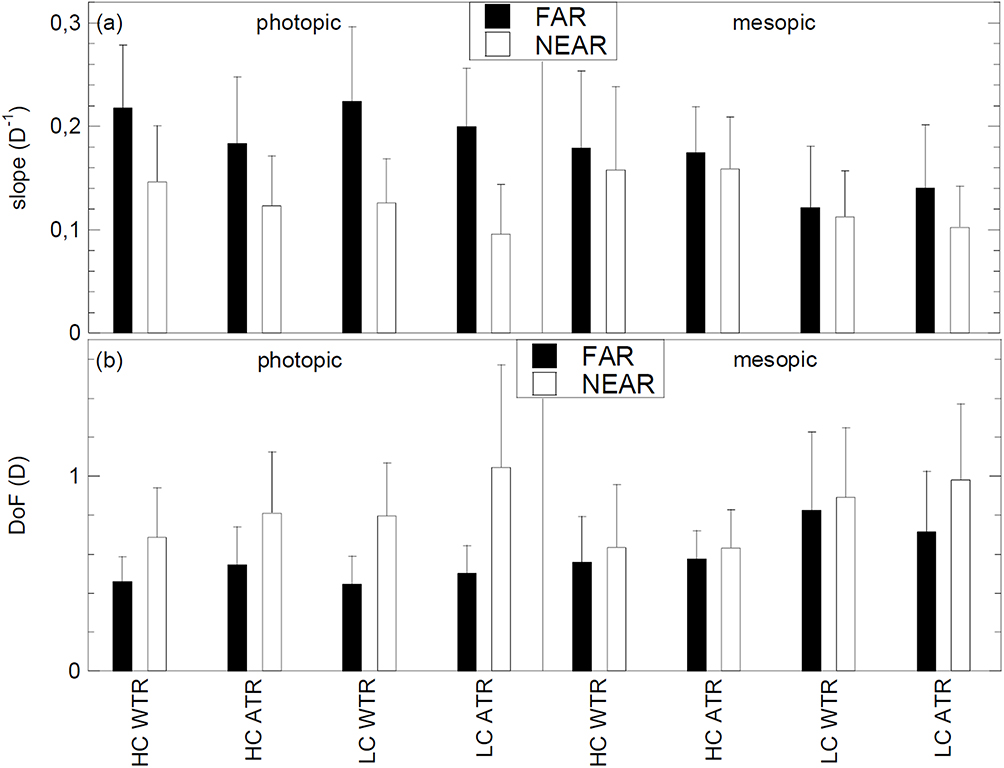 |
Figure 3 (a) Mean slopes indicating the visual acuity (A) drop induced by astigmatism (WTR and ATR) at far and at near distance, for HC and LC stimuli, in photopic and mesopic conditions. (b) Mean DoF calculated as one tenth of the reciprocal of the slopes, thus representing the cylindrical power which produces a 0.1 logMAR worsening of the visual acuity. The bars indicate the standard deviations of the data. Abbreviations: DoF, depth of focus; D, diopters; D−1, diopters−1; WTR, astigmatism with-the-rule; ATR, astigmatism against-the-rule; HC, high contrast; LC, low contrast. |
Using the slopes as parameters, various statistical comparisons were made. Table 4 shows the results focused on the comparison between the drop of VA at far and at near distance. The difference between far vision and near vision is clear in photopic conditions. The statistical comparison on which Table 5 focuses is between WTR and ATR astigmatism and no statistically significant differences are found. Table 6 and Table 7 allow the comparison between mesopic and photopic conditions and between the two contrast levels, respectively. Two out of eight differences are significant when comparing photopic and mesopic conditions. In particular, the VA degradation is worse in photopic conditions (for LC stimuli at far). A similar scenario is observed in Table 7 although with no statistical relevance. Indeed, in two conditions out of eight (corresponding both to the mesopic condition), the p-value is about 0.008, ie, very close to the threshold 0.05/8. In these cases, the VA degradation with HC stimuli is worse compared with LC ones. For each comparison, each (Tables 4–7) shows the mean values and the standard deviations of the slopes for the two groups, the p-values obtained by Wilcoxon test, the difference (Δ) between the means of the measured data, and the threshold value (Δthreshold) for the difference between the means that can be proved statistically with significance at 0.05. This threshold was calculated by a power analysis based on the number of available data (fourteen) and on the standard deviations of the two groups. As can be seen in Tables 4–7, Δthreshold varies between about 0.040 diopters−1 and 0.070 diopters−1, both for comparisons in which the difference turned out to be statistically significant (bold in the tables) and for comparisons which, on the contrary, did not show a significant difference. It can be concluded that, in general, the sample size of this experiment did not allow to demonstrate any possible difference lower than 0.055±0.015 diopters−1 between the slopes of two investigated subgroups. In other words, the sample size did not allow to demonstrate any possible difference below 2.7±0.8 letters in one row of the logMAR chart. Some differences between the means of two subgroups proved to be higher than the detectable threshold and reached values of 0.10 diopters−1 (corresponding to one complete row in the chart).
 |
Table 4 Far vs Near Comparison |
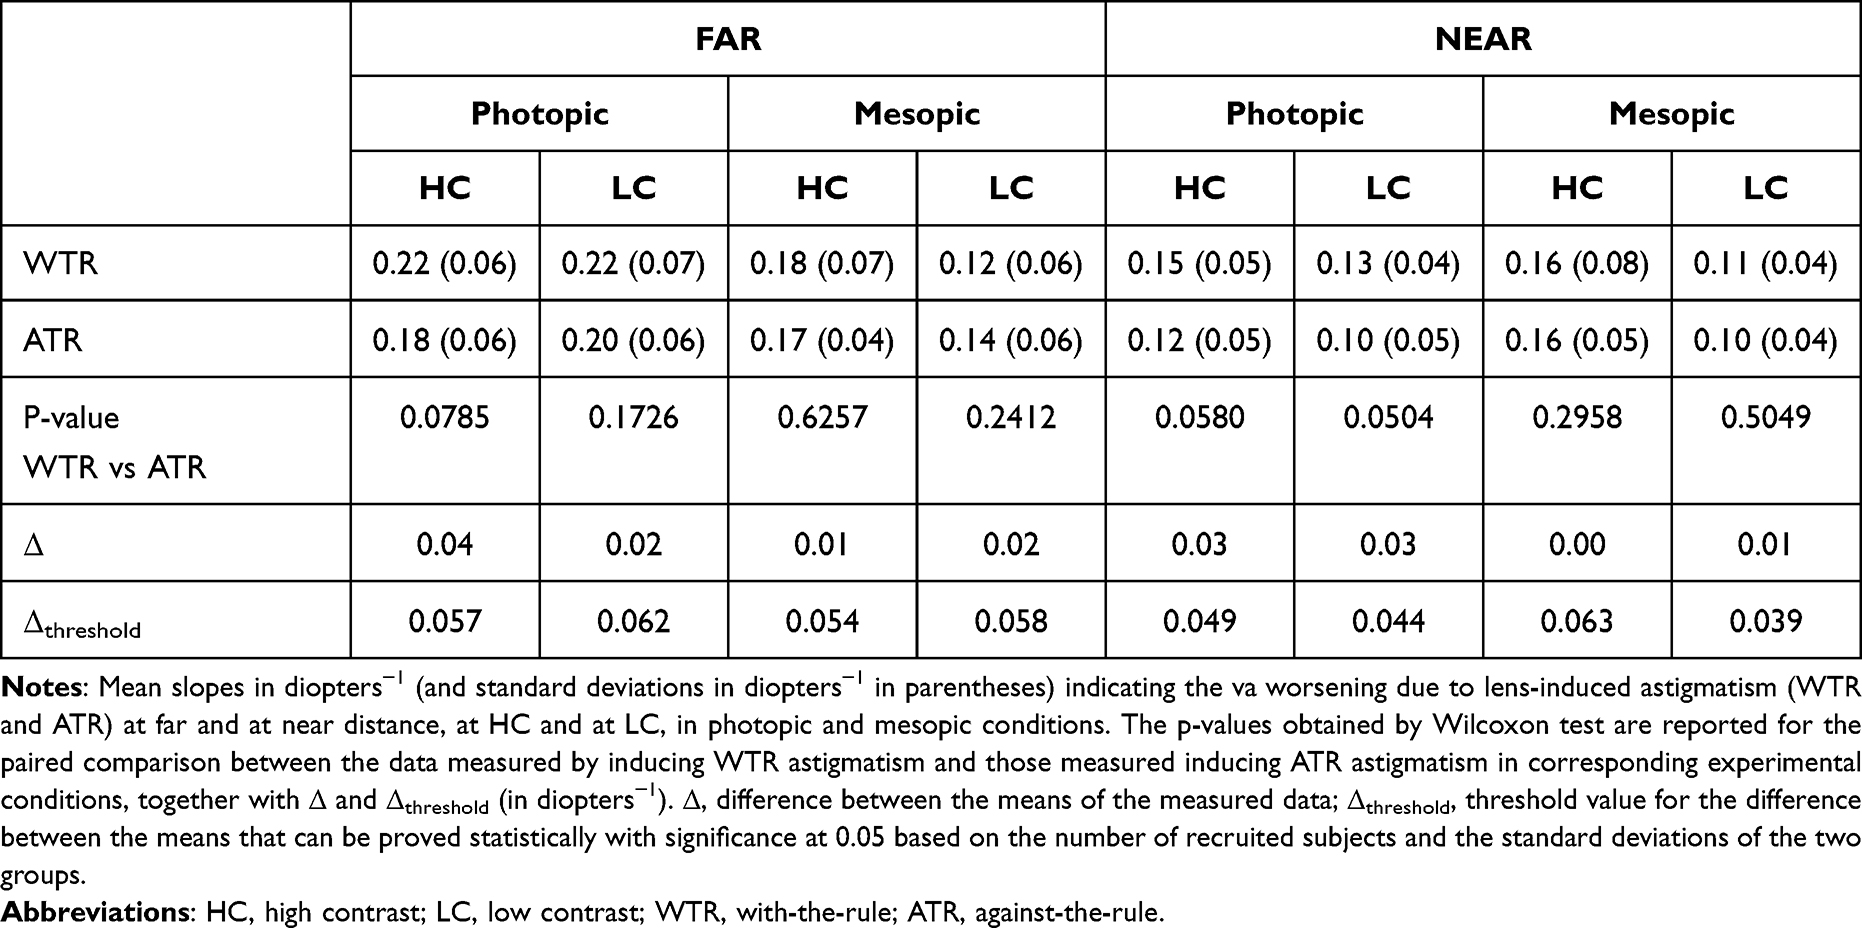 |
Table 5 WTR vs ATR Comparison |
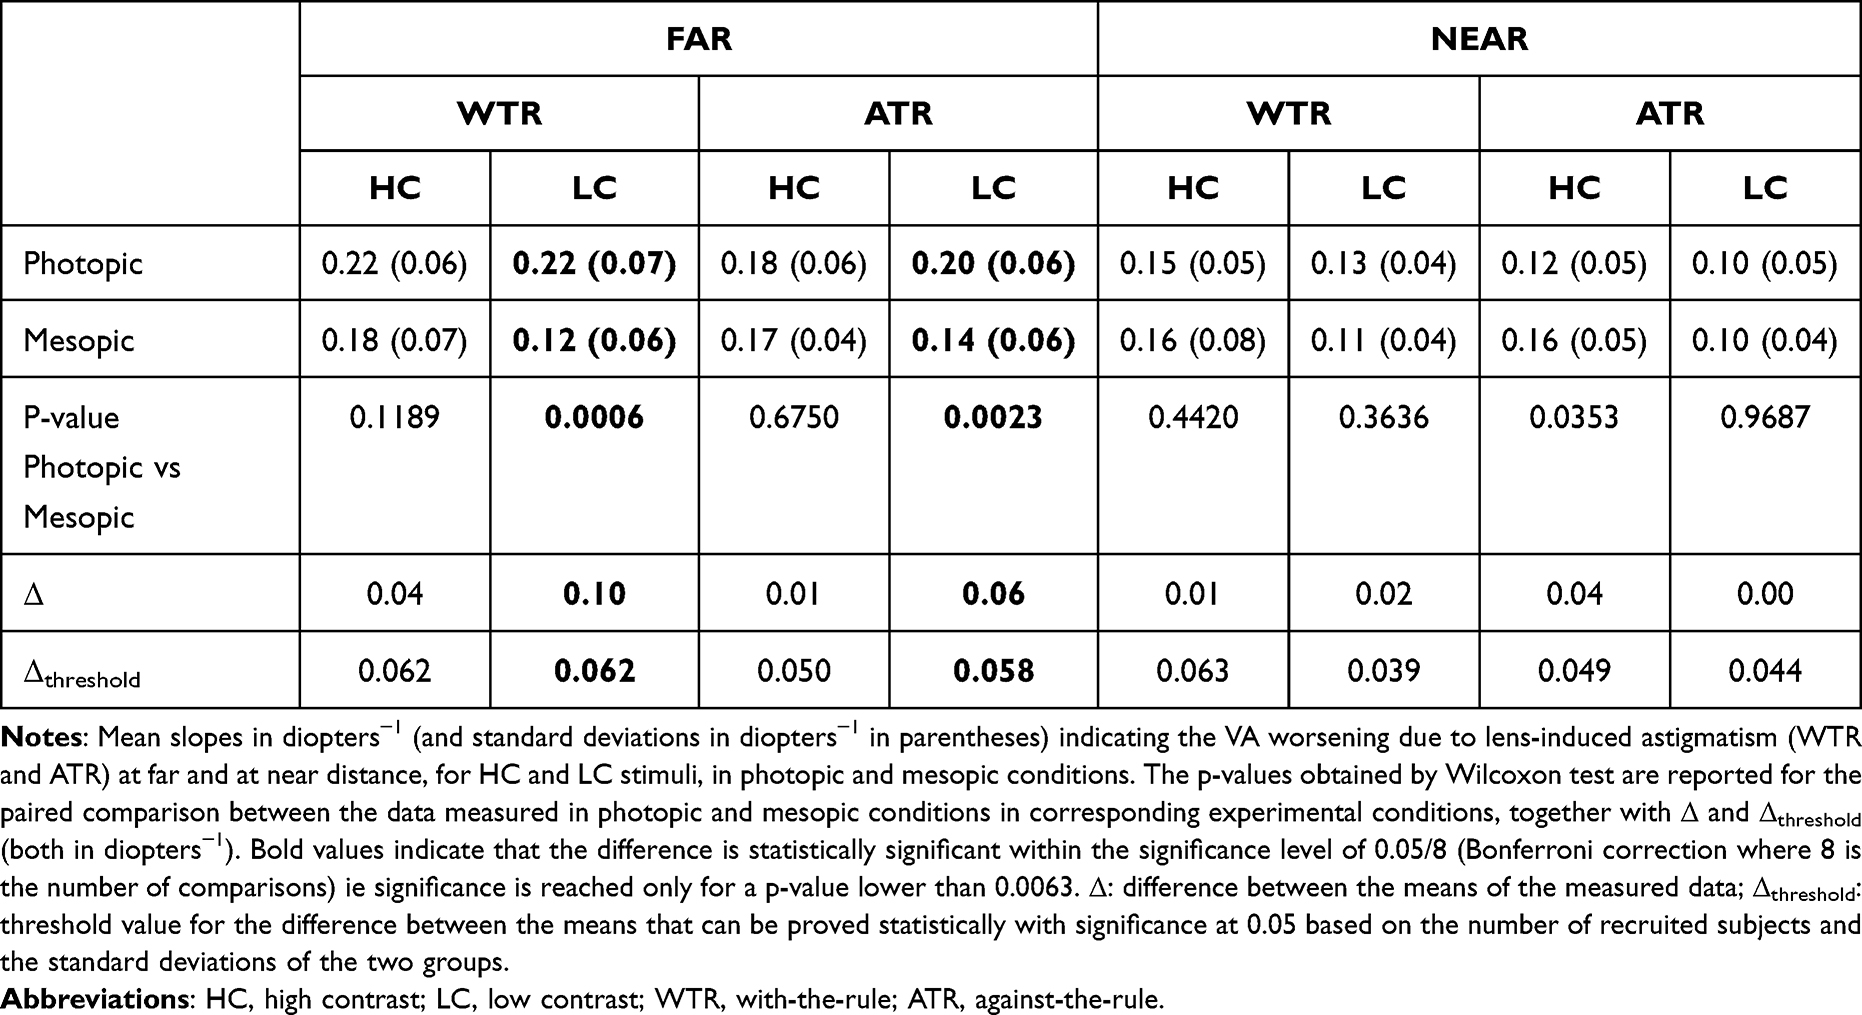 |
Table 6 Photopic vs Mesopic Comparison |
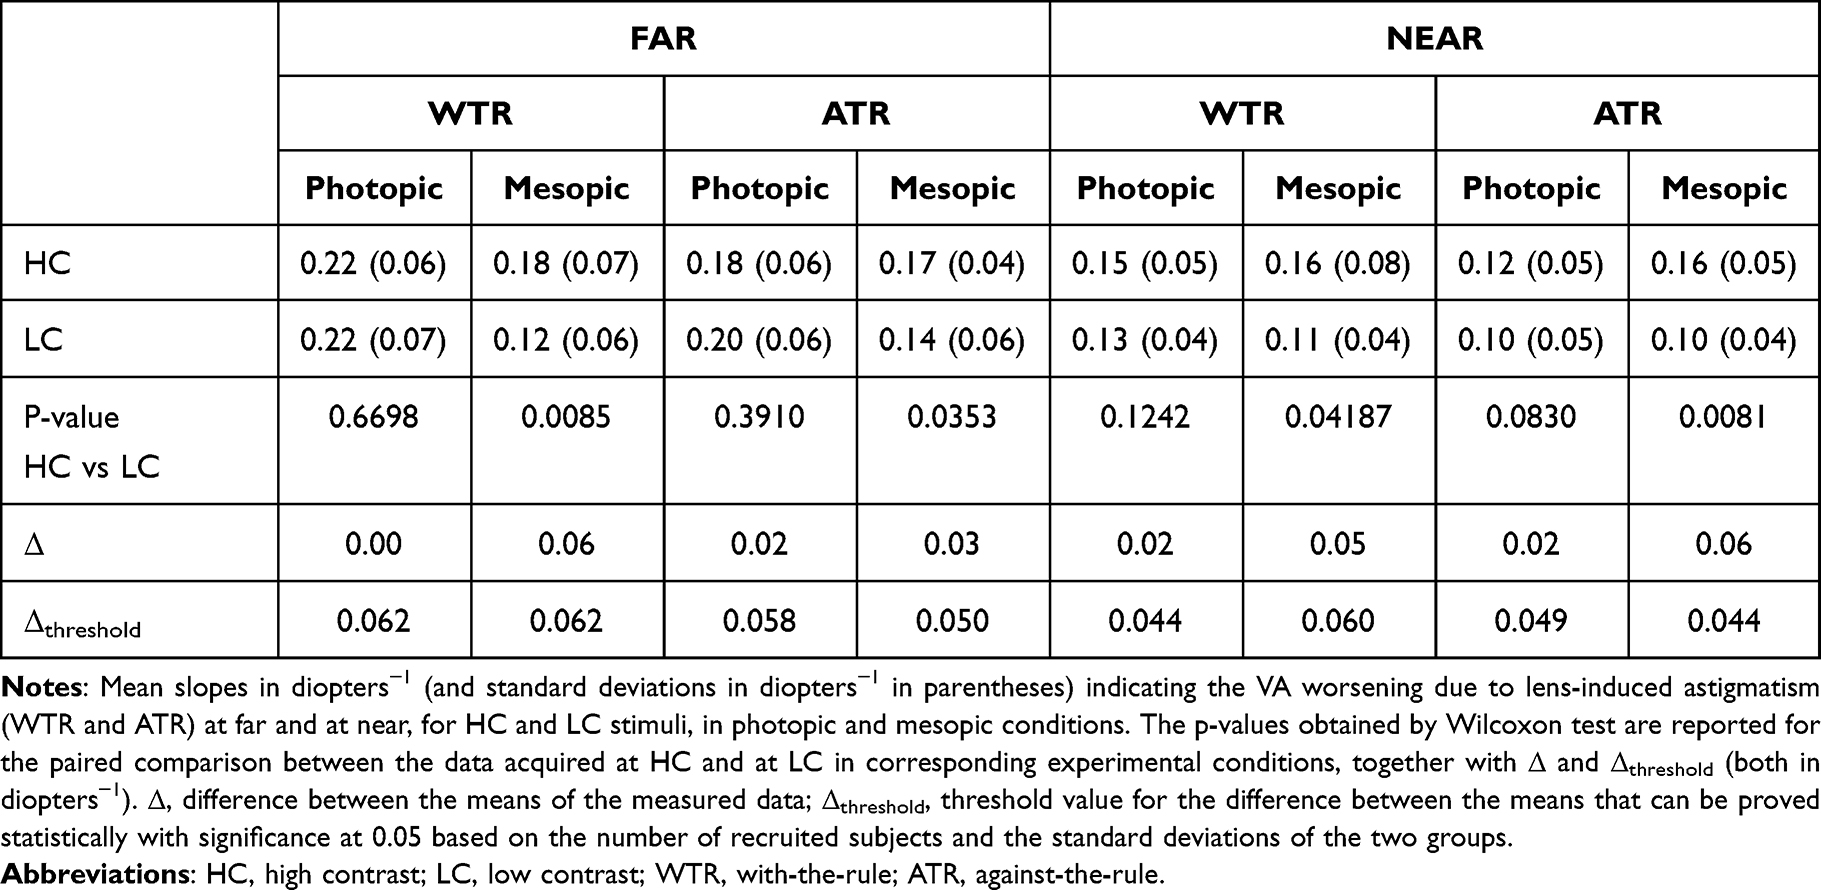 |
Table 7 HC vs LC Comparison |
Discussion
The measured VA (logMAR) of myopic presbyopes as a function of the lens-induced astigmatism was described by regression lines in all investigated experimental conditions. The slopes of the linear regression (or the corresponding DoFs) can be compared with some values reported in the literature. Leube et al, after blocking the accommodation, evaluated the DoF of young subjects by measuring binocular defocus curves in the spherical range of ±1.5 diopters.22 They defined the DoF as the horizontal dioptric range at the threshold level of +0.1 logMAR compared to the best VA. They found 0.89±0.32 diopters for far vision and 0.94±0.40 diopters for near vision. For a comparison with the DoFs of the present work, the values of Leube et al22 must be divided by two because their definition of DoF includes both a positive and a negative defocus. However, it must also be said that 1.00 diopters of cylindrical power applied in this work should be compared to a spherical defocus of 0.50 diopters since a positive spherical power equal to half the cylindrical power was here added. These two opposite aspects make it possible to directly compare the values of Leube et al22 with those in Figure 3b. At far, the mean values in Figure 3b (0.46±0.14 diopters and 0.56±0.20 diopters for the two axis orientations) are slightly lower than the corresponding value of Leube et al22 (0.89±0.32 diopters) although the order of magnitude is similar considering the distribution of the results around the means. Similarly, the values in Figure 3b at near (0.68±0.26 diopters and 0.82±0.32 diopters for the two axis orientations) are slightly lower than the value in Leube et al (0.94±0.40 diopters), but compatible when considering the distribution of the results around the means. A difference is the age of the participants since Leube et al22 analysed young subjects, while this work concerns presbyopic eyes. One might expect less astigmatism-blur sensitivity (higher DoF) in elderly people,8,43–47 but the comparison between the data of Leube et al22 on young subjects and the results of this paper on older subjects appears to be the opposite. One might expect less astigmatism-blur sensitivity because aging produces a trend towards eye astigmatism43,47 and an increase of the DoF with age was also reported for spherical defocus blur,48 together with the increased pupillary miosis and ocular aberrations.8,48–51 It must be said that, the work of Leube et al22 concerns the reduction of VA as a function of defocus while this work concerns astigmatism blur.
The slightly lower DoF compared to the work of Leube et al22 can also be described as a slightly greater VA slope as a function of the additional cylindrical power. A recent work in which the VA worsening is directly reported is that of Hughes et al.23 They considered far vision and reported a worsening of logMAR due to 1.00 diopters of cylindrical power varying from 0.26±0.09 to 0.45± 0.12 logMAR, depending on the axis of the induced astigmatism and on the natural astigmatism of the subjects, if present. Due to the added positive spherical power of half the cylindrical power, the VA drop due to 1.00 diopters of cylindrical power in this work should be compared with the 0.50 diopters drop in Hughes et al23 Therefore the values shown in Figure 3a at far (0.22±0.06 diopters−1 and 0.18±0.06 diopters−1 for the two axis orientations) are in very good agreement with the results of Hughes et al (from 0.26±0.09 to 0.45± 0.12).23 On the contrary, a lower slope was found by Serra et al,26 who studied the influence of 2.00 diopters lens-induced astigmatism on VA at far and found a VA worsening ranging from 0.19 to 0.28 logMAR. Since no spherical compensation was added,26 the slopes in Figure 3a (0.22±0.06 diopters−1 and 0.18±0.06 diopters−1 for the two axis orientations) should be compared with ¼ of the drop reported by Serra et al (¼ of 0.19–0.28).26 The agreement is relatively poor, the slopes in Figure 3a being three to four times greater. Also, Casagrande et al29 investigated the effect of astigmatism on VA. They evaluated near vision performances. Participants were fogged with cylindrical lenses. These authors evaluated the effect of WTR astigmatism (−1.50 diopters), which resulted in 0.09 logMAR worsening of near VA compared with no cylinder power added. Since no spherical compensation was added,29 1/3 of 0.09 should be compared with 0.15±0.05 and 0.12±0.05 diopters−1 (Figure 3a).
From the measurements conducted in the present study, it emerges that the most marked VA worsening induced by astigmatism clearly occurred at far with HC stimuli in photopic conditions, showing a significant difference compared to the steepness of the VA drop at near (Figure 3 and Table 4). It must be said that, although the assessments were conducted on the same subjects in the same environment, some methodological differences between far and near measurements were inevitable. The near test was on paper, while at far the measurements were carried out with an LCD system. VA at far distance was measured using an isolated line of letters, while all lines of the chart were simultaneously visible during near measurements. Changes of the interpupillary distance were not taken into consideration between far and near conditions. The likely decrease in pupil size at near due to convergence was not compensated. Nevertheless, without any added cylinder, the data acquired at near in photopic conditions and HC stimuli provided similar results as the corresponding analyses performed at far (Table 2). Conversely, in the same experimental condition the slopes of the VA drop in the presence of astigmatism were significantly different (Figure 3a and Table 4). The tendency of the eye toward an inherent astigmatism at near depending on the accommodative demand could be a possible explanation for the greater tolerance to astigmatism blur.57–59 This tolerance could be due to an experience-mediated neural compensation, similarly as found in case of spherical defocus blur for subjects with relatively high myopia, but further investigations are required.34,37–39,41,57–60 This compensation is expected to be a long-term neural adaptation that takes place at the brain level of the visual pathway to compensate a reduction in optical quality of the retinal image.
Concerning the axis orientation, Tsukamoto et al found a greater accommodative response at near in the vertical meridian than in the horizontal meridian in binocular condition in emmetropes (WTR accommodative astigmatism).58 Lee et al found that WTR astigmatism and oblique astigmatism were increased on near vision.59 Overall, a tendency toward WTR astigmatism at near is reported,58,59,61 so that a greater WTR blur tolerance might be expected. On the contrary, age is expected to lead to an ATR astigmatism which could make presbyopes less sensitive to ATR blur.43,47 In this study, no significant differences were found between the VA worsening for WTR and ATR orientations (Table 5). In the sample examined in this work, there are subjects with natural astigmatism whose axis could influence the difference between WTR and ATR, as discussed in the literature.23,24,30 The interference between all these aspects (WTR accommodative astigmatism, ATR age astigmatism, natural astigmatism) may have influenced the possibility of observing clear dependencies on the axis of the lens-induced astigmatism.
Unlike the measurements in the photopic environment, the clear difference between VA worsening at near and at far due to lens-induced astigmatism was not observed in mesopic conditions.
Conclusion
The VA degradation due to lens-induced astigmatism (with a positive spherical power equal to half the negative cylindrical power in order to keep the Sturm’s conoid centred on the retina) has been investigated in myopic eyes with presbyopia. A linear trend was found for the measured VA (logMAR) as a function of the lens-induced astigmatism in all investigated experimental conditions.
In photopic conditions with HC stimuli, the tolerance to astigmatism blur was found better at near than at far distance. This is here tentatively attributed to a possible long-term experience-mediated neural compensation associated to the tendency of the eye toward an inherent astigmatism at near, similarly as found in the literature in case of spherical defocus blur for subjects with relatively high myopia.
Disclosure
The authors have no proprietary interest in any of the materials mentioned in this article. NV is an employee of Hoya Vision Care. The project was partially funded by Hoya Vision Care. The authors report no other conflicts of interest in this work.
References
1. Ohlendorf A, Tabernero J, Schaeffel F. Visual acuity with simulated and real astigmatic defocus. Optom Vis Sci. 2011;88:562–569. doi:10.1097/OPX.0b013e31821281bc
2. Sharma N, Pangtey MS, Vajpayee RB, et al. Surgically induced astigmatism after laser in situ keratomileusis for spherical myopia. J Refract Surg. 2002;18:239–244. doi:10.3928/1081-597X-20020501-05
3. Marcos S, Rosales P, Llorente L, Jimenez-Alfaro I. Change in corneal aberrations after cataract surgery with 2 types of aspherical intraocular lenses. J Cataract Refract Surg. 2007;33:217–226. doi:10.1016/j.jcrs.2006.10.021
4. Barbero S, Marcos S, Merayo-Lloves J, Moreno-Barriuso E. Validation of the estimation of corneal aberrations from videokeratography in keratoconus. J Refract Surg. 2002;18:263–270. doi:10.3928/1081-597X-20020501-09
5. Villegas EA, Artal P. Spatially resolved wavefront aberrations of ophthalmic progressive-power lenses in normal viewing conditions. Optom Vis Sci. 2003;80:106–114. doi:10.1097/00006324-200302000-00006
6. Cho MH, Benjamin WJ. Correction with multifocal spectacle lenses. In: Benjamin WJ, editor. Borish’s Clinical Refraction: Principles and Practice. Philadelphia: Saunders; 1998:888–927.
7. Atchison DA, Charman WN, Woods RL. Subjective depth-of-focus of the eye. Optom Vis Sci. 1997;74:511–520. doi:10.1097/00006324-199707000-00019
8. Bin Wang MS, Kenneth J, Ciuffreda KJ. Depth-of-focus of the human eye: theory and clinical implications. Surv Ophthalmol. 2006;51:75. doi:10.1016/j.survophthal.2005.11.003
9. Marcos S, Moreno E, Navarro R. The depth-of-field of the human eye from objective and subjective measurements. Vision Res. 1999;39:2039–2049. doi:10.1016/S0042-6989(98)00317-4
10. Atchison DA, Fisher SW, Pedersen CA, Ridall PG. Noticeable, troublesome and objectionable limits of blur. Vision Res. 2005;45:1967–1974. doi:10.1016/j.visres.2005.01.022
11. Vasudevan B, Ciuffreda KJ, Wang B. An objective technique to measure the depth-of-focus in free space. Graefes Arch Clin Exp Ophthalmol. 2006;244:930–937. doi:10.1007/s00417-005-0174-5
12. Yi F, Iskander DR, Collins MJ. Estimation of the depth of focus from wavefront measurements. J Vis. 2010;10:1–9. doi:10.1167/10.4.3
13. Huber C. Planned myopic astigmatism as a substitute for accommodation in pseudophakia. J Am Intraocul Implant Soc. 1981;7:244–249. doi:10.1016/S0146-2776(81)80006-7
14. Huber C. Myopic astigmatism: a substitute for accommodation in pseudophakia. Doc Ophthalmol. 1981;52:123–178. doi:10.1007/BF01675203
15. Datiles MB, Gancayco T. Low myopia with low astigmatic correction gives cataract surgery patients good depth of focus. Ophthalmology. 1990;97:922–926. doi:10.1016/S0161-6420(90)32480-6
16. Sawusch MR, Guyton DL. Optimal astigmatism to enhance depth of focus after cataract surgery. Ophthalmology. 1981;98:1025–1029. doi:10.1016/S0161-6420(91)32182-1
17. Trindade F, Frasson M, Frasson M. Benefit of against-the-rule astigmatism to uncorrected near acuity. J Cataract Refract Surg. 1997;23:82–85. doi:10.1016/S0886-3350(97)80155-1
18. Hayashi K, Hayashi H, Nakao F, Hayashi F. Influence of astigmatism on multifocal and monofocal intraocular lenses. Am J Ophthalmol. 2000;130(4):477–482. doi:10.1016/S0002-9394(00)00526-2
19. Nagpal KM, Desai C, Trivedi RH, Vasavada AR. Is pseudophakic astigmatism a desirable goal? Indian J Ophthalmol. 2000;48:213–216.
20. Singh A, Pesala V, Garg P, Bharadwaj SR. Relation between uncorrected astigmatism and visual acuity in Pseudophakia. Optom Vis Sci. 2013;90:378–384. doi:10.1097/OPX.0b013e318288afb5
21. Mimouni M, Nemet A, Pokroy R, Sela T, Munzer G, Kaiserman I. The effect of astigmatism axis on visual acuity. Eur J Ophthalmol. 2017;27:308–311. doi:10.5301/ejo.5000890
22. Leube A, Ohlendorf A, Wahl S. The influence of induced astigmatism on the depth of focus. Optom Vis Sci. 2016;93:1228–1234. doi:10.1097/OPX.0000000000000961
23. Hughes AR, Mallen EAH, Elliott DB. The visual impact of lens-induced astigmatism is linked to habitual axis. Optom Vis Sci. 2017;94:260–264. doi:10.1097/OPX.0000000000001000
24. Vinas M, de Gracia P, Dorronsoro C, et al. Astigmatism impact on visual performance: meridional and adaptational effects. Optom Vis Sci. 2013;90:1430–1442. doi:10.1097/OPX.0000000000000063
25. Wolffsohn JS, Bhogal G, Shah S. Effect of uncorrected astigmatism on vision. Cataract Refract Surg. 2011;37:454–460. doi:10.1016/j.jcrs.2010.09.022
26. Serra PM, Cox MJ, Chisholm CM. The effect of astigmatic axis on visual acuity measured with different alphabets in Roman alphabet readers. Clin Optom. 2018;10:93–102. doi:10.2147/OPTO.S166786
27. Remón L, Tornel M, Furlan WD. Visual acuity in simple myopic astigmatism: influence of cylinder axis. Optom Vis Sci. 2006;83:311–315. doi:10.1097/01.opx.0000216099.29968.36
28. Watanabe K, Negishi K, Kawai M, Torii H, Kaido M, Tsubota K. Effect of experimentally induced astigmatism on functional, conventional, and low-contrast visual acuity. J Refract Surg. 2013;29:19–24. doi:10.3928/1081597X-20121211-01
29. Casagrande M, Baumeister M, Bühren J, Klaproth OK, Titke C, Kohnen T. Influence of additional astigmatism on distance-corrected near visual acuity and reading performance. Br J Ophthalmol. 2014;98:24–29. doi:10.1136/bjophthalmol-2013-303066
30. Vinas M, Sawides L, de Gracia P, Marcos S. Perceptual adaptation to the correction of natural astigmatism. PLoS One. 2012;7:e46361. doi:10.1371/journal.pone.0046361
31. Hastings GD, Schill AW, Hu C, Coates DR, Applegate RA, Marsack JD. Orientation-specific long-term neural adaptation of the visual system in keratoconus. Vision Res. 2021;178:100–111. doi:10.1016/j.visres.2020.10.002
32. Gwiazda J, Thorn F, Bauer J, et al. Myopic children show insufficient accommodative response to blur. Invest Ophthalmol Vis Sci. 1993;34:690–694.
33. Jiang BC. Integration of a sensory component into the accommodation model reveals differences between emmetropia and late-onset myopia. Invest Ophthalmol Vis Sci. 1997;38:1511–1516.
34. Rosenfield M, Abraham-Cohen JA. Blur sensitivity in myopes. Optom Vis Sci. 1999;7:303–307. doi:10.1097/00006324-199905000-00018
35. He JC, Sun P, Held R, Thorn F, Sun X, Gwiazda JE. Wavefront aberrations in eyes of emmetropic and moderately myopic school children and young adults. Vision Res. 2002;42:1063–1070. doi:10.1016/S0042-6989(02)00035-4
36. Rosenfield M, Hong SE, George S. Blur adaptation in myopes. Optom Vis Sci. 2004;81:657–662. doi:10.1097/01.opx.0000144743.34976.da
37. Radhakrishnan H, Pardhan S, Calver RI, O’Leary DJ. Effect of positive and negative defocus on contrast sensitivity in myopes and non-myopes. Vision Res. 2004;44:1869–1878. doi:10.1016/j.visres.2004.03.007
38. Vasudevan B, Ciuffreda KJ, Wang B. Objective blur thresholds in free space for different refractive groups. Curr Eye Res. 2006;31:111–118. doi:10.1080/02713680500514669
39. Collins MJ, Buehren T, Iskander DR. Retinal image quality, reading and myopia. Vision Res. 2006;46:196–215. doi:10.1016/j.visres.2005.03.012
40. Cufflin MP, Mankowska A, Mallen EA. Effect of blur adaptation on blur sensitivity and discrimination in emmetropes and myopes. Invest Ophthalmol Vis Sci. 2007;48:2932–2939. doi:10.1167/iovs.06-0836
41. Day M, Seidel D, Gray LS, Strang NC. The effect of modulating ocular depth of focus upon accommodation microfluctuations in myopic and emmetropic subjects. Vision Res. 2009;49:211–218. doi:10.1016/j.visres.2008.10.010
42. Poulere E, Moschandreas J, Kontadakis GA, Pallikaris IG, Plainis S. Effect of blur and subsequent adaptation on visual acuity using letter and Landolt C charts: differences between emmetropes and myopes. Ophthalmic Physiol Opt. 2013;33:130–137. doi:10.1111/opo.12020
43. Namba H, Kawasaki R, Sugano A, et al. Age-related changes in ocular aberrations and the Yamagata study (funagata). Cornea. 2017;36:S34–S40. doi:10.1097/ICO.0000000000001386
44. Ueno Y, Hiraoka T, Beheregaray S, Miyazaki M, Ito M, Oshika T. Age-related changes in anterior, posterior, and total corneal astigmatism. J Refract Surg. 2014;30:192–197. doi:10.3928/1081597X-20140218-01
45. Shao X, Zhou KJ, Pan AP, et al. Age-related changes in corneal astigmatism. J Refract Surg. 2017;33:696–703. doi:10.3928/1081597X-20170718-04
46. Naeser K, Savini G, Bregnhøj JF. Age-related changes in with-the-rule and oblique corneal astigmatism. Acta Ophthalmol. 2018;96:600–606. doi:10.1111/aos.13683
47. Ferrer-Blasco T, González-Méijome JM, Montés-Micó R. Age-related changes in the human visual system and prevalence of refractive conditions in patients attending an eye clinic. J Cataract Refract Surg. 2008;34:424–432. doi:10.1016/j.jcrs.2007.10.032
48. Mordi JA, Ciuffreda KJ. Static aspects of accommodation: age and presbyopia. Vision Res. 1998;38:1643–1653. doi:10.1016/S0042-6989(97)00336-2
49. Winn B, Whitaker D, Elliott DB, Phillips NJ. Factors affecting light-adapted pupil size in normal human subjects. Invest Ophthalmol Vis Sci. 1994;35:1132–1137.
50. McLellan JS, Marcos S, Burns SA. Age-related changes in monochromatic wave aberrations of the human eye. Invest Ophthalmol Vis Sci. 2001;42:1390–1395.
51. Jung GH, Kline DW. Resolution of blur in the older eye: neural compensation in addition to optics? J Vis. 2010;10:7. doi:10.1167/10.5.7
52. Elliott DB. Clinical Procedures in Primary Eye Care. Oxford: Butterworth-Heinemann; 2003.
53. Antona B, Barra F, Barrio A, Gutierrez A, Piedrahita E, Martin Y. Comparing methods of determining addition in presbyopes. Clin Exp Optom. 2008;9:313–318. doi:10.1111/j.1444-0938.2007.00159.x
54. Scheiman M, Wick B, Steinman B. Clinical Management of Binocular Vision: Heterophoric, Accommodative, and Eye Movement Disorders.
55. Ferris FL, Kassoff A, Bresnick GH, Bailey I. New visual acuity charts for clinical research. Am J Ophthalmol. 1982;94:91–96. doi:10.1016/0002-9394(82)90197-0
56. Carkeet A. Modeling logMAR visual acuity scores: effects of termination rules and alternative forced-choice options. Optom Vis Sci. 2001;78:529–538. doi:10.1097/00006324-200107000-00017
57. Ukai K, Ichihashi Y. Changes in ocular astigmatism over the whole range of accommodation. Optom Vis Sci. 1991;68:813–818. doi:10.1097/00006324-199110000-00011
58. Tsukamoto M, Nakajima K, Nishino J, Hara O, Uozato H, Saishin M. Accommodation causes with-the-rule astigmatism in emmetropes. Optom Vis Sci. 2000;77:150–155. doi:10.1097/00006324-200003000-00014
59. Lee HL. A study on the accommodative astigmatism of near vision. J Korean Ophthalmic Opt Soc. 2011;16:327–331.
60. Remón L, Monsoriu JA, Furlan WD. Influence of different types of astigmatism on visual acuity. J Optom. 2017;10:141–148. doi:10.1016/j.optom.2016.07.003
61. Mutti DO, Enlow NL, Mitchell GL. Accommodation and induced with-the-rule astigmatism in emmetropes. Optom Vis Sci. 2001;78:6–7. doi:10.1097/00006324-200101010-00004
 © 2023 The Author(s). This work is published and licensed by Dove Medical Press Limited. The full terms of this license are available at https://www.dovepress.com/terms.php and incorporate the Creative Commons Attribution - Non Commercial (unported, v3.0) License.
By accessing the work you hereby accept the Terms. Non-commercial uses of the work are permitted without any further permission from Dove Medical Press Limited, provided the work is properly attributed. For permission for commercial use of this work, please see paragraphs 4.2 and 5 of our Terms.
© 2023 The Author(s). This work is published and licensed by Dove Medical Press Limited. The full terms of this license are available at https://www.dovepress.com/terms.php and incorporate the Creative Commons Attribution - Non Commercial (unported, v3.0) License.
By accessing the work you hereby accept the Terms. Non-commercial uses of the work are permitted without any further permission from Dove Medical Press Limited, provided the work is properly attributed. For permission for commercial use of this work, please see paragraphs 4.2 and 5 of our Terms.