")
Back to Journals » Journal of Pain Research » Volume 17
Distinct Functional Connectivity Patterns for Intermittent Vs Constant Neuropathic Pain Phenotypes in Persistent Spinal Pain Syndrome Type 2 Patients
Authors Pahapill PA, Arocho-Quinones EV, Chen G, Swearingen B, Tomas CW, Koch KM, Nencka AS
Received 15 August 2023
Accepted for publication 8 April 2024
Published 12 April 2024 Volume 2024:17 Pages 1453—1460
DOI https://doi.org/10.2147/JPR.S426640
Checked for plagiarism Yes
Review by Single anonymous peer review
Peer reviewer comments 2
Editor who approved publication: Professor Krishnan Chakravarthy
Peter A Pahapill,1 Elsa V Arocho-Quinones,1 Guangyu Chen,2 Brad Swearingen,3 Carissa W Tomas,3 Kevin M Koch,3 Andrew Scott Nencka3
1Department of Neurosurgery, Medical College of Wisconsin, Milwaukee, WI, USA; 2Department of Biomedical Engineering, Medical College of Wisconsin, Milwaukee, WI, USA; 3Center for Neuroimaging, Medical College of Wisconsin, Milwaukee, WI, USA
Correspondence: Peter A Pahapill, Tel +1-414-805-5400, Fax +1-414-955-0115, Email [email protected]
Background: Chronic low back pain (cLBP) has been associated with alterations in brain functional connectivity (FC) but based upon heterogeneous populations and single network analyses. Our goal is to study a more homogeneous cLBP population and focus on multiple cross-network (CN) connectivity analysis. We hypothesize that within this population: 1) altered CN FC, involving emotion and reward/aversion functions are related to their pain levels and 2) altered relationships are dependent upon pain phenotype (constant neuropathic vs intermittent pain).
Methods: In this case series, resting state fcMRI scans were obtained over a study duration of 60 months from 23 patients (13 constant neuropathic and 10 intermittent pain) with Persistent Spinal Pain Syndrome (PSPS Type 2) being considered for spinal cord stimulation (SCS) therapy at a single academic center. Images were acquired using a Discovery MR750 GE scanner. During the resting state acquisitions, they were asked to close their eyes and relax. The CN analysis was performed on 7 brain networks and compared to age-matched controls. Linear regression was used to test the correlation between CN connectivity and pain scores.
Results: CN FC involving emotion networks (STM: striatum network index) was significantly lower than controls in all patients, regardless of pain phenotype (P < 0.003). Pain levels were positively correlated with emotional FC for intermittent pain but negatively correlated for constant pain.
Conclusion: This is the first report of 1) altered CN FC involving emotion/reward brain circuitry in 2) a homogeneous population of cLBP patients with 3) two different pain phenotypes (constant vs intermittent) in PSPS Type 2 patients being considered for SCS. FC patterns were altered in cLBP patients as compared to controls and were characteristic for each pain phenotype. These data support fcMRI as a potential and objective tool in assessing pain levels in cLBP patients with different pain phenotypes.
Keywords: spinal cord stimulation, persistent spinal pain syndrome, functional MRI, chronic pain
Introduction
Persistent Spinal Pain Syndrome (PSPS) Type 2 is a chronic pain condition characterized by chronic low back pain (cLBP) and/or leg pain following one or more lumbar spine surgeries with an incidence of up to 40% of surgical cases.1,2 PSPS Type 2 has been proposed to replace the old ICD-10 failed back surgery syndrome within the new ICD-11 system.3 After failed conservative management, some of these patients can be considered as potential candidates for spinal cord stimulation (SCS).4 Prior to implantation of a permanent SCS system, patients are required to show significant subjective pain and functional improvement during a simple 5–7-day temporary test period of stimulation. However, up to a third of patients with successful trials lose the efficacy of SCS within 3–4 years.5 Thus, the utility of this trial period, although required by payers, has come into question.6 As such, other means, perhaps more objective and less invasive are being sought to help predict and select patients to achieve better and more durable benefits from SCS.
Increasing evidence suggests a critical role of central nervous system (CNS) plasticity in the development and maintenance of cLBP.7 Resting-state (RS) functional connectivity magnetic resonance imaging (rsfcMRI) is a powerful tool for elucidating the areas of the brain involved in cLBP perception and modulation.8–11 Human brain imaging studies have shown that chronification of LBP has been associated with a shift in activity from brain regions involved in acute pain to more emotion or reward circuitry.1,8–10 These reported changes can depend upon 1) the population of chronic pain patients being studied1,12 and 2) the duration of pain that the patients have endured1,7,13 and can be normalized with successful treatment.14–17
Kucyi and Davis11,18 have championed the concept that chronic pain should be considered as a process encoded by a “pain connectome”, the spatiotemporal signature of brain network communication that represents the integration of all cognitive, affective, and sensorimotor aspects of chronic pain. Previous fcMRI studies on chronic pain patients have focused on changes “within” networks.7 If one considers pain as a phenotypical conscious state, then analyzing functional connectivity changes between multiple interacting networks (“cross-network”) rather than relying on changes within individual cortical and subcortical networks may be more appropriate. As such, our first goal is to study the relationships between several different RSNs (cross-network analysis), an approach that has been reported only once in pain patients,18 in addition to our own recent studies on PSPS Type 2 patients.7,19 Our second goal was to study a more homogeneous group of cLBP patients with a common inciting event of previous back surgery. Moreover, we studied a specific subpopulation of these PSPS Type 2 patients with refractory cLBP that have been deemed good candidates for SCS therapy. Our third goal was to evaluate our ongoing hypotheses that PSPS Type 2 patients present with alterations in cross-network FC compared to healthy controls, specifically, those involved in emotion and reward/aversion functions. Finally, our fourth goal was to determine if the above alterations may be dependent upon pain phenotype (constant neuropathic vs intermittent pain). Thus, a group of image-based pain biomarkers may be elucidated that could guide researchers and clinicians in management of chronic pain patients.
Methods
In a previously published study, we compared within and cross-network changes in PSPS Type 2 patients with constant neuropathic pain that had passed a trial of SCS but prior to SCS system device implantation with an age-matched control data set.7 In the present study, we studied a similar population of patients but with two different pain phenotypes (constant neuropathic vs intermittent pain). In the present case series, data were collected over a 5-year study period at a single academic institution.
Institutional Approval
The Medical College of Wisconsin/Froedtert Hospital Institutional Review Board and MRI Safety Board (PRO00022193) provided ethical approval for this study in accordance with the World Medical Association Declaration of Helsinki, 1964. Written Informed consent was obtained for all participants of the study.
Inclusion and Exclusion Criteria
Non-pregnant, English-speaking adult PSPS Type 2 patients3 with severe, cLBP and/or leg pain, before or after a trial of SCS, prior to implantation of an SCS system were included in the study. The diagnosis of PSPS Type 2 was made by the first author, with over 30 years of clinical surgical experience in managing PSPS Type 2 patients. Patients who were non-English speaking, pregnant, or otherwise unable to undergo MRI due to safety reasons or claustrophobia were excluded from the study.
Study Protocol
Adult patients with a diagnosis of PSPS Type 2 who were deemed good candidates for SCS were screened for our study. The patients who met the inclusion criteria and wished to participate in our study signed an informed consent and were asked to fill out a questionnaire prior to completing their imaging study where they were asked to rate their level of pain using the numerical rating scale (NRS) from 0 to 10, where 0 meant no pain and 10 meant the worst pain imaginable. Patients were divided into two groups, depending upon their primary pain phenotype: 1) those with primarily constant, unrelenting severe neuropathic pain; and 2) those with a milder to moderate constant neuropathic pain but with a much more severe pain component that would reliably come on with standing for prolonged periods of time or with walking and reliably relieved with sitting down, consistent with the tingling, tightness, deep gripping, suffocating pain typical of neurogenic claudication. Thus, in this second group of intermittent pain patients, individuals could reliably and predictably control/avoid the most severe component of their pain. This was the basis for a phenotypic difference. There was no evidence of a significant mechanical/nociceptive component of pain in either group.
Image Acquisition
Methods of image acquisition and resting state functional imaging data preprocessing have been previously described.7,19 Briefly, images were acquired using a Discovery MR750 #T Signa GE scanner with a standard quadrature transmit receive head coil. During the resting state acquisitions, they were asked to close their eyes and relax. Sagittal rsfcMRI datasets of the whole brain were obtained in 6 minutes with a single-shot gradient echo-planar imaging (EPI) pulse sequence. The rsfcMRI imaging parameters were as follows: TE/TR/flip angle/slices: 25 ms, 2 s, 90°, and 36. The slice thickness was 4 mmm. The matrix size is 64 × 64 with 24 cm field of view. The anatomical reference used high-resolution 3D-SPGR axial images, which has 144 slices, slice thickness of 1 mm and 256 × 256 resolution. The data processing was performed by the software of Analysis of Functional NeuroImages (AFNI) and MATLAB (Mathworks). The whole brain was segmented into 116 anatomical regions using the Atlas template.19 This resulted in 116 mapped regions of interest (ROIs). The total image scanning duration was 10 minutes.
Data Preprocessing
We used Analysis of Functional NeuroImages (AFNI) software (http://afni.nimh.nih.gov/afni/) and MATLAB (Mathworks) in this study for data processing. The first five volumes of each raw resting-state functional imaging dataset were discarded to allow for T1 equilibration. Interleaved slice acquisition-dependent time shifts were corrected (AFNI command, to3d-time: zt nz nt TR tpattern). Spikes in time-series data were removed (AFNI command, 3dDespike). Data were then motion corrected (Six motion parameters, including roll, pitch, in the superior, left and posterior direction displacements were estimated by volume registration of the R-fMRI data, and then, were regressed out by using Afni command 3dDeconvolve to control possible micromovement effects). There was no group difference for movement parameters. Detrend processing procedure using AFNI commands (3dvolreg and 3dDetrend) was performed. The reference template in Talairach space, which contained 116 anatomically defined regions of interest (ROIs),20 was transformed and aligned to the SPGR images and EPI resting-state functional images for each subject (AFNI command, 3dfractionize). This resulted in 116 mapped ROIs. The average time course within each ROI was extracted from the resting-state functional imaging datasets. Averaged white matter signal and cerebrospinal fluid (CSF) signal were extracted using white matter mask (http://afni.nimh.nih.gov/pub/dist/data/TT_wm+tlrc) and CSF (http://afni.nimh.nih.gov/pub/dist/data/TT_csf+tlrc) mask in Talairach space. These two masks were transformed and aligned to the SPGR and echo planar images for each subject (AFNI command, 3dfractionize). Then, the average time courses within the CSF or the eroded white matter mask, together with global mean signals, were removed as nuisance regressors from the 116 regional time courses with linear regression using Matlab (Mathworks). FC MRI data analysis was performed on de-identified data with no knowledge of patient pain levels or the type of patient pain.
Definition of Networks
The seven RSNs (motor network (MTN), default mode network (DMN), salience network (SAN); striatum network (STM), temporal network (TEP), hippocampus network (HIP) and dorsal attention network (DAN)) that were analyzed have previously been described in details in Table 2 of Pahapill et al.7
Regional (within network) functional connectivity strength (FCS) and Cross-network FCS calculation methods have been previously described.7 Our previous reports on similar PSPS Type 2 patients demonstrated that only the STM network showed significant decreased cross-network connectivity with all of the other networks in PSPS Type 2 patients compared to control.7,19 Therefore, we calculated an STM index for each of our 23 subjects in this study as well. As in our previous report, we also tested if the STM index for each of the 23 patients were related to their reported pain levels at the time of their MRI scans. Medication use was not controlled during imaging studies.
Statistical Analysis and the STM Index
Methods of statistical analysis has been previously described.7 The non-parametric Wilcoxon signed-rank test was performed to test group differences of each cross-network FCS. Multiple comparison correction was performed using the Bonferroni method with p < 0.05 to avoid false positives. The STM index is a network-based singular index of resting state FC, obtained by averaging all the cross-network FCS between STM and all the other six networks. The use of a network-bases singular index of resting state FC as a biomarker for evaluating the functional connectivity strength of a specific disease process has been proven reliable and has been validated in various disease processes in our previous studies.21 The rationale of averaging different network FCS into a singular index is to reduce the noise and variation. A previous study addressed the fact that network-based analysis can enhance the signal-to-noise ratio (SNR) and reproducibility of resting-state FC data.21 Averages and standard errors of the mean (SEM) were also calculated.
Results
Population Characteristics
Characteristics of the 23 participating subjects by pain phenotype and controls are summarized in Table 1. RS fcMRI for 13 healthy age-matched control subjects (mean age 56 ± 7.2 yr, male: female ratio 3:10) was previously described in Table 4 of Pahapill et al.7 The interval from most recent spine surgery to trial of SCS ranged from 6 months to 5 years. Medication use, including narcotics, NSAIDs, muscle relaxants, membrane stabilizers, anti-depressants, and anxiolytics were very heterogeneous amongst all chronic pain patient populations.
 |
Table 1 Demographics, Average Pain Level at Time of fcMRI and Average STM Index for Each PSPS Type 2 Pain Phenotype Group: Constant Pain (13 Subjects), Intermittent Pain (10 Subjects) and Control (13 Subjects; from Pahapill et al7) |
Results of rsfcMRI
STM indexes were calculated for each subgroup as previously described;7 (see Table 1). As we had previously reported,7,19 the STM indexes of the PSPS Type 2 patients were significantly lower than age-matched controls (All PSPS Type 2: 0.10 ± 0.04 vs controls 0.26 ± 0.03; p < 0.003; Figure 1). STM indexes for both the constant pain PSPS Type 2 group: 0.08 ± 0.02; p < 0.0001 and intermittent pain PSPS Type 2 group: 0.12 ± 0.04; p < 0.005, were significantly lower than the control group, as well, but not significantly different from each other. Average pain levels for each group are listed in Table 1. As we reported before,7 for patients with constant neuropathic pain (n = 13), a negative linear relationship was found between the STM index and the corresponding pain levels (R = 0.57; p = 0.04). In contrast, for patients with intermittent pain (n = 10), a positive linear relationship was found between STM index and the corresponding pain levels (R = 0.65; p = 0.04). These are shown in Figure 2.
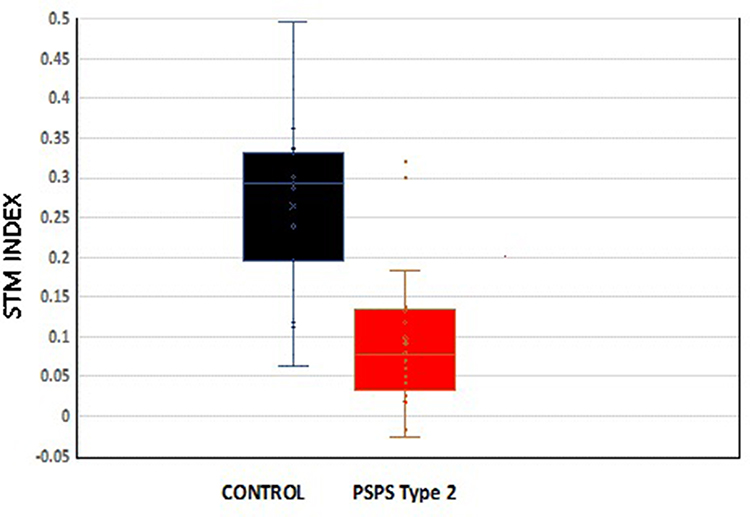 |
Figure 1 Box and whisker plots, mean (x) and median (-) quartiles of STM index for historic controls (black) and PSPS Type 2 patients (red). Means are significantly different (p <0.003). |
 |
Figure 2 Relationship between patient reported pain levels and respective STM index with 95% confidence intervals. Group A: constant pain phenotype; red; R = 0.57; p = 0.04). Group B: intermittent pain phenotype; blue; R =. 0.65; p = 0.04). |
Discussion
Here, we assessed the resting state network connectivity between networks (cross-network) in a homogeneous population of chronic pain patients with two different distinct pain phenotypes. Thus, this is the first report of its kind. Being part of an ongoing prospective study, these cases demonstrated that altered functional connectivity patterns in PSPS Type 2 patients can be dependent upon chronic pain phenotype (constant neuropathic pain vs intermittent pain). The rsfMRI data in this study will also serve as the baseline for intra-subject studies about the effects of SCS on brain functional connectivity in these two different PSPS Type 2 pain phenotypes.
We have previously shown that the most significant alteration of CN connectivity primarily involves a network associated with emotion/motivation/reward functions; STM network.7 There is only one other CN connectivity study on chronic pain patients: ankylosing spondylitis,18 demonstrating FC anti-correlation between the SAN and DMN networks. We did not see this in our group of PSPS Type 2 patients. The STM network was not studied in the ankylosing spondylitis group. This further supports the notion that alterations in CN FC may be dependent upon the pain phenotype. As in our previous report,7 we presently describe a strong negative correlation between constant neuropathic pain levels and STM index as well as a strong positive correlation between the STM index pain levels in PSPS Type 2 patients with intermittent pain. We have previously discussed fully the conceptualization of the STM index.7 Briefly, Baliki and Apkarian9 proposed a chronic pain threshold (θ) generated through chronic-pain related altered connectivity modified by limbic and cortical inputs. Those with cortico-limbic risk factors will develop a lower threshold and pain amplification. We envisage the STM index to represent a quantitative measure of the θ pain threshold for PSPS Type 2 patients. The lower the STM index, the lower the threshold for persistent pain. Those with a lower STM index will have a lower threshold for persistent pain. This concept was depicted in figure 8 in Pahapill et al.7
As in our previous reports,7,19 we found that the STM index was lower in this cohort of patients as compared to controls and that the reported pain levels in the constant neuropathic pain group had a strong negative linear relationship with the STM index.7 In stark contrast, the STM relationship with pain levels in the intermittent pain group was strongly positively related. We speculate that this may due to the fact that intermittent pain patients are able to predicably and reliably avoid and control their pain to a certain extent as compared to patients with constant neuropathic pain, who have no control over their pain. This can lead to a different emotional relationship with their pain experience. Although this report’s main goal is to investigate the effects of pain phenotype upon altered functional connectivity in PSPS type 2 patients, future reports will detail the effects of therapeutic SCS on the functional connectivities in PSPS Type 2 patients with these differing phenotypes. We will also provide analysis of the effects of different patterns of stimulation on pain levels, functional connectivity patterns and various scales such as pain catastrophizing scores (PCS) etc. As chronic pain research has been hampered due to the lack of an objective diagnostic test or biomarker for clinicians or researchers that can complement its subjective assessment, our ongoing goal is to continue studies that can offer a step toward building a body of results characterizing such an objective diagnostic test.
A number of studies have utilized rs-fMRI to assess alterations of the intrinsic brain functional connectivity in cLBP patients compared to healthy controls (summarized in these studies).7,20 However, these reports were based upon heterogeneous cLBP populations with different etiologies and pain phenotypes (neuropathic vs nociceptive; constant or intermittent). Several groups have also explored the supraspinal effects of spinal neuromodulation for pain,16,22–30 recently reviewed in31 In addition, a few recent fcMRI studies on chronic pain patients with implanted SCS systems have been presented.16,19,23,27,29 However, in contrast to our previous study,19 these studies have had several limitations such as 1) heterogenous populations of patients;16 2) limited number of patients;23 3) lack of analysis of subcortical regions;23,27 4) lack of comparison to controls16,23,27 or 5) lack of cross-network analysis.16,23,27,29
Limitations/Future Directions
The following limitations of this study are acknowledged and identified as the follows:
Conclusions
As outlined in our goals, we present the first report of 1) altered cross-network functional connectivity involving emotion/reward brain circuitry in 2) a homogeneous population of PSPS Type 2 patients being considered for SCS with 3) different pain phenotypes (constant neuropathic vs intermittent pain). Functional connectivity patterns were altered in PSPS type 2 patients as compared to controls in a way that was dependent upon pain phenotype. This work supports our ongoing hypothesis that suggests the existence of a potential spectrum of image-based biomarkers that may be associated with a range of chronic pain phenotypes based upon inciting events, pain pathology, history, quality, consistency, location, duration and patient emotional state. A profile of such biomarkers could potentially be assembled to help guide management and prevention of different chronic pain conditions.
Disclosure
Dr Kevin Koch reports grants from Siemens Healthcare, GE Healthcare; equity from NexusMD, outside the submitted work. Dr Andrew Nencka reports funding for MRI acquisition and reconstruction technology development from GE Healthcare and Siemens Healthineers; stock ownership of and scientific advisory board membership of a non-publicly traded startup in the space of imaging informatics for Nexus MD, outside the submitted work. The authors report no other conflicts of interest in this work.
References
1. Hashmi JA, Baliki M, Huang L, et al. Shape shifting pain: chronification of back pain shifts brain representation from nociceptive to emotional circuits. Brain. 2013;136(9):2571–2768. doi:10.1093/brain/awt211
2. Alizadeb R, Sharifzadeh SR. Pathogenesis, etiology and treatment of failed back surgery syndrome. Neurochirurgie. 2021;68(4):426–431. doi:10.1016/j.neuchi.2021.09.005
3. Christelis N, Simpson B, Russo M, et al. Persistent spinal pain syndrome: a proposal for failed back surgery syndrome and ICD-11. Pain Med. 2021;22(4):807–818. doi:10.1093/pm/pnab015
4. Deer TR, Russo MA, Grider JS. Neuromodulation appropriateness consensus committee. the appropriate use of neurostimulation of the spinal cord and peripheral nervous system for the treatment of chronic pain and ischemic diseases: the neuromodulation appropriateness consensus committee. Neuromodulation. 2022;25(1):1–34. doi:10.1016/j.neurom.2021.10.015
5. Pahapill PA. Incidence of revision surgery in a large cohort of patients with thoracic surgical three-column paddle leads: a retrospective case review. Neuromodulation. 2015;18(5):367–375. doi:10.1111/ner.12239
6. Duarte RV, Houton R, Nevitt S, et al. Screening trials of spinal cord stimulation for neuropathic pain in England – a budget impact analysis. Front Pain Res. 2022;3. doi:10.3389/fpain.2022.974904
7. Pahapill PA, Chen G, Arocho-Quinones EV, Nencka AS, Li S-J. Functional connectivity and structural analysis of trial spinal cord stimulation responders in failed back surgery syndrome. PLoS One. 2020; 15(2):1–19.
8. Baliki MN, Mansour AR, Baria AT, Apkarian AV. Functional reorganization of the default mode network across chronic pain conditions. PLoS One. 2014;9(9):e106133. doi:10.1371/journal.pone.0106133
9. Baliki MN, Apkarian AV. Nociception, pain, negative moods and behavior selection. Neuron. 2015;87(3):474–491. doi:10.1016/j.neuron.2015.06.005
10. Baliki MN, Petre B, Torbey S, et al. Corticostriatal functional connectivity predicts transition to chronic back pain. Nat Neurosci. 2012;15(8):1117–1119. doi:10.1038/nn.3153
11. Kucyi A, Davis KD. The dynamic pain connectome. Trends Neurosci. 2015;38(2):86–95. doi:10.1016/j.tins.2014.11.006
12. Khan SA, Keaser ML, Meiller TF, Seminowicz DA. Altered structure and function in the hippocampus and medial prefrontal cortex in patients with burning mouth syndrome. Pain. 2014;155(8):1472–1480. doi:10.1016/j.pain.2014.04.022
13. Yu R, Gollub RL, Spaeth R, Napadow V, Wasan A, Konga J. Disrupted functional connectivity of the periaqueductal gray in chronic low back pain. Neuroimage Clin. 2014;6:100–108. doi:10.1016/j.nicl.2014.08.019
14. Seminowicz DA, Wideman TH, Naso L, et al. Effective treatment of chronic low back pain in humans reversed abnormal brain anatomy and function. J Neurosci. 2011;31(20):7540–7550. doi:10.1523/JNEUROSCI.5280-10.2011
15. Napadow V, Lacount L, Park K, et al. Intrinsic brain connectivity in fibromyalgia is associated with chronic pain intensity. Arthritis Rheum. 2010;62(8):2545–2555. doi:10.1002/art.27497
16. Deogaonkar M, Sharma M, Oluigbo C, et al. Spinal Cord Stimulation (SCS) and functional Magnetic Resonance Imaging (fMRI): modulation of Cortical Connectivity With Therapeutic SCS. Neuromodulation. 2016;19(2):142–153. doi:10.1111/ner.12346
17. De Ridder D, Vanneste S. Burst and tonic spinal cord stimulation: different and common brain mechanisms. Neuromodulation. 2016;19(1):47–59. doi:10.1111/ner.12368
18. Hemington KS, Wu Q, Kucyi A, et al. Abnormal cross-network functional connectivity in chronic pain and its association with clinical symptoms. Brain Struct Funct. 2015;221(8):4203–4219. doi:10.1007/s00429-015-1161
19. Pahapill PA, Chen G, Arocho-Quinones EV, Nencka AS. Functional connectivity magnetic resonance imaging sequences in patient with postsurgical persistent spinal pain syndrome type 2 with implanted spinal cord stimulation systems: a safety, feasibility, and validity study. Neuromodulation. 2023;26(5):1009–1014. doi:10.1016/j.neurom.2023.04.465
20. Tzourio-Mazoyer BL, Joliot M, Joliot M, et al. automated anatomical labeling of activations in spm using a macroscopic anatomical parcellation of the MNI MRI single-subject brain. NeuroImage. 2002;15(1):273–289. doi:10.1007/s00429-015-1161-1
21. Chen G, Shu H, Chen G, et al. Staging alzheimer’s disease risk by sequencing brain function and structure. cerebrospinal fluid, and cognition biomarkers. J Alzheimers dis. 2016;54(3):983–993. doi:10.3233/JAD-160537
22. De Groote S, Goudman L, Peeters R, et al. Magnetic resonance imaging exploration of the human brain during 10 kHz spinal cord stimulation for failed back surgery syndrome: a resting state functional magnetic resonance imaging study. Neuromodulation. 2020;23(1):46–55. doi:10.1111/ner.12954
23. Miao J, Ailes I, Krisa L, et al. Case report: the promising application of dynamic functional connectivity analysis on an individual with failed back surgery syndrome. Front Neurosci. 2022;16:1–10.
24. Fan X, Ren H, Bu C, et al. Alterations in local activity and functional connectivity in patients with postherpetic neuralgia after short-term spinal cord stimulation. Front Mol Neurosci. 2022;15:938280. doi:10.3389/fnmol.2022.938280
25. Kiriakopoulos ET, Tasker RR, Nicosia S, Wood ML, Mikulis DJ. Functional magnetic resonance imaging: a potential tool for the evaluation of spinal cord stimulation: technical case report. Neurosurgery. 1997;41(2):501–504. doi:10.1097/00006123-199708000-00042
26. Moens M, Droogmans S, Spapen H, et al. Feasibility of cerebral magnetic resonance imaging in patients with externalized spinal cord stimulator. Clin Neurol Neurosurg. 2012;114(2):135–141. doi:10.1016/j.clineuro.2011.09.013
27. De Groote S, De Jaeger M, Van Schuerbeek P, et al. Functional magnetic resonance imaging: cerebral function alterations in subthreshold and suprathreshold spinal cord stimulation. Pain Res. 2018;11:2517–2526. doi:10.2147/JPR.S160890
28. Moens M, Sunaert S, Mariën P, et al. Spinal cord stimulation modulates cerebral function: an fMRI study. Neuroradiology. 2012;54(12):1399–1407. doi:10.1007/s00234-012-1087-8
29. De Groote S, Goudman L, Peeters R, et al. The influence of high dose spinal cord stimulation on the descending pain modulatory system in patients with failed back surgery syndrome. Neuroimage Clin. 2019;24:102087. doi:10.1016/j.nicl.2019.102087
30. Pahapill PA, Zhang W. Restoration of altered somatosensory cortical representation with spinal cord stimulation therapy in a patient with complex regional pain syndrome: a magnetoencephalography case study. Neuromodulation Technol Neural Interface. 2014;17(1):22–27. doi:10.1111/ner.12033
31. Goudman L, De Groote S, Linderoth B, et al. Exploration of the supraspinal hypotheses about spinal cord stimulation and dorsal root ganglion stimulation: a systematic review. J Clin Med. 2021;10(13):2766. doi:10.3390/jcm10132766
 © 2024 The Author(s). This work is published and licensed by Dove Medical Press Limited. The full terms of this license are available at https://www.dovepress.com/terms.php and incorporate the Creative Commons Attribution - Non Commercial (unported, v3.0) License.
By accessing the work you hereby accept the Terms. Non-commercial uses of the work are permitted without any further permission from Dove Medical Press Limited, provided the work is properly attributed. For permission for commercial use of this work, please see paragraphs 4.2 and 5 of our Terms.
© 2024 The Author(s). This work is published and licensed by Dove Medical Press Limited. The full terms of this license are available at https://www.dovepress.com/terms.php and incorporate the Creative Commons Attribution - Non Commercial (unported, v3.0) License.
By accessing the work you hereby accept the Terms. Non-commercial uses of the work are permitted without any further permission from Dove Medical Press Limited, provided the work is properly attributed. For permission for commercial use of this work, please see paragraphs 4.2 and 5 of our Terms.