")
Back to Journals » Vascular Health and Risk Management » Volume 20
Development and Internal Validation of a Risk Prediction Model for Carotid Atherosclerosis in the Hyperuricemia Population
Authors Tusongtuoheti X, Huang G , Mao Y
Received 20 October 2023
Accepted for publication 29 March 2024
Published 13 April 2024 Volume 2024:20 Pages 195—205
DOI https://doi.org/10.2147/VHRM.S445708
Checked for plagiarism Yes
Review by Single anonymous peer review
Peer reviewer comments 2
Editor who approved publication: Professor Mirna N Chahine
Ximisinuer Tusongtuoheti,1,2 Guoqing Huang,1,2 Yushan Mao1
1Department of Endocrinology, The First Affiliated Hospital of Ningbo University, Ningbo University, Ningbo, People’s Republic of China; 2Health Science Center, Ningbo University, Ningbo, People’s Republic of China
Correspondence: Guoqing Huang; Yushan Mao, Department of Endocrinology, The First Affiliated Hospital of Ningbo University, 247 Renmin Road, Ningbo, People’s Republic of China, Tel +86 15737939838; +86 13867878937, Email [email protected]; [email protected]
Purpose: The aim of this study was to identify independent risk factors for carotid atherosclerosis (CAS) in a population with hyperuricemia (HUA) and develop a CAS risk prediction model.
Patients and Methods: This retrospective study included 3579 HUA individuals who underwent health examinations, including carotid ultrasonography, at the Zhenhai Lianhua Hospital in Ningbo, China, in 2020. All participants were randomly assigned to the training and internal validation sets in a 7:3 ratio. Multivariable logistic regression analysis was used to identify independent risk factors associated with CAS. The characteristic variables were screened using the least absolute shrinkage and selection operator combined with 10-fold cross-validation, and the resulting model was visualized by a nomogram. The discriminative ability, calibration, and clinical utility of the risk model were validated using the receiver operating characteristic curve, calibration curve, and decision curve analysis.
Results: Sex, age, mean red blood cell volume, and fasting blood glucose were identified as independent risk factors for CAS in the HUA population. Age, gamma-glutamyl transpeptidase, serum creatinine, fasting blood glucose, total triiodothyronine, and direct bilirubin, were screened to construct a CAS risk prediction model. In the training and internal validation sets, the risk prediction model showed an excellent discriminative ability with the area under the curve of 0.891 and 0.901, respectively, and a high level of fit. Decision curve analysis results demonstrated that the risk prediction model could be beneficial when the threshold probabilities were 1– 87% and 1– 100% in the training and internal validation sets, respectively.
Conclusion: We developed and internally validated a risk prediction model for CAS in a population with HUA, thereby contributing to the CAS early identification.
Keywords: hyperuricemia, carotid atherosclerosis, independent risk factors, prediction model, nomogram
Introduction
Stroke ranks second among the leading causes of disability and death globally.1 According to the 2019 stroke burden in China, ischemic stroke affected 2.87 million people and caused 1.03 million deaths.2 Carotid atherosclerosis (CAS) is a potential cause of ischemic stroke, and approximately 18–25% of ischemic strokes are attributed to thromboembolism caused by CAS.3 Hyperuricemia (HUA) is a metabolic condition characterized by increased uric acid (UA) synthesis or decreased excretion. Over the past few years, HUA incidence has increased globally due to increased intake of purine-rich foods. An updated study showed that 16.4% of mainland Chinese individuals had HUA.4 Several studies have demonstrated that HUA is a risk factor for CAS5–7 and that UA could be a potential therapeutic target. According to a systematic meta-analysis, HUA can increase the risk of atherosclerosis (AS) by at least 50%.8 In addition, the risk of stroke increased by 10% for each 1 mg/dL increase in UA level.9 UA maintains the AS process by interfering with lipid metabolism, decreasing the ability of endothelial cells to produce nitric oxide, accelerating the growth of arterial smooth muscle cells, and overwhelms inflammation.10
With the advancement of precision medicine, more studies utilized risk prediction models to predict the occurrence of certain diseases and their complications to prevent or reduce adverse prognostic events. For example, Huang et al11 constructed a CAS risk model among the Chinese population and Feng et al12 developed a risk model for CAS in patients with type 2 diabetes. All the above models exhibited excellent clinical predictive values. However, there are no published reports on CAS risk prediction models in a population with HUA. The purpose of this research was to develop a CAS risk prediction model using statistical algorithms in the HUA population that could contribute to early CAS identification.
Methods
Participants
This retrospective study included 3623 HUA individuals who underwent health examinations, including carotid ultrasonography, at the Zhenhai Lianhua Hospital in Ningbo, China, in 2020. The sample size was calculated based on the rule of thumb recommendation for logistic regression analysis, which suggests using at least 10 cases for each predictor variable.13 Relevant clinical data were obtained from the electronic medical record system. Inclusion criteria: participants aged ≥ 18 years and who satisfy the diagnostic criteria for HUA, defined by a serum UA level > 420 μmol/L in males and > 360 μmol/L in females.14 Exclusion criteria: individuals with severe abnormalities in kidney function, those who have taken uric acid-lowering or lipid-lowering medications in the past 6 months, currently have an acute infection, malignant tumors, psychiatric disorders, or are pregnant. Each data point was checked to ensure the accuracy and completeness of data collection. Those with missing severe data (over 20% of the overall) were excluded, and multiple interpolations were used to fill in those with fewer missing data (less than 20% of the overall) (Figure S1). After processing, complete data were obtained from 3579 patients with HUA. CAS was defined as increased carotid intima-media thickness ≥ 1 mm or the presence of plaques,15 and carotid ultrasound was performed independently by two skilled sonographers. A flow diagram of the research design is shown in Figure 1.
 |
Figure 1 Flow diagram of the research design. HUA, hyperuricemia. |
Clinical Baseline Data
The demographic and clinical data for this study were primarily based on their availability in the electronic medical record system, including gender, age, body mass index, systolic blood pressure (SBP), diastolic blood pressure (DBP), heart rate (HR), white blood cell count (WBC), neutrophil count, eosinophil count, basophil count (BAS), lymphocyte count (LYM), red blood cell count (RBC), hemoglobin (HGB), red blood cell distribution width (RDW), mean red blood cell volume (MCV), platelet count (PLT), platelet distribution width, mean platelet volume, alanine aminotransferase (ALT), aspartate aminotransferase (AST), total bilirubin (T-BIL), direct bilirubin (D-BIL), indirect bilirubin (I-BIL), total protein (TP), albumin (ALB), gamma-glutamyl transpeptidase (GGT), total bile acids (TBA), blood urea nitrogen (BUN), serum creatinine (SCR), UA, fasting blood glucose (FBG), total cholesterol, triglycerides (TG), high-density lipoprotein (HDL), low-density lipoprotein, apolipoprotein-A (Apo-A), apolipoprotein-B, homocysteine (HCY), thyroid stimulating hormone, total triiodothyronine (TT3), total tetraiodothyronine, free triiodothyronine (FT3), free tetraiodothyronine (FT4).
Statistical Analysis
Continuous variables were expressed as mean and standard deviation for normally distributed data and as median and interquartile range for skewed data. Percentages (%) were used to describe categorical variables. The data were analyzed using the R software package (version 4.1.2; https://www.R-project.org). All tests were two-sided, and statistical significance was defined as P < 0.05.
Selected individuals were randomly assigned to the training and internal validation sets at a ratio of 7:3.11 Multivariable logistic regression analysis was performed to identify the independent risk factors. The risk model’s characteristic variables were screened by the least absolute shrinkage and selection operator (LASSO) combined with 10-fold cross-validation and the model was presented using a nomogram. The discriminative ability, calibration, and clinical utility of the model were estimated by the receiver operating characteristic (ROC) curve, calibration curves, and decision curve analysis (DCA), respectively.
Results
Characteristics of the Study Population
A total of 3579 individuals were included in this study, comprising 2676 HUA participants without CAS and 903 HUA participants with CAS. The proportion of CAS in the HUA population was 25.2%. In the univariate analysis, a higher percentage of males was observed in the control group compared to the CAS group (86.1% vs 75.9%, P < 0.001). The median age of the CAS group was higher than that of the control group [median age 67 (IQR:58–77) vs 43 (IQR:32–54), P < 0.001]. Additionally, statistically significant differences were observed between the groups in terms of blood pressure (SBP, DBP), blood cell counts (WBC, BAS, LYM, RBC, HGB, RDW, MCV, PLT), liver function (ALT, AST, T-BIL, I-BIL, TP, ALB, TBA), renal function (BUN, SCR, UA), metabolic markers (FBG, TG, HDL, Apo-A, HCY), and thyroid function (TT3, FT3, FT4) (P < 0.05) (Table 1). Randomization sampling was used to distribute 2507 and 1072 individuals to the training and internal validation sets, respectively, and the basic characteristics of participants between the two sets did not differ (P > 0.05) (Table 1).
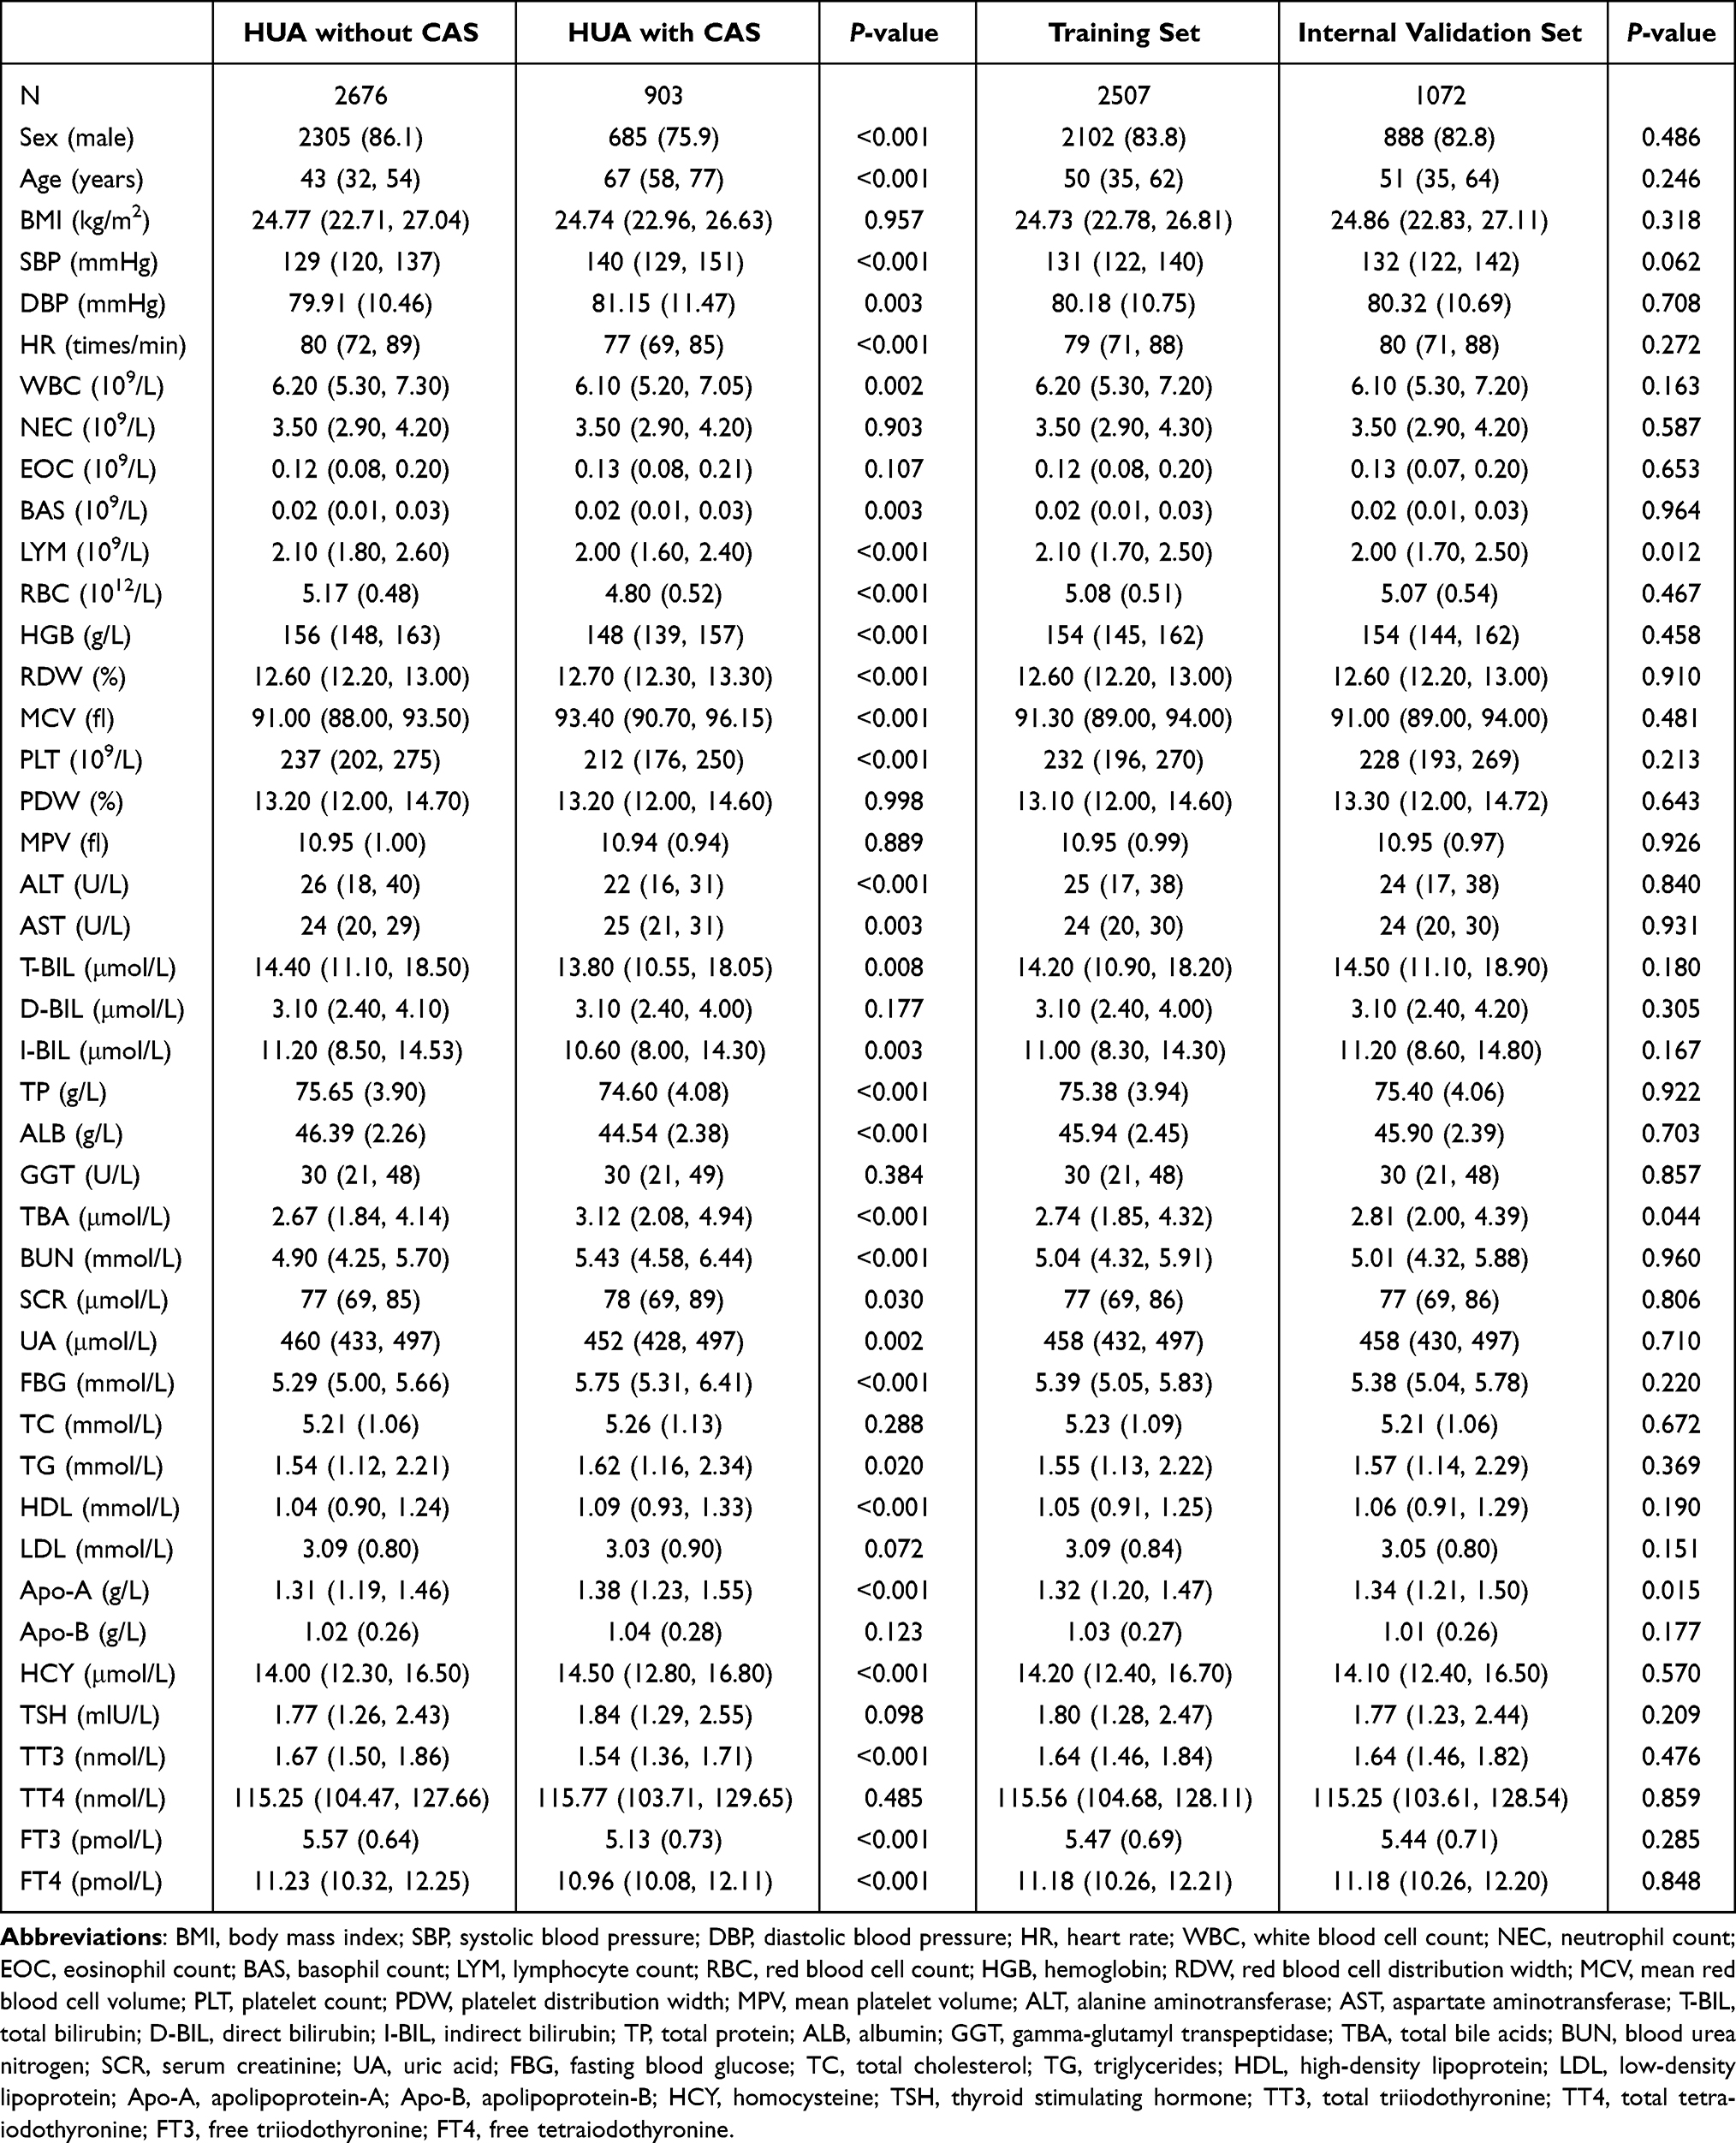 |
Table 1 Characteristics of the Study Population |
Independent Risk Factors
Candidate variables with P < 0.05 in the univariate analysis (Table 1) were included in the independent risk factors screening. To avoid the impact of multicollinearity on the outcome, we computed the variance inflation factor (VIF) for each variable and found severe multicollinearity among RBC, HGB, T-BIL, and I-BIL with a VIF greater than 10. Thereafter, we used stepwise backward logistic regression analysis to exclude these multicollinear variables. The most representative set of variables for CAS was selected when the Akaike information criterion was −7661.14. Furthermore, multivariable logistic regression analysis found that sex, age, MCV, and FBG were independent risk factors for CAS (Table 2).
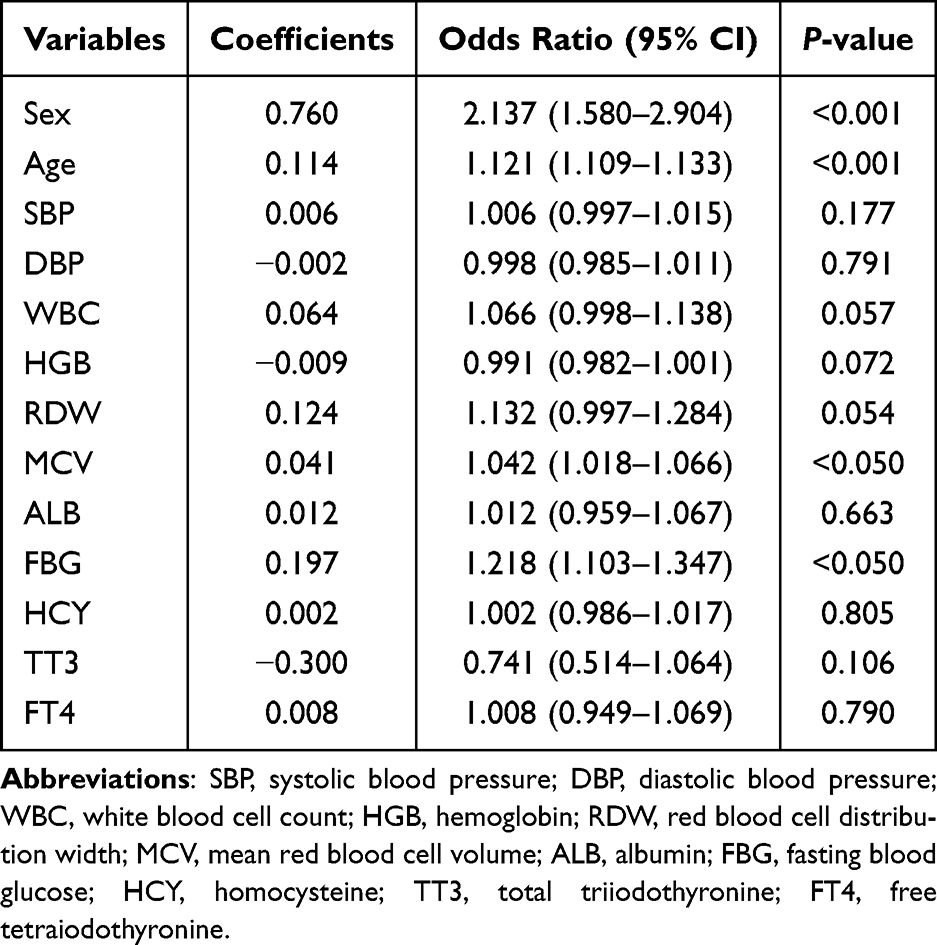 |
Table 2 Multivariable Logistic Regression Analysis |
Establishment of a CAS Risk Prediction Model
In the training set, we used LASSO combined with 10-fold cross-validation to screen out 19 non-zero characteristic variables (Figure 2 and Table 3). Afterward, we removed variables with low weights (scores < 15) from the risk model. Finally, a CAS risk prediction model was built using age, GGT, SCR, FBG, TT3, and D-BIL as predictors and was presented visually as a nomogram. For instance, using the risk model, a participant aged 84 years with HUA, a GGT of 23 U/L, a SCR of 105 μmol/L, a FBG of 5.5 mmol/L, a TT3 of 1.45 nmol/L, and a D-BIL of 3.6 μmol/L has an estimated probability of developing CAS of 90% (Figure 3).
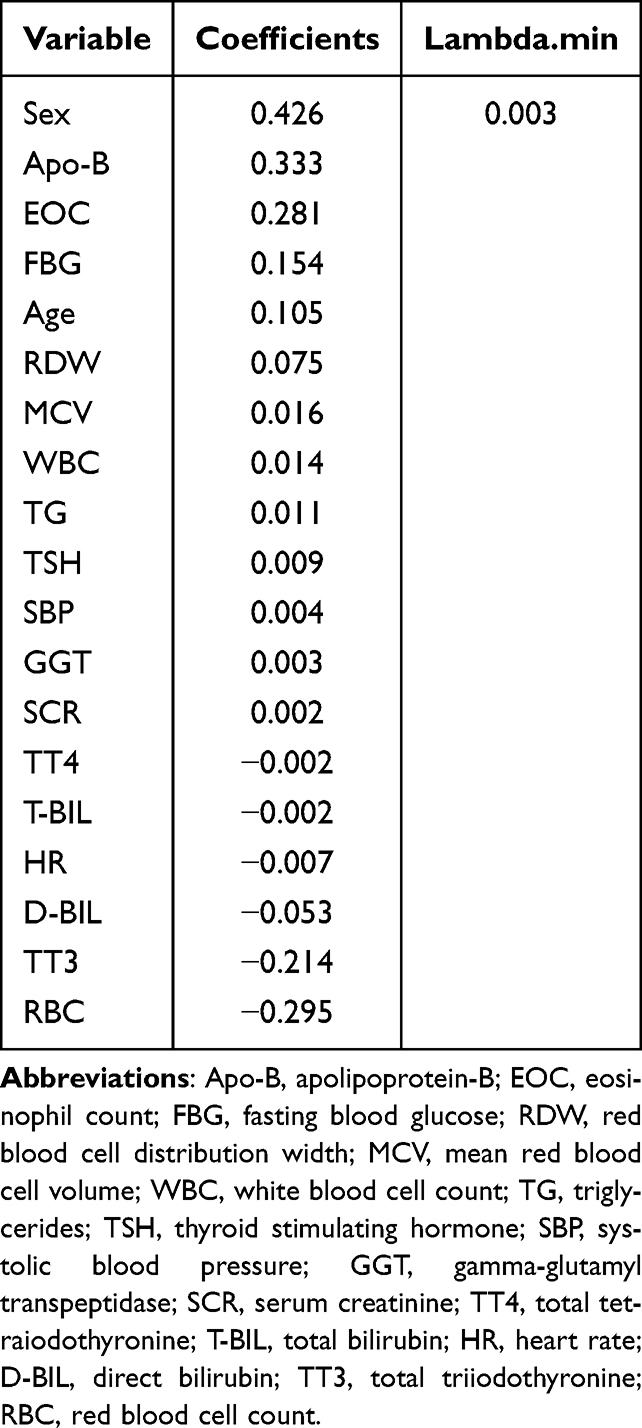 |
Table 3 Coefficients and Lambda.min Value of the LASSO Regression |
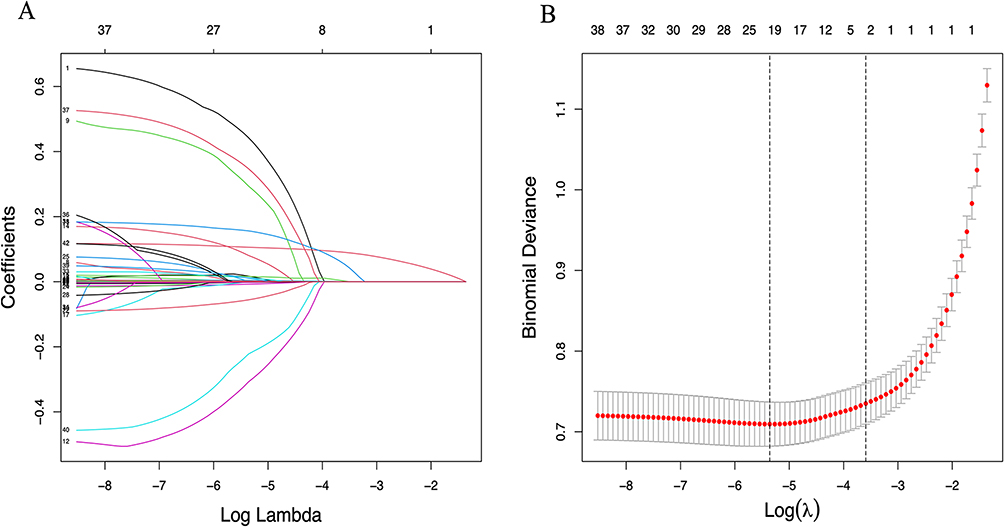 |
Figure 2 Characteristic variables were screened using LASSO regression analysis. (A) Trajectories of change in coefficients for each variable in the LASSO regression. (B) The best parameter (lambda) selection in the LASSO model uses 10-fold cross-validation with the lowest standard. The relationship curve between partial likelihood deviation (binomial deviation) and log (lambda) was plotted. Dotted vertical lines were drawn at the optimal values by using the minimum criteria and the 1 SE of the minimum criteria (the 1 SE criteria). LASSO, least absolute shrinkage and selection operator; SE, standard error. |
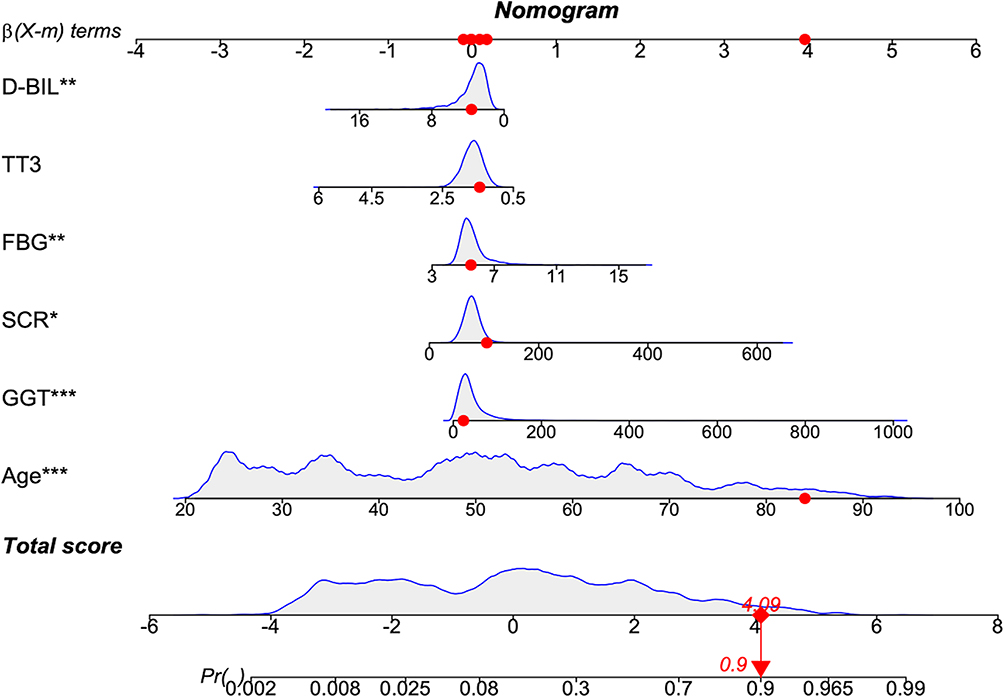 |
Figure 3 A nomogram for predicting the probability of developing CAS in the HUA population. The nomogram is used by scoring each variable on its corresponding score scale. The scores for all variables are then summed up to obtain the total score, and a vertical line is drawn from the total point row to indicate the estimated probability of the development of CAS in the HUA population. The red dot on the scale represents the corresponding score of the variable. The asterisks indicate the level of statistical significance of each variable, with * P < 0.05, ** P < 0.01, and *** P < 0.001. CAS, carotid atherosclerosis; HUA, hyperuricemia; GGT, gamma-glutamyl transpeptidase; SCR, serum creatinine; FBG, fasting blood glucose; TT3, total triiodothyronine; D-BIL, direct bilirubin. |
Internal Validation of a CAS Risk Prediction Model
The discriminative ability of the risk model was assessed by the ROC curve. The area under the ROC curve (AUC) was 0.891 in the training set and 0.901 in the internal validation set, which indicates an excellent discriminative ability of the model (Figure 4).
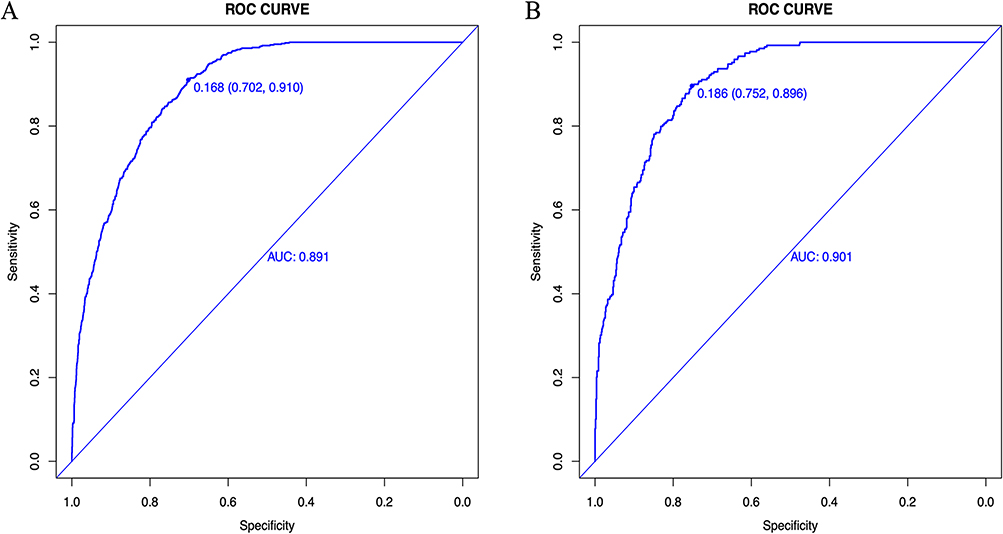 |
Figure 4 Receiver operating characteristic (ROC) curves. (A) Training set; (B) Internal validation set. |
Calibration curves were used to assess the agreement between the estimated probabilities and observed results in the model. Our study revealed that the predicted probabilities were well-aligned with the observed outcomes in both the training and internal validation sets, indicating a high level of model fitting (Figure 5).
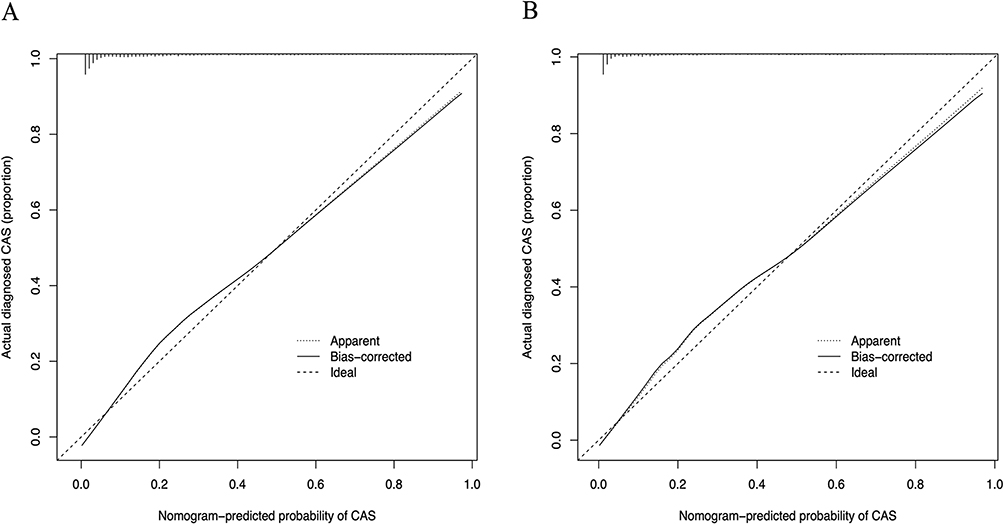 |
Figure 5 Calibration curves. (A) Training set; (B) Internal validation set. The x-axis represents the predicted CAS risk. The y-axis represents the actual diagnosed CAS. The diagonal dotted line represents a perfect prediction by an ideal model. The solid line represents the performance of the nomogram, of which a closer fit to the diagonal dotted line represents a better prediction. |
The clinical utility of the risk model was evaluated by DCA. The risk threshold probabilities for the training and internal validation sets were 1–87% and 1–100%, respectively, which suggested that our risk model was clinically beneficial in this range (Figure 6).
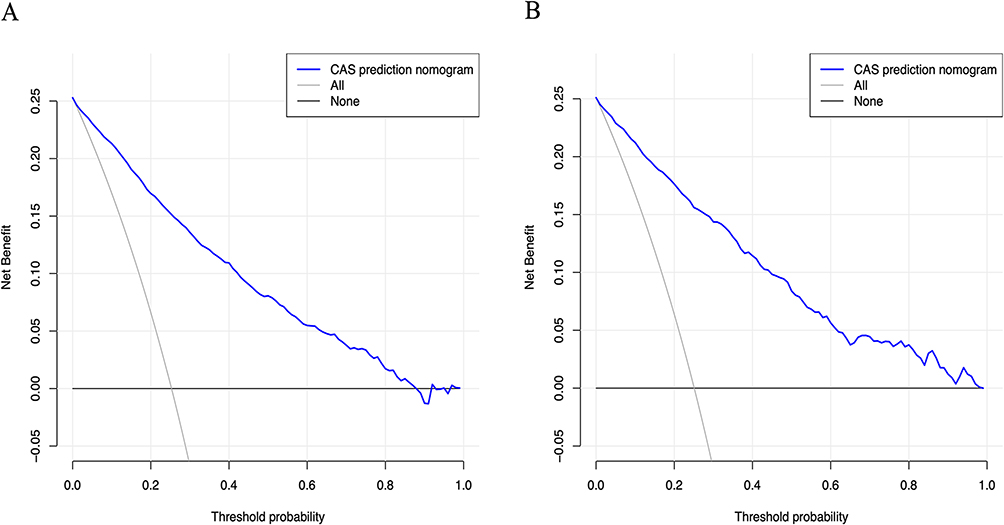 |
Figure 6 Decision curve analysis. (A) Training set; (B) Internal validation set. The black line represents the net benefit when none of the participants are considered to develop CAS, while the light gray line represents the net benefit when all participants are considered to develop CAS. The area between the blue and light gray lines in the model curve indicates the clinical utility of the model. |
Discussion
HUA was a widely recognized risk factor for CAS. As a major potential risk factor for ischemic stroke, CAS constantly threatens life and health. Therefore, early prediction and prevention of CAS are vital. This study enrolled 3579 HUA individuals, including 903 with CAS. The incidence of CAS among the HUA population was 25.2%, similar to the 26% reported in the 2009 NHLBI Family Heart Study.16 Multivariable logistic regression analysis identified sex, age, MCV, and FBG as independent risk factors for CAS in a population with HUA. A risk prediction model was established using age, GGT, SCR, FBG, TT3, and D-BIL as predictors. The risk model showed an excellent discriminative ability with a comparatively high AUC in the training and internal validation sets (0.891 and 0.901, respectively) and a good degree of fit with the calibration curves. Meanwhile, the DCA results indicated that the risk model clinically benefited when the risk threshold probabilities were 1–87% and 1–100% for the training and internal validation sets, respectively.
This study showed that sex [odds ratio: 2.137 (95% CI: 1.580–2.904)] was an independent risk factor for CAS. Males have a higher risk of CAS than females, possibly because of sex hormone levels.17 Multiple studies confirmed that age is a risk factor for CAS.18–20 However, more consideration should be given to other controllable factors, because age is an uncontrolled factor. We also observed FBG as an independent risk factor for CAS, in agreement with previous studies7,21 and FBG plays a significant role in ischemic stroke.22,23 Studies have shown that blood lipids were significantly associated with CAS.24 However, based on the available data, we did not observe a statistically significant difference between them. One possible explanation for this is that our study population primarily consisted of individuals who underwent routine health examinations. As a result, they may have been in the early stages of CAS, when the elevation of blood lipids may not yet appear to be a risk factor for CAS.
In clinical practice, the diagnosis of CAS relies primarily on carotid ultrasonography.25 However, difficulties remain with the large-scale availability of ultrasound in less-medically developed regions or countries. In recent years, with the growing demand for high-quality healthcare, machine learning has become a powerful tool in clinical medicine. For instance, one study developed explainable machine learning models for the early screening of CAS, demonstrating excellent clinical performance with an AUC of 0.860.26 Additionally, Chen et al27 identified CAS endotypes by machine learning methods, and their results showed that these endotypes could be applied in precision medicine to prevent atherosclerotic cardiovascular disease. In this study, we have developed a risk prediction model for CAS in the HUA population, which could contribute to the early identification of individuals at high risk.
Our study has significant clinical implications and potentially represents the first application of machine learning methods to predict CAS risk in the HUA population. By offering an alternative approach for the early detection of CAS, our model identifies individuals at elevated risk, enabling physicians to selectively perform further tests. Such a strategy promises to optimize healthcare resource deployment and engender economic efficiencies. We utilized variables such as age, GGT, SCR, FBG, TT3, and D-BIL to establish a risk prediction model for CAS. These variables are readily available in routine clinical practice, ensuring the model’s widespread applicability in the healthcare domain. Furthermore, we developed a nomogram to facilitate the use of our predictive model by healthcare professionals in daily clinical practice.
Although the risk prediction model we developed showed good predictive value, limitations were inevitable. First, the study population was regional, which may affect the extrapolation of the prediction model. Second, clinical baseline data were not collected comprehensively enough, and potential clinical predictors may have been overlooked. Third, the risk prediction model was only validated using internal datasets, while the validation of external datasets is necessary. In the future, We will conduct studies with multiple centers and large samples to further revise and improve the model.
Conclusion
This study identified sex, age, MCV, and FBG as independent risk factors for CAS in a population with HUA. Additionally, we developed a CAS risk prediction model for the early identification of high-risk individuals.
Data Sharing Statement
The original contributions presented in this research are included in the article, further inquiries can be directed to the corresponding authors.
Ethics Statement
This study was approved by the Ethics Committee of the Affiliated Hospital of Medical School, Ningbo University, (In March 2023, renamed as The First Affiliated Hospital of Ningbo University), Ningbo, China (KY20191101). The participants provided their written informed consent to participate in this study. All methods were carried out in accordance with the ethical standards of the Declaration of Helsinki.
Acknowledgments
We express our gratitude to Zhongwei Zhu from Ningbo Zhenhai Lianhua Hospital for his permanent support of this study.
Funding
This research was supported by the Ningbo Natural Science Foundation (No.2022J233; No.2018A610248), NINGBO Medical & Health Leading Academic Discipline Project (No.2022-F24), Medical and Health Research Project of Zhejiang Province (2020KY871; No.2018ZH029), and Ningbo Social Welfare Research (No.2022S047).
Disclosure
The authors declare that the research was conducted in the absence of any commercial or financial relationships that could be construed as a potential conflict of interest.
References
1. Saini V, Guada L, Yavagal DR. Global Epidemiology of Stroke and Access to Acute Ischemic Stroke Interventions. Neurology. 2021;97(20 Suppl 2):S6–s16. doi:10.1212/wnl.0000000000012781
2. Ma Q, Li R, Wang L, et al. Temporal trend and attributable risk factors of stroke burden in China, 1990-2019: an analysis for the Global Burden of Disease Study 2019. Lancet Public Health. 2021;6(12):e897–e906. doi:10.1016/s2468-2667(21)00228-0
3. Saba L, Saam T, Jäger HR, et al. Imaging biomarkers of vulnerable carotid plaques for stroke risk prediction and their potential clinical implications. Lancet Neurol. 2019;18(6):559–572. doi:10.1016/s1474-4422(19)30035-3
4. Li Y, Shen Z, Zhu B, Zhang H, Zhang X, Ding X. Demographic, regional and temporal trends of hyperuricemia epidemics in mainland China from 2000 to 2019: a systematic review and meta-analysis. Glob Health Action. 2021;14(1):1874652. doi:10.1080/16549716.2021.1874652
5. Ma M, Wang L, Huang W, et al. Meta-analysis of the correlation between serum uric acid level and carotid intima-media thickness. PLoS One. 2021;16(2):e0246416. doi:10.1371/journal.pone.0246416
6. Hu X, Liu J, Li W, et al. Elevated serum uric acid was associated with pre-inflammatory state and impacted the role of HDL-C on carotid atherosclerosis. Nutr, Metab Cardiovasc Dis. 2022;32(7):1661–1669. doi:10.1016/j.numecd.2022.03.026
7. Gao Y, Xu B, Yang Y, et al. Association Between Serum Uric Acid and Carotid Intima-Media Thickness in Different Fasting Blood Glucose Patterns: a Case-Control Study. Front Endocrinol. 2022;13:899241. doi:10.3389/fendo.2022.899241
8. Ji X, Leng XY, Dong Y, et al. Modifiable risk factors for carotid atherosclerosis: a meta-analysis and systematic review. Ann Transl Med. 2019;7(22):632. doi:10.21037/atm.2019.10.115
9. Zhong C, Zhong X, Xu T, Xu T, Zhang Y. Sex-Specific Relationship Between Serum Uric Acid and Risk of Stroke: a Dose-Response Meta-Analysis of Prospective Studies. J Am Heart Assoc. 2017;6(4). doi:10.1161/jaha.116.005042
10. Jayachandran M, Qu S. Harnessing hyperuricemia to atherosclerosis and understanding its mechanistic dependence. Med Res Rev. 2021;41(1):616–629. doi:10.1002/med.21742
11. Huang G, Jin Q, Tian X, Mao Y. Development and validation of a carotid atherosclerosis risk prediction model based on a Chinese population. Front Cardiovasc Med. 2022;9:946063. doi:10.3389/fcvm.2022.946063
12. Feng X, Ren L, Xiang Y, Xu Y. Development and validation of a nomogram for evaluating the incident risk of carotid atherosclerosis in patients with type 2 diabetes. Front Endocrinol. 2023;14:1131430. doi:10.3389/fendo.2023.1131430
13. Peduzzi P, Concato J, Kemper E, Holford TR, Feinstein AR. A simulation study of the number of events per variable in logistic regression analysis. J Clin Epidemiol. 1996;49(12):1373–1379. doi:10.1016/s0895-4356(96)00236-3
14. Zhou JG. Chinese multi-disciplinary consensus on the diagnosis and treatment of hyperuricemia and its related diseases. Zhonghua Nei Ke Za Zhi. 2017;56(3):235–248. doi:10.3760/cma.j.issn.0578-1426.2017.03.021
15. Wang X, Li W, Song F, et al. Carotid Atherosclerosis Detected by Ultrasonography: a National Cross-Sectional Study. J Am Heart Assoc. 2018;7(8):701. doi:10.1161/jaha.118.008701
16. Neogi T, Ellison RC, Hunt S, Terkeltaub R, Felson DT, Zhang Y. Serum uric acid is associated with carotid plaques: the National Heart, Lung, and Blood Institute Family Heart Study. J Rheumatol. 2009;36(2):378–384. doi:10.3899/jrheum.080646
17. Thurston RC, Bhasin S, Chang Y, et al. Reproductive Hormones and Subclinical Cardiovascular Disease in Midlife Women. J Clin Endocrinol Metab. 2018;103(8):3070–3077. doi:10.1210/jc.2018-00579
18. Zhang J, Sang H, Zhang X, et al. Comparison of the Characteristics and Risk Factors of Carotid Atherosclerosis in High Stroke Risk Populations Between Urban and Rural Areas in North China. Front Neurol. 2020;11:554778. doi:10.3389/fneur.2020.554778
19. Song P, Fang Z, Wang H, et al. Global and regional prevalence, burden, and risk factors for carotid atherosclerosis: a systematic review, meta-analysis, and modelling study. Lancet Glob Health. 2020;8(5):e721–e729. doi:10.1016/s2214-109x(20)30117-0
20. Ren L, Cai J, Liang J, Li W, Sun Z. Impact of Cardiovascular Risk Factors on Carotid Intima-Media Thickness and Degree of Severity: a Cross-Sectional Study. PLoS One. 2015;10(12):e0144182. doi:10.1371/journal.pone.0144182
21. Yu J, Zhou Y, Yang Q, et al. Machine learning models for screening carotid atherosclerosis in asymptomatic adults. Sci Rep. 2021;11(1):22236. doi:10.1038/s41598-021-01456-3
22. Georgakis MK, Harshfield EL, Malik R, et al. Diabetes Mellitus, Glycemic Traits, and Cerebrovascular Disease: a Mendelian Randomization Study. Neurology. 2021;96(13):e1732–e1742. doi:10.1212/wnl.0000000000011555
23. Arnold M, Gill D, Katan M. A Good Start to Shed More Light on the Relationship Between Glycemic Traits, Diabetes Mellitus, and Cerebrovascular Disease. Neurology. 2021;96(13):602–603. doi:10.1212/wnl.0000000000011557
24. Yang C, Sun Z, Li Y, Ai J, Sun Q, Tian Y. The correlation between serum lipid profile with carotid intima-media thickness and plaque. BMC Cardiovasc Disord. 2014;14:181. doi:10.1186/1471-2261-14-181
25. Byrnes KR, Ross CB. The current role of carotid duplex ultrasonography in the management of carotid atherosclerosis: foundations and advances. Int J Vasc Med. 2012;2012:187872. doi:10.1155/2012/187872
26. Yun K, He T, Zhen S, et al. Development and validation of explainable machine-learning models for carotid atherosclerosis early screening. J Transl Med. 2023;21(1):353. doi:10.1186/s12967-023-04093-8
27. Chen QS, Bergman O, Ziegler L, et al. A machine learning based approach to identify carotid subclinical atherosclerosis endotypes. Cardiovasc Res. 2023. doi:10.1093/cvr/cvad106
 © 2024 The Author(s). This work is published and licensed by Dove Medical Press Limited. The full terms of this license are available at https://www.dovepress.com/terms.php and incorporate the Creative Commons Attribution - Non Commercial (unported, v3.0) License.
By accessing the work you hereby accept the Terms. Non-commercial uses of the work are permitted without any further permission from Dove Medical Press Limited, provided the work is properly attributed. For permission for commercial use of this work, please see paragraphs 4.2 and 5 of our Terms.
© 2024 The Author(s). This work is published and licensed by Dove Medical Press Limited. The full terms of this license are available at https://www.dovepress.com/terms.php and incorporate the Creative Commons Attribution - Non Commercial (unported, v3.0) License.
By accessing the work you hereby accept the Terms. Non-commercial uses of the work are permitted without any further permission from Dove Medical Press Limited, provided the work is properly attributed. For permission for commercial use of this work, please see paragraphs 4.2 and 5 of our Terms.