")
Back to Journals » International Journal of Women's Health » Volume 6
Cardiovascular disease risk score prediction models for women and its applicability to Asians
Authors Goh L, Dhaliwal S, Welborn T, Thompson P, Maycock B, Kerr D, Lee A, Bertolatti D, Clark K, Naheed R, Coorey R, Della P
Received 1 October 2013
Accepted for publication 21 November 2013
Published 10 March 2014 Volume 2014:6 Pages 259—267
DOI https://doi.org/10.2147/IJWH.S55225
Checked for plagiarism Yes
Review by Single anonymous peer review
Peer reviewer comments 2
Louise GH Goh,1 Satvinder S Dhaliwal,1 Timothy A Welborn,2 Peter L Thompson,2–4 Bruce R Maycock,1 Deborah A Kerr,1 Andy H Lee,1 Dean Bertolatti,1 Karin M Clark,1 Rakhshanda Naheed,1 Ranil Coorey,1 Phillip R Della5
1School of Public Health, Curtin Health Innovation Research Institute, Curtin University, Perth, WA, Australia; 2Sir Charles Gairdner Hospital, Nedlands, Perth, WA, Australia; 3School of Population Health, University of Western Australia, Perth, WA, Australia; 4Harry Perkins Institute for Medical Research, Perth, WA, Australia; 5School of Nursing and Midwifery, Curtin Health Innovation Research Institute, Curtin University, Perth, WA, Australia
Purpose: Although elevated cardiovascular disease (CVD) risk factors are associated with a higher risk of developing heart conditions across all ethnic groups, variations exist between groups in the distribution and association of risk factors, and also risk levels. This study assessed the 10-year predicted risk in a multiethnic cohort of women and compared the differences in risk between Asian and Caucasian women.
Methods: Information on demographics, medical conditions and treatment, smoking behavior, dietary behavior, and exercise patterns were collected. Physical measurements were also taken. The 10-year risk was calculated using the Framingham model, SCORE (Systematic COronary Risk Evaluation) risk chart for low risk and high risk regions, the general CVD, and simplified general CVD risk score models in 4,354 females aged 20–69 years with no heart disease, diabetes, or stroke at baseline from the third Australian Risk Factor Prevalence Study. Country of birth was used as a surrogate for ethnicity. Nonparametric statistics were used to compare risk levels between ethnic groups.
Results: Asian women generally had lower risk of CVD when compared to Caucasian women. The 10-year predicted risk was, however, similar between Asian and Australian women, for some models. These findings were consistent with Australian CVD prevalence.
Conclusion: In summary, ethnicity needs to be incorporated into CVD risk assessment. Australian standards used to quantify risk and treat women could be applied to Asians in the interim. The SCORE risk chart for low-risk regions and Framingham risk score model for incidence are recommended. The inclusion of other relevant risk variables such as obesity, poor diet/nutrition, and low levels of physical activity may improve risk estimation.
Keywords: cardiovascular disease prevention, risk assessment, epidemiology, Asia, female
Introduction
Globally, cardiovascular disease (CVD) is the leading cause of death, with approximately 17 million deaths reported in 2008.1 In absolute numbers, more CVD deaths occurred in women than men.2 CVD risk can be quantified by risk score models using multiple variables and their interactions. This is a cost effective approach to identify high-risk individuals for preventive treatment, especially in Asian countries experiencing large increases in CVD incidence.3
Modifiable risk factors associated with CVD and other noncommunicable diseases are becoming more prevalent.4–6 Although elevated CVD risk factors increase the risk of developing CVD across all ethnic groups,7,8 there is emerging evidence of variation in the distribution of modifiable risk factors between ethnic groups which may explain the differences in CVD risk.9–13
The prevalence of risk factors differs across ethnic groups. The rate of hypertension is approximately two times higher in South Asians when compared to the general population of London.14 In the Asia Pacific Cohort Studies Collaboration study, systolic blood pressure (SBP) and total cholesterol were more strongly associated with CVD risk in Asian than in Caucasian women.3 Diabetes is also more prevalent in Asian populations consisting of Chinese, Indians, and Japanese when compared to Caucasians.8 The prevalence of diabetes is about 3–5 times higher in South Asians when compared to Europeans12,14,15 and should be included in screening and surveys, particularly, in the prediction of CVD risk in Asians.15
The effect of risk factors on CVD risk also differs in Caucasian and Asian women, thus explaining the need for separate cutoff values. For example, when assessing abdominal obesity, a waist circumference (WC) of ≥88 cm would increase a Caucasian woman’s risk of diabetes and CVD while a lower cutoff value of WC ≥80 cm would place an Asian woman at increased risk.9 It should also be noted that results differ depending on which anthropometric measurement is used for assessing adiposity. Bangladeshi women reported a lower prevalence of overweight and obesity (body mass index [BMI] >25 kg/m2) using BMI but a higher prevalence of raised waist-to-hip ratio (WHR) and WC when compared to the general population of England.16
Due to differences in distribution and association of certain risk factors with CVD, and differing CVD risk between Asian and Caucasian women, the British Cardiac Society, British Hypertension Society, Diabetes UK, HEART UK, Primary Care Cardiovascular Society, and the Stroke Association have all emphasized the importance of incorporating ethnicity into CVD risk assessment.9 The inclusion of ethnicity along with other variables also improved the accuracy of a risk score model in identifying those at high-risk of CVD.17 Existing risk score models are primarily developed and validated in Caucasians and most models have not incorporated ethnicity as a risk variable.18
This study therefore aims to predict the 10-year coronary heart disease (CHD) and CVD incidence and/or mortality risk in a multiethnic cohort of 4,354 disease free women at baseline, and to compare the differences in risk between Asian and Caucasian women. Five established models for predicting CVD risk are utilized: Framingham model, SCORE (Systematic COronary Risk Evaluation) model for low-risk regions (which was developed from European countries with low CVD rates, ie, Belgium, Italy, and Spain), SCORE model for high-risk regions (European countries with high CVD rates, ie, Denmark, Finland, and Norway), general CVD risk score model, and simplified general CVD risk score model.
Methods
Study cohort
The study cohort consisted of a representative sample of 4,354 females aged 20–69 years with no previous history of heart disease, diabetes, or stroke at baseline from the third Risk Factor Prevalence Study,19 conducted by the National Heart Foundation of Australia in 1989. The subjects consisted of residents on the federal electoral rolls in December 1988 in north and south Sydney, Melbourne, Brisbane, Adelaide, Perth, Hobart, Darwin, and Canberra in a systematic probability sampling by sex and 5-year age groups. Country of birth was used as a surrogate for ethnicity and grouped into regions as described by the Australian Risk Factor Prevalence Study Management Committee.19
Ethics
Ethical approval for the survey was obtained in advance from the Australian Institute of Health Interim Ethics Committee, after consultation with the Commonwealth Privacy Commissioner. The present study was approved by the Human Research Ethics Committee at Curtin University, and complies with the Declaration of Helsinki.
Data and measurements
A self-administered questionnaire was completed and information on demographic and socioeconomic characteristics, medical conditions and treatment, oral contraceptive use, alcohol consumption, smoking behavior, dietary behavior, and exercise patterns were collected. The following physical measurements were taken: height (to the nearest centimeter), weight (to the nearest tenth of a kilogram), waist and hip circumference, systolic and diastolic blood pressure, and lipid levels. Waist and hip circumference were measured according to standardized methodologies20,21 using two observers. The mean of two measurements was taken at each site to the nearest centimeter. Blood pressure levels were recorded from the right arm of subjects at rest, each 5 minutes apart, using mercury sphygmomanometers. Fasting blood samples were collected in ethylenediaminetetraacetic acid tubes and separated within 3 hours and stored at 4°C until they were dispatched to the central laboratory at the Division of Clinical Chemistry, Institute of Medical and Veterinary Science, Adelaide, Australia each week to be assayed for plasma cholesterol, high density lipoprotein (HDL) cholesterol, and triglyceride levels.
Risk score models
The Framingham risk score model published by Anderson et al,22 SCORE risk chart for low-risk and high-risk regions,23 and general CVD or simplified general CVD risk score models24 were used to calculate the 10-year risk of CHD and CVD incidence and/or mortality. Both Framingham and general CVD risk score models were developed based on data from the American Framingham Heart Study, but with significant differences.22,24 Participants aged 30–74 years who were free of CVD and cancer were included in developing the Framingham model22 while only individuals without CVD were used in the development of the general CVD risk score model.24 The general CVD risk score model was developed using data from a larger cohort compared to the Framingham model.
The SCORE risk chart for low-risk and high-risk regions was developed by pooling 12 cohort studies to predict the 10-year CHD and CVD mortality risk in Europe. The cohorts consisted of participants aged 19–80 years.23 Those with a previous history of heart attack were not included in model development.23 The SCORE model was derived from a much larger dataset than the general CVD and Framingham risk score models. The risk chart for high-risk regions was derived from cohorts in Denmark, Finland, and Norway as they had higher CVD rates, controlling for risk factor levels, age,25 cohort sizes, and data availability.23 The risk chart for low-risk regions was developed using cohorts in Belgium, Italy, and Spain.23
The Weibull distribution and Cox proportional hazards regression were used to determine significant risk variables for inclusion in the Framingham and SCORE, and general CVD or simplified general CVD risk score model, respectively. Similar outcomes were predicted by these models except the SCORE model which predicted only fatal CHD and CVD events. The Framingham model defined CHD and CVD mortality based on death certificates in more than 50% of cases while morbidity follow-up was sophisticated and difficult to reproduce,26,27 and SCORE defined mortality using International Classification of Diseases (ICD)-9 codes which were based on death certificates as well.28 CHD and CVD incidence and mortality were adjudicated using medical histories, physical examinations, hospitalization records, and communication with physicians for the general CVD or simplified general CVD risk score model.24 All models included age, sex, SBP, and smoking status. The simplified general CVD risk score model also included BMI (as an alternative to total and HDL cholesterol levels), use of antihypertensive medication, and diabetes. Diabetes was also incorporated into the Framingham model but not the SCORE model.
Data analysis
Demographic and clinical characteristics of the sample were described using mean ± standard deviation and median (interquartile range) for continuous variables, while counts (percentages) and odds ratios (95% confidence interval) were used for categorical variables. Differences in categorical risk factors were assessed using logistic regression, with age as a covariate.
The 10-year CHD and CVD incidence and/or mortality risk was calculated using published Weibull or Cox proportional hazards regression model for each subject, for Framingham, SCORE for low-risk regions, SCORE for high-risk regions, general CVD, and simplified general CVD risk score models. Medians and interquartile range were presented and nonparametric tests were utilized as the distribution of risk within each ethnic group was skewed. Comparisons of risks between ethnic groups were assessed using Kruskal–Wallis test and Mann–Whitney U test. The 10-year risks were expressed as percentages for ease of reporting. All statistical analyses were performed with IBM SPSS Statistics version 20 (IBM Corporation, Armonk, NY, USA). P-values of less than 0.05 were considered to be statistically significant.
Results
Table 1 presents the distribution of CVD risk variables in 4,354 women without heart disease, diabetes, or stroke at baseline, according to ethnicity. Generally, lower proportions of Asian women were identified to be above the cut points for individual risk factors recommended for use in the clinical diagnosis of the metabolic syndrome29–33 and increased risk of CVD34–41 when compared to Caucasian women. A higher proportion of southern European women were generally above the cut points compared to all other ethnic groups. Generally, the largest difference across all risk factors was between southern European and Asian women, and Australian and Asian women were most similar.
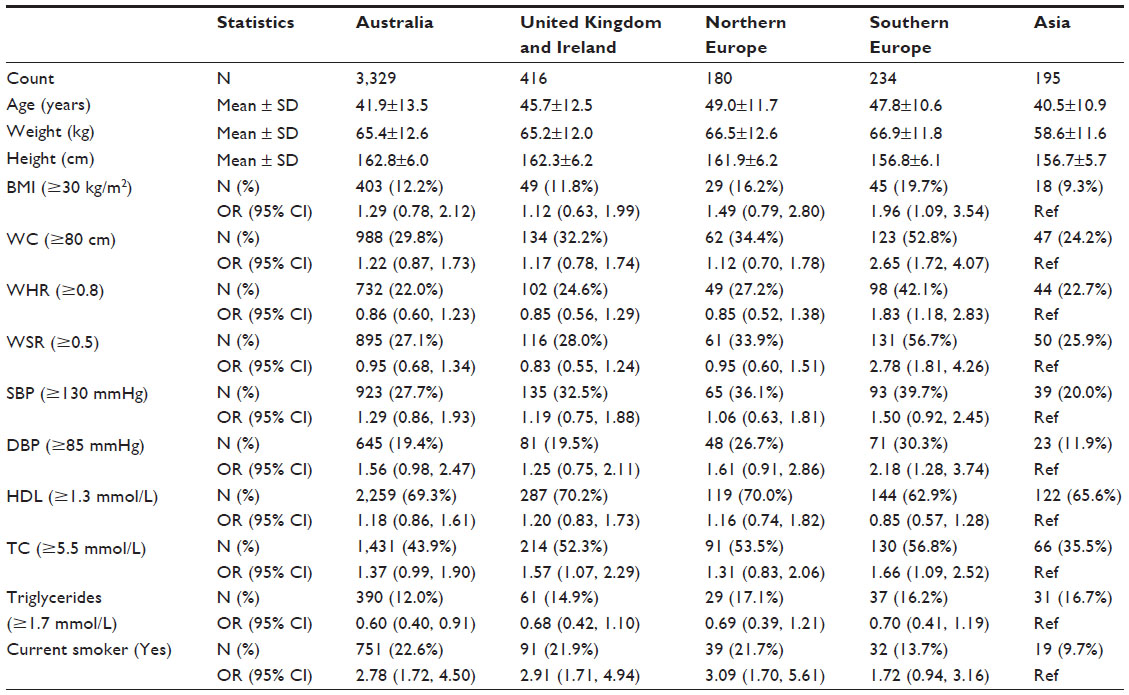 | Table 1 Characteristics of the cohort of 4,354 women without heart disease, diabetes, or stroke by ethnicity |
The 10-year predicted CVD and CHD incidence and/or mortality risks were compared between ethnic groups and are presented in Tables 2 and 3, respectively. Women from the UK and Ireland, northern Europe, and southern Europe had higher risk and were significantly different from Asian women (P<0.0005) after calculations from all five models for CVD and CHD mortality, incidence and mortality, and incidence. Southern European women reported the highest risk among all ethnicities for both CVD and CHD. Australian women were not significantly different (P>0.05) to Asian women in the predicted CVD and CHD mortality risk, using the SCORE risk chart for low- and high-risk regions (Tables 2 and 3). Australian women were also not significantly different from Asian women (P>0.05) in the predicted CHD mortality and CHD incidence risk, using the Framingham model (Table 3). Differences in risk levels between southern European and Asian women were the largest while Australian and Asian women were the least different.
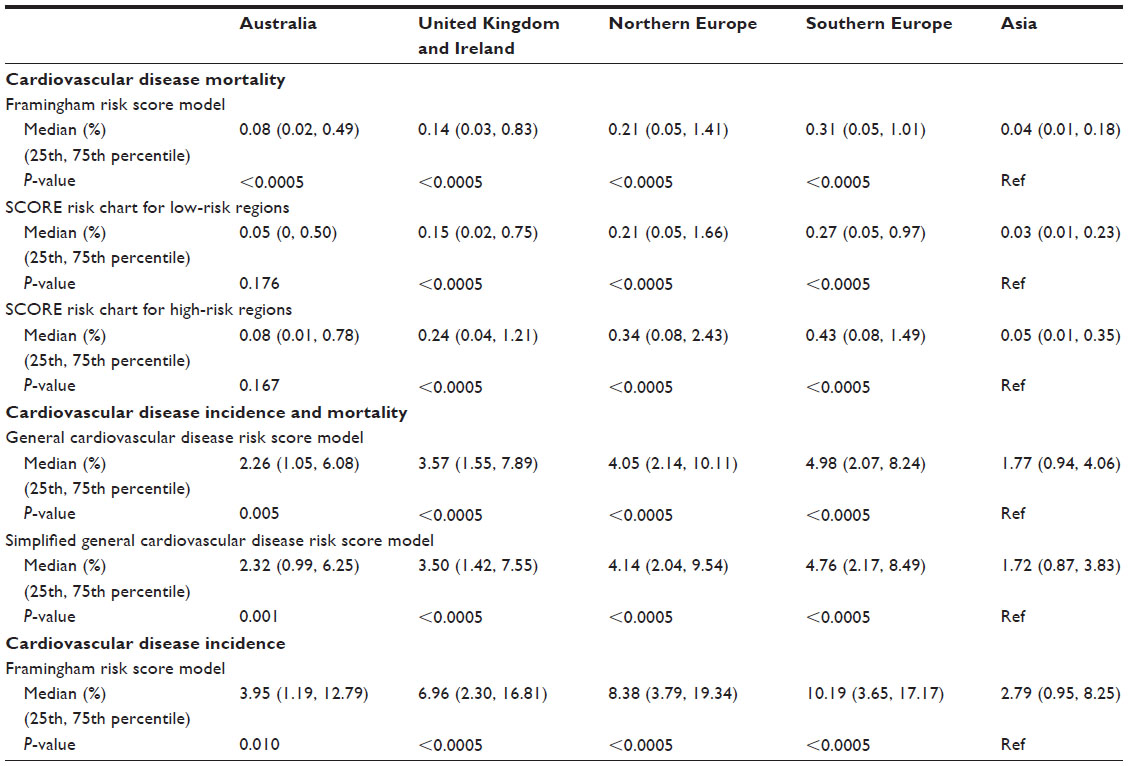 | Table 2 Predicted 10-year cardiovascular disease incidence and/or mortality risk (%) in 4,354 women without heart disease, diabetes, or stroke by ethnicity |
 | Table 3 Predicted 10-year CHD incidence and/or mortality risk (%) in 4,354 women without heart disease, diabetes, or stroke by ethnicity |
Table 4 presents the prevalence of CVD in Australia among adults (age ≥18 years), according to ethnicity. Australians and Asians reported similar proportions of people with CVD. The proportion of people with CVD decreased between 2007–2008 and 2011–2012 across all Caucasian ethnic groups while the proportion of Asians with CVD increased. In 2011–2012, the prevalence of CVD among Australians was 3.2% compared to 2.9% for Asians. The least difference in the prevalence of CVD was therefore between Australians and Asians and the largest difference was between southern Europeans and Asians.
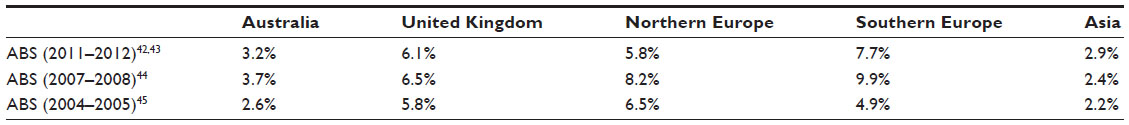 | Table 4 Cardiovascular disease prevalence in adults (age ≥18 years) by ethnicity |
Discussion
In this study, fewer Asian women were above the cut points for the clinical diagnosis of the metabolic syndrome and increased CVD risk than Caucasian women. Generally, they had significantly lower CHD and CVD risk when compared to Caucasian women. Ethnic variation in the 10-year CHD and CVD risk were also evident in some previous studies.46,47 In Norway, a study used the SCORE model for high-risk regions to assess participants free of myocardial infarction, stroke, angina pectoris, diabetes, and who had no prior use of antihypertensive medication.46 Norwegian women reported higher 10-year predicted CVD mortality risk, 40% higher than the risk of Asian (Pakistan, Sri Lanka, and Vietnam) women.46 Similar results were also observed in another Norwegian study using the general CVD risk score model.47 Research studies generally recommend using a lower treatment threshold for Asians, considering their lower risk levels, but this requires testing.48,49
The CVD risk in our study was, however, similar between Australian and Asian women from the SCORE risk chart and Framingham models. Thus, it would also be expected that Australians and Asians report similar CVD prevalence, considering they had similar risk, and this was borne out in the comparisons of CVD prevalence from the Australian Bureau of Statistics.42–45 This is supported by an existing study using the general CVD risk model. Except for southeast Asians, most Asian women were not statistically significantly different from Norwegian women in their 10-year CVD risk calculated from the general CVD risk model.47
Risk score models that incorporated the prediction of incident events were expected to report higher risk score values when compared to those that only predicted CHD or CVD mortality, with an increase in sensitivity and the identification of more subjects for treatment. The Framingham risk score model for predicting CHD or CVD incidence and the general CVD or simplified general CVD model for predicting CHD or CVD incidence and mortality reported higher risk score values. In applying risk prediction to Asian women, the model should be able to predict stroke as well, considering Asian countries generally report higher stroke mortality than Western countries.8
Certain models better predict the risk in Asian women. One study reported that the SCORE model based on total cholesterol/HDL cholesterol ratio may be more applicable to Asian (Pakistan, Sri Lanka, and Vietnam) women when compared to the SCORE total cholesterol model, but this can only be confirmed using mortality outcome data.46 The choice of risk score model does have an impact on risk estimation and risk categorization.50
None of the models included in this study incorporated ethnicity into their risk assessment. While these models had been evaluated in different ethnic groups, including in Asians, ethnic differences in risk prediction have not been previously analyzed. To date, only the QRISK score model included self-assigned ethnicity as a risk variable.17 Some of the risk variables in the QRISK model such as Townsend deprivation score17 could not be collected in our study. A web based risk calculator (ETHRISK) to predict the 10-year CHD and CVD risk is also available.51 It was developed by recalibrating the Framingham risk score model to predict the risk in seven British black and minority ethnic groups.51 It should be noted that diabetes, an important risk variable for predicting CVD risk in Asian women, was not included in this calculator.51
Other relevant risk factors associated with CHD and CVD risk18,52 such as obesity, low levels of physical activity, poor diet/nutrition, alcohol consumption, use of antihypertensive medication, chronic kidney disease, and coronary artery calcium have not been incorporated into some of these models. Only BMI was included in the simplified general CVD risk score model. Limitation of BMI includes that it does not account for the variability in body fat distribution across different ethnic groups. For example, the Chinese and south Asians deposit more abdominal adipose tissue when compared to Europeans.53 In a study conducted on Sri Lankan adults, BMI was not a significant predictor of CHD risk in females while WC independently predicted CHD risk in females.54 Anthropometric measurements such as WC, WHR, and waist-to-stature ratio (WSR) have not been included in any of these models although they have been shown to be better predictors of obesity and CHD and CVD risk.38,55–57 A study reported that the WHR is a stronger predictor of CHD and CVD risk when compared to BMI and thus it is preferred for clinical use.37 Another study also supported the use of WHR for assessing obesity as it has low measurement error, high precision, and no bias across a wide range of ethnic groups.58 A recent systematic review and meta-analysis comprising of more than 300,000 adults from different ethnic groups was conducted to assess the screening potential of WSR, WC, and BMI.59 The WSR performed better in terms of its discriminatory power when compared to WC and BMI in differentiating those with diabetes, hypertension, CVD, and all outcomes in females.59 Conversely, the role of obesity may be mediated through total cholesterol, HDL cholesterol, elevated blood pressure, and diabetes and thus was not considered as a risk variable that would affect CVD treatment in the National Cholesterol Education Program’s Third Adult Treatment Panel (ATP-III) guidelines.60 More studies are needed to ascertain the role of obesity in CVD risk assessment and the most valid and appropriate measurement(s) for assessing adiposity in women of different ethnicity.
Conclusion
In conclusion, ethnicity influences the distribution of CVD risk factors and the 10-year predicted CHD and CVD risk, with Asian women generally reporting lower risk when compared to Caucasian women across all models assessed in this study. This implies a lower treatment threshold may be appropriate for Asian women but further research is required.
In the interim, Australian standards for the quantification of CVD risk and treatment related decisions in women based on calculated risk should include Asians in Australia. The SCORE risk chart for low-risk regions for the calculation of 10-year CHD and CVD mortality risk and the Framingham risk score model for the 10-year prediction of CHD incidence are recommended. More multiethnic cohort studies are needed to establish this recommendation to more accurately identify appropriate individuals for preventive treatment.
Ethnicity should be incorporated into existing and future risk score models. Alternatively, risk score models can be recalibrated prior to use in different populations, such as Asians, which has been done in some studies. Recalibration ensures the transferability of risk score models across ethnic groups.61
Risk score models should incorporate important risk factors such as diabetes, SBP, and total cholesterol level when predicting the CVD risk of Asian women. The inclusion of other relevant risk variables such as obesity, low levels of physical activity, poor diet/nutrition, alcohol consumption, use of antihypertensive medication, chronic kidney disease, and coronary artery calcium may improve risk estimation. Finally, more accurate and appropriate measures of adiposity (other than BMI) to assess body fat distribution among Asians also needs further evaluation.62
Disclosure
The authors report no conflicts of interest in this work.
References
World Health Organization. Global Status Report on Noncommunicable Diseases 2010. Geneva: World Health Organization; 2011. Available from: http://www.who.int/nmh/publications/ncd_report2010/en/. Accessed December 24, 2013. | |
Rosamond W, Flegal K, Furie K, et al; American Heart Association Statistics Committee and Stroke Statisitics Subcommittee. Heart disease and stroke statistics – 2008 update: a report from the American Heart Association Statistics Committee and Stroke Statistics Subcommittee. Circulation. 2008;117(4):e25–e146. | |
Asia Pacific Cohort Studies Collaboration, Barzi F, Patel A, et al. Cardiovascular risk prediction tools for populations in Asia. J Epidemiol Community Health. 2007;61(2):115–121. | |
Finucane MM, Stevens GA, Cowan MJ, et al; Global Burden of Metabolic Risk Factors of Chronic Diseases Collaborating Group (Body Mass Index). National, regional, and global trends in body-mass index since 1980: systematic analysis of health examination surveys and epidemiological studies with 960 country-years and 9.1 million participants. Lancet. 2011;377(9765):557–567. | |
Danaei G, Finucane MM, Lin JK, et al; Global Burden of Metabolic Risk Factors of Chronic Diseases Collaborating Group (Blood Pressure). National, regional, and global trends in systolic blood pressure since 1980: systematic analysis of health examination surveys and epidemiological studies with 786 country-years and 5.4 million participants. Lancet. 2011;377(9765):568–577. | |
Farzadfar F, Finucane MM, Danaei G, et al; Global Burden of Metabolic Risk Factors of Chronic Diseases Collaborating Group (Cholesterol). National, regional, and global trends in serum total cholesterol since 1980: systematic analysis of health examination surveys and epidemiological studies with 321 country-years and 3.0 million participants. Lancet. 2011;377(9765):578–586. | |
Yusuf S, Hawken S, ôunpuu S, et al; INTERHEART Study Investigators. Effect of potentially modifiable risk factors associated with myocardial infarction in 52 countries (the INTERHEART study): case-control study. Lancet. 2004;364(9438):937–952. | |
Ueshima H, Sekikawa A, Miura K, et al. Cardiovascular disease and risk factors in Asia: a selected review. Circulation. 2008;118(25):2702–2709. | |
British Cardiac Society; British Hypertension Society; Diabetes UK; HEART UK; Primary Care Cardiovascular Society; Stroke Association. JBS 2: Joint British Societies’ guidelines on prevention of cardiovascular disease in clinical practice. Heart. 2005;91(Suppl 5):v1–v52. | |
Gill PS, Kai J, Bhopal RS, Wild S. Health Care Needs Assessment: Black and Minority Ethnic Groups. In: Abingdon RJ, editor. Health Care Needs Assessment. The Epidemiologically Based Needs Assessment Reviews. Abingdon: Radcliffe Medical Press Ltd; 2007. | |
Chaturvedi N. Ethnic differences in cardiovascular disease. Heart. 2003;89(6):681–686. | |
McKeigue PM, Shah B, Marmot MG. Relation of central obesity and insulin resistance with high diabetes prevalence and cardiovascular risk in South Asians. Lancet. 1991;337(8738):382–386. | |
Mosca L, Barrett-Connor E, Wenger NK. Sex/gender differences in cardiovascular disease prevention: what a difference a decade makes. Circulation. 2011;124(19):2145–2154. | |
Cappuccio FP, Cook DG, Atkinson RW, Strazzullo P. Prevalence, detection, and management of cardiovascular risk factors in different ethnic groups in south London. Heart. 1997;78(6):555–563. | |
Bhopal R, Fischbacher C, Vartiainen E, Unwin N, White M, Alberti G. Predicted and observed cardiovascular disease in South Asians: application of FINRISK, Framingham and SCORE models to Newcastle Heart Project data. J Public Health (Oxf). 2005;27(1):93–100. | |
The Information Centre. Health Survey for England 2004. The Health of Minority Ethnic Groups: Volume 1 Leeds: The Information Centre; 2006. Available from: http://www.hscic.gov.uk/catalogue/PUB01170. Accessed January 21, 2014. | |
Hippisley-Cox J, Coupland C, Vinogradova Y, et al. Predicting cardiovascular risk in England and Wales: prospective derivation and validation of QRISK2. BMJ. 2008;336(7659):1475–1482. | |
Goh LGH, Dhaliwal SS, Lee AH, Bertolatti D, Della PR. Utility of established cardiovascular disease risk score models for the 10-year prediction of disease outcomes in women. Expert Rev Cardiovasc Ther. 2013;11(4):425–435. | |
Australian Risk Factor Prevalence Study Management Committee. Survey No. 3 1989. Canberra: National Heart Foundation of Australia and Australia Institute of Health; 1990. | |
Boyle CA, Dobson AJ, Egger G, Benault SA. Waist-to-hip ratios in Australia: A different picture of obesity. Australian Journal of Nutrition and Dietetics. 1993;50:57–64. | |
Alexander H, Dugdale A. Which waist-hip ratio? Med J Aust. 1990;153(6):367–368. | |
Anderson KM, Odell PM, Wilson PW, Kannel WB. Cardiovascular disease risk profiles. Am Heart J. 1991;121(1 Part 2):293–298. | |
Conroy RM, Pyörälä K, Fitzgerald AP, et al. SCORE project group. Estimation of ten-year risk of fatal cardiovascular disease in Europe: The SCORE project. Eur Heart J. 2003;24(11):987–1003. | |
D’Agostino RB, Vasan RS, Pencina MJ, et al. General cardiovascular risk profile for use in primary care – The Framingham Heart Study. Circulation. 2008;117(6):743–753. | |
Sans S, Kesteloot H, Kromhout D. The burden of cardiovascular diseases mortality in Europe: Task Force of the European Society of Cardiology on Cardiovascular Mortality and Morbidity Statistics in Europe. Eur Heart J. 1997;18(8):1231–1248. | |
Dawber TR, Moore FE, Mann GV. Coronary Heart Disease in the Framingham Study. Am J Public Health Nations Health. 1957; 47(4 Pt 2):4–24. | |
Kannel WB, Dawber TR, McNamara PM, Cohen ME. Vascular Disease of the Brain – Epidemiologic Aspects: The Framingham Study. Am J Public Health Nations Health. 1965;55(9):1355–1366. | |
Neuhauser HK, Ellert U, Kurth BM. A comparison of Framingham and SCORE-based cardiovascular risk estimates in participants of the German National Health Interview and Examination Survey 1998. Eur J Cardiovasc Prev Rehabil. 2005;12(5):442–450. | |
Alberti KG, Eckel RH, Grundy SM, et al. International Diabetes Federation Task Force on Epidemiology and Prevention; National Heart, Lung, and Blood Institute; American Heart Association; World Heart Federation; International Atherosclerosis Society; International Association for the Study of Obesity. Harmonizing the metabolic syndrome: a joint interim statement of the International Diabetes Federation Task Force on Epidemiology and Prevention; National Heart, Lung, and Blood Institute; American Heart Association; World Heart Federation; International Atherosclerosis Society; and International Association for the Study of Obesity. Circulation. 2009;120(16):1640–1645. | |
Grundy SM, Cleeman JI, Daniels SR, et al; American Heart Association; National Heart, Lung, and Blood Institute. Diagnosis and management of the metabolic syndrome: an American Heart Association/National Heart, Lung, and Blood Institute Scientific Statement. Circulation. 2005;112(17):2735–2752. | |
World Health Organization. Obesity: Preventing and Managing the Global Epidemic: Report on a WHO Consultation (WHO Technical Report Series 894). Geneva: World Health Organization; 2000. Available from: http://www.who.int/nutrition/publications/obesity/WHO_TRS_894/en/. Accessed December 24, 2013. | |
Hara K, Matsushita Y, Horikoshi M, et al. A Proposal for the Cutoff Point of Waist Circumference for the Diagnosis of Metabolic Syndrome in the Japanese Population. Diabetes Care. 2006;29(5):1123–1124. | |
The Examination Committee of Criteria for ‘Obesity Disease’ in Japan; Japan Society for the Study of Obesity. New Criteria for ‘Obesity Disease’ in Japan. Circ J. 2002;66(11):987–992. | |
National Vascular Disease Prevention Alliance. Guidelines for the Management of Absolute Cardiovascular Disease Risk 2012. Available from: http://www.kidney.org.au/LinkClick.aspx?fileticket=A%252BRjUoFXdMg%253D&tabid=635&mid=1584. Accessed October 9, 2012. | |
Abbott RD, Behrens GR, Sharp DS, et al. Body mass index and thromboembolic stroke in nonsmoking men in older middle age. The Honolulu Heart Program. Stroke. 1994;25(12):2370–2376. | |
World Heath Organization. Obesity: preventing and managing the global epidemic: Report of a WHO consultation on obesity. Geneva; 1998. | |
Welborn TA, Dhaliwal SS. Preferred clinical measures of central obesity for predicting mortality. Eur J Clin Nutr. 2007;61(12):1373–1379. | |
Ho SY, Lam TH, Janus ED; Hong Kong Cardiovascular Risk Factor Prevalence Study Steering Committee. Waist to stature ratio is more strongly associated with cardiovascular risk factors than other simple anthropometric indices. Ann Epidemiol. 2003;13(10):683–691. | |
Browning LM, Hsieh SD, Ashwell M. A systematic review of waist-to-height ratio as a screening tool for the prediction of cardiovascular disease and diabetes: 0·5 could be a suitable global boundary value. Nutr Res Rev. 2010;23(2):247–269. | |
Australian Institute of Health and Welfare 2012. Australia’s Health 2012. Australia’s health series no 13. Cat no AUS156. Canberra: AIHW; 2012. | |
AIHW 2011. Cardiovascular Disease: Australian Facts 2011. Cardiovascular disease series no 35. Cat No CVD 53. Canberra: AIHW. Available from: http://www.aihw.gov.au/publication-detail/?id=10737418510. Accessed December 24, 2013. | |
Australian Bureau of Statistics. 4364.0.55.001 – Australian Health Survey: First Results, 2011–12. Available from: http://www.abs.gov.au/AUSSTATS/[email protected]/DetailsPage/4364.0.55.0012011-12?OpenDocument. Accessed June 17, 2013. | |
Australian Bureau of Statistics. 4364.0.55.003 – Australian Health Survey: Updated Results, 2011–2012. Available from: http://www.abs.gov.au/AUSSTATS/[email protected]/DetailsPage/4364.0.55.0032011-2012?OpenDocument. Accessed June 17, 2013. | |
Australian Bureau of Statistics. 4364.0 – National Health Survey: Summary of Results, 2007–2008 (Reissue). Available from: http://www.abs.gov.au/AUSSTATS/[email protected]/DetailsPage/4364.02007-2008%20(Reissue)?OpenDocument. Accessed June 17, 2013. | |
Australian Bureau of Statistics. 4364.0 – National Health Survey: Summary of Results. Canberra: ABS; 2006. Available from: http://www.abs.gov.au/AUSSTATS/[email protected]/DetailsPage/4364.02004-05? OpenDocument. Accessed January 21, 2014. | |
Kumar BN, Selmer R, Lindman AS, Tverdal A, Falster K, Meyer HE. Ethnic differences in SCORE cardiovascular risk in Oslo, Norway. Eur J Cardiovasc Prev Rehabil. 2009;16(2):229–234. | |
Rabanal KS, Lindman AS, Selmer RM, Aamodt G. Ethnic differences in risk factors and total risk of cardiovascular disease based on the Norwegian CONOR study. Eur J Prev Cardiol. 2013;20(6):1013–1021. | |
Cappuccio FP, Oakeshott P, Strazzullo P, Kerry SM. Application of Framingham risk estimates to ethnic minorities in United Kingdom and implications for primary prevention of heart disease in general practice: cross sectional population based study. BMJ. 2002;325(7375):1271. | |
Kooner J, Chambers JC. Conceptualising the causes of coronary heart disease in South Asians. In: Patel KCR, Bhopal RS, editors. The Epidemic of Coronary Heart Disease in South Asian Populations: Causes and Consequences. Birmingham: South Asian Health Foundation; 2004. | |
Allan GM, Nouri F, Korownyk C, Kolber MR, Vandermeer B, McCormack J. Agreement among Cardiovascular Disease Risk Calculators. Circulation. 2013;127(9):1948–1956. | |
Brindle P, May M, Gill P, et al. Primary prevention of cardiovascular disease: a web-based risk score for seven British black and minority ethnic groups. Heart. 2006;92(11):1595–1602. | |
Redberg RF, Benjamin EJ, Bittner V, et al; American Academy of Family Physicians; American Association of Cardiovascular and Pulmonary Rehabilitation; Preventive Cardiovascular Nurses Association. ACCF/AHA 2009 performance measures for primary prevention of cardiovascular disease in adults: a report of the American College of Cardiology Foundation/American Heart Association Task Force on Performance Measures (Writing Committee to Develop Performance Measures for Primary Prevention of Cardiovascular Disease) developed in collaboration with the American Academy of Family Physicians; American Association of Cardiovascular and Pulmonary Rehabilitation; and Preventive Cardiovascular Nurses Association: nndorsed by the American College of Preventive Medicine, American College of Sports Medicine, and Society for Women’s Health Research. J Am Coll Cardiol. 2009;54(14):1364–1405. | |
Lear SA, Humphries KH, Kohli S, Chockalingam A, Frohlich JJ, Birmingham CL. Visceral adipose tissue accumulation differs according to ethnic background: results of the Multicultural Community Health Assessment Trial (M-CHAT). Am J Clin Nutr. 2007;86(2):353–359. | |
Arambepola C, Fernando D, Ekanayake R. A simple valid tool for measuring obesity-related-CHD risk in Sri Lankan adults. Prevention and Control. 2008;3(1):11–19. | |
Wang Z, Hoy WE. Waist circumference, body mass index, hip circumference and waist-to-hip ratio as predictors of cardiovascular disease in Aboriginal people. Eur J Clin Nutr. 2004;58(6):888–893. | |
Dalton M, Cameron AJ, Zimmet PZ, et al; AusDiab Steering Committee. Waist circumference, waist-hip ratio and body mass index and their correlation with cardiovascular disease risk factors in Australian adults. J Intern Med. 2003;254(6):555–563. | |
Yusuf S, Hawken S, ôunpuu S, et al; INTERHEART Study Investigators. Obesity and the risk of myocardial infarction in 27,000 participants from 52 countries: a case-control study. Lancet. 2005;366(9497):1640–1649. | |
Dhaliwal SS, Welborn TA. Measurement error and ethnic comparisons of measures of abdominal obesity. Prev Med. 2009;49(2–3):148–152. | |
Ashwell M, Gunn P, Gibson S. Waist-to-height ratio is a better screening tool than waist circumference and BMI for adult cardiometabolic risk factors: systematic review and meta-analysis. Obes Rev. 2012;13(3):275–286. | |
National Cholesterol Education Program (NCEP) Expert Panel on Detection, Evaluation, and Treatment of High Blood Cholesterol in Adults (Adults Treatment Panel III). Third Report of the National Cholesterol Education Program (NCEP) Expert Panel on Detection, Evaluation, and Treatment of High Blood Cholesterol in Adults (Adult Treatment Panel III) final report. Circulation. 2002;106(25):3143–3421. | |
D’Agostino RB Sr, Grundy S, Sullivan LM, Wilson P; CHD Risk Prediction Group. Validation of the Framingham coronary heart disease prediction scores – Results of a multiple ethnic groups investigation. JAMA. 2001;286(2):180–187. | |
Palaniappan LP, Araneta MRG, Assimes TL, et al; American Heart Association Council on Epidemiology and Prevention; American Heart Association Council on Peripheral Vascular Disease; American Heart Association Council on Nutrition, Physical Activity, and Metabolism; American Heart Association Council on Clinical Cardiology; American Heart Association Council on Crdiovascular Nursing; Council on Cardiovascular Nursing. Call to Action: Cardiovascular Disease in Asian Americans: A Science Advisory From the American Heart Association. Circulation. 2010;122(12):1242–1252. |
 © 2014 The Author(s). This work is published and licensed by Dove Medical Press Limited. The full terms of this license are available at https://www.dovepress.com/terms.php and incorporate the Creative Commons Attribution - Non Commercial (unported, v3.0) License.
By accessing the work you hereby accept the Terms. Non-commercial uses of the work are permitted without any further permission from Dove Medical Press Limited, provided the work is properly attributed. For permission for commercial use of this work, please see paragraphs 4.2 and 5 of our Terms.
© 2014 The Author(s). This work is published and licensed by Dove Medical Press Limited. The full terms of this license are available at https://www.dovepress.com/terms.php and incorporate the Creative Commons Attribution - Non Commercial (unported, v3.0) License.
By accessing the work you hereby accept the Terms. Non-commercial uses of the work are permitted without any further permission from Dove Medical Press Limited, provided the work is properly attributed. For permission for commercial use of this work, please see paragraphs 4.2 and 5 of our Terms.