")
Back to Journals » HIV/AIDS - Research and Palliative Care » Volume 16
An Assessment of Trends in HIV-1 Prevalence and Incidence and Spatio-Temporal Analyses of HIV-1 Recent Infection Among MSM During the Surveillance Period Between 2018 and 2022 in Sichuan, China
Authors Yang H , Chen M, Hu Y, Xu M, Li Y , Liu L, Yuan D , Yuan F, Li L, Ye L, Zhou C, Zhang Y, Liang S, Su L
Received 17 November 2023
Accepted for publication 24 February 2024
Published 6 March 2024 Volume 2024:16 Pages 83—93
DOI https://doi.org/10.2147/HIV.S448096
Checked for plagiarism Yes
Review by Single anonymous peer review
Peer reviewer comments 3
Editor who approved publication: Prof. Dr. Olubunmi Akindele Ogunrin
Hong Yang,1 Maogang Chen,2 Ying Hu,1 Mengjiao Xu,1 Yiping Li,1 Lunhao Liu,1 Dan Yuan,1 Fengshun Yuan,1 Ling Li,1 Li Ye,1 Chang Zhou,1 Yan Zhang,1 Shu Liang,1 Ling Su1
1Department of AIDS/STD Control and Prevention, Sichuan Center for Disease Control and Prevention, Chengdu, People’s Republic of China; 2Department of Microbiology, Liangshan Yi Autonomous Prefecture Center for Disease Control and Prevention, Xichang, People’s Republic of China
Correspondence: Shu Liang; Ling Su, Email [email protected]; [email protected]
Background: Men who have sex with men (MSM) is one main type of high-risk activities facilitating HIV-1 transmission in Sichuan province. Previous works on HIV-1 incidence and prevalence among MSM only concentrated before 2018, the situation after that is unknown. In addition, the distribution of hot-spots related to current HIV-1 epidemic is also rarely known among MSM in Sichuan.
Objective: To update trends of HIV-1 prevalence and incidence and to visualize hot-spots of ongoing transmission in Sichuan province during surveillance period among MSM between 2018 and 2022.
Methods: Limiting Antigen Avidity assay was performed to detect recent infection within new HIV-1 diagnoses founded during surveillance period among MSM. The HIV-1 prevalence and incidence were calculated according to an extrapolation method proposed by publications and guidelines. Trend tests were performed using χ2 tests with linear-by-linear association. The spatial analysis was conducted with ArcGIS 10.7 to figure hot-spots of HIV-1 recent infections among MSM.
Results: Between 2018 and 2022, 16,697 individuals participated in HIV-1 MSM sentinel surveillance program, of which 449 samples (98.25%) were tested with LAg-Avidity EIA, and 230 samples were classified as recent infection. Respectively, the overall prevalence and incidence were 2.74% and 3.69% (95% CI: 3.21, 4.16) and both had significant declining trends (p < 0.001). Luzhou city had a highest HIV-1 incidence (10.74%, 95% CI: 8.39, 13.10) over the study period and was recognized as a hot-spot for recent HIV-1 infection among MSM.
Conclusion: During the surveillance period, both HIV-1 prevalence and incidence were declining. However, Luzhou city had an unusually high HIV-1 incidence and became an emerging hot-spot of recent HIV-1 infection among MSM. This finding suggested focused attention, cross-regional intervention strategies, and prevention programs are urgently required to curb the spread of ongoing transmission.
Keywords: human immunodeficiency virus type 1, HIV-1 recent infection, incidence, hot-spots, men who have sex with men
Introduction
Since the first AIDS case in China was reported in 1985,1 China had struggled against HIV over the last four decades. Currently, new epidemic trends have emerged in China and some new HIV/AIDS “hot-spots” appeared, such as Sichuan Province.2 Sichuan is a populous province in the southwest of mainland China and the most developed one in Southwest China (including Sichuan, Yunnan, Guizhou, Tibet and Chongqing province).3,4 The number of people living with HIV-1 in Sichuan increased from 13 thousands to 17 thousands between 2018 and 2020, ranked first in China.5 The number of newly diagnoses HIV-1 cases attributable to homosexual contact gradually increased, representing 5.86% of all cases at 2018 to 10.8% at 2020, in Sichuan unpublished data.
Men who have sex with men is one main type of high-risk activities facilitating HIV-1 transmission both in China and Sichuan.6 The prevalence of HIV-1 among Chinese MSM has substantially increased from 1.4% in 2005 to 6.9% in 2018.7,8 In Sichuan, Chengdu city, HIV-1 prevalence progressively increased from 0.6% in 2003 to 14.4% in 2015 among MSM.9,10 People who got HIV-1 infection usually have no particular symptoms and no awareness of their infection, and once diagnosed, they may have been infected for years. Antiretroviral therapy (ART) can extend the life of people living with HIV-1 by durable and maximal suppression of plasma viremia.11 Accordingly, the prevalence data reflect the cumulative effect of HIV-1 infection in the population, which may have a time-lag effect and do not accurately reflect the features of transmission currently occurring.12 Instead, HIV-1 incidence, defined as a rate which new HIV-1 infection is acquired in a population within a year, is a quantitative index that measures the extent of ongoing HIV-1 transmission in the population.13 However, HIV-1 incidence among MSM both in Sichuan and China, were also particularly high. Previous works reported persistently high HIV-1 incidence among MSM in Sichuan province (5.16%, 95% CI: 4.65–5.66%) between 2011 and 2015, which was slightly higher than the national level (5.0%, 95% CI: 4.1–5.8%).10,14 However, data in the most recent years are scarce.
Use of spatial analysis has become progressively common in HIV-1 study, focusing on epidemiological trends and spatial distribution,5,6,15 the identification of geographic variation of infection,16 as well as exploration of spatial relationships between HIV-1 and social covariates.17 However, there exists a gap of work conducted on geospatial analysis to determine hot-spots of recent HIV-1 infection among MSM, while recent study focused on new diagnosed HIV-1 cases.12,18
Thus, there is an urgent need to visualize the hot-spots areas of ongoing HIV-1 transmission and to update the trends of HIV-1 prevalence and incidence in Sichuan province during surveillance period among MSM after 2015. Both could provide technical guidance on better understanding of HIV/AIDS epidemics and conducting better HIV prevention interventions. So, we conducted a spatial analysis of recent HIV-1 infection cases among MSM sentinel surveillance between 2018 and 2022 in Sichuan province.
Methods
Sample Collection
According to the Operation Manual,19 10 sentinel sites (Figure 1) were established for regular surveillance among MSM in Sichuan Province between 2018 and 2022. Men whose age were between 18 and 65 and had insertional oral or anal sex in the past 12 months were recruited through snowball sampling (Snowball sampling is where research participants recruit other participants for a test or study. It is used where potential participants are hard to find20–22) at various sites, including the internet, bathing room, sauna, pub and park, etc. Sentinel surveillance, which is a cross-sectional survey, was conducted annually between 2018 and 2022, and the surveillance period was from April to June. Sample sizes were as following: Chengdu, Dazhou, Deyang, Luzhou, Mianyang and Yibin were all 400 per site; Guangyuan, Leshan, Liangshan and Zigong were all 200 per site. If the sample size was insufficient at the end of the surveillance period, it can be extended for one month. An anonymous interview was dispensed to every participant for collection of information on demographic features and HIV-1 transmission-related risk behaviors and each participant provided 2–3 mL of whole blood in local Center for Disease. Plasma was separated from whole blood and then used for HIV-1 testing. The study was approved by the Ethics Committee of the Sichuan Center for Disease Control and Prevention and conducted following the Helsinki Declaration of 1964.
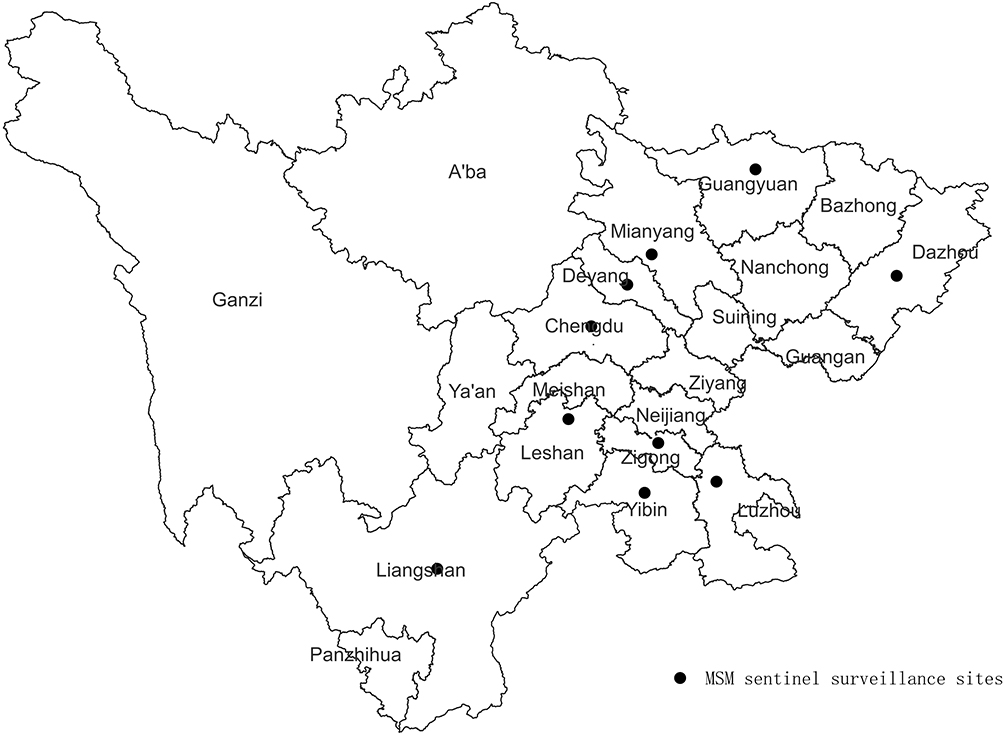 |
Figure 1 Distribution of MSM sentinel surveillance sites (n=10) in Sichuan, 2018–2022.Map created by ArcGIS 10.7 software (ESRI Inc., Redlands.CA.USA). |
Laboratory Testing
Plasma samples were first screened by an enzyme immunoassay twice and confirmed by a Western blot assay (HIV-1 BLOT 2.2, MP Diagnostics, Singapore). Excluded previously reported HIV-1-seropositive cases, blood samples confirmed by Western blot assay were tested for evidence of recent infection by the Sichuan CDC laboratory using the LAg-Avidity assay from the Maxim Biomedical, Inc, Rockville, USA.23 The tests were performed entirely in accordance with the manufacturers’ instruction manuals. A normalized optical density (ODn) of <1.5 was considered to represent recent infection. All HIV-1 tests were informed and voluntary. Written consents were obtained from all participants.
Calculation of Prevalence and Incidence
The HIV-1 prevalence is the proportion currently living with HIV-1 infection.13,24 The prevalence can be estimated by p=yi/n, where yi is the total number of all cases testing positive for HIV-1 and n is the total number of people who were tested.21
HIV-1 incidence is the rate at which HIV-1 infection is acquired in a population.13 It is a quantitative index that measures the extent of ongoing HIV-1 transmission in the population.13 For a reliable comparability of incidence between this work and previous work, we continued to use the same McDougal formula10,25–27 for calculation of incidence. The only difference existed in the window period (the mean length of time individuals remains classified as “recently infected”). Previous work used BED-CEIA to test for evidence of recent infection, and in China, the window period was 168 days.10,25 Our work used Limiting Antigen Avidity assay to test and in China, the window period was 130 days.19
According to the Operations Manual,25 when the number of recent infections identified by LAg-Avidity EIA is more than 10, the estimated incidence is reliable. In most of cities, the number of recent infections for each year was less than 10, a solution was to combine the data of five years to calculate the incidence. For province level, the incidences for each year were calculated.
In this work, we calculated the incidence as a rate, due to the fact that the sentinel surveillance was a cross-sectional survey and was conducted annually between 2018 and 2022 (the surveillance period was from April to June).
Spatial Analysis for HIV-1 Recent Infections
The spatial analysis was conducted with ArcGIS 10.7 (ESRI, Redlands, CA, USA) to visualize hot-spots and to create map of distribution of MSM sentinel surveillance sites in Sichuan. Local spatial auto-correlation was used to analyze the correlation between the distribution of HIV recent cases in a specific city and that in adjacent cities. The Getis-Ord Gi* statistic was used to calculate the z-scores and P-values; local clusters with a z-value >1.86 were defined as a hot-spot, meaning the distribution in those counties was high clustering.
Statistical Analysis
Data analysis was conducted in SPSS version 23.0 (IBM, Armonk, New York, USA). Trend tests were performed using χ2 tests with linear-by-linear association. All tests were two-tailed and a p value <0.05 was considered statistically significant.
Results
Overall Prevalence and Incidence Rates in MSM
Between 2018 and 2022, a total of 16,697 individuals participated in HIV-1 MSM sentinel surveillance program. Except for 608 previous reported cases and 19 participants who refused blood collection, 457 newly reported HIV-1 positive infections were confirmed with Western blot assay. Except 8 samples whose volumes were not enough for LAg-Avidity EIA, a total of 449 samples (98.25%) were tested with LAg-Avidity EIA, among which 230 samples were identified as HIV-1 recent infection. Based on these, the prevalence was 2.74% and incidence was 3.69% (95% CI: 3.21, 4.16) obtained for MSM (Table 1).
 |
Table 1 HIV-1 Prevalence and Incidence Year by Year from 10 MSM Sentinel Surveillance Sites |
HIV-1 MSM Prevalence Between 2018–2022
During the study period, the overall prevalence of new HIV-1 diagnosis in Sichuan province decreased from 7.63% in 2018 to 1.51% in 2022. The highest prevalence appeared in 2018 and showed a significant decreasing trend for 2018–2022 (trend test, χ2=24.031, p < 0.001) (Table 1 and Figure 2).
 |
Figure 2 The trends of HIV-1 prevalence and incidence during the surveillance period between 2018 and 2022 among men who have sex with men in Sichuan, China. |
At a city level, there was a significant difference among cities (χ2=95.934, P < 0.0001). Chengdu and Luzhou was found with highest HIV-1 prevalence (4.26% vs 4.25%), and Deyang, Liangshan, Yibin was at a medium level with HIV-1 prevalence between 2.55% and 2.81%. The relatively lower HIV-1 prevalence appeared in Dazhou, Guangyuan, Leshan and Zigong between 0.11% and 1.65% (Table 2).
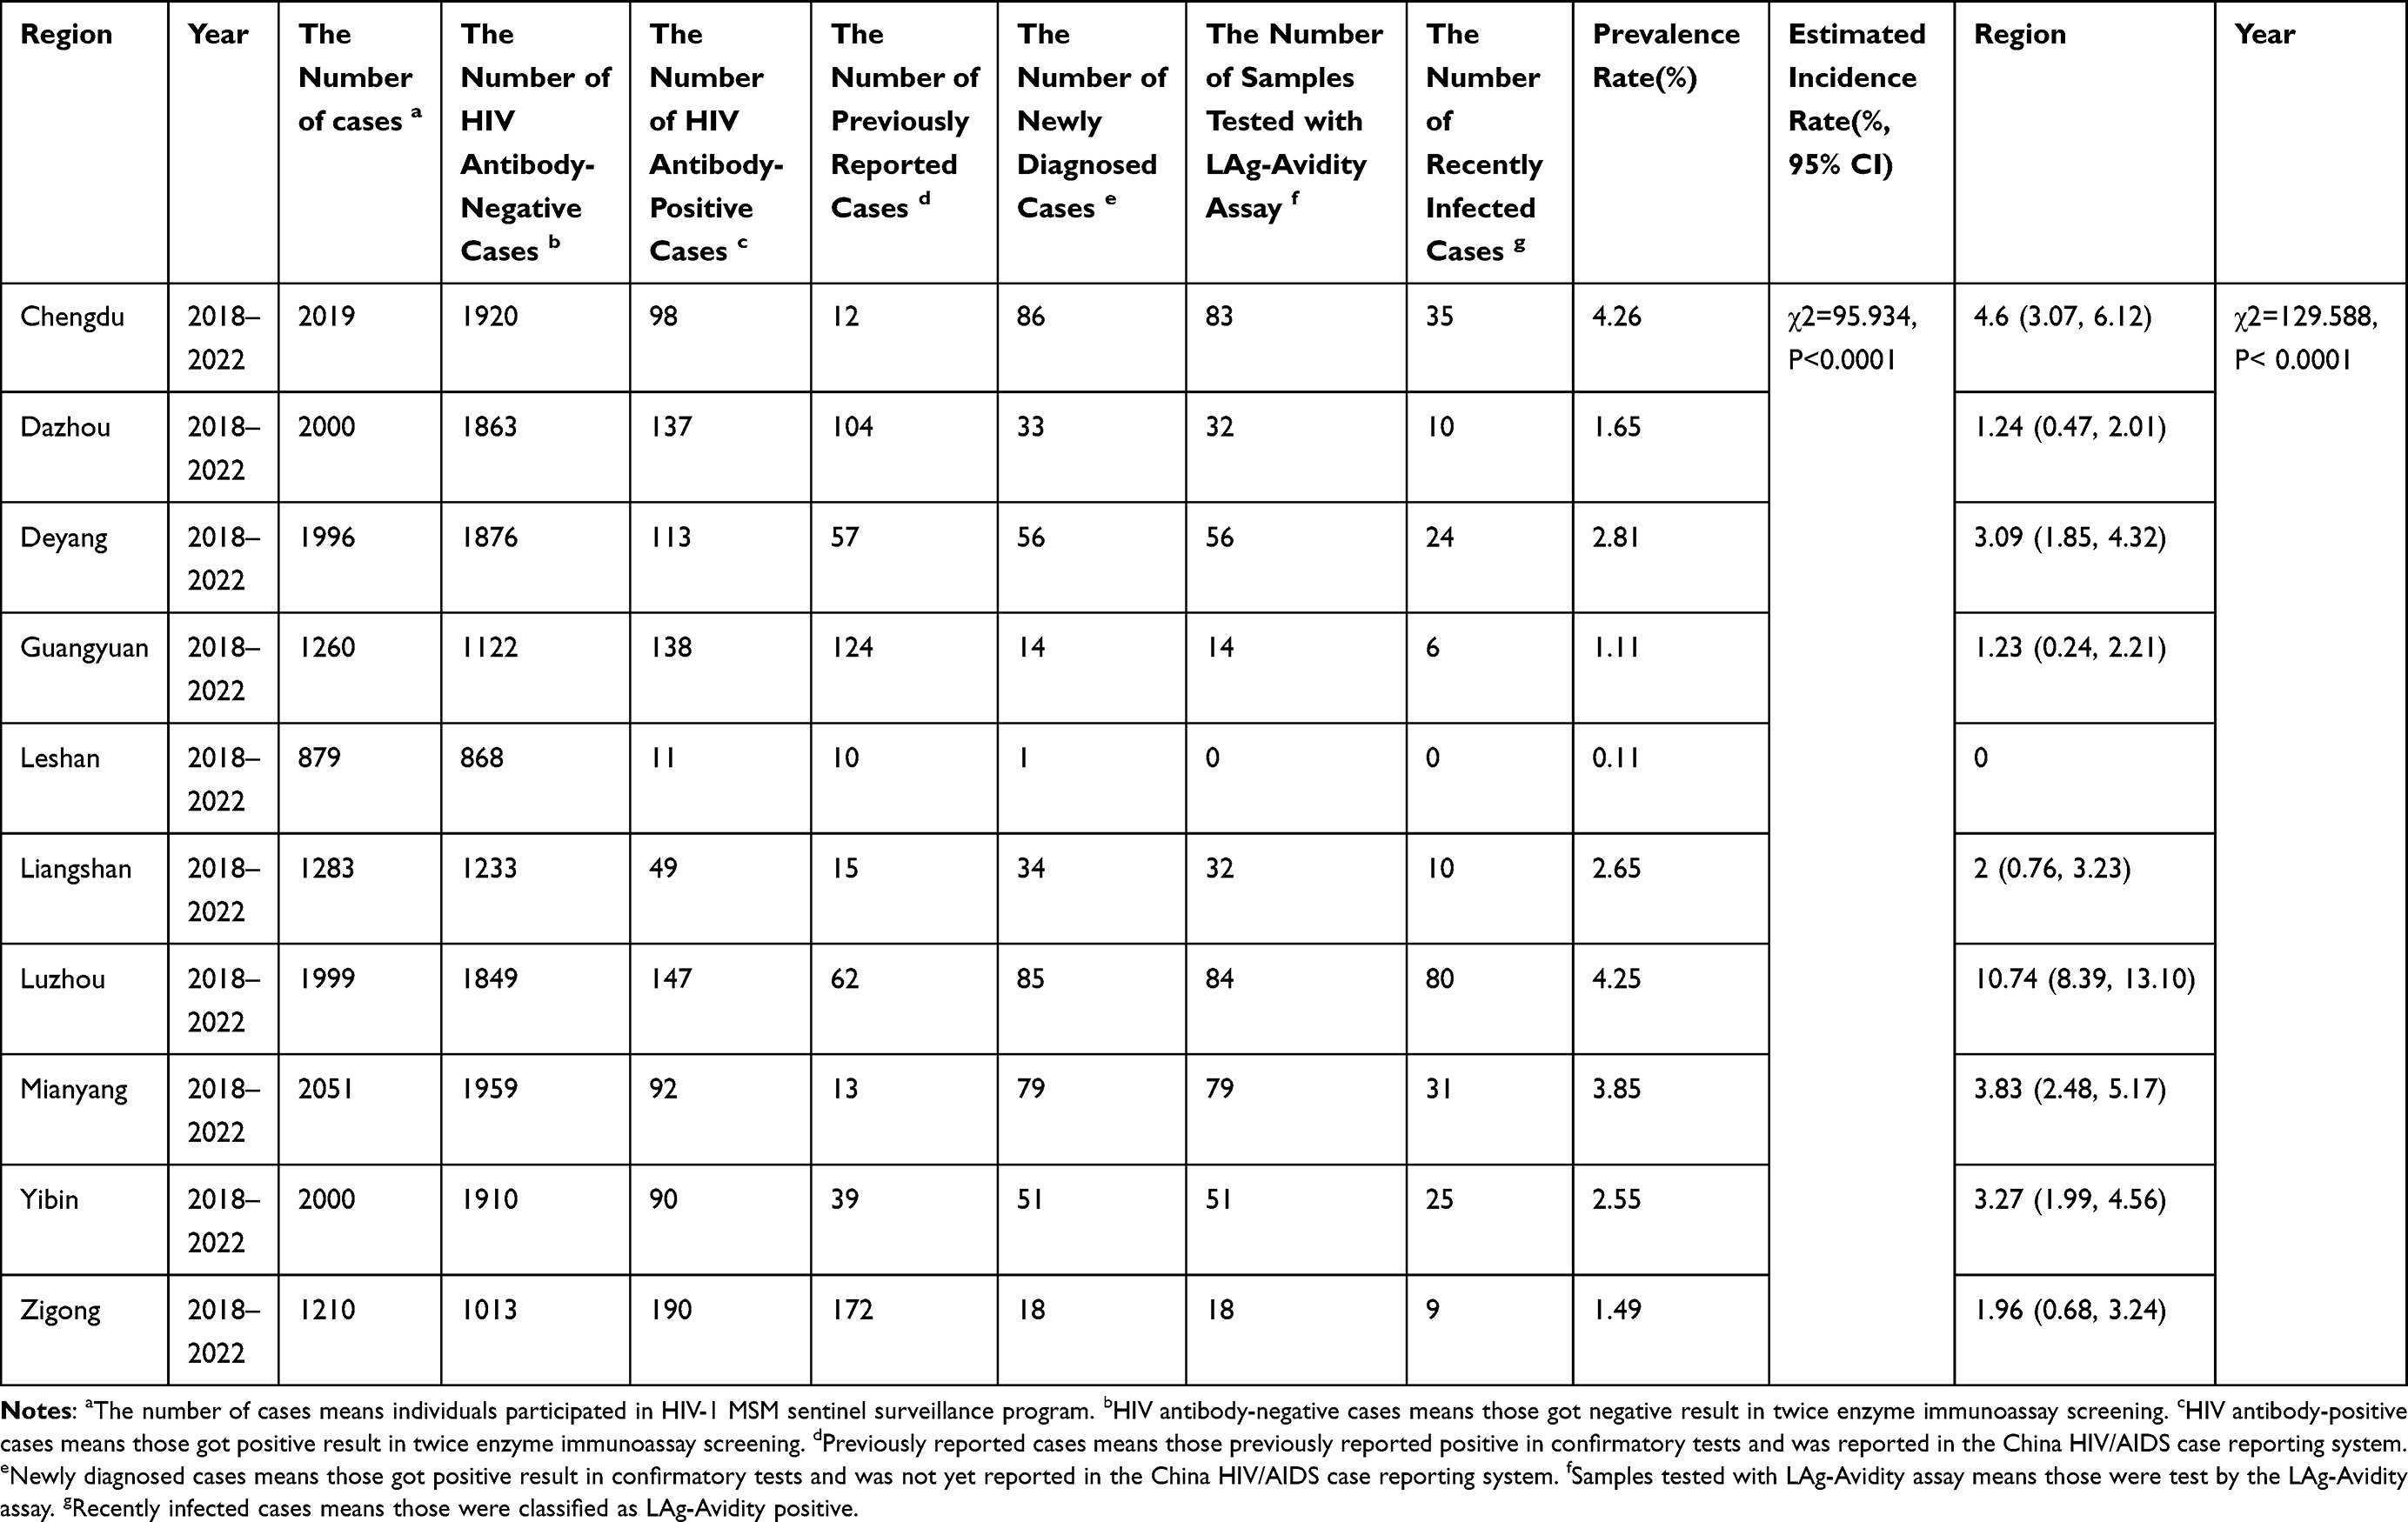 |
Table 2 HIV-1 Prevalence and Incidence from Different MSM Sentinel Surveillance Sites |
HIV-1 MSM Incidence Between 2018–2022
During the study period, the estimated HIV-1 incidence in Sichuan province remained stable at a relatively high level from 3.96% (95% CI: 2.95–4.98) in 2018 to 2.37% (95% CI: 1.54–3.21) in 2022. The highest estimated HIV-1 incidence appeared in 2020 (4.42%, 95% CI: 3.30, 5.53). Also, there was a significant decreasing trend for 2018–2022 (trend test, χ2=29.225, p < 0.001) (Table 1 and Figure 2).
At a city level, there was a significant difference among cities (χ2=129.588, P < 0.0001). Luzhou was definitely found with highest estimated HIV-1 incidence (10.74%, 95% CI: 8.39, 13.10). The next was Chengdu, with 4.60% (95% CI 3.07, 6.12) of the estimated HIV-1 incidence. Deyang, Mianyang and Yibin shared a third level of estimated HIV-1 incidence, from 3.09% (95% CI 1.85, 4.32) to 3.83% (95% CI 2.48, 5.17). Others (Dazhou, Guangyuan, Liangshan, Leshan and Zigong) remained with a relatively lower estimated HIV-1 incidence (Table 2).
Spatial Analysis
Local spatial correlation was applied to the year-wise distribution of hot-spots at city levels throughout Sichuan province (Figure 3). Hot-spots were mainly located in Luzhou city (Figure 3A–E) and occasionally emerged in Chengdu (Figure 3C). Luzhou city had been the hot-spot every year among MSM between 2018 and 2022. In 2020, Chengdu was another hot-spot beside Luzhou.
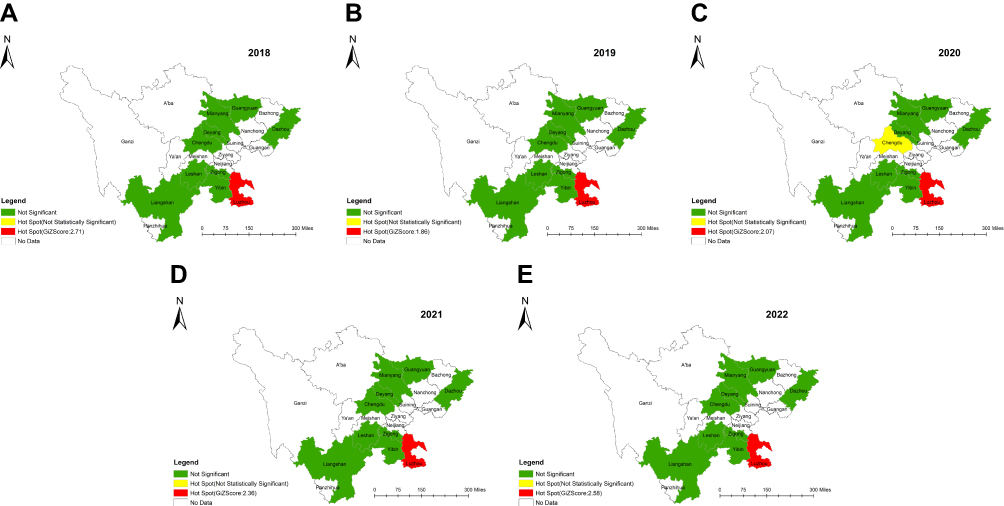 |
Figure 3 Hot-spots of HIV-1 recent cases at city level by year among MSM between 2018 and 2022. (A) Sichuan province, 2018. (B) Sichuan province, 2019. (C) Sichuan province, 2020. (D) Sichuan province, 2021. (E) Sichuan province, 2022. |
Discussion
To our knowledge, the work first reported a joint application of LAg-Avidity EIA and the spatial analysis to illustrate hot-spots in sentinel surveillance in China five years in a row, which will trigger intensive focus of intervention efforts on relevant areas. Furthermore, we first updated trends of HIV-1 prevalence and incidence among MSM during the surveillance period between 2018 and 2022 in Sichuan, which is a continuation and confirmed a supposition of our previous work.10
Overall, the total prevalence and incidence of five years was 2.74% and 3.69% (95% CI:3.21, 4.16) between 2018 and 2022. Total HIV-1 incidence was estimated to be lower than the national level calculated by meta-analysis.28 Compared to past increasing trend in HIV-1 incidence between 2011 and 2015 among MSM in Sichuan province,10 there was a significant declining trend both in HIV-1 prevalence and estimated incidence (p < 0.001) for 2018–2022. The declines are due in part to progress in diagnosing infections among people living with HIV-1 and ensuring they have access to early, ongoing treatment,29–31 and on the other hand, it is possibly due to the pandemic of SARS-CoV-2. Some studies32,33 suggested a reduction in sexual activity among MSM during that time. But other studies34,35 suggested it may be a temporary reduction. Thus, the consistent, effective HIV-1 prevention strategies should still be taken in relevant areas.
As mentioned in our previous work,10 there was a distinct possibility of a HIV-1 epidemic spread from core city (like Chengdu) to peripheral region among MSM. And this work has confirmed the supposition. Spatial analysis (Figure 3A–E) demonstrated significant clustering in Luzhou city as a hot-spot of recent HIV-1 infection cases for five years with highest estimated HIV-1 incidence, instead of Chengdu. Luzhou, located in southeastern Sichuan Province, is a regional center in the combined region of Sichuan, Yunnan, Guizhou, and Chongqing.36 According to Tobler’s First Law of Geography,37 HIV-1 burden should be similar among neighboring districts than among non-neighbors.15 Surrounded by other high HIV-1 burden provinces28,38,39 may be one reason for its highest estimated HIV-1 incidence. According to Yuan’s report,40 Luzhou did not find strong HIV-1 transmission link with other cities within Sichuan. In these contexts, we supposed Luzhou’s HIV/AIDS epidemics might be more related to neighboring provinces. Therefore, more cross-regional work should be launched from now on, concentrating on the identification of transmission networks of new infection, demographic characteristics and spatial distribution, as well as exploration of the relationship between molecular transmitted cluster and social covariates. The another possible explanation for high estimated incidence was the policies41,42 expanding screening for HIV-1. Some “hidden” HIV-1/AIDS cases would be detected earlier because of scale-up screening. According to Ren’s study,43 the number of new HIV-1 diagnosed cases showed an increasing trend year by year, which created unique challenges for HIV-1 prevention and treatment, directly leading to potential transmission to others.
Chengdu city, which was once a core HIV-1 hot-spot district among MSM in Sichuan province,10 had became a secondary hot-spot in this work. Although there was a declining trend from 2018 to 2022 in comparison with data reported earlier,10,44 the incidence still remained at a higher level in Chengdu than that in other cities within Sichuan province. The steady decrease in HIV-1 incidence indicated an advance on HIV-1 prevention strategies, but MSM was still a vulnerable group for HIV-1 infection. Chengdu is a labor-importing mega-city. In 2020,45 Chengdu had 20.94 million resident population and 8.46 million migrant workers from outside, while in 2018,46 the data was 16.33 million and 2 million, respectively. In view of the fact, consistent, effective HIV-1 prevention and treatment should adequately reached those who could most benefit from them.
Furthermore, Yibin city, Mianyang and Deyang city found high estimated HIV-1 incidence. The geographical position of them made the choice. Transmission networks with strong links were identified among Deyang and Mianyang.40 So, HIV-1 prevention efforts in those regions may need joint interventions between cities.
The study still has several limitations. First, the result may be biased owing to the limited coverage of MSM sentinel surveillance sites. Sichuan province consists of 21 cities, but our sites were only located 10 cities where MSM is active and easily recruited. So, the results may not be generalized to the whole province without caution. Second, given the nature of a cross-sectional survey, temporality between surveillance period cannot be inferred. For instance, we cannot claim findings of this work representing the whole year. Third, the number of new diagnosed HIV-1 cases among MSM might be affected by the scale-up of HIV-1 antibody testing. In the past five years, HIV-1 testing has expanded greatly in Sichuan, especially in 2018. This expansion could create detection bias, as more cases can be diagnosed because there is more testing done. Fourth, in view of misclassification of the LAg-Avidity EIA, there is a possibility of an overestimate on the incidence. Fifth, due to the stringent SARS-CoV-2 prevention measures, it was not yet clear whether the decline trends of HIV-1 prevalence and incidence were actual or not.
Conclusion
Our work identified Luzhou city who replaced Chengdu city as a new hot-spot of recent HIV-1 infection among MSM had an unusually high HIV-1 incidence compared with other sites. It suggested that focused attention, implementation of cross-regional intervention strategies and prevention programs targeting MSM in this key area are urgently required to control the spread of HIV-1. Moreover, this work updated the trends of HIV-1 prevalence and incidence during the surveillance period between 2018 and 2022 among MSM in Sichuan. Both HIV-1 prevalence and incidences among MSM showed a significant declining trend. However, there is an uncertainty regarding the effect of the SARS-CoV-2 pandemic on the trends of HIV prevalence and incidence. Thus, the consistent, effective HIV-1 prevention strategies should still be taken.
Abbreviations
LAg-Avidity EIA, Limiting Antigen Avidity enzyme immunoassay; HIV-1, Human immunodeficiency virus; Men who have sex with men; CDC, Center for Disease Control and Prevention.
Acknowledgments
We are very grateful to the staff at the local Centers for Disease Control and Prevention for their assistance in coordinating samples collection, serological testing and data acquisition.
Author Contributions
All authors made a significant contribution to the work reported, whether that is in the conception, study design, execution, acquisition of data, analysis and interpretation, or in all these areas; took part in drafting, revising or critically reviewing the article; gave final approval of the version to be published; have agreed on the journal to which the article has been submitted; and agree to be accountable for all aspects of the work.
Funding
This study was supported by grants from the Natural Science Foundation of Sichuan Province (2022NSFSC1547) and Sichuan Science and Technology Program (2019YFS0369).
Disclosure
The authors declare no conflicts of interest for this work.
References
1. Inhua Sun X, Wang N, Dongmin L, et al. The development of HIV/AIDS surveillance in China. AIDS. 2007;21(8):S33–8. doi:10.1097/01.aids.0000304694.54884.06
2. Liu Z, Shi O, Yan Q, et al. Changing epidemiological patterns of HIV and AIDS in China in the post-SARS era identified by the nationwide surveillance system. BMC Infect Dis. 2018;18(1):700. doi:10.1186/s12879-018-3551-5
3. Mao S, Huang T, Yuan H, et al. Epidemiological analysis of 67 local COVID19 clusters in Sichuan Province, China. BMC Public Health. 2020;20:1525. doi:10.1186/s12889-020-09606-4
4. Liu Q, Xinyin X, Fang J, et al. Comparison and analysis of epidemiologic characteristics of stroke in Sichuan Province, China. Front Neurol. 2020;11:877. doi:10.3389/fneur.2020.00877
5. Yang H, Yiping L, Fang H, et al. Demographic characteristics and hot-spot areas of recent infections among new HIV diagnoses in Sichuan, China, between 2018 and 2020. Infect Drug Resist. 2023;16:779–789. doi:10.2147/IDR.S394828
6. Qin Q, Guo W, Tang W, et al. Spatial analysis of the human immunodeficiency virus epidemic among men who have sex with men in China, 2006–2015. Clin Infect Dis. 2017;64(7):956–963. doi:10.1093/cid/cix031
7. UNAIDS. UNAIDS Data 2019; 2019. Available from: https://www.unaids.org/en/resources/documents/2019/2019-UNAIDS-data.2019.
8. Wu Z. 中国防治艾滋病30年主要成就与挑战[Achievement of HIV/AIDS program in the past 30 years and challenges in China]. Zhonghua liuxingbingxue zazhi. 2015;36:1329–1331. Chinese.
9. Wang L, Norris JL, Norris JL, et al. HIV prevalence and influencing factors analysis of sentinel surveillance among men who have sex with men in China, 2003–2011. Chin Med J. 2012;125(11):1857–1861.
10. Yang H, Ye L, Su L. An analysis on incidence of HIV-1 epidemics among men who have sex with men in Sichuan Province during 2011–2015. Zhonghua Yu Fang Yi Xue Za Zhi. 2019;53(3):327–329. doi:10.3760/cma.j.issn.0253-9624.2019.03.018
11. Pau AK, George JM. Antiretroviral therapy: current drugs. Infect Dis Clin North Am. 2014;28(3):371–402. doi:10.1016/j.idc.2014.06.001
12. Zhu Q, JiKe C, Chengdong X, et al. A new strategy to quantitatively identify hot-spot areas in growth of New HIV infections for targeted interventions. Front Public Health. 2021;9:680867. doi:10.3389/fpubh.2021.680867
13. UNAIDS/WHO Working Group on Global HIV/AIDS and STI Surveillance. When and How to Use Assays for Recent Infection to Estimate HIV Incidence at a Population Level. Geneva, Switzerland: World Health Organization Department of HIV/AIDS Avenue Appia 20 1211; 2011. doi:10.3760/cma.j.issn.0253-9624.2019.03.018
14. Feng Y, Bu K, Li M, Zhang X, Jin S, Wang L. Meta-analysis of HIV infection incidence and risk factors among men who have sex with men in China. Zhonghua Liu Xing Bing Xue Za Zhi. 2015;36(7):752–758.
15. Zulu LC, Kalipeni E, Johannes E. Analyzing spatial clustering and the spatiotemporal nature and trends of HIV/AIDS prevalence using GIS: the case of Malawi, 1994–2010. BMC Infect Dis. 2014;14:285. doi:10.1186/1471-2334-14-285
16. Zhang X, Tang W, Yinge LI, et al. HIV/AIDS epidemic among young people in China between 2005 and 2012: results from spatial temporal analysis. HIV Med. 2017;18(3):141–150. doi:10.1111/hiv.12408
17. Wabiri N, Shisana O, Zuma K, Freeman J. Assessing the spatial nonstationarity in relationship between local patterns of HIV infections and the covariates in South Africa: a geographically weighted regression analysis. Spat Spatiotemporal Epidemiol. 2016;16:88–99. doi:10.1016/j.sste.2015.12.003
18. Chen M, Yanling M, Chen H, et al. Demographic characteristics and spatial clusters of recent HIV-1 infections among newly diagnosed HIV-1 cases in Yunnan, China, 2015. BMC Public Health. 2019;19(1):1507. doi:10.1186/s12889-019-7557-8
19. Chinese center for disease control and prevention. The operations manual for HIV-1 recent infections sentinel surveillance issued by Chinese center for disease control and prevention; 2022.
20. Noy C. Sampling knowledge: the hermeneutics of snowball sampling in qualitative research. Int J Soc Res Methodol. 2009;11(4):327–344. doi:10.1080/13645570701401305
21. Browne K. Snowball sampling: using social networks to research non-heterosexual women. Int J Soc Res Methodol. 2005;8(1):47–60. doi:10.1080/1364557032000081663
22. Penrod J, Preston DB, Cain RE, Starks MT. A discussion of chain referral as a method of sampling hard-to-reach populations. J Transcult Nurs off J Transcult Nurs Soc. 2003;14(2):100–107. doi:10.1177/1043659602250614
23. Maxim Biomedical, Inc. Maxim HIV-1 Limiting Antigen Avidity EIA, Single Well Avidity Enzyme Immunoassay for Detection of Recent HIV-1 Infection. Rockville, Maryland USA: Maxim Biomedical, Inc; 2013.
24. UNAIDS/WHO Working Group on Global HIV/AIDS/STI Surveillance. Guidelines for measuring national HIV prevalence in population-based surveys. Geneva: UNAIDS/WHO; 2005. Available from: http://data.unaids.org/pub/manual/2005/20050101_gs_guidemeasuringpopulation_en.pdf.
25. Chinese center for disease control and prevention. The operations manual for estimating hiv-1 incidence using a laboratory assay issued by Chinese center for disease control and prevention; 2011.
26. Yang H, Su L, Ye L, et al. Incidence rates of HIV-1 epidemics among 4 high risk groups in Sichuan province during 2011–2015. Zhonghua Liu Xing Bing Xue Za Zhi. 2017;38(12):1649–1654. doi:10.3760/cma.j.issn.0254-6450.2017.12.014
27. Yang L, Chen M, Yanling M, et al. The changing trends of HIV-1 prevalence and incidence from sentinel surveillance of five sub-populations in Yunnan, China, 2001–2010. BMC Public Health. 2015;15:376. doi:10.1186/s12889-015-1722-5
28. Zhang W, Xu -J-J, Zou H, Zhang J, Wang N, Shang H. HIV incidence and associated risk factors in men who have sex with men in Mainland China: an updated systematic review and meta-analysis. Sex Health. 2016;13:373. doi:10.1071/SH16001
29. Nkambule RN-BH, Mnisi Z, Ao TT, et al. Substantial progress in confronting the HIV epidemic in Swaziland: first evidence of national impact.
30. Nsanzimana S, Nshogoza Rwibasira G, Sewava Malamba S, et al. HIV incidence and prevalence among adults aged 15–64 years in Rwanda: results from the Rwanda population-based HIV impact assessment (RPHIA) and district-level modeling, 2019. Int J Infect Dis. 2022;116:245–254. doi:10.1016/j.ijid.2022.01.032
31. Nkambule R, PhilipID NM, Reid G, et al. HIV incidence, viremia, and the national response in Eswatini: two sequential population-based surveys. PLoS One. 2021;16(12):e0260892. doi:10.1371/journal.pone.0260892
32. Winter BL, Hovaguimian F, Kouyos RD, et al. Changes in mental and sexual health among MSM using HIV pre-exposure prophylaxis during the SARS-CoV-2 pandemic: longitudinal analysis of the SwissPrEPared cohort study. Swiss Med Wkly. 2022;152:w30192. doi:10.4414/smw.2022.w30192
33. Pampati S, Emrick K, Siegler AJ, Jones J. Changes in sexual behavior, PrEP adherence, and access to sexual health services because of the COVID-19 Pandemic Among a Cohort of PrEP-Using MSM in the South. J Acquir Immune Defic Syndr. 2021;87(1):639–643. doi:10.1097/QAI.0000000000002640
34. Sanchez TH, Zlotorzynska M, Rai M, Baral SD. Characterizing the Impact of COVID-19 on men who have sex with men across the United States in April, 2020. AIDS Behav. 2020;24(7):2024–2032. doi:10.1007/s10461-020-02894-2
35. van Bilsen WPH, Zimmermann HML, Boyd A, et al. Sexual behavior and its determinants during COVID-19 restrictions among men who have sex with men in Amsterdam. J Acquir Immune Defic Syndr. 2021;86(3):288–296. doi:10.1097/QAI.0000000000002581
36. Wei LCG, Hang C, Caibi F, Wenhong L. History of high-risk sexual behavior among HIV /AIDS cases involving heterosexual transmission in Luzhou City. Pract Prev Med. 2019;26(01):77–80. doi:10.3969/j.issn.1006-3110.2019.01.018
37. Tobler WR. A computer movie simulating urban growth in the Detroit region. Econ Geogr. 1970;46:234–240. doi:10.2307/143141
38. Yang S, Alice PYC, Lin Q. HIV epidemics in Shenzhen and Chongqing, China. PLoS One. 2018;13(2):e0192849. doi:10.1371/journal.pone.0192849
39. Dong M-J, Peng B, Liu Z-F. The prevalence of HIV among MSM in China: a large-scale systematic analysis. BMC Infect Dis. 2019;19(1):1000. doi:10.1186/s12879-019-4559-1
40. Yuan D, Bin Y, Liang S, et al. HIV-1 genetic transmission networks among people living with HIV/AIDS in Sichuan, China: a genomic and spatial epidemiological analysis. Lancet Reg Health West Pac. 2021;18:100318. doi:10.1016/j.lanwpc.2021.100318
41. Notice of the Office of the Luzhou Municipal People’s Government on the issuance of the thirteenth five-year plan of actionfor curbing and preventing AIDS in Luzhou. Government of Luzhou; 2018. Available from: http://wjw.luzhou.gov.cn/zwgk/lzyj/bmwj/zcwj/content_552514.
42. Implementation opinions of the office of the committee on prevention and treatment of major infectious Diseases in Luzhou on further strengthening the management of HIV antiretroviral treatment and follow-up. Government of Luzhou. Available from: http://wjw.luzhou.gov.cn/zwgk/lzyj/bmwj/zcwj/content_537126.
43. Ren N, Yuansheng L, Wang R, et al. The Distribution of HIV and AIDS Cases in Luzhou, China, From 2011 to 2020: bayesian spatiotemporal analysis. JMIR Public Health Surveill. 2022;8(6):e37491. doi:10.2196/37491
44. You X, Gilmour S, Cao W, et al. HIV incidence and sexual behavioral correlates among 4578 men who have sex with men (MSM) in Chengdu, China: a retrospective cohort study. BMC Public Health. 2021;21:802. doi:10.1186/s12889-021-10835-4
45. Chengdu Bureau of Statistics. Chengdu statistical yearbook; 2021. Available from: http://cdstats.chengdu.gov.cn/.
46. Chengdu Bureau of Statistics. Chengdu statistical yearbook; 2019. Available from: http://cdstats.chengdu.gov.cn/.
 © 2024 The Author(s). This work is published and licensed by Dove Medical Press Limited. The full terms of this license are available at https://www.dovepress.com/terms.php and incorporate the Creative Commons Attribution - Non Commercial (unported, v3.0) License.
By accessing the work you hereby accept the Terms. Non-commercial uses of the work are permitted without any further permission from Dove Medical Press Limited, provided the work is properly attributed. For permission for commercial use of this work, please see paragraphs 4.2 and 5 of our Terms.
© 2024 The Author(s). This work is published and licensed by Dove Medical Press Limited. The full terms of this license are available at https://www.dovepress.com/terms.php and incorporate the Creative Commons Attribution - Non Commercial (unported, v3.0) License.
By accessing the work you hereby accept the Terms. Non-commercial uses of the work are permitted without any further permission from Dove Medical Press Limited, provided the work is properly attributed. For permission for commercial use of this work, please see paragraphs 4.2 and 5 of our Terms.