")
Back to Journals » Journal of Inflammation Research » Volume 17
Identification of Biomarkers, Pathways, Immune Properties of Mitophagy Genes, and Prediction Models for Intervertebral Disc Degeneration
Authors Huang Y, Qiu X, Liu J, Wan J, Yu C, Liu C, Duan Y, Chen C, Dai J, Ouyang J , Liu M, Min S, Qiu S
Received 27 January 2024
Accepted for publication 2 May 2024
Published 14 May 2024 Volume 2024:17 Pages 2959—2975
DOI https://doi.org/10.2147/JIR.S461668
Checked for plagiarism Yes
Review by Single anonymous peer review
Peer reviewer comments 2
Editor who approved publication: Professor Ning Quan
Yongxiong Huang,1,2,* Xianshuai Qiu,3,* Jinlian Liu,4 Jiangtao Wan,5 Cheng Yu,1 Chun Liu,1 Yang Duan,1 Chong Chen,2 Jingxing Dai,6 Jun Ouyang,6 Ming Liu,3 Shaoxiong Min,1,5 Sujun Qiu1
1Department of Spine Surgery, Zhujiang Hospital, Southern Medical University, Guangzhou, 510280, People’s Republic of China; 2Department of Spine Surgery, Guangdong Provincial People’s Hospital, Southern Medical University, Guangzhou, 510000, People’s Republic of China; 3Department of Orthopedics and Sports Medicine Center, Heyou Hospital, Foshan, 528333, People’s Republic of China; 4Department of Pathophysiology, Guangdong Provincial Key Laboratory of Shock and Microcirculation, School of Basic Medical Sciences, Southern Medical University, Guangzhou, 510515, People’s Republic of China; 5Shenzhen Key Laboratory of Spine Surgery, Department of Spine Surgery, Peking University Shenzhen Hospital, Shenzhen, 518036, People’s Republic of China; 6Guangdong Provincial Key Laboratory of Medical Biomechanics & National Key Discipline of Human Anatomy, School of Basic Medical Sciences, Southern Medical University, Guangzhou, 510515, People’s Republic of China
*These authors contributed equally to this work
Correspondence: Sujun Qiu, Department of Spine Surgery, Zhujiang Hospital, Southern Medical University, Guangzhou, 510280, People’s Republic of China, Email [email protected] Shaoxiong Min, Shenzhen Key Laboratory of Spine Surgery, Department of Spine Surgery, Peking University Shenzhen Hospital, Shenzhen, 518036, People’s Republic of China, Email [email protected]
Background: Intervertebral disc degeneration (IDD) is the leading cause of low back pain (LBP). The mechanism of IDD development and progression is not fully understood. Peripheral biomarkers are increasingly vital non-radioactive methods in early detection and diagnosis for IDD. Nevertheless, less attention has been paid to the role of mitophagy genes in the progress of IDD. This study aimed to identify the mitophagy disease-causing genes in the process of IDD and mitophagy diagnostic biomarkers for IDD.
Methods: Mitophagy-related differentially expressed genes (MRDEGs) related to IDD were investigated by analyzing the microarray datasets of IDD cases from GEO, PathCards and Molecular Signatures Databases. We used R software, WGCNA, PPI, mRNA-miRNA, mRNA-TF, GO, KEGG, GSEA, GSVA and Cytoscape to analyze and visualize the data. We further used ssGSEA for immunoinfiltration analysis to obtain different immune cell infiltration. LASSO model was developed to screen for genes that met the diagnostic gene model requirements. Finally, qRT-PCR, Western blotting and HE were used to verify hub genes and their expression from clinical IDD samples.
Results: We identified 14 MRDEGs and 12 hub genes. GO, KEGG, GSEA and GSVA analyses demonstrated that hub genes were critical for the development of IDD. LASSO diagnostic model consisted of six hub genes, among which SQSTM1, ATG7 and OPTN were significantly different between the two IDD disease subtypes. At the same time, SQSTM1 also had a high correlation with immune characteristic subtypes. The results of qRT-PCR and Western blotting also indicated that these genes were significantly differentially expressed in nucleus pulposus cells (NPCs) of the IDD group.
Conclusion: We explored an association between MRDEGs-associated signature in IDD and validated that hub genes like SQSTM1 might serve as biomarkers for diagnostic and therapeutic targets for IDD. Meanwhile, this study can provide new insights into the functional characteristics and mechanism of mitophagy in the development of IDD.
Keywords: intervertebral disc degeneration, mitophagy-related differentially expressed genes, immune infiltration, diagnostic model, SQSTM1, nucleus pulposus cells
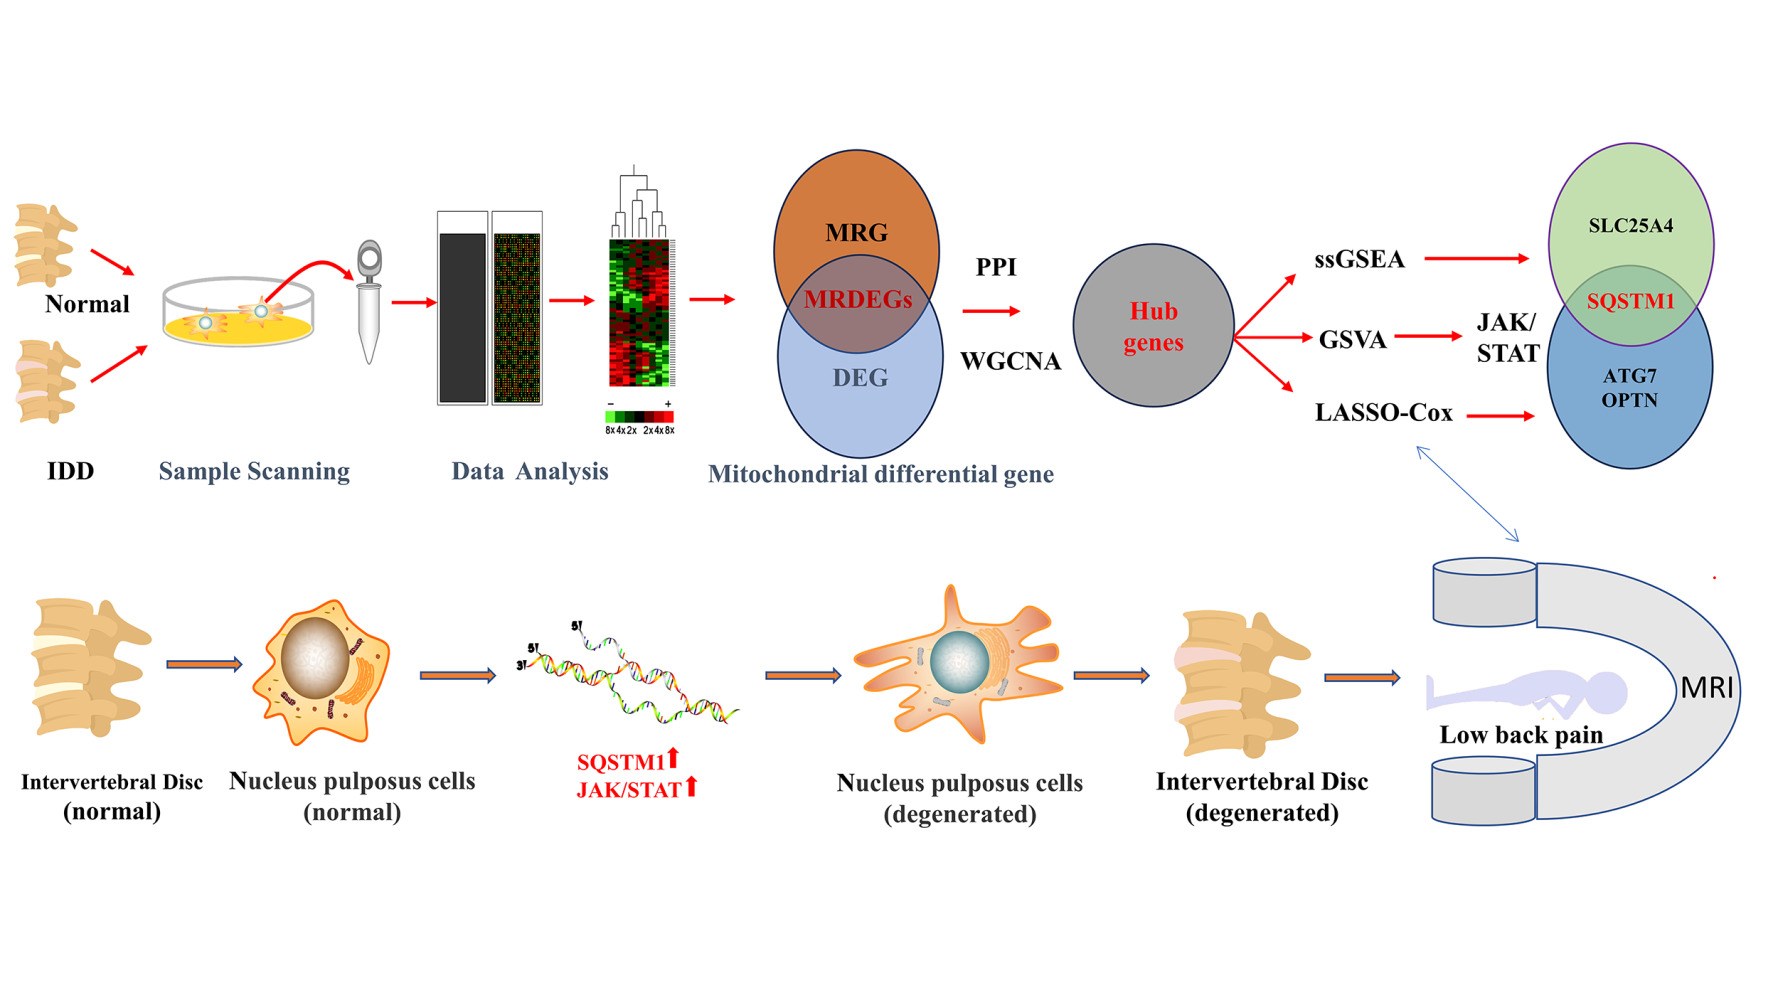
Graphical Abstract:
Introduction
The incidence of low back pain (LBP) is on the rise among the population in the whole world.1 Studies have suggested that over 80% of people would experience LBP in their lifetime.2 Therefore, LBP not only affects the health and quality of life of individuals, but also imposes an economic, social and psychological burden on society as a whole. Prevention and effective management of LBP is of great importance for both individuals and society. It was recognized that intervertebral disc degeneration (IDD) plays an important role in the pathogenesis of LBP.3 The pathogenesis of IDD has not been fully elucidated, and the diagnosis of IDD is primarily based on imaging changes after IDD. Early IDD treatments focus on pain relief with various drugs4 and surgery is usually the only way to relieve pain later on.5 However, these treatments do not prevent further progression of IDD and carry a high risk of recurrence and degradation of adjacent vertebrae. Therefore, a comprehensive understanding of the pathological changes and molecular mechanisms of IDD and an early and timely diagnostic model or diagnostic markers are crucial for IDD.
Current research on the IDD mechanism focuses primarily on the progressive destruction of extracellular environment, cellular senescence and excessive inflammatory response.6 However, mitophagy cannot be ignored in the occurrence and development of diseases. In recent years, some in vivo and in vitro studies have reported that mitophagy is involved in the progression of IDD.7–9 However, the precise mechanism by which the abnormal function of mitophagy causes the alteration in tissue cell structure in IDD is not well understood. Few studies have been conducted on mitophagy genes in diagnostic models of disc degeneration. Comprehensive bioinformatics analysis has become a promising method to explore the mechanism of IDD at the genome level.10 This analysis has allowed us to identify the differentially expressed genes (DEGs) and functional pathways involved in IDD progression. Moreover, it can screen out the role of mitophagy-related differentially expressed genes (MRDEGs) in the pathological changes of IDD, establish a better diagnostic model, and provide new ideas for clinical treatment.11
In the present study, IDD-related MRDEGs were identified by weighted gene coexpression network analysis (WGCNA) and protein-protein interaction (PPI) analysis. Subsequently, we constructed a comprehensive analysis of hub genes and an IDD-related diagnostic gene model was established using Cox regression through least absolute shrinkage and selection operator (LASSO) analysis. Finally, we validated eight hub genes in normal and degenerative nucleus pulposus cells (NPCs) using qRT-PCR. At the same time, the downstream pathway of gene regulation was verified by Western blotting. Our findings regarding the IDD mechanism can be used to investigate biomarkers or diagnostic and therapeutic targets for IDD.
Materials and Methods
Data Collection and Pre-Procession
In order to find differences in gene expression associated with IDD, datasets GSE12427212 and GSE15040813 were downloaded from the Gene Expression Omnibus (GEO, www.ncbi.nlm.nih.gov/geo, corresponding clinical and demography information in Table S1).14 For genes with multiple probes, the average gene expression was calculated, and these expression datasets were log2-transformed+1. The ComBat method was used for adjustment of the batch effects. Principal Component Analysis (PCA)15 was performed on the data sets before and after adjustment.
Identification of MRDEGs
In order to obtain mitophagy-related genes (MRGs), we defined a total of 63 genes from PathCards database (https://pathcards.genecards.org/)16 and Molecular Signatures Database (MsigDB, version 7.2)17 with each of four cellular pathways (Supplement B Sheet1). The “Limma” package was applied to identify DEGs with the threshold of |logFC| > 0 and p < 0.05. We obtained MRDEGs by taking the intersection of DEGs and MRGs, and drew the Venn diagram. We used package ggplot2 to draw the volcano map and Pheatmap package to draw the heatmap. We also used the RCircos package18 for chromosomal localization analysis of MRDEGs.
Identification of Hub Genes
The WGCNA19 package was used to identify IDD related gene modules. In this study, the soft-thresholding power, cut height, minimal distance and minimal module size were set as 18, 0.2, 0.2, 25, respectively. We investigated PPI network interaction among overlapping genes between MRGs and IDD related gene modules by STRING database (http://string-db.org,v)20 with confidence coefficient > 0.4 and the PPI files were imported into the Cytoscape software. Hub genes were further identified using the CytoHubba21 plugin in Cytoscape. The Degree Correlation algorithm in CytoHubba plug-in was used to score hub genes, and the hub genes were visualized according to the degree scores.
The Interaction Network of Hub Genes
We collected miRNA-hub gene pairs from ENCORI22 (https://starbase.sysu.edu.cn/) database and miRDB target prediction tool with target score > 80. Transcription factors (TFs) regulating hub genes were downloaded from the ChIPBase (v2.0) (http://rna.sysu.edu.cn/chipbase/)23 and hTFtarget (http://bioinfo.life.hust.edu.cn/hTFtarget#!/)24 databases. The interaction network for visualization by Cytoscape software.
Functional Enrichment Analysis of Hub Genes
The relationship between biological pathways and inflammation was analyzed by GO and KEGG enrichment analysis. GO and KEGG25 enrichment analyses of hub genes were performed by R package clusterProfiler (Benjamini-Hochberg adjusted p < 0.05 and FDR q <0.25). GO includes biological process (BP), molecular function (MF) and cellular component (CC).26
GSEA and GSVA of Hub Genes
We used GSEA (http://www.broadinstitute.org/gsea/index.js)27 to identify gene sets that showed significant differences between IDD patients and normal samples. GSEA was performed in the “c2.cp.v7.2. symbols” from MsigDB database with a threshold nominal P-value < 0.05. Gene sets that contained fewer than 500 genes or more than 10 genes were allowed. The “h.all.v7.4.symbols.gmt” gene set was obtained from MSigDB database for GSVA28 of the combined dataset samples.
ssGSEA and Hierarchical Clustering Analysis
We employed the ssGSEA algorithm29 to assess the relative abundance of immune cells in every sample. Meanwhile, we analyzed the correlation between the immune cell infiltration degree and hub genes expression level. We used “Consensus Cluster Plus”30 (reps = 100, pItem = 0.8, pFeature = 1) according to the enrichment score to cluster the IDD samples into two different groups (Clusters 1 and 2) to study the correlation between immunity and clinical phenotype of IDD. Analysis between different clusters was conducted using the Partitioning Around Medoid method.
Construction of the Mitophagy-Associated Diagnostic Model
LASSO regression model was used to construct the mitophagy-associated predictive model based on hub genes using Glmnet31 package. The model from the LASSO analysis was further presented as a nomogram by Rms package and the decision curve analysis (DCA)32 with ggDC package was employed to evaluate the diagnostic capability of the model. Subsequently, we divided the samples into low-risk group (A) and high-risk group (B) according to the median risk score of LASSO regression model. The Mann–Whitney U-test was used to analyze the two IDD subtypes of hub genes, and the genes with significant differences were verified by ROC curve.
qRT-PCR
Intervertebral disc tissues from patients with lumbar disc herniation as IDD group and patients without disc degeneration as control group were collected from Guangdong Provincial People’s Hospital with written informed consent. Total RNA was extracted using RNeasy reagents according to the manufacturer’s instructions (GBCGIO, China) and then reversed transcription into cDNA using HifairIII reagents (Yeasen, China) with an oligo (dT)18 primer. A LightCycle (ABI 7500) and Power Green qPCR Mix (Yeasen, China) were used for Quantitative real-timePCR. All specific primers were obtained from Sangon Biotech (Table S2). Glyceraldehyde-phosphate dehydrogenase (GAPDH) was used as an internal control.
Western Blotting
The whole protein extraction kit (Key GEN BioTECH, Nanjing, China) was used to extract protein from the NPCs. The proteins were isolated by SDS polyacrylamide gel electrophoresis and then transferred to polyvinylidene fluoride membranes. All membranes were incubated in the primary antibody rabbit anti-SQSTM1 (1:1000, abcam, ab109012), rabbit anti-JAK (1:1000, Immunoway, YT2428), rabbit anti-STAT3 (1:1000, Immunoway, YT4443) and rabbit anti-GAPDH (glyceraldehyde-3-phosphate dehydrogenase, 1:5000, Bioworld, ap0063). The bands were observed with an enhanced chemiluminescent chromogenic substrate after incubation with the second antibody for two hours.
Hematoxylin-Eosin (HE) Staining
After paraffin sections were dewaxed with xylene, anhydrous ethanol, 95% alcohol, 90% alcohol, 80% alcohol and 70% alcohol were added successively for 5 minutes each. After washing the slices in distilled water, they were dyed with Harris hematoxylin for 5 minutes and eosin solution for 2 minutes. Then the slices were placed in 80% alcohol, 90% alcohol, 95% alcohol, anhydrous ethanol and xylene successively to dehydrate and become transparent. The slices were dried and then sealed with neutral gum. Microscopes were used to collect and analyze slice images.
Statistical Analysis
All of the statistical analyses were performed using R software (Version 4.1.0) (http://www.r-project.org). Univariate and multivariate Cox proportional hazards regression analyses were used to assess the relationship between the hub genes and the model of IDD patients. ROC analysis was used to predict diagnostic model and the area under the ROC curve (AUC) was used to assess the accuracy of the model. The default correlation was calculated by Spearman correlation coefficient. All P-values less than 0.05 were considered statistically significant.
Results
Data Pre-Procession and Identification of Mitophagy-Related Genes
Boxplot plots before and after batch removal of the combined GSE124272 and GSE150408 datasets were drawn (Figure 1A and B) and PCA was performed (Figure 1C and D). As can be seen from the result, batch effect of samples in IDD dataset after batch removal is basically eliminated. A total of 34,729 DEGs were obtained and 3822 DEGs were identified with logFC > 0 and p < 0.05 in the volcano map (Figure 1E), including 1940 down-regulated genes and 1882 up-regulated genes. We got 14 MRDEGs (ATG5, ATG7, OPTN, PHB2, RPS27A, SLC25A4, SQSTM1, ULK1, TOMM5, TOMM20, BNIP3, ABCE1, LRBA, USP15) (Figure 1F). After that, we analyzed MRDEGs and drew heatmap (Figure 1G) and group comparison map (Figure 1H), in which 12 MRDEGs showed significant differences. MRDEGs were mainly distributed on chromosomes 1,2,3,4,5,6,9,10,12, and three MRDEGs were distributed on chromosome 12 (Figure 1I).
 |
Figure 1 Data pre-procession and identification of mitophagy-related genes. (A and B) Boxplot of the merged dataset before and after batch removal. (C and D) PCA diagram of the merged dataset before and after batch removal. Analysis of differentially expressed genes related to mitophagy. (E) Volcano maps of DEGs. (F) Venn diagrams of DEGs and MRGs. (G) Heat maps of MRDEGs. H. Group comparison diagram of MRDEGs. (I) Chromosomal mapping of MRDEGs. The symbol ns is not statistically significant. *p < 0.05, **p < 0.01. |
Identification of Hub Genes and Interaction Network of Hub Genes
We first clustered the merged dataset by clustering tree and annotate the grouping information (Figure 2A). DEGs were clustered in 17 modules (Figure 2B). Then we clustered the DEGs and visualized the relationship between genes and corresponding modules (Figure 2C). After merging similar modules, five modules such as MEcyan, MElightcyan, MEblack, MEmagenta and MEgrey were obtained and these modules were correlated between different groups (Figure 2D). MEcyan, MElightcyan, MEblack and MEmagenta were highly correlated with different groups of the combined datasets. We selected the intersection of MRDEGs and DEGs contained in the four correlated WGCNA modules to obtain 13 intersection genes (Figure 2E). We used STRING database to analyze the PPI network of 13 intersection genes (Figure 2F). Among the 13 intersection genes, 12 interacting genes were regarded as hub genes. We used the Degree parameter to score hub genes and found that TOMM20 and SQSTM1 were highly correlated with hub genes (Figure 2G). The mRNA-miRNA interaction network consists of 9 hub genes and 67 miRNA molecules (Figure 2H). A total of 79 pairs of mRNA-miRNA interaction relationships were formed (Supplement B Sheet2). We obtained 12 hub genes and 63 TFs constituted 150 pairs of mRNA-TF interaction relationships (Figure 2I). In the mRNA-TF interaction network, the hub gene PHB2 and TFs had the most interaction relationships, and there were 29 mRNA-TF interaction relationships in PHB2 gene (Supplement B Sheet 3).
 |
Figure 2 Identification of hub genes. (A-C) Sample clustering tree, DEGs modules and DEGs clustering in the merged dataset. (D) Correlation analysis between DEGs clustering module and different groups. (E) Venn diagram of MRDEGs and module genes. (F) PPI network diagram of genes. (G) PPI network diagram of hub genes in the Degree algorithm. (H and I) mRNA-miRNA and mRNA-TF interaction network of hub genes. In (G) the larger the area of the circle, the darker the color, indicating that the gene represented by the circle has a higher correlation with other genes. In (H and I) the green circle is hub genes, the blue quadrilateral is miRNA, and the purple triangle is TF. |
Functional Enrichment Analyses of Hub Genes
The results of GO analysis (Figure 3A) and KEGG analysis (Figure 3B) were presented in bubble charts. We also showed the relationship between hub genes and GO and KEGG enrichment analysis results as a ring network diagram (Figure 3C and D). Hub genes were mainly enriched in macroautophagy, autophagy, process utilizing autophagic mechanism and other BPs, mitochondrial outer membrane and other CCs, K63-linked polyubiquitin modification-dependent protein binding and other MFs (Figure 3E and Table S3). Hub genes were mainly enriched in mitophagy-animal, autophagy-animal, pathways of neuroolume-multiple diseases, shigellosis, autophagy-other, ferroptosis, longevity regulating pathway, amyotrophic lateral sclerosis, spinocerebellar ataxia, cellular senescence pathways (Figure 3F and Table S4). We also analyzed the four pathways mitophagy-animal (A), autophagy-animal (B), pathways of neuroolume-multiple diseases (C), shigellosis (D), which contained the largest number of hub genes in KEGG enrichment analysis in pathway diagram (Figure S1A-D).
 |
Figure 3 GO and KEGG analysis of hub genes. (A) Bubble diagram of GO analysis of hub genes. (B) Bubble diagram of KEGG pathway enrichment analysis of hub genes. (C) Ring network diagram of GO analysis. (D) Ring network diagram of KEGG pathway enrichment analysis. (E) GO functional enrichment items for hub genes. (F) KEGG pathway enrichment items in hub genes. |
GSEA and GSVA of Hub Genes
We analyzed the association between DEGs expression and the biological processes involved, the cellular components affected, and the molecular functions performed in the combined dataset by GSEA enrichment analysis (Figure 4A). The GSEA results showed that DEGs were significantly enriched in extracellular signal-regulated kinase (ERK) pathway (Figure 4B), interleukin (IL3) pathway (Figure 4C), photodynamic therapy-induced NF-KB survival signaling pathway (Figure 4D), senescence and autophagy in cancer pathogenesis pathway (Figure 4E) and other pathways. The GSVA results showed that IL6/JAK/STAT3 signaling, DNA repair, G2M checkpoint, apical junction, coagulation, E2F targets, complement, MYC targets V1, inflammatory response, MYC targets V2 and oxidative phosphorylation pathways were significantly different between IDD group and normal group (Figure 4F).
 |
Figure 4 GSEA and GSVA enrichment analysis. (A) Four main biological characteristics of GSEA enrichment analysis. (B-E) DEGs were significantly enriched in ERK pathway (B), IL3 pathway (C), photodynamic therapy-induced NF-KB survival signaling (D), senescence and autophagy in cancer (E) pathway. (F) GSVA analysis of the merged datasets. |
ssGSEA and Immunosignature Subtypes of Merged Datasets
For immune cells with significant differences in the IDD and normal groups (Figure 5A), we plotted the correlation heat map with hub genes (Figure 5B). Among them, immune cell Neutrophil had the largest number of significant correlations with hub genes. We drew a lollipop chart to show the correlation between Neutrophil and hub genes (Figure 5C). Neutrophil had the highest positive correlation with ULK1 and the highest negative correlation with OPTN. All IDD group samples were divided into two different subtypes (cluster1: n = 20; cluster2: n = 5, Figure 5D). Then, we demonstrated the differences in the expression of hub genes in different immunocharacteristic subtypes (Figure 5E), and performed ROC verification for the genes with significant differences (Figure 5F-I). The results showed that the expression levels of ATG5 (AUC=0.0.820, Figure 5F) and PHB2 (AUC=0.860, Figure 5G) were correlated to a certain extent in the immunocharacteristic subtypes (cluster1 and cluster2), and the expression levels of SLC25A4 (AUC=0.900, Figure 5H) and SQSTM1 (AUC=0.900, Figure 5I) were highly correlated in immunophenotype (cluster1, cluster2).
 |
Figure 5 The immunoinfiltration of hub genes and their expression in different immunophenotypes. (A) Box diagram for comparison of immune cells. (B) Heatmap of the correlation between the expression of hub genes and seven immune cells. (C) Lollipop plot of correlation between the Neutrophil and 12 hub genes. (D) Consistent clustering heat map of IDD group samples. (E) Box diagram comparing the expression of hub genes in different immunocharacteristic subtypes. (F-I) ROC validation of ATG5 (F), PHB2 (G), SLC25A4 (H), SQSTM1 (I) in different immunophenotypes (cluster1, cluster2). The symbol ns is not statistically significant. *p < 0.05, **p < 0.01. |
Construction and Diagnostic Performance of LASSO-Cox Diagnostic Model
LASSO regression analysis was used to construct a diagnostic model for hub genes (Figure 6A). In addition, we also visualized LASSO regression results to obtain LASSO variable trajectory maps (Figure 6B). Then we visualized the expression of genes in the LASSO diagnostic model in different groups by forest map (Figure 6C), and showed the expression correlation between genes by correlation circle diagram (Figure 6D). The LASSO diagnostic model constructed by us consisted of 6 hub genes, namely ATG7, OPTN, PHB2, RPS27A, SLC25A4 and SQSTM1. We performed a nomogram analysis of the model (Figure 6E). In addition, prognostic calibration was performed on nomograms of Cox regression models and calibration curves were plotted (Figure 6F). There was a high coincidence degree between the fitted curve and the prediction curve, indicating that the Cox diagnostic model had a good diagnostic effect. Finally, we used DCA to evaluate the role of Cox regression model in diagnosis (Figure 6G). We observed that the X–value range of the model was steadily higher than the all-positive and all-negative lines except that between 0.8 and 0.9. The Mann–Whitney U-test was used to analyze the two IDD subtypes of hub genes (Figure 6H). The results showed that the expression of Cox regression model constructed by hub genes was correlated with the occurrence of IDD (AUC=0.896, Figure 6I). A total of 3 hub genes presented significantly different expression levels between the two IDD subtypes, including ATG7 (AUC=0.808, Figure 6J), OPTN (AUC=0.833, Figure 6K) and SQSTM1 (AUC=0.827, Figure 6L)
 |
Figure 6 Construction and diagnostic performance of LASSO-Cox diagnostic mode genes. (A) LASSO regression diagnostic model diagram of hub genes. (B) LASSO variable trajectory of hub genes diagnostic model. (C) Forest map of hub genes in diagnostic model. (D) Chordal diagram of gene expression correlation in LASSO model. (E-G) Nomogram, calibration curve and DCA diagram of Cox regression model. (H) Differential analysis of LASSO model gene expression in subtypes (A and B) group comparison box diagram. (I) ROC validation of Cox regression model. (J-L) ROC validation of ATG7 (J), OPTN (K) and SQSTM1 (L) in different IDD subtypes. The symbol ns is not statistically significant. **p < 0.01. |
The mRNA and Downstream Protein Expression of Hub Genes
Magnetic resonance imaging (MRI) results showed that the signal expression of NP tissue was significantly lower in the degenerative group (Figure 7A). HE staining showed obvious inflammation and rupture of NP tissue in the IDD (Figure 7B). Expression levels of hub genes (ATG5, ATG7, OPTN, PHB2, RPS27A, ULK1, SQSTM1) in IDD groups were significantly higher than the normal group, while expression level of hub gene SLC25A4 in normal group was significantly higher than that in the IDD group (Figure 7C). At the same time, we found that the JAK/STAT3 pathway regulated by autophagy gene was significantly overexpressed in the IDD group (Figure 7D).
 |
Figure 7 The relative expression of hub genes mRNA and downstream protein. (A) MRI of clinical sample. (B) HE staining representation of AF and NP in IDD and normal discs (scale bars = 100μm in low magnified pictures and scale bars = 25μm in high magnified pictures). (C) Hub genes (ATG5, ATG7, OPTN, PHB2, RPS27A, ULK1, SQSTM1, SLC25A4) expression levels in IDD groups. (D) Western blot analysis of SQSTM1 and JAK/STAT3 pathway of different groups. *p < 0.05, **p < 0.01 and ***p < 0.001. |
Discussion
LBP is a prevalent chronic disease, the second leading cause of disability and hospital visits in industrialized countries.33–35 IDD is the major contributor to LBP36 and its incidence has increased annually, which brings a heavy burden to the society. The specific pathological process is still unknown. Current treatments are confined to symptomatic relief of pain with analgesics or surgeries, which can not reverse the process of disc degeneration.37 Meanwhile, the diagnosis of IDD is mainly based on the pain symptoms and medical images, which hinders early diagnosis and prompt treatment of patients.38 Therefore, it is necessary to identify the etiology and find the most effective diagnosis and treatment methods for IDD.39 It is reported that mitophagy plays a vital role in the occurrence and development of IDD by affecting human NPCs.40 In this study, we planned to explore the MRDEGs characteristics of IDD and discuss the potential of MRDEGs as targets for the early diagnosis and treatment of IDD.
In our study, twelve hub genes were identified by WGCNA and PPI in IDD. Studies have demonstrated that these genes play a significant role in IDD. It has reported that ATG5 is involved in the early formation of autophagosomes.41 The GO enrichment analysis demonstrated that the most significant module changes and pathways were mainly related to mitophagy. Meanwhile, the changes in cell membranes were primarily focused on the outer membrane of the autophagy receptor. The changes in KEGG were also mainly concentrated in the process of mitophagy. There is evidence that MRDEGs play an essential role in the occurrence or progression of IDD. Studies of degenerative rat NPCs have reported increased autophagy activity and up-regulation of autophagy-related genes compared with healthy disc tissue.42 Recovery of autophagy flux can salvage oxidative damage and mitochondrial dysfunction to prevent disc degeneration.43 Multiple studies have linked mitophagy to the initiation and development of disc degeneration.7,44 These theories are consistent with our results. Pathological diagnosis or pharmacologically targeted gene therapy targeting MRDEGs are potential research directions for IDD.
GSEA revealed that DEGs were significantly enriched in the ERK, IL3, NF-KB, senescence and autophagy signaling pathways. These pathways have been demonstrated to play an effective role in disc degeneration in previous studies. Muhammad Ishfaq found that baicalin could reduce mitochondrial damage, antagonize the activation of the NF-KB pathway and inhibit the activity of inflammasome.45 Numerous studies have reported that inflammatory IL can induce IDD and inhibit the proliferation of NPCs through mitochondrial dysfunction.46–48 Furthermore, IDD has been shown to progress with age, possibly through the activation of macroautophagy and autophagy.49 SQSTM1/p62 is the first receptor discovered to selectively remove protein polymers and damaged organelles such as mitochondria and peroxisomes from within cells. A growing body of evidence supports the association of SQSTM1 with a variety of diseases, including degenerative diseases, immune diseases and human tumors. Current studies have confirmed that a large number of SQSTM1/p62 aggregates in various diseased cells are closely related to the regulation of NF-kB pathway. GSVA analysis revealed that the IL6/JAK/STAT3 signaling and coagulation pathways were significantly different between the IDD and normal groups. Previous studies have also demonstrated that inflammatory response, immune response50 and IL-6/JAK/STAT3 pathway51 are closely related to the degeneration of human NPCs. There is a high degree of agreement between these studies and our Western blotting analysis results.
The immune response and various factors released by various immune cells play distinct roles in the progression of IDD.52 When the disc blood-NP barrier is compromised, NP and blood vessels come into contact and trigger an immune response.53 The infiltration of immune cells can release many proinflammatory molecules, which promote the inflammatory cascade within the disc,54 and eventually lead to the production of pain symptoms in patients.52,55 Previous studies have reported that IL can act on NPCs through the AMPK/mTOR/ULK1 pathway.56 Meanwhile, we found that neutrophils infiltration exhibited the highest significant correlation with hub genes such as ULK1 and SQSTM1. Immunoinfiltration analysis revealed that neutrophils and γδT cells were significantly correlated with the progression of IDD. Four hub genes (ATG5, PHB2, SLC25A4, SQSTM1) were significantly different among different IDD subtypes of immune characteristics. The expression levels of SLC25A4 (AUC=0.900) and SQSTM1 (AUC=0.900) were highly correlated in the immunocharacteristic subtypes (cluster1 and cluster2). Our findings suggest that IDD is closely related to SLC25A4 and SQSTM1 of immune status and immune cells.
The final LASSO diagnostic model composed of six hub genes (SQSTM1, ATG7, OPTN, PHB2, RPS27A and SLC25A4). SQSTM1, ATG7 and OPTN have been proved to have a corresponding relationship with IDD. In human disc cells, proinflammatory IL-1βinduces changes in protein 1 light chain 3 (LC3)-II and autophagy substrate p62/SQSTM1.57 ATG7 and OPTN influence the progression of disc degeneration through autophagy58 and mitophagy,59 respectively. RPS27A and SCL25A4 have not been thoroughly studied in IDD and can be used as a direction for future research. Univariate Cox regression analysis results demonstrated that SQSTM1 (AUC=0.827), ATG7 (AUC=0.808) and OPTN (AUC=0.833) were significantly different between IDD subtypes and the Cox diagnostic model (AUC=0.896) exhibited a good diagnostic effect. In conclusion, these six hub genes may become important signal markers for the diagnosis of IDD.
The study may have several minor shortcomings that require further investigation. First of all, we did not send IDD samples individually for genetic sequencing. Furthermore, the sample size used here was limited and must be further expanded to obtain more accurate data. Second, our study focused on DEGs in the dataset, while other clinical influencing factors such as gender and age were not considered in our study. In addition, more relevant experimental evidence other than PCR and Western blotting may be needed to fully elucidate the mechanism of action of the hub genes in IDD.
In summary, this study used comprehensive analysis to explore the functions and pathways of MRDEGs in the occurrence and development of IDD. We screened out 12 hub genes associated with IDD progression. The immunocharacteristic subtypes of IDD were closely related to SLC25A4 and SQSTM1. Subsequently, the results demonstrated that SQSTM1, ATG7 and OPTN genes may be candidates for IDD diagnostic biomarkers. In addition, qRT-PCR and Western blotting results revealed that hub genes did have significant differences in clinical samples, suggesting that hub genes may play an essential role in the occurrence and progression of IDD. Our findings may help identify new early diagnosis targets for IDD and early intervention by appropriate means to avoid further development of IDD. Moreover, the biological function of these genes like SQSTM1 in IDD has implications for further research and clinical application.
Conclusion
Overall, our results identify the pathogenic role of MRDEGs in IDD. From the perspective of mechanism, abnormal changes in hub genes like SQSTM1 activate and interact with related pathways in NPCs by influencing the interaction of immune-related environment, thus leading to IDD. At the same time, our study provides a good basis for hub genes like SQSTM1 to serve as diagnostic biomarkers for IDD, providing a new direction for the further mechanistic study of LBP pathogenesis.
Abbreviations
IDD, Intervertebral disc degeneration; LBP, Low back pain; DEGs, Differentially expressed genes; MRDEGs, mitophagy-related differentially expressed genes; PPI, Protein-protein interaction; GEO, Gene Expression Omnibus; WGCNA, Weighted gene co-expression network analysis; GSEA, Gene Set Enrichment Analysis; ROC, Receiver operating characteristic curve; ssGSEA, Single sample Gene Set Enrichment Analysis; GSVA, Gene set variation analysis; LASSO, Least absolute shrinkage and selection operator; NPCs, Nucleus pulposus cells; TFs, Transcription factors; GO, Gene Ontology; KEGG, Kyoto Encyclopedia of Genes and Genomes.
Data Sharing Statement
Any data in this study can be obtained from the corresponding author upon reasonable request. In this study, the datasets analyzed are all publicly available datasets.
Ethics Approval and Consent to Participate
The study was authorized by the Institutional Ethics Committees of The Guangdong Provincial People’s Hospital of Southern Medical University and conformed to the principles of the Declaration of Helsinki (NO. KY-Z-2020-612-03). Written informed consents were obtained from all the patients in this study.
Acknowledgments
We thank all the participants in the Zhujiang Hospital affiliated to Southern Medical University.
Author Contributions
All authors made a significant contribution to the work reported, whether that is in the conception, study design, execution, acquisition of data, analysis and interpretation, or in all these areas; took part in drafting, revising or critically reviewing the article; gave final approval of the version to be published; have agreed on the journal to which the article has been submitted; and agree to be accountable for all aspects of the work.
Funding
This research was supported by the Guangdong Natural Science Foundation (NO. 2021A1515012152), President Foundation of Zhujiang Hospital, Southern Medical University (NO. yzjj2023ms16) and Guangdong Medical Research Foundation (NO. A2022544).
Disclosure
The authors report no conflicts of interest in this work.
References
1. Balague F, Mannion AF, Pellise F, Cedraschi C. Non-specific low back pain. Lancet. 2012;379(9814):482–491.
2. Zhao L, Manchikanti L, Kaye AD, Abd-Elsayed A. Treatment of Discogenic Low Back Pain: current Treatment Strategies and Future Options-a Literature Review. Curr Pain Headache Rep. 2019;23(11):86.
3. Watanabe T, Otani K, Sekiguchi M, Konno SI. Relationship between lumbar disc degeneration on MRI and low back pain: a cross-sectional community study. Fukushima J Med Sci. 2022;68(2):97–107.
4. Vaudreuil N, Kadow T, Yurube T, et al. NSAID use in intervertebral disc degeneration: what are the effects on matrix homeostasis in vivo? Spine J. 2017;17(8):1163–1170.
5. Jiang C, Yin S, Wei J, et al. Full-Endoscopic Posterior Lumbar Interbody Fusion with Epidural Anesthesia: technical Note and Initial Clinical Experience with One-Year Follow-Up. J Pain Res. 2021;14:3815–3826.
6. Lyu FJ, Cui H, Pan H, et al. Painful intervertebral disc degeneration and inflammation: from laboratory evidence to clinical interventions. Bone Res. 2021;9(1):7.
7. Kang L, Liu S, Li J, Tian Y, Xue Y, Liu X. The mitochondria-targeted anti-oxidant MitoQ protects against intervertebral disc degeneration by ameliorating mitochondrial dysfunction and redox imbalance. Cell Prolif. 2020;53(3):e12779.
8. Song Y, Lu S, Geng W, et al. Mitochondrial quality control in intervertebral disc degeneration. Exp Mol Med. 2021;53(7):1124–1133.
9. Park EY, Park JB. High glucose-induced oxidative stress promotes autophagy through mitochondrial damage in rat notochordal cells. Int Orthop. 2013;37(12):2507–2514.
10. Hai B, Song Q, Du C, et al. Comprehensive bioinformatics analyses reveal immune genes responsible for altered immune microenvironment in intervertebral disc degeneration. Mol Genet Genomics. 2022;297(5):1229–1242.
11. Lan T, Shiyu-Hu Z, Yan B, Chen T. New insights into the interplay between miRNAs and autophagy in the aging of intervertebral discs. Ageing Res Rev. 2021;65:101227.
12. Wang Y, Dai G, Li L, et al. Transcriptome signatures reveal candidate key genes in the whole blood of patients with lumbar disc prolapse. Exp Ther Med. 2019;18(6):4591–4602.
13. Wang Y, Dai G, Jiang L, Liao S, Xia J. Microarray analysis reveals an inflammatory transcriptomic signature in peripheral blood for sciatica. BMC Neurol. 2021;21(1):50.
14. Davis S, Meltzer PS. GEOquery: a bridge between the Gene Expression Omnibus (GEO) and BioConductor. Bioinformatics. 2007;23(14):1846–1847.
15. Ringner M. What is principal component analysis? Nat Biotechnol. 2008;26(3):303–304.
16. Belinky F, Nativ N, Stelzer G, et al. PathCards: multi-source consolidation of human biological pathways. Database. 2015;2015:567.
17. Liberzon A, Birger C, Thorvaldsdottir H, Ghandi M, Mesirov JP, Tamayo P. The Molecular Signatures Database (MSigDB) hallmark gene set collection. Cell Syst. 2015;1(6):417–425.
18. Zhang H, Meltzer P, Davis S. RCircos: an R package for Circos 2D track plots. BMC Bioinf. 2013;14:244.
19. Langfelder P, Horvath S. WGCNA: an R package for weighted correlation network analysis. BMC Bioinf. 2008;9:559.
20. Szklarczyk D, Gable AL, Lyon D, et al. STRING v11: protein-protein association networks with increased coverage, supporting functional discovery in genome-wide experimental datasets. Nucleic Acids Res. 2019;47(D1):D607–D613.
21. Chin CH, Chen SH, Wu HH, Ho CW, Ko MT, Lin CY. cytoHubba: identifying hub objects and sub-networks from complex interactome. BMC Syst Biol. 2014;8(Suppl 4):S11.
22. Li JH, Liu S, Zhou H, Qu LH, Yang JH. starBase v2.0: decoding miRNA-ceRNA, miRNA-ncRNA and protein-RNA interaction networks from large-scale CLIP-Seq data. Nucleic Acids Res. 2014;42(Database issue):D92–D97.
23. Zhou KR, Liu S, Sun WJ, et al. ChIPBase v2.0: decoding transcriptional regulatory networks of non-coding RNAs and protein-coding genes from ChIP-seq data. Nucleic Acids Res. 2017;45(D1):D43–D50.
24. Zhang Q, Liu W, Zhang HM, et al. hTFtarget: a Comprehensive Database for Regulations of Human Transcription Factors and Their Targets. Genomics Proteomics Bioinf. 2020;18(2):120–128.
25. Kanehisa M, Goto S. KEGG: Kyoto encyclopedia of genes and genomes. Nucleic Acids Res. 2000;28(1):27–30.
26. Yu G. Gene Ontology Semantic Similarity Analysis Using GOSemSim. Methods Mol Biol. 2020;2117:207–215.
27. Subramanian A, Tamayo P, Mootha VK, et al. Gene set enrichment analysis: a knowledge-based approach for interpreting genome-wide expression profiles. Proc Natl Acad Sci U S A. 2005;102(43):15545–15550.
28. Hanzelmann S, Castelo R, Guinney J. GSVA: gene set variation analysis for microarray and RNA-seq data. BMC Bioinf. 2013;14:7.
29. Newman AM, Liu CL, Green MR, et al. Robust enumeration of cell subsets from tissue expression profiles. Nat Methods. 2015;12(5):453–457.
30. Wilkerson MD, Hayes DN. ConsensusClusterPlus: a class discovery tool with confidence assessments and item tracking. Bioinformatics. 2010;26(12):1572–1573.
31. Engebretsen S, Bohlin J. Statistical predictions with glmnet. Clin Clin Epigenet. 2019;11(1):123.
32. Van Calster B, Wynants L, Verbeek J, et al. Reporting and Interpreting Decision Curve Analysis: a Guide for Investigators. Eur Urol. 2018;74(6):796–804.
33. Cieza A, Causey K, Kamenov K, Hanson SW, Chatterji S, Vos T. Global estimates of the need for rehabilitation based on the Global Burden of Disease study 2019: a systematic analysis for the Global Burden of Disease Study 2019. Lancet. 2021;396(10267):2006–2017.
34. Hartvigsen J, Hancock MJ, Kongsted A, et al. What low back pain is and why we need to pay attention. Lancet. 2018;391(10137):2356–2367.
35. Carapetis JR. Global, regional, and national incidence, prevalence, and years lived with disability for 328 diseases and injuries for 195 countries, 1990-2016: a systematic analysis for the Global Burden of Disease Study 2016. Lancet. 2017;390(10100):1211–1259.
36. Sun K, Jiang J, Wang Y, et al. The role of nerve fibers and their neurotransmitters in regulating intervertebral disc degeneration. Ageing Res Rev. 2022;81:101733.
37. Vergroesen PP, Kingma I, Emanuel KS, et al. Mechanics and biology in intervertebral disc degeneration: a vicious circle. Osteoarthritis Cartilage. 2015;23(7):1057–1070.
38. Pulickal T, Boos J, Konieczny M, et al. MRI identifies biochemical alterations of intervertebral discs in patients with low back pain and radiculopathy. Eur Radiol. 2019;29(12):6443–6446.
39. Heindel P, Tuchman A, Hsieh PC, et al. Reoperation Rates After Single-level Lumbar Discectomy. Spine. 2017;42(8):E496–E501.
40. Xu WN, Zheng HL, Yang RZ, et al. Mitochondrial NDUFA4L2 attenuates the apoptosis of nucleus pulposus cells induced by oxidative stress via the inhibition of mitophagy. Exp Mol Med. 2019;51(11):1–16.
41. Park JW, Kim Y, Lee SB, et al. Autophagy inhibits cancer stemness in triple-negative breast cancer via miR-181a-mediated regulation of ATG5 and/or ATG2B. Mol Oncol. 2022;16(9):1857–1875.
42. Bahar ME, Hwang JS, Ahmed M, et al. Targeting Autophagy for Developing New Therapeutic Strategy in Intervertebral Disc Degeneration. Antioxidants (Basel). 2022;11(8):67.
43. Kang L, Xiang Q, Zhan S, et al. Restoration of Autophagic Flux Rescues Oxidative Damage and Mitochondrial Dysfunction to Protect against Intervertebral Disc Degeneration. Oxid Med Cell Longev. 2019;2019:7810320.
44. Hu S, Zhang C, Qian T, et al. Promoting Nrf2/Sirt3-Dependent Mitophagy Suppresses Apoptosis in Nucleus Pulposus Cells and Protects against Intervertebral Disc Degeneration. Oxid Med Cell Longev. 2021;2021:6694964.
45. Ishfaq M, Wu Z, Wang J, Li R, Chen C, Li J. Baicalin alleviates Mycoplasma gallisepticum-induced oxidative stress and inflammation via modulating NLRP3 inflammasome-autophagy pathway. Int Immunopharmacol. 2021;101(Pt B):108250.
46. Hu J, Yan Q, Shi C, Tian Y, Cao P, Yuan W. BMSC paracrine activity attenuates interleukin-1beta-induced inflammation and apoptosis in rat AF cells via inhibiting relative NF-kappaB signaling and the mitochondrial pathway. Am J Transl Res. 2017;9(1):79–89.
47. Ma Z, Tang P, Dong W, et al. SIRT1 alleviates IL-1beta induced nucleus pulposus cells pyroptosis via mitophagy in intervertebral disc degeneration. Int Immunopharmacol. 2022;107:108671.
48. Cao C, Chen S, Song Z, et al. Inflammatory Stimulation Mediates Nucleus Pulposus Cell Necroptosis Through Mitochondrial Function Disfunction and Oxidative Stress Pathway. Front Biosci. 2022;27(4):111.
49. Ye W, Xu K, Huang D, et al. Age-related increases of macroautophagy and chaperone-mediated autophagy in rat nucleus pulposus. Connect Tissue Res. 2011;52(6):472–478.
50. Sun Z, Liu B, Luo ZJ. The Immune Privilege of the Intervertebral Disc: implications for Intervertebral Disc Degeneration Treatment. Int J Med Sci. 2020;17(5):685–692.
51. Wu C, Ge J, Yang M, et al. Resveratrol protects human nucleus pulposus cells from degeneration by blocking IL-6/JAK/STAT3 pathway. Eur J Med Res. 2021;26(1):81.
52. Risbud MV, Shapiro IM. Role of cytokines in intervertebral disc degeneration: pain and disc content. Nat Rev Rheumatol. 2014;10(1):44–56.
53. Wang L, He T, Liu J, et al. Revealing the Immune Infiltration Landscape and Identifying Diagnostic Biomarkers for Lumbar Disc Herniation. Front Immunol. 2021;12:666355.
54. Ling Z, Liu Y, Wang Z, et al. Single-Cell RNA-Seq Analysis Reveals Macrophage Involved in the Progression of Human Intervertebral Disc Degeneration. Front Cell Dev Biol. 2021;9:833420.
55. Luchting B, Rachinger-Adam B, Zeitler J, et al. Disrupted TH17/Treg balance in patients with chronic low back pain. PLoS One. 2014;9(8):e104883.
56. Huang L, Chen J, Wu D, Wang K, Lou W, Wu J. Berberine Attenuates IL-1beta-Induced Damage of Nucleus Pulposus Cells via Activating the AMPK/mTOR/Ulk1 Pathway. Biomed Res Int. 2022;2022:6133629.
57. Geisler S, Holmstrom KM, Skujat D, et al. PINK1/Parkin-mediated mitophagy is dependent on VDAC1 and p62/SQSTM1. Nat Cell Biol. 2010;12(2):119–131.
58. He R, Wang Z, Cui M, et al. HIF1A Alleviates compression-induced apoptosis of nucleus pulposus derived stem cells via upregulating autophagy. Autophagy. 2021;17(11):3338–3360.
59. Sun K, Jing X, Guo J, Yao X, Guo F. Mitophagy in degenerative joint diseases. Autophagy. 2021;17(9):2082–2092.
 © 2024 The Author(s). This work is published and licensed by Dove Medical Press Limited. The full terms of this license are available at https://www.dovepress.com/terms.php and incorporate the Creative Commons Attribution - Non Commercial (unported, v3.0) License.
By accessing the work you hereby accept the Terms. Non-commercial uses of the work are permitted without any further permission from Dove Medical Press Limited, provided the work is properly attributed. For permission for commercial use of this work, please see paragraphs 4.2 and 5 of our Terms.
© 2024 The Author(s). This work is published and licensed by Dove Medical Press Limited. The full terms of this license are available at https://www.dovepress.com/terms.php and incorporate the Creative Commons Attribution - Non Commercial (unported, v3.0) License.
By accessing the work you hereby accept the Terms. Non-commercial uses of the work are permitted without any further permission from Dove Medical Press Limited, provided the work is properly attributed. For permission for commercial use of this work, please see paragraphs 4.2 and 5 of our Terms.