")
Back to Journals » International Journal of Nanomedicine » Volume 13
X-ray radiation-induced and targeted photodynamic therapy with folic acid-conjugated biodegradable nanoconstructs
Authors Clement S, Chen W, Deng W, Goldys EM
Received 8 February 2018
Accepted for publication 17 March 2018
Published 19 June 2018 Volume 2018:13 Pages 3553—3570
DOI https://doi.org/10.2147/IJN.S164967
Checked for plagiarism Yes
Review by Single anonymous peer review
Peer reviewer comments 3
Editor who approved publication: Dr Thomas Webster
Sandhya Clement,1,2,* Wenjie Chen,1,* Wei Deng,1,2 Ewa M Goldys1,2
1Australian Research Council Centre of Excellence for Nanoscale BioPhotonics (CNBP), Department of Physics and Astronomy, Macquarie University, Sydney, NSW, Australia; 2The Graduate School of Biomedical Engineering, University of New South Wales, Sydney, NSW, Australia
*These authors contributed equally to this work
Introduction: The depth limitation of conventional photodynamic therapy (PDT) with visible electromagnetic radiation represents a challenge for the treatment of deep-seated tumors.
Materials and methods: To overcome this issue, we developed an X-ray-induced PDT system where poly(lactide-co-glycolide) (PLGA) polymeric nanoparticles (NPs) incorporating a photosensitizer (PS), verteporfin (VP), were triggered by 6 MeV X-ray radiation to generate cytotoxic singlet oxygen. The X-ray radiation used in this study allows this system to breakthrough the PDT depth barrier due to excellent penetration of 6 MeV X-ray radiation through biological tissue. In addition, the conjugation of our NPs with folic acid moieties enables specific targeting of HCT116 cancer cells that overexpress the folate receptors. We carried out physiochemical characterization of PLGA NPs, such as size distribution, zeta potential, morphology and in vitro release of VP. Cellular uptake activity and cell-killing effect of these NPs were also evaluated.
Results and discussion: Our results indicate that our nanoconstructs triggered by 6 MeV X-ray radiation yield enhanced PDT efficacy compared with the radiation alone. We attributed the X-ray-induced singlet oxygen generation from the PS, VP, to photoexcitation by Cherenkov radiation and/or reactive oxygen species generation facilitated by energetic secondary electrons produced in the tissue.
Conclusion: The cytotoxic effect caused by VP offers the possibility of enhancing the radiation therapy commonly prescribed for the treatment of cancer by simultaneous PDT.
Keywords: PLGA nanoparticles, verteporfin, singlet oxygen generation, photodynamic therapy, X-ray PDT, folic acid targeting
Introduction
Photodynamic therapy (PDT), a minimally invasive therapeutic modality, primarily used to treat cancer, continues to attract research interest.1,2 PDT uses two entities, a photosensitizer (PS) drug and electromagnetic radiation of appropriate visible wavelength, to generate cytotoxic reactive oxygen species (ROS) such as singlet oxygen (1O2) to destroy cancer cells.3,4 The limited light penetration used in the established PDT with visible radiation allows treating only a limited range of superficial cancers such as skin cancers.5,6 Selecting PSs with absorption in a longer wavelength range of ~700 nm where tissue extinction is at its minimum (eg, Tookad®; Steba Biotech SA, Luxembourg) has been the main strategy used so far to enhance the penetration depth light used in PDT (up to 10 mm).6,7 However, the extinction coefficient in the tissue at ~700 nm and poor water solubility and low biocompatibility of these longer wavelength PSs limit their therapeutic efficacy as PDT agents.8,9 In addition, poor selectivity of PSs to tumors results in undesired toxicity to healthy tissues, affecting therapeutic performance.10 Currently, the PDT for tumors located deeper in the tissue (more than 10 mm from the skin surface) is only possible with the aid of invasive delivery of light into tissue by inserted optical fibers.11 To overcome these challenges, nanoparticle (NP)-formulated PS delivery systems have been developed, including those molecularly targeted to cancer-specific cell membrane proteins.12–14 In addition to carrying the PS cargo, some of these NPs may act as energy transducers for electromagnetic radiations and generate visible light to stimulate the PS molecules and enable ROS generation.3,15–19
poly(D,L-lactide-co-glycolic acid) (PLGA) polymer is widely used in biomedical applications including drug delivery, bioimaging and diagnostics, cancer therapeutics and tissue engineering.20 Biodegradability of PLGA is facilitated by the hydrolysis of its ester linkages in the presence of water, producing glycolic acid and lactic acid. These monomers undergo various metabolic processes in the human body under normal physiological conditions;21 owing to this property, PLGA has been clinically approved by the US Food and Drug Administration (FDA). PLGA can easily be formulated as a nanomaterial.22 The surface of PLGA NPs can be modified with various molecules such as polyethylene glycol (PEG) and chitosan.23,24 These NPs can passively accumulate in cancer tissue by virtue of the enhanced permeability and retention (EPR) effect.25–27 To enhance the efficiency of its cellular uptake, PLGA can be further functionalized and conjugated with molecularly targeting ligands for targeted drug or gene delivery.28–31 Among these targeting moieties, folic acid (FA) is an excellent choice because folate receptors (FRs) are overexpressed in most cancer cells, while they are almost absent in healthy tissues. The FR-mediated endocytosis has been reported in many human cancer cell lines.32–34 Therefore, cellular internalization of PS-bearing nanoparticles (NPs) conjugated with FA can be significantly enhanced in cancer cells, compared with healthy cells, leading to cancer-selective delivery of PS. In addition, deeply penetrating X-ray radiation, which is accompanied by in situ generated Cherenkov radiation and a cascade of energetic secondary electrons, was recently investigated by our group in the context of PS activation in deep tissues.35–37 In these studies, scintillating NPs were used as energy transducers providing scintillation photons for the PS molecules. Alternatively, the NPs themselves have also been used as PS.39,40 However, both these approaches used specialized inorganic materials, and the ensuing cytotoxicity of the NP when delivered in clinically meaningful doses represented a potential limitation for future clinical utilization of this approach.41 In contrast, in this study, we exclusively used chemical agents (PLGA and verteporfin [VP]) that are already clinically approved.
This study explores the therapeutic effect of a PLGA-encapsulated PS, VP, in combination with externally applied 6 MeV X-ray radiation as well as 690 nm light illumination. VP is a clinically approved PS for the treatment of macular degeneration with a strong absorption band near ultraviolet (UV)–blue region and a second weak band around 700 nm.42,43 The PLGA NPs with VP molecules encapsulated within PLGA-VP are conjugated with FA. The FA conjugate (FA-PLGA-VP) has high affinity for the FRs that are present on the surfaces of most human tumor cells.44,45 These FA-conjugated PLGA NPs were activated by both 6 MeV X-ray radiation and, for comparison, by 690 nm light irradiation usually used to stimulate VP. Light of a wavelength at 690 nm can directly excite the VP molecules to produce singlet oxygen, whereas 6 MeV X-ray radiation excites the VP molecule either by the induced CR in the biological media or due to the interaction of electrons with VP or both.46 Singlet oxygen generated during PDT was monitored using singlet oxygen sensor green (SOSG), a chemical probe specifically designed for detecting 1O2.47,48 Cytotoxicity of the FA-PLGA-VP nanoconjugates exposed to X-ray radiation or light illumination was investigated in a colorectal cancer cell line, HCT116. Scheme 1 illustrates the formation of FA-PLGA-VP conjugates and their interaction with cells in targeted PDT of cancer.
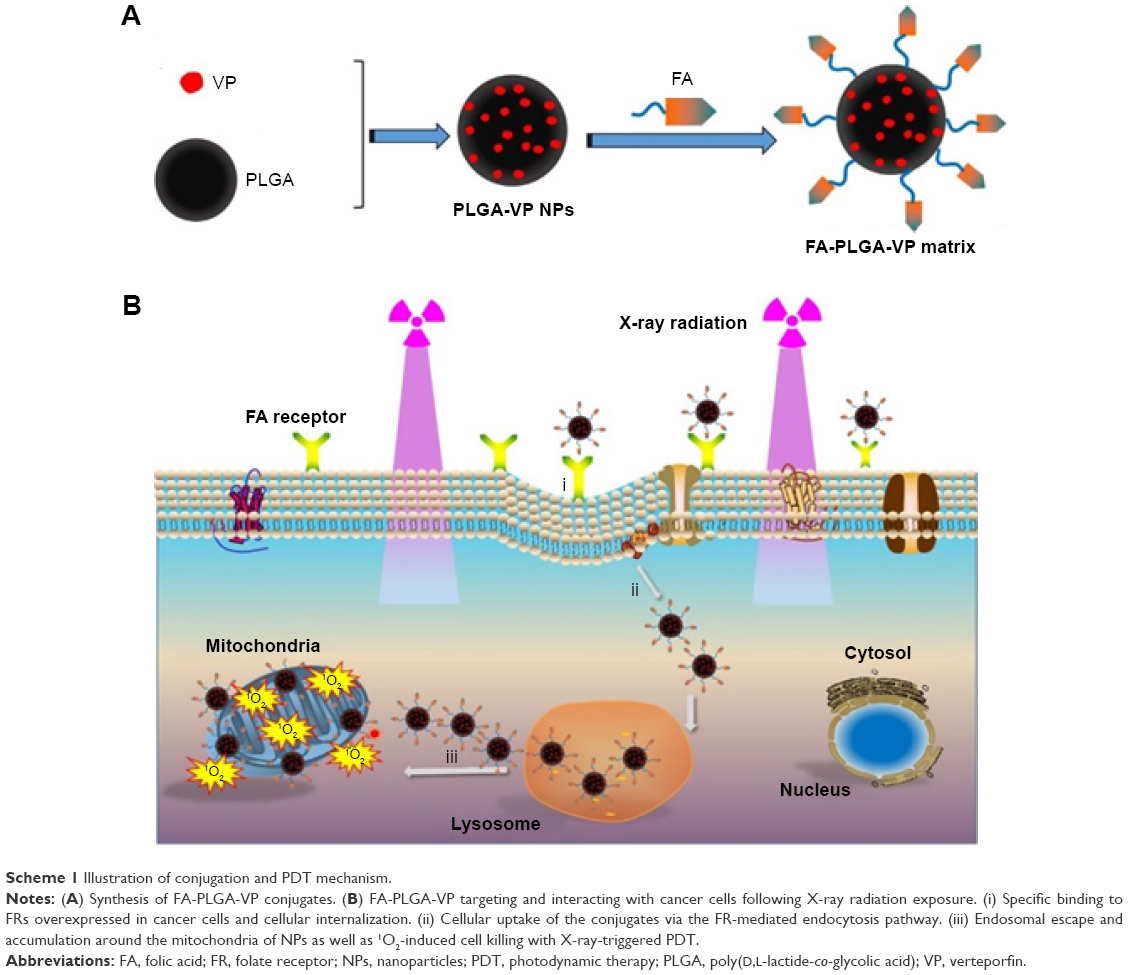 | Scheme 1 Illustration of conjugation and PDT mechanism. |
Materials and methods
Materials
PLGA (50:50; molecular weight [MW]: 30,000–60,000; product no: P2191), poly(vinyl alcohol) (PVA; MW: 31,000–50,000; product no: 363138), dichloromethane (DCM; product no: 270997), VP (product no: SML 0534), FA (product no: F7876), 1-(3-(dimethylamino)-propyl)-3-ethyl carbodiimide hydrochloride (EDC; product no: 165344), N-hydroxysulfosuccinimide (NHS; product no: 130672), methanol (product no: 322415) and dimethyl sulfoxide (DMSO; product no: D2650) were purchased from Sigma-Aldrich Co. (St Louis, MO, USA). SOSG probe (product no: S-36002) and Live/Dead Cell Viability Kit (product no: L3224A) were purchased from Thermo Fisher Scientific (Waltham, MA, USA). Dulbecco’s Modified Eagle’s Medium (DMEM; product no: 11965092), fetal bovine serum (FBS; product no: 26140079), trypsin (product no: 12604-021), Hoechst 33345 (product no: H3570), Dulbecco’s phosphate-buffered saline (DPBS; product no: 14190250), phosphate-buffered saline (PBS; product no: 10010023), opti-Minimal Essential Medium (MEM; reduced serum medium; product no: 31985062) and MitoTracker® Green FM (product no: M7514) were purchased from Thermo Fisher Scientific. McCoy’s 5A medium (product no: ATCC® 30-2007™) and Eagle’s Minimum Essential Medium (EMEM; ATCC® 30-2003™) were purchased from the American Type Culture Collection (ATCC, Manassas, VA, USA).
A human colorectal cancer cell line, HCT116 (product no: ATCC® CCL-247™), and a normal colorectal cell line, CCD 841 CoN (product no: ATCC® CRL-1790™) were purchased from the ATCC.
Methods
Preparation of PLGA NPs incorporating VP (PLGA-VP) and modification with FA (FA-PLGA-VP nanoconstruct)
In this study, we synthesized PLGA and PLGA-VP NPs by using a solvent evaporation single emulsion method with slight modifications.49,50 Briefly, 2.5 mL of PLGA solution mixed with different amounts of VP stock solution (0 μL, 50 μL, 100 μL, 200 μL and 400 μL) was added to 30 mL of 5% (w/v) PVA. The mixture was sonicated for 1.5 min at 200 W output using a microtip probe sonicator (Branson Digital Sonifier, S-250D; Emerson Industrial Automation, Danbury, CT, USA) followed by evaporation of DCM at room temperature under moderate magnetic stirring. The solution was purified by centrifugation (7,500 rpm for 10 min) and washed with water twice. The stock solution of the samples was prepared by suspension of NPs in 12 mL of water. The final concentration of VP in each sample (pure PLGA and PLGA-VP NPs; samples 1–5) was 0 μM, 4.5 μM, 15.9 μM, 26.4 μM and 39.6 μM, respectively.
The conjugation of FA with PLGA-VP NPs was conducted based on a previously reported protocol with slight modifications.51 One milliliter of PLGA-VP stock solution was centrifuged and washed with PBS three times and redispersed in 1 mL of PBS. Twelve milligrams of NHS and 20 mg of EDC were added to the solution, and it was vortexed in an orbital shaker for 1 h at 200 rpm. One hundred microliters of PBS containing FA (50 μM) was subsequently added to the mixture followed by shaking in an orbital shaker (200 rpm) for another 18 h. The final product was washed with water twice and resuspended into 1 mL of water to make the stock solution.
Characterization of the conjugates
The size and the surface charge of different PLGA NPs were measured using a Zetasizer Nano ZS (Malvern Instruments, Malvern, UK). The absorption spectra of the pure PLGA and PLGA-VP samples were measured in Cary UV-VIS-NIR absorption spectrophotometer (Agilent, Santa Clara, CA, USA) by using a pair of 1 cm path length clean quartz cuvette. The fluorescence measurements were carried out using Cary Eclipse Spectrophotometer (Varian, Inc.) with xenon lamp excitation at room temperature. The as-prepared samples were diluted three times for carrying out the abovementioned measurements. The shape of the PLGA NPs was confirmed by carrying out transmission electron microscopy (TEM) imaging using the Philips CM10 system (Philips Electron Optics, Eindhoven, The Netherlands). The samples were negatively stained with uranyl acetate to enhance PLGA contrast in TEM. The conjugation of FA with PLGA-VP was confirmed by both absorption spectroscopy and Fourier transform infrared (FTIR) spectroscopy.
In vitro VP release from PLGA NPs
Five hundred microliters of PLGA-VP NPs (sample 3, with a VP concentration of 15.9 μM) was centrifuged and redispersed in PBS with and without 10% FBS to mimic the physiological conditions. The solution was placed in a Lyzer tube (Midi Pur-A-Lyzer 6000 Dialysis Kit), and this tube was placed in a 50 mL tube with 15 mL of PBS in it followed by incubation at 37°C for different time intervals. An aliquot of PBS was taken for the fluorescence characterization of the released VP at different time points. The percentage of VP release from PLGA-VP NPs was calculated as follows:
|

In this study, (VPs) and (VPc) represent the peak fluorescence emission intensities of VP in PBS and in control sample, respectively. The control sample was prepared by the dispersion of the PLGA-VP NPs in 15 mL of PBS and 200 μL of DMSO. The DMSO was added to dissolve the PLGA NPs.
Singlet oxygen detection using SOSG probe
Two different sources of electromagnetic radiation were used for singlet oxygen generation. We used a 690 nm red light-emitting diode (LED), at the power density of 15 mW cm-2 on the samples, for different exposure times. We also used a linear accelerator (LINAC; Elekta AB, Stockholm, Sweden) with an X-ray photon energy of 6 MeV generating various doses of X-ray radiation. The SOSG probe was used to detect the singlet oxygen generated in the samples. To this aim, 16 μL of SOSG (4 μM) was added to 2 mL of diluted samples (10 times dilution from the stock solution). The emission intensity from SOSG at 525 nm was measured after excitation at 488 nm wavelength. The increase in the fluorescence intensity is an indication of singlet oxygen generation.
Cell culture
McCoy’s 5A medium was used to culture the HCT116 cells. EMEM supplemented with 10% FBS and 1% antibiotic–antimycotic was used as the culture medium of the CCD 841 CoN cells. The cells were grown at 37°C with 5% CO2 in the cell incubator. When cells reached about 90% confluency, they were detached with trypsin and transferred into Petri dishes or well plates for different experimental purposes.
Cellular uptake of PLGA-FA-VP
To perform confocal microscopy cell experiments, HCT116 cells (5 × 10⁴/well) were seeded in 24-well plates with glass coverslips with 12 mm diameter placed in each well. When the cells reached 60% confluency, the previous medium was removed, and the reduced serum medium (opti-MEM) solution containing PLGA NPs was added to cells, while the same medium without additions was applied to the control groups. After 0.5, 1 and 3 h of incubation, the medium was removed and coverslips were washed twice with DPBS solution (pH 7.4). Then, cells were fixed with 2% paraformaldehyde (10 min, 37°C), washed twice with DPBS solution (pH 7.4), stained with MitoTracker® Green FM for 15 min at 37°C (50 nM) and stained with Hoechst 33345 for 15 min at 37°C (5 μg mL-1). After all staining procedures, each coverslip was rinsed by DPBS solution (pH 7.4) three times and transferred onto a glass slide with a drop of fluoromount mounting medium (Sigma-Aldrich Co.). The glass slides were then sealed and imaged using a Leica SP2 confocal laser scanning microscopy system (Leica Microsystems, Wetzlar, Germany). The excitation wavelength of 405 nm was used for the excitation of VP loaded inside PLGA NPs, and their fluorescence emission was measured at 690 nm. The following imaging conditions were used: excitation 514 nm, emission of 590 nm for the labeled lysosomes and excitation 488 nm and emission 516 nm for the mitochondria.
FA receptor-mediated endocytosis uptake
For the observation of the FA receptor-mediated endocytosis uptake of FA-PLGA-VP, the HCT116 cells were incubated with NP matrix (10 times dilution in culture medium) for 0.5 h, 1 h, and 3 h at 37°C. To study the competitive effect of free FA on the endocytosis of NPs, the HCT116 cells were first incubated with the opti-MEM medium containing free FA (50 μg/mL) for blocking the FRs of the cells, followed by incubation with opti-MEM medium containing same amount of FA-PLGA-VP at 37°C. The cells without FA incubation served as the control group. After cell incubations with different treatments, cells were prepared in glass slides laser scanning confocal microscope imaging. Both the emissions from VP molecules in the conjugate and Hoechst 33342 were imaged by exciting at 405 nm.
Cell viability and in vitro PDT assays
To evaluate the toxicity of two external radiation sources (visible light and X-rays) on HCT116 and CCD 841 CoN cells, the MTS assays were carried out. Cells (1 × 10⁴/well) were seeded into 96-well plates and cultured for 24 h at 37°C. When the cells reached 70% confluency, they were exposed to X-ray radiation at different doses followed by another 24 h. The toxicity was assessed using the Cell Viability Assay Kit, MTS (Promega Corporation, Fitchburg, WI, USA) according to its protocol.
In X-ray PDT assays, HCT116 cells were divided into four groups: control cells without any treatment, cells incubated with PLGA NPs, cells incubated with PLGA-VP NPs and cells incubated with FA-PLGA-VP. Cells (1 × 10⁴ cells/well) were seeded into 96-well plates and cultured for 24 h at 37°C. When the cells reached 70% confluency, the old medium was removed, and then opti-MEM solutions containing different NP samples were added. After 4 h of incubation, the old medium was removed and fresh serum-containing medium was added. For X-ray radiation PDT experiments, the cells incubated with different NP samples were, respectively, exposed to 6 MeV X-ray radiation with different doses. After treatments, cells were further incubated for another 24 h. The cellular cytotoxicity of PDT was then assessed by the MTS assay (Promega Corporation) according to its protocol.
To confirm whether PLGA-VP NP-based PDT can be triggered with 690 nm (deep red) illumination, cytotoxicity of NPs on HCT116 cells was evaluated by using a Live/Dead Cell Viability Kit (product no: L3224A; Thermo Fisher Scientific). In brief, HCT116 cells (3 × 10⁵) were seeded in glass bottom confocal dishes with 35 mm diameter and cultured with 1 mL McCoy’s 5A medium. When cells grew to about 70% confluency, the dishes were divided into groups to undergo different treatments. Cells alone is considered as the control group. The other three groups are cells treated with light alone, cells treated with FA-PLGA-VP alone and cells treated with FA-PLGA-VP and light. After all treatments, the Live/Dead Cell Viability Kit was applied to all groups as per its manufacturer’s instructions. Red fluorescent signal (excitation [Ex]/emission [Em] 528/617 nm) from dead cells and green signal (Ex/Em 494/517 nm) from live cells were imaged using a laser scanning confocal microscope (Leica SPM2).
Statistical analyses
All quantitative data are shown as mean ± SD, n ≥ 3. All data analyses and plotting were performed using and plotting were performed using Origin 8.5 software.
Results and discussion
Characterization of PLGA-VP nanoconstructs
We have first verified the loading capability of PLGA NPs with different concentrations of VP. This variable loading is qualitatively indicated by varying sample color (Figure 1A). The absorption spectra of PLGA-VP NPs, pure PLGA and VP are shown in Figure 1B. The VP absorption peaks from PLGA-VP samples were observed at 700 nm, and the increased peak extinction coefficient at these peaks confirmed an increased concentration of VP loaded into samples 2–5 compared with PLGA alone (sample 1). Using the absorption spectra, the final concentration of VP in each sample (2–5) was calculated approximately to be 4.5 μM, 15.9 μM, 26.4 μM and 39.6 μM, respectively.3 This loading capability was also confirmed by fluorescence emission intensity from VP in these samples at 425 nm excitation (Figure 1C).
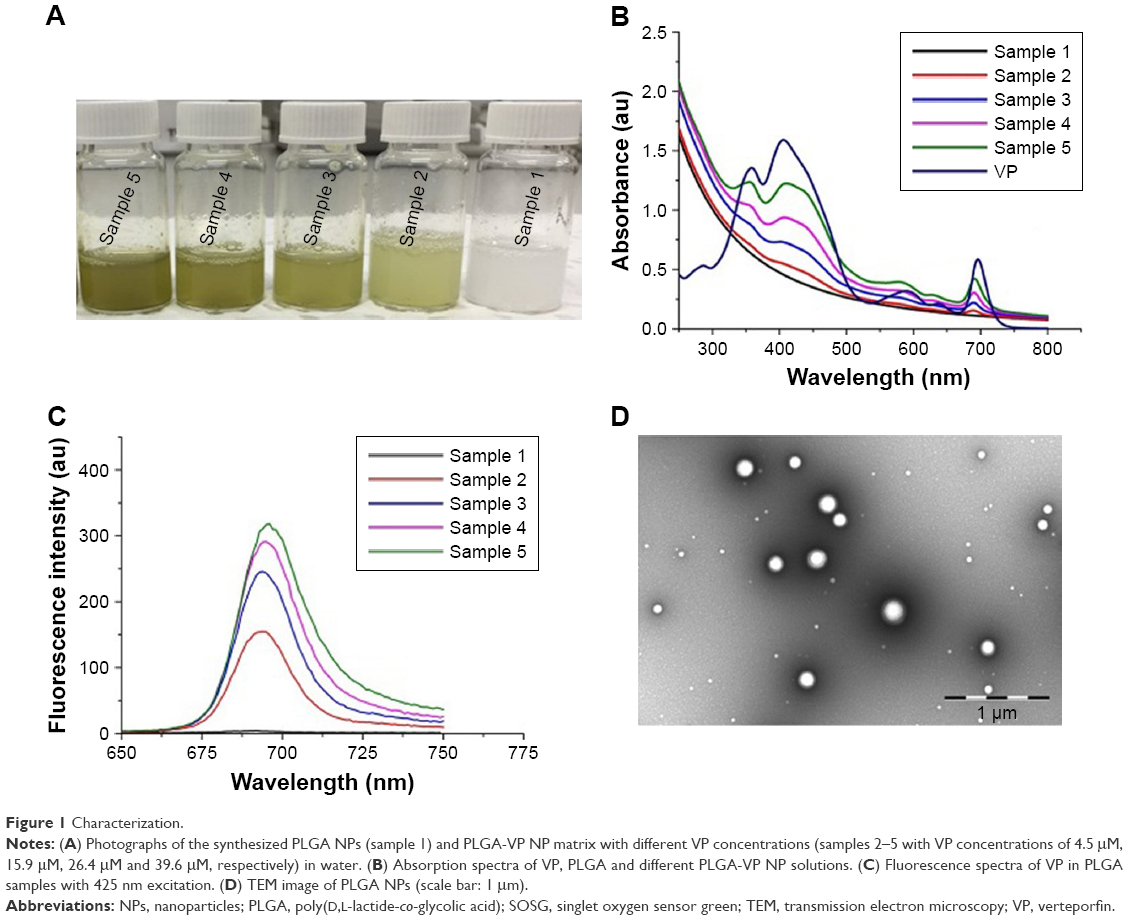 | Figure 1 Characterization. |
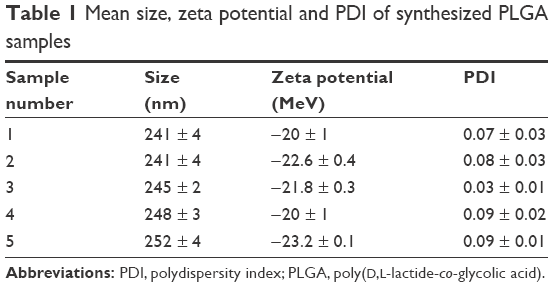
The TEM image of pure PLGA NPs indicates that most of the particles were spherical in shape with a size of ~200 nm (Figure 1D). We further investigated the size and zeta potential of as-prepared PLGA-VP samples using dynamic light scattering (DLS; Table 1). The average size of the samples (sample 1–5) obtained from DLS was around 250 nm which is larger than the size observed by the TEM. All NPs have negative charge which slightly increased with increasing VP loading. The polydispersity index (PDI; Table 1) indicates that PLGA-VP samples are monodisperse and not aggregated.
 | Table 1 Mean size, zeta potential and PDI of synthesized PLGA samples |
Singlet oxygen generation under 6 MeV X-ray radiation
We first checked the feasibility of PS molecules to generate singlet oxygen under appropriate visible light illumination.52 SOSG was used for the detection of singlet oxygen generation. We observed the singlet oxygen generated from all samples (samples 1–5) under 690 nm excitation (Supplementary materials). We further evaluated the capability of PLGA samples for singlet oxygen generation under 6 MeV X-ray radiation at different radiation doses. Again, the same amount of SOSG as previously described was used in all samples. As previously indicated, the SOSG probe itself causes a small amount of singlet oxygen generation under X-ray radiation;53 this was also observed in this study. The trend of the SOSG intensity measured in different samples as a function of radiation dose is shown in Figure 2A, and it is broadly similar to that for 690 nm irradiation. Singlet oxygen concentration in samples 2 and 3 increases with an increase in the concentration of VP compared with the control (sample 1). Surprisingly, the amount of singlet oxygen was found to decrease for samples 4 and 5 under the same experimental conditions. This suggests concentration quenching of singlet oxygen generation, which is similar to well-established concentration quenching of fluorescence.54 Figure 2B demonstrates that the percentage increase in SOSG intensity measured in sample 3 is much higher compared with sample 1 with increasing X-ray dose. The inset shows the SOSG fluorescence spectra of sample 3 for different radiation doses. In our previous study,53 we reported that VP molecules themselves can generate singlet oxygen under different radiation doses at 6 MeV. This X-ray-induced singlet oxygen generation from VP molecules may be due to Cherenkov radiation and/or generation of energetic electron by the 6 MeV X-ray radiation, which then produce a cascade of ROS. Earlier reports confirm that 6 MeV LINAC can generate CR in biological media.43 CR is electromagnetic radiation produced when charged particles move in a dielectric medium with a speed greater than phase velocity of light.55 The featureless spectrum of CR spans the entire UV–visible region and beyond, and it fully overlaps with the strong absorption band of VP in the UV–blue region. This CR enables direct excitation of VP molecules and singlet oxygen generation from PLGA-VP samples. Simultaneously, the secondary electrons generated by the X-ray photons may directly interact with the available oxygen and generate ROS,56 which may then react with VP. Direct interaction of these secondary electrons with the VP molecules is also possible. We ruled out the potential influence of ambient light which was negligible in our X-ray PDT experiments (Supplementary materials).
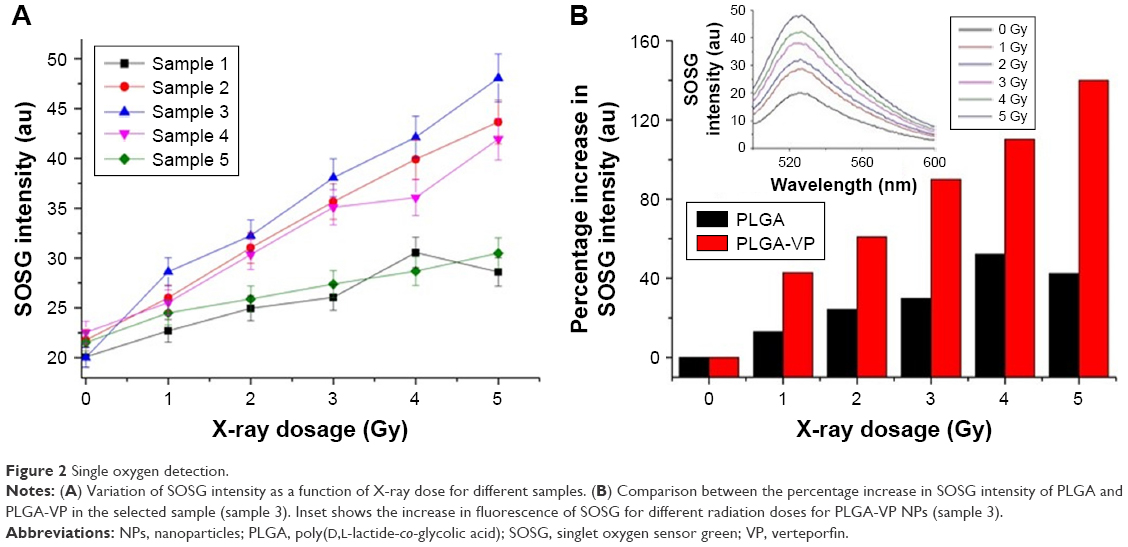 | Figure 2 Single oxygen detection. |
Formation of FA-PLGA-VP nanoconstructs
To specifically target cancer cells with the NPs and enhance the uptake activity of the particle by the cancer cells, PLGA-VP (sample 3) was conjugated with FA moieties. We checked the stability of PLGA-VP NPs in biological conditions before performing the FA conjugation. The results indicate that these NPs were highly stable in the PBS containing 10% FBS for >50 h (Supplementary materials). The conjugation of NPs with FA was confirmed by the visible absorption spectra of the conjugates, where the absorption peaks of both VP and FA were observed (Figure 3A). The absorption feature at 270 nm in FA-PLGA-VP corresponded to the peak of pure FA at 280 nm with the spectral shift attributed to the underlying slope in the FA-PLGA-VP spectrum. This conjugation was additionally verified by the FTIR spectra as shown in Figure 3B. A detailed analysis of FTIR peaks for FA, PLGA and FA-PLGA-VP is provided in the “Supplementary materials” section.
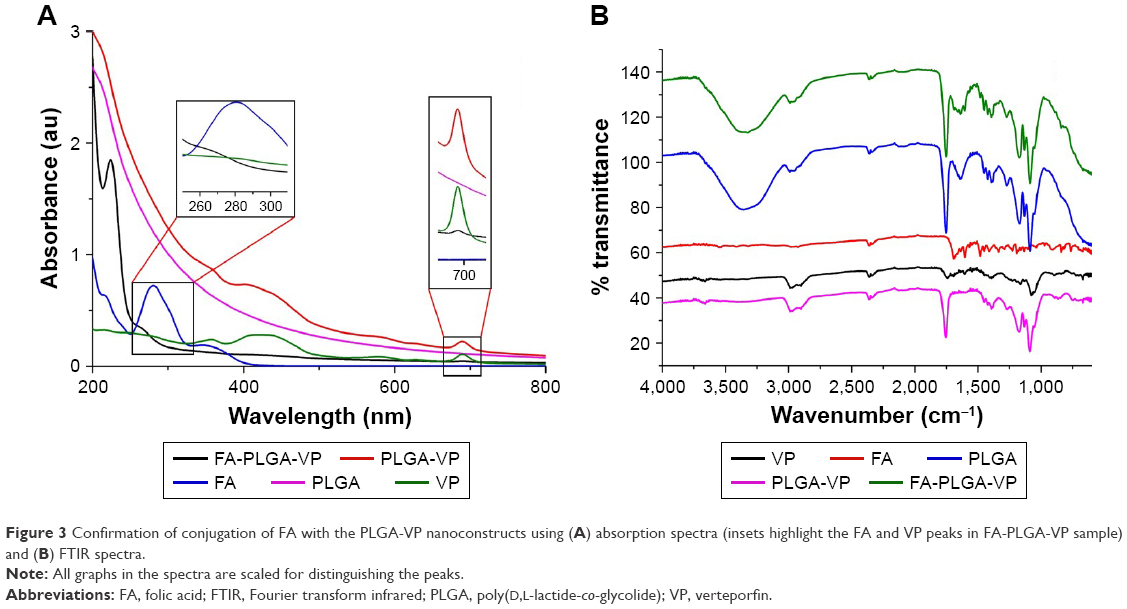 | Figure 3 Confirmation of conjugation of FA with the PLGA-VP nanoconstructs using (A) absorption spectra (insets highlight the FA and VP peaks in FA-PLGA-VP sample) and (B) FTIR spectra. |
Cellular uptake of FA-PLGA-VP nanoconstructs and colocalization between nanoconstructs and different cell organelles
To achieve the increased cellular uptake of NPs and target the FRs overexpressed in HCT116 cells, the PLGA-VP NPs were conjugated with FA using the EDC-NHS reaction. Figure 4 shows the confocal microscopy images of the uptake of FA-PLGA-VP conjugates by HCT116 cells at different incubation times. The uptake was monitored under two different conditions with and without FA blocking. As shown in Figure 4A, without the blocking of FRs, the red signal from VP was clearly observed after 1 h incubation with the conjugates. After 3 h incubation, most of nanoconstructs were taken up by cells, significantly increasing the red signal. We also evaluated the targeting property of the FA-PLGA-VP construct by blocking the FR overexpressed by HCT116 cells before incubation with conjugates. In this study, free FA molecules were used to block the FRs.57 Figure 4B shows red fluorescence from VP molecules after 0.5 h, 1 h and 3 h of incubation. Even after 3 h of incubation, the red signal from VP was much weaker (Figure 4B) compared with the signal without blocking (Figure 4A). These results indicate that FA-PLGA-VP conjugates were taken up by HCT116 cells via the FR-mediated endocytosis pathway.
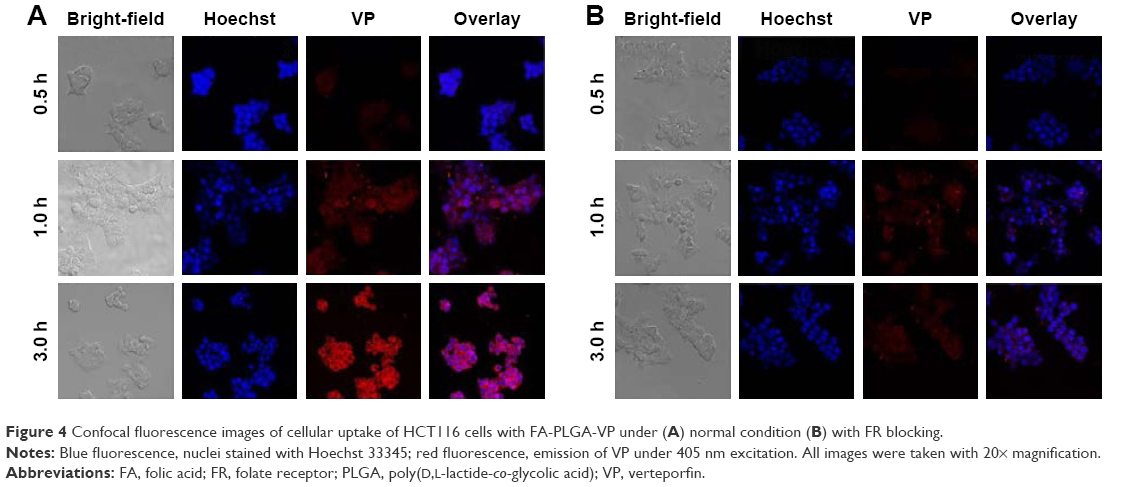 | Figure 4 Confocal fluorescence images of cellular uptake of HCT116 cells with FA-PLGA-VP under (A) normal condition (B) with FR blocking. |
Mitochondria are the main organelles implicated in cancer cell killing in antitumor PS therapy.58–61 To maximize the efficiency of PDT, the PSs should be spatially localized within the short (20 nm) diffusion distance of ROS in biological media.62 This proximity is shown in Figure 5, where the red signal from VP almost overlaps with the green signal from the MitoTracker, indicating that most of the released VPs were located at the mitochondria after 3 h of incubation.
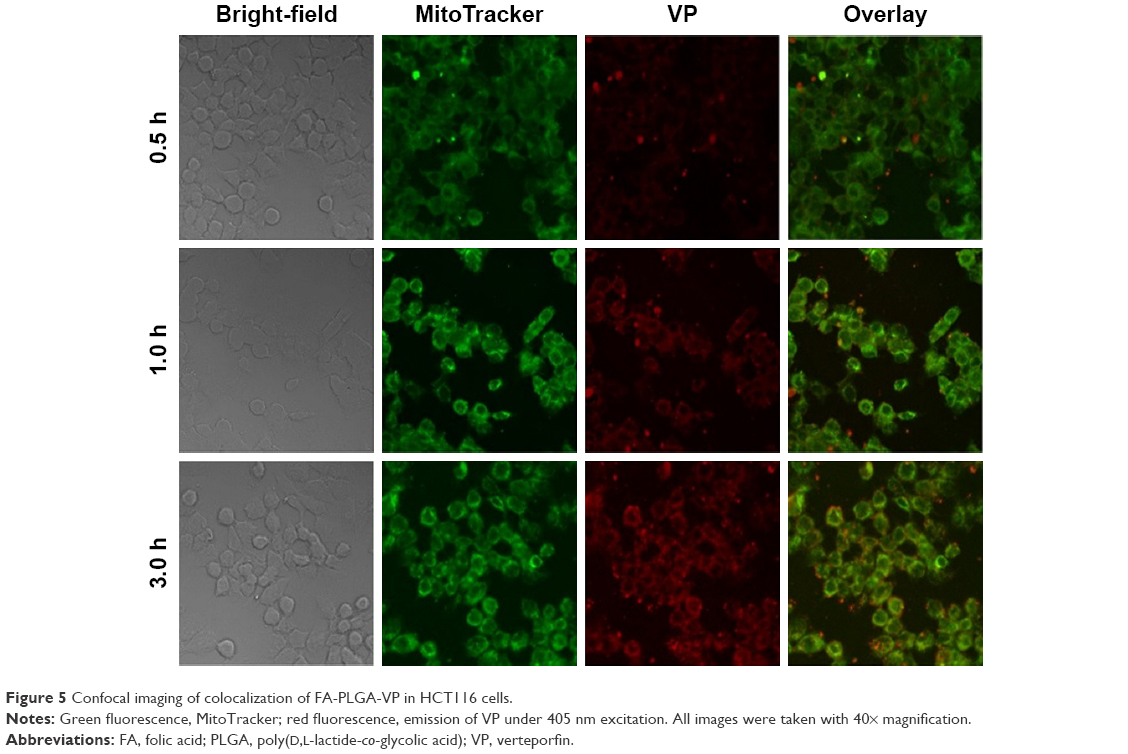 | Figure 5 Confocal imaging of colocalization of FA-PLGA-VP in HCT116 cells. |
We further quantitatively analyzed such colocalization by using the ImageJ software (https://imagej.en.softonic.com). As shown in Figure 6, the white/gray areas in the Costes map indicate the overlay of pixels of green color from the MitoTracker and red color from VP. A small number of white spots were observed after 0.5 h of incubation, indicating that some NPs were localized in the mitochondria. However, the white signal was significantly enhanced after 3 h of incubation, which means that most of the NPs were colocalized with the mitochondria.
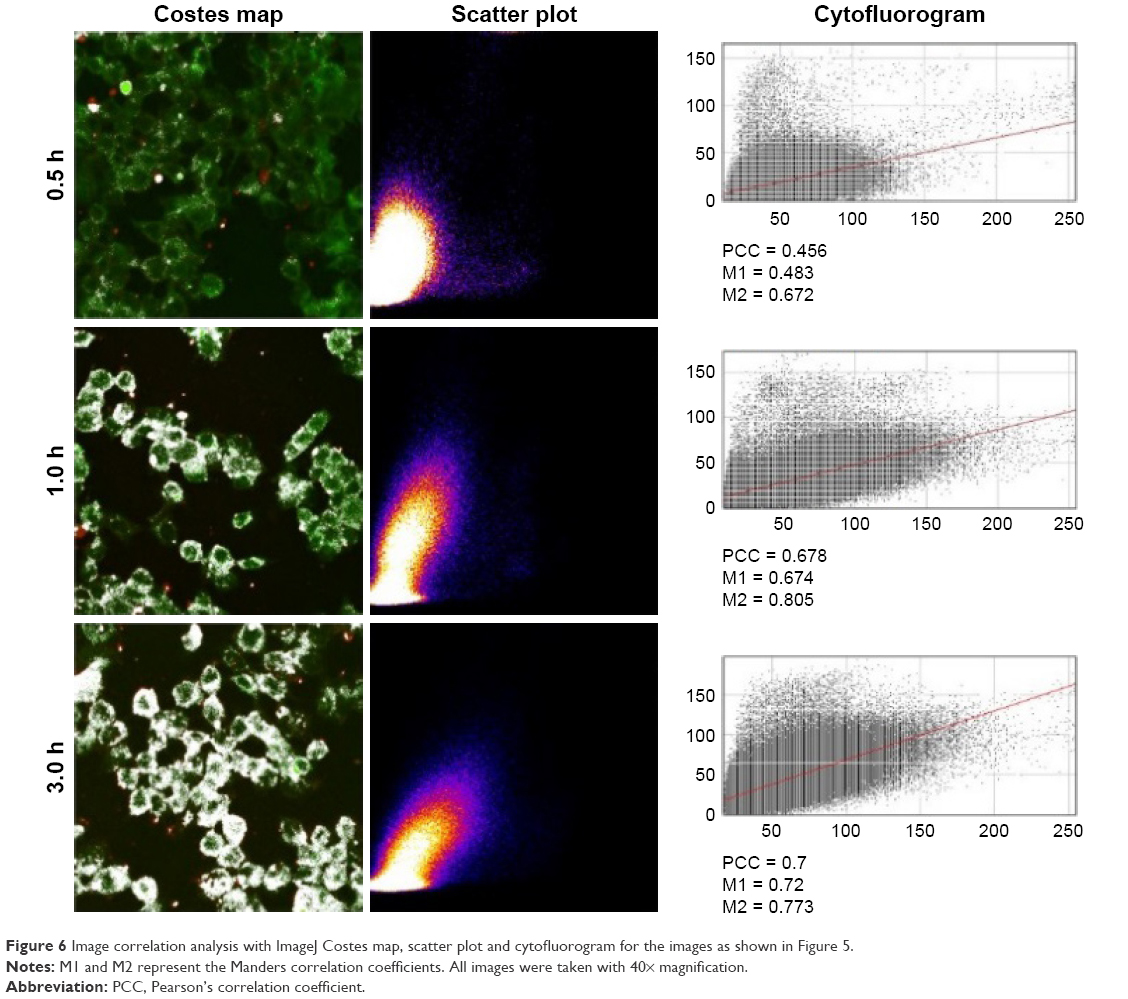 | Figure 6 Image correlation analysis with ImageJ Costes map, scatter plot and cytofluorogram for the images as shown in Figure 5. |
These results were also confirmed by a scatter plot (middle panel) and cytofluorogram (Figure 6, right side panel). An increase in Pearson value and Manders coefficient indicates a good correlation between the MitoTracker fluorescence and VP fluorescence.63,64 In addition to mitochondria, the colocalization between FA-PLGA-VP and another organelle, lysosomes, was also documented and analyzed (Supplementary materials). The Pearson correlation coefficient (PCC) for the lysosomes for 3 h of incubation (0.443) is much smaller than that obtained from colocalization between the NPs and mitochondria (0.7), which again confirms the localization of VP in the mitochondria rather than in lysosomes. This suggested that most of the NPs have escaped from the lysosomal compartments and eventually reached the mitochondria where they responded to photosensitization following irradiation. These results are in good agreement with previously published results for cellular localization of VP.65,66
Cellular PDT with X-ray radiation
As discussed earlier, based on the singlet oxygen generation capability of PLGA-VP samples with different VP concentrations, we selected sample 3 for further surface conjugation with FA and cellular PDT using X-ray radiation in HCT116 cells prior to X-ray-triggered PDT; the viability of HCT116 and colon epithelial cells (CCD 841 CoN) incubated with PLGA, PLGA-VP and FA-PLGA-VP was evaluated (Supplementary materials). We also demonstrated the PDT effect on HCT116 cells incubated with FA-PLGA-VP under 690 nm irradiation (Supplementary materials).
Of particular interest, in this study, the results of cell viability in HCT116 and CCD 841 CoN cells are exposed to our conjugates in combination (Figure 7A); CCD 841 CoN cells were not visibly affected by X-ray radiation (>96%), while the viability of HCT116 cells was reduced with different doses with a decrease of 78% at 4 Gy radiation. The reduced viability of HCT116 cells under radiation may be due to their higher degree of dysregulation than normal cells and/or to different cell types. Figure 7B shows the viability of cancer cells after treatment with NPs and radiation. By comparing Figure 7A and B, it can be seen that the 4 Gy radiation alone can kill 22% of the cancer cells, whereas 67% of the cells were killed by a combination of radiation and FA-PLGA-VP constructs in these cells. This supports our hypothesis that X-ray-mediated PDT can enhance the cell-killing effect by exciting the PS drug encapsulated in the NPs compared with radiation alone. The likely mechanism for the singlet oxygen generation in this X-ray PDT is explained in the “Introduction” section as well as in the “Singlet oxygen generation under 6 MeV X-ray radiation” section. In addition, there is a possibility of lower energy electrons to interact with the biomolecules, including DNA.67 This kind of interaction can disrupt the DNA structure causing cell death.68 Radiosensitizing effects of this type were reported for other porphyrin-type compounds such as photofrin II (PII), (hematoporphyrin) dimethyl ether (HPde) and hematoporphyrin derivative (HPD) in various cancer cell lines.69,70
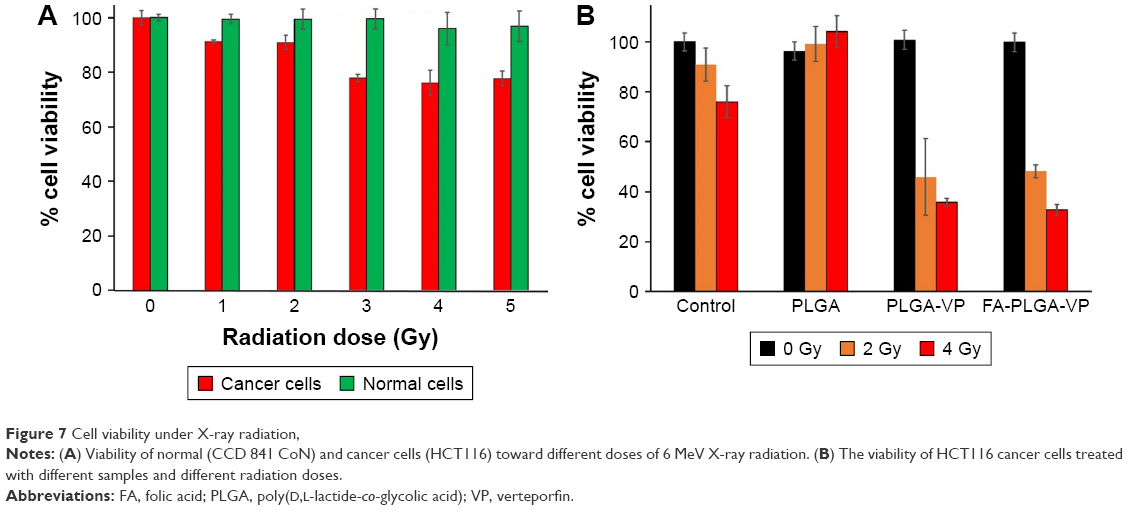 | Figure 7 Cell viability under X-ray radiation, |
Our results of cell viability post PDT were comparable with earlier published study in X-ray and Cherenkov-mediated PDT. These earlier studies included our own study on CeF3 NP conjugated with VP, where NP acted as an energy transducer for X-ray radiation and generated visible radiation to activate the PS to generate ROS.35 In this study, we were able to kill 30% of Panc-1 cells with a 6 MeV X-ray with 6 Gy of radiation. In another study, >60% human glioblastoma cells (U87MG) were killed with PDT by using silica NPs incorporating SrAl2O4:Eu2+ and the PS MC540 under 1.5 Gy of X-ray radiation.39 These values are comparable with our current study where >65% of the cells were killed by FA-PLGA-VP nanoconjugate under 4 Gy dose of 6 MeV X-ray radiation. By comparison, 80% breast cancer cells (4T1) were damaged by the use of a radionuclide zirconium-89 (20 μCi, 909 keV, half-life: 78.4 h) and 20 μM chlorin e6 PS.38 A similar study on Cherenkov-assisted radiotherapy on human fibrosarcoma (HT 1080) cells with TiO2-Tf nanoconstructs was reported using 18F (0.2 mCi/0.1 mL, 633 keV, half-life: 1.83 h) and 64Cu radionuclides (0.5 mCi/0.1 mL, 574 keV, half-life: 12.7 h).37 In both these cases, a significant cell killing (>75%) was achieved. While these NP systems may be novel from a materials science perspective, their potential for translation to clinical use is currently unclear due to the lack of rigorous evaluation of their toxicity. Unlike previous study reported by other groups, our PLGA NPs and VP have been approved by FDA and are widely used in the clinical practice. Therefore, our results described in this study lay the foundations for a safe treatment modality, which is suitable for rapid translation to the clinic.
Conclusion
We have developed PLGA-VP NPs for efficient singlet oxygen generation by 6 MeV X-ray radiation. The successful conjugation of FA with the surface of PLGA-VP NPs enhanced cellular uptake, which was confirmed by confocal microscopy images and colocalization analysis between NPs and mitochondria. Such NPs also demonstrated high stability by monitoring the VP release profile during certain time period. In vitro PDT assays suggest that the conjugates effectively kill HCT116 cells in the presence 6 MeV X-ray radiation. In X-ray radiation, the 6 MeV X-ray radiation from LINAC produces energetic secondary electrons and Cherenkov radiation in the samples, which in turn excite the VP molecules. Therefore, a stronger cytotoxic effect was observed as a result of combined radiation therapy with PDT. This X-ray-triggered PDT concept in combination with targeting ability of FA-PLGA-VP nanoconstructs offers a potential for treating deep-seated tumors with additionally enhanced cancer cell selectivity and reduced side effects to normal cells.
Acknowledgments
We acknowledge Ms Suzanne Lindsay, Manager, Microscopy Unit, Faculty of Science and Engineering at Macquarie University for helping us with the TEM images. We thank Mr Vaughan Moutrie and Mr Daniel Santos from Genesis Cancer Care for helping us with X-ray radiation experiments. We acknowledge PhD student Fei Wang from the Centre of Excellence for Nanoscale BioPhotonics at Macquarie University for supplying us with the cell lines. Wenjie Chen acknowledges the support of an iMQRES scholarship and the HDR budget from Macquarie University. This study is partially supported by Australian Research Council (ARC) through its Centre of Excellence Scheme (CE140100003) to EMG.
Disclosure
The authors report no conflicts of interest in this work.
References
Brown SB, Brown EA, Walker I. The present and future role of photodynamic therapy in cancer treatment. Lancet Oncol. 2004;5(8):497–508. | ||
Ferreira-Strixino J, Debefve E. Photodynamic therapy in cancer treatment. In: de Freitas PM, Simões A, editors. Lasers in Dentistry: Guide for Clinical Practice. Hoboken: John Wiley & Sons, Inc.; 2015:346–350. | ||
Clement S, Sobhan M, Deng W, Camilleri E, Goldys EM. Nanoparticle-mediated singlet oxygen generation from photosensitizers. J Photochem Photobiol A. 2017;332:66–71. | ||
Nyman ES, Hynninen PH. Research advances in the use of tetrapyrrolic photosensitizers for photodynamic therapy. J Photochem Photobiol B. 2004;73(1–2):1–28. | ||
Wilson BC. Photodynamic therapy for cancer: principles. Can J Gastroenterol Hepatol. 2002;16:393–396. | ||
Allison RR, Downie GH, Cuenca R, Hu X-H, Childs CJ, Sibata CH. Photosensitizers in clinical PDT. Photodiagnosis Photodyn Ther. 2004;1:27–42. | ||
Zenkevich E, Sagun E, Knyukshto V, et al. Photophysical and photochemical properties of potential porphyrin and chlorin photosensitizers for PDT. J Photochem Photobiol B. 1996;33:171–180. | ||
Nyokong T, Ahsen V. Photosensitizers in Medicine, Environment, and Security. Berlin: Springer Science & Business Media; 2012. | ||
Olivo M, Bhuvaneswari R, Lucky SS, Dendukuri N, Soo-Ping Thong P. Targeted therapy of cancer using photodynamic therapy in combination with multi-faceted anti-tumor modalities. Pharmaceuticals (Basel). 2010;3(5):1507–1529. | ||
Brannon-Peppas L, Blanchette JO. Nanoparticle and targeted systems for cancer therapy. Adv Drug Deliv Rev. 2004;56(11):1649–1659. | ||
Beyer W. Systems for light application and dosimetry in photodynamic therapy. J Photochem Photobiol B. 1996;36(2):153–156. | ||
Peer D, Karp JM, Hong S, Farokhzad OC, Margalit R, Langer R. Nanocarriers as an emerging platform for cancer therapy. Nat Nanotechnol. 2007;2(12):751–760. | ||
Li S-Y, Cheng H, Qiu W-X, et al. Cancer cell membrane-coated biomimetic platform for tumor targeted photodynamic therapy and hypoxia-amplified bioreductive therapy. Biomaterials. 2017;142:149–161. | ||
Sun Y, Hu H, Zhao N, et al. Multifunctional polycationic photosensitizer conjugates with rich hydroxyl groups for versatile water-soluble photodynamic therapy nanoplatforms. Biomaterials. 2017;117:77–91. | ||
Chatterjee DK, Fong LS, Zhang Y. Nanoparticles in photodynamic therapy: an emerging paradigm. Adv Drug Deliv Rev. 2008;60(15):1627–1637. | ||
Idris NM, Gnanasammandhan MK, Zhang J, Ho PC, Mahendran R, Zhang Y. In vivo photodynamic therapy using upconversion nanoparticles as remote-controlled nanotransducers. Nat Med. 2012;18(10):1580–1585. | ||
Cheng Y, Meyers JD, Broome A-M, Kenney ME, Basilion JP, Burda C. Deep penetration of a PDT drug into tumors by noncovalent drug-gold nanoparticle conjugates. J Am Chem Soc. 2011;133(8):2583–2591. | ||
Bala I, Hariharan S, Kumar MR. PLGA nanoparticles in drug delivery: the state of the art. Crit Rev Ther Drug Carrier Syst. 2004;21(5):387–422. | ||
Gregoriadis G, Swain C, Wills E, Tavill A. Drug-carrier potential of liposomes in cancer chemotherapy. Lancet. 1974;1(7870):1313–1316. | ||
Lü J-M, Wang X, Marin-Muller C, et al. Current advances in research and clinical applications of PLGA-based nanotechnology. Expert Rev Mol Diagn. 2009;9(4):325–341. | ||
Athanasiou KA, Niederauer GG, Agrawal CM. Sterilization, toxicity, biocompatibility and clinical applications of polylactic acid/polyglycolic acid copolymers. Biomaterials. 1996;17(2):93–102. | ||
Gentile P, Chiono V, Carmagnola I, Hatton PV. An overview of poly (lactic-co-glycolic) acid (PLGA)-based biomaterials for bone tissue engineering. Int J Mol Sci. 2014;15(3):3640–3659. | ||
Cu Y, Saltzman WM. Controlled surface modification with poly (ethylene) glycol enhances diffusion of PLGA nanoparticles in human cervical mucus. Mol Pharm. 2008;6(1):173–181. | ||
Sharon JBL. Surface Modification of PLGA Biomaterials for Site-Directed Immobilization of Growth Factors [master’s thesis]. Lexington: University of Kentucky; 2005. | ||
Matsumura Y, Maeda H. A new concept for macromolecular therapeutics in cancer chemotherapy: mechanism of tumoritropic accumulation of proteins and the antitumor agent smancs. Cancer Res. 1986;46(12 Pt 1):6387–6392. | ||
Acharya S, Sahoo SK. PLGA nanoparticles containing various anticancer agents and tumour delivery by EPR effect. Adv Drug Deliv Rev. 2011;63(3):170–183. | ||
Maeda H, Bharate G, Daruwalla J. Polymeric drugs for efficient tumor-targeted drug delivery based on EPR-effect. Eur J Pharm Biopharm. 2009;71(3):409–419. | ||
Cheng J, Teply BA, Sherifi I, et al. Formulation of functionalized PLGA–PEG nanoparticles for in vivo targeted drug delivery. Biomaterials. 2007;28(5):869–876. | ||
Makadia HK, Siegel SJ. Poly lactic-co-glycolic acid (PLGA) as biodegradable controlled drug delivery carrier. Polymers (Basel). 2011;3(3):1377–1397. | ||
Bivas-Benita M, Romeijn S, Junginger HE, Borchard G. PLGA–PEI nanoparticles for gene delivery to pulmonary epithelium. Eur J Pharm Biopharm. 2004;58(1):1–6. | ||
Panyam J, Labhasetwar V. Biodegradable nanoparticles for drug and gene delivery to cells and tissue. Adv Drug Deliv Rev. 2003;55(3):329–347. | ||
Castillo JJ, Rindzevicius T, Novoa LV, et al. Non-covalent conjugates of single-walled carbon nanotubes and folic acid for interaction with cells over-expressing folate receptors. J Mater Chem B. 2013;1:1475–1481. | ||
Bhattacharya R, Patra CR, Earl A, et al. Attaching folic acid on gold nanoparticles using noncovalent interaction via different polyethylene glycol backbones and targeting of cancer cells. Nanomedicine. 2007;3:224–238. | ||
Zhang Y, Zhou J, Yang C, et al. Folic acid-targeted disulfide-based cross-linking micelle for enhanced drug encapsulation stability and site-specific drug delivery against tumors. Int J Mol Med. 2016;11:1119–1130. | ||
Clement S, Deng W, Camilleri E, Wilson BC, Goldys EM. X-ray induced singlet oxygen generation by nanoparticle-photosensitizer conjugates for photodynamic therapy: determination of singlet oxygen quantum yield. Sci Rep. 2016;6:19954. | ||
Misawa M, Takahashi J. Generation of reactive oxygen species induced by gold nanoparticles under x-ray and UV Irradiations. Nanomedicine. 2011;7(5):604–614. | ||
Kotagiri N, Sudlow GP, Akers WJ, Achilefu S. Breaking the depth dependency of phototherapy with Cherenkov radiation and low-radiance-responsive nanophotosensitizers. Nat Nanotechnol. 2015;10(4):370–379. | ||
Kamkaew A, Cheng L, Goel S, et al. Cherenkov radiation induced photodynamic therapy using Chlorin e6-loaded hollow mesoporous silica nanoparticles. ACS Appl Mater Interfaces. 2016;8(40):26630–26637. | ||
Chen H, Wang GD, Chuang Y-J, et al. Nanoscintillator-mediated X-ray inducible photodynamic therapy for in vivo cancer treatment. Nano Lett. 2015;15(4):2249–2256. | ||
Ma L, Zou X, Chen W. A new X-ray activated nanoparticle photosensitizer for cancer treatment. J Biomed Nanotechnol. 2014;10(8):1501–1508. | ||
Maurer-Jones MA, Bantz KC, Love SA, Marquis BJ, Haynes CL. Toxicity of therapeutic nanoparticles. Nanomedicine. 2009;4(2):219–241. | ||
Brown DM, Kaiser PK, Michels M, et al. Ranibizumab versus verteporfin for neovascular age-related macular degeneration. N Engl J Med. 2006;355:1432–1444. | ||
Verteporfin in Photodynamic Therapy Study Group. Verteporfin therapy of subfoveal choroidal neovascularization in age-related macular degeneration: two-year results of a randomized clinical trial including lesions with occult with no classic choroidal neovascularization – verteporfin in photodynamic therapy report 2. Am J Ophthalmol. 2001;131(5):541–560. | ||
Chen H, Ahn R, Van den Bossche J, Thompson DH, O’Halloran TV. Folate-mediated intracellular drug delivery increases the anticancer efficacy of nanoparticulate formulation of arsenic trioxide. Mol Cancer Ther. 2009;8(7):1955–1963. | ||
Sudimack J, Lee RJ. Targeted drug delivery via the folate receptor. Adv Drug Deliv Rev. 2000;41(2):147–162. | ||
Glaser AK, Zhang R, Davis SC, Gladstone DJ, Pogue BW. Time-gated Cherenkov emission spectroscopy from linear accelerator irradiation of tissue phantoms. Opt Lett. 2012;37(7):1193–1195. | ||
Ragàs X, Jiménez-Banzo A, Sánchez-García D, Batllori X, Nonell S. Singlet oxygen photosensitisation by the fluorescent probe Singlet Oxygen Sensor Green®. Chem Commun. 2009:2920–2922. | ||
Gollmer A, Arnbjerg J, Blaikie FH, et al. Singlet Oxygen Sensor Green®: photochemical behavior in solution and in a mammalian cell. Photochem Photobiol. 2011;87(3):671–679. | ||
Deng W, Kautzka Z, Chen W, Goldys EM. PLGA nanocomposites loaded with verteporfin and gold nanoparticles for enhanced photodynamic therapy of cancer cells. RSC Adv. 2016;6:112393–112402. | ||
Liu Y, Li K, Pan J, Liu B, Feng S-S. Folic acid conjugated nanoparticles of mixed lipid monolayer shell and biodegradable polymer core for targeted delivery of Docetaxel. Biomaterials. 2010;31(2):330–338. | ||
Patel RH, Wadajkar AS, Patel NL, Kavuri VC, Nguyen KT, Liu H. Multifunctionality of indocyanine green-loaded biodegradable nanoparticles for enhanced optical imaging and hyperthermia intervention of cancer. J Biomed Opt. 2012;17(4):046003. | ||
DeRosa MC, Crutchley RJ. Photosensitized singlet oxygen and its applications. Coord Chem Rev. 2002;233:351–371. | ||
Clement S, Chen W, Anwer AG, Goldys EM. Verteprofin conjugated to gold nanoparticles for fluorescent cellular bioimaging and X-ray mediated photodynamic therapy. Microchim Acta. 2017184(6):1765–1771. | ||
Fonin AV, Sulatskaya AI, Kuznetsova IM, Turoverov KK. Fluorescence of dyes in solutions with high absorbance. Inner filter effect correction. PLoS One. 2014;9(7):e103878. | ||
Bolotovskii BM. Vavilov–Cherenkov radiation: its discovery and application. Phys Uspekhi. 2009;52:1099–1110. | ||
Murphy MP. How mitochondria produce reactive oxygen species. Biochem J. 2009;417(1):1–13. | ||
Geng J, Li K, Ding D, et al. Lipid-PEG-folate encapsulated nanoparticles with aggregation induced emission characteristics: cellular uptake mechanism and two-photon fluorescence imaging. Small. 2012;8(23):3655–3663. | ||
Trachootham D, Alexandre J, Huang P. Targeting cancer cells by ROS-mediated mechanisms: a radical therapeutic approach? Nat Rev Drug Discov. 2009;8(7):579–591. | ||
Hoye AT, Davoren JE, Wipf P, Fink MP, Kagan VE. Targeting mitochondria. Acc Chem Res. 2008;41(1):87–97. | ||
Yu Z, Sun Q, Pan W, Li N, Tang B. A near-infrared triggered nanophotosensitizer inducing domino effect on mitochondrial reactive oxygen species burst for cancer therapy. ACS Nano. 2015;9(11):11064–11074. | ||
Yue C, Yang Y, Zhang C, et al. ROS-responsive mitochondria-targeting blended nanoparticles: chemo-and photodynamic synergistic therapy for lung cancer with on-demand drug release upon irradiation with a single light source. Theranostics. 2016;6(13):2352. | ||
Yuan Y, Liu J, Liu B. Conjugated-polyelectrolyte-based polyprodrug: targeted and image-guided photodynamic and chemotherapy with on-demand drug release upon irradiation with a single light source. Angew Chem Int Ed Engl. 2014;53(28):7163–7168. | ||
Dunn KW, Kamocka MM, McDonald JH. A practical guide to evaluating colocalization in biological microscopy. Am J Physiol Cell Physiol. 2011;300(4):C723–C742. | ||
Adler J, Parmryd I. Quantifying colocalization by correlation: the Pearson correlation coefficient is superior to the Mander’s overlap coefficient. Cytometry A. 2010;77(8):733–742. | ||
Celli JP, Solban N, Liang A, Pereira SP, Hasan T. Verteporfin-based photodynamic therapy overcomes gemcitabine insensitivity in a panel of pancreatic cancer cell lines. Lasers Surg Med. 2011;43(7):565–574. | ||
Runnels J, Chen N, Ortel B, Kato D, Hasan T. BPD-MA-mediated photosensitization in vitro and in vivo: cellular adhesion and beta1 integrin expression in ovarian cancer cells. Br J Cancer. 1999;80(7):946–953. | ||
Baskar R, Dai J, Wenlong N, Yeo R, Yeoh K-W. Biological response of cancer cells to radiation treatment. Front Mol Biosci. 2014;1:24. | ||
Sanche L. Interaction of low energy electrons with DNA: applications to cancer radiation therapy. Radiat Phys Chem. 2016;128:36–43. | ||
Luksiene Z, Labeikyte D, Juodka B, Moan J. Mechanism of radiosensitization by porphyrins. J Environ Pathol Toxicol Oncol. 2006;25(1–2):293–306. | ||
Schaffer M, Schaffer PM, Jori G, et al. Radiation therapy combined with photofrin or 5-ALA: effect on Lewis sarcoma tumor lines implanted in mice. Preliminary results. Tumori. 2002;88(5):407–410. |
Supplementary materials
Singlet oxygen generation at 690 nm irradiation
In this study, we exposed poly(D,L-lactide-co-glycolic acid) (PLGA) nanoparticles (NPs) incorporating verteporfin (VP; samples 1–5 with VP concentrations of 0 μM, 4.5 μM, 15.9 μM, 26.4 μM and 39.6 μM, respectively) to a 690 nm light-emitting diode (LED; 15 mW cm−2) and used singlet oxygen sensor green (SOSG) for the detection of the generated singlet oxygen. A very weak SOSG fluorescence (maximum at 525 nm at 488 nm excitation) was observed in all samples prior to illumination in agreement with earlier reports. Figure S1A shows increased SOSG fluorescence signals at 525 nm as a function of irradiation time for different samples verifying singlet oxygen generation. The variation of SOSG fluorescence in sample 1 was not clearly observed compared with other samples (samples 2–5), which indicates that pure PLGA does not affect the singlet oxygen generation rate. Among these samples, sample 3 showed the most efficient singlet oxygen generation, and this sample was selected for further folic acid (FA) conjugation and cellular photodynamic therapy (PDT) investigations. Figure S1B shows the percentage increase in SOSG intensity in sample 3 as a function of light exposure time, which was significantly higher compared with sample 1 (pure PLGA). The inset shows the fluorescence spectra of SOSG measured from sample 3 for different irradiation times.
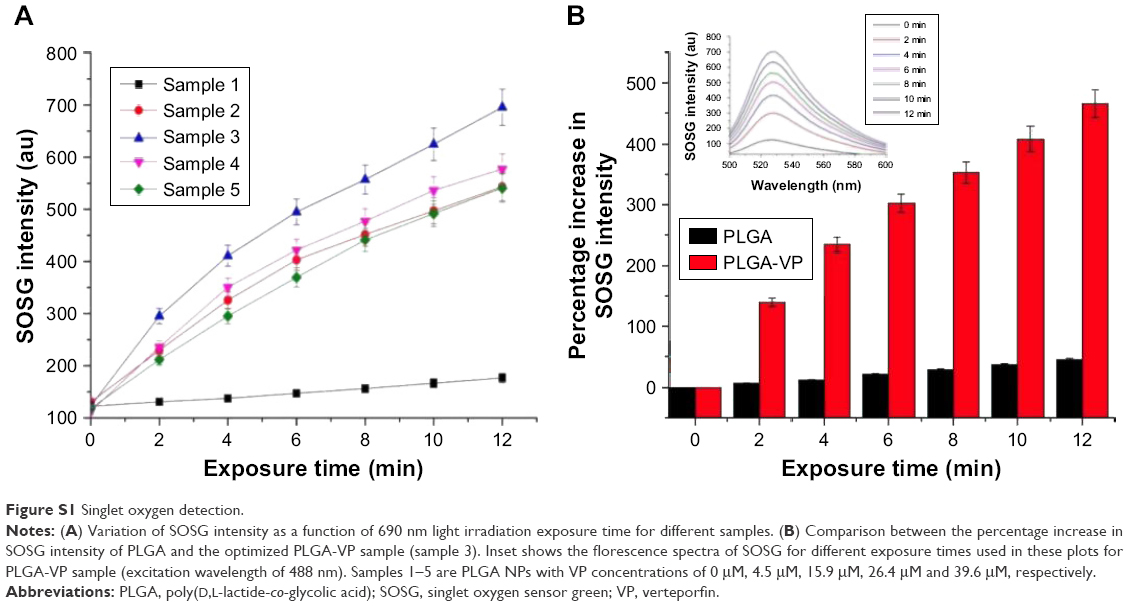 | Figure S1 Singlet oxygen detection. |
Singlet oxygen generation from VP molecules under 6 MeV X-ray radiation
Figure S2A shows the variation of SOSG intensity as a function of radiation dose in the pure SOSG solution and a mixture of SOSG with VP. SOSG alone shows a variation in its intensity with different radiation doses. The intensity variation of SOSG in VP solution is much higher than the SOSG alone. It means that VP is generating singlet oxygen in the presence of radiation. To further confirm that ambient light is not influenced by the measurements, we evaluated singlet oxygen generation from SOSG alone and a mixture of SOSG and VP by exposing samples to 5 Gy radiation in the presence and absence of aluminum (Al) foil. We wrapped the samples with Al foil to keep the samples away from the external ultraviolet (UV) and blue light. Figure S2B shows the SOSG intensity variation under these conditions. With Al foil protection, less singlet oxygen was generated from both SOSG and the mixture sample compared with the scenario in the absence of Al foil. These results indicate that the ambient light does not have any influence on singlet oxygen generation from VP.
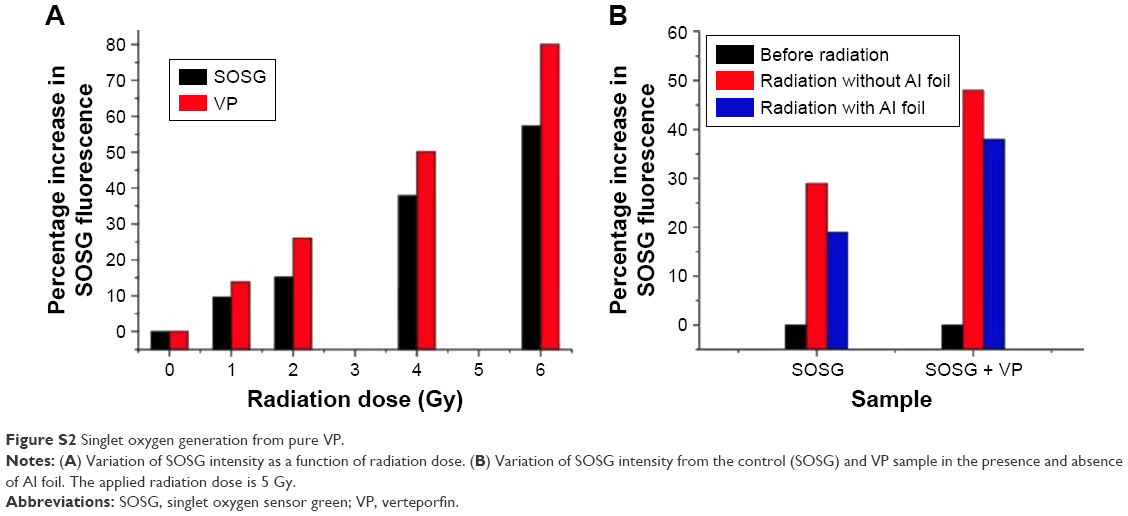 | Figure S2 Singlet oxygen generation from pure VP. |
In vitro VP release from PLGA-VP NPs
We evaluated the in vitro VP release from PLGA-VP NPs under physiological conditions. Figure S3 shows the percentage release of VP from NPs in biological media (phosphate-buffered saline, PBS) with and without the presence of fetal bovine serum (FBS). Very little amount of VP was released with >95% of VP being trapped inside PLGA NPs even after 50 h. In addition, no burst release was observed during early hours of incubation. We attributed this stability to the hydrophobic nature of the VP molecules, which allowed the drug to stay inside the PLGA matrix rather than leaking to the surrounding environment. These results indicate that the as-prepared PLGA-VP sample (sample 3) is highly stable in biological conditions.
 | Figure S3 Percentage release of VP molecules from PLGA-VP sample as a function of time under different serum conditions (FBS 0% and FBS 10%). |
FA conjugation
Figure S4 shows the Fourier transform infrared (FTIR) spectra of VP, FA, PLGA and PLGA-VP-FA nanoconstruct. The characteristic peaks of both FA and PLGA are highlighted.1,2 They were also observed in the spectra of FA-PLGA-VP nanoconstructs with a slight shift compared with pure PLGA and FA (Figure S4). The FTIR peaks in pure FA (3,324 cm-1, 2,923 cm-1, 1,603 cm-1 and 1,189 cm-1) were also observed in FA-PLGA-VP albeit with a slight shift (3,329 cm-1, 2,942 cm-1 1,600 cm-1 and 1,265 cm-1).
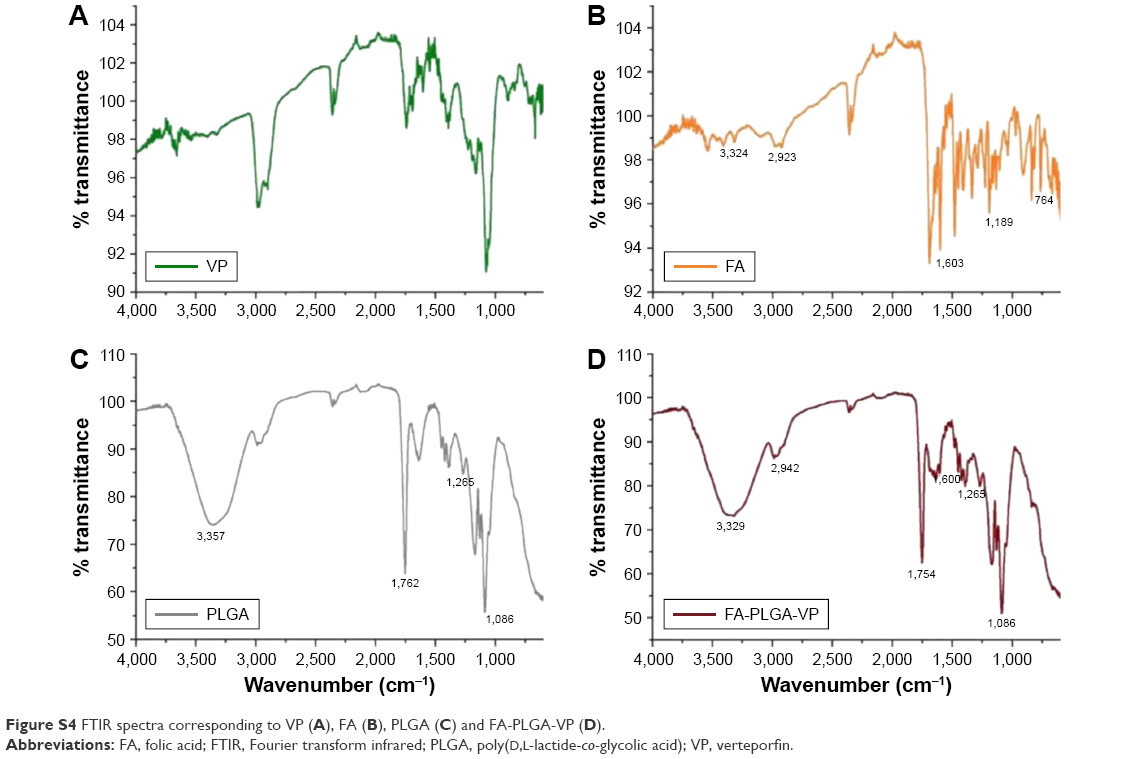 | Figure S4 FTIR spectra corresponding to VP (A), FA (B), PLGA (C) and FA-PLGA-VP (D). |
Colocalization between nanoconstructs and lysosomes
Figure S5 shows the confocal images of colocalization between FA-PLGA-VP nanoconstructs and lysosomes in HCT116 cells. Lysosomes were labeled with LysoTracker™ Red DND-99, product number L7528; Thermo Fisher Scientific, Waltham, MA, USA. To differentiate the color between VP and Lysotracker, the VP fluorescence is shown with artificial green color. Three image analysis methods were conducted to determine the correlation between the red and green color images as shown in Figure S5, and the analysis results are demonstrated in Figure S6. As shown in Figure S6, the correlation was reduced as the incubation time was increased, which was confirmed by both the Pearson and Manders coefficients.
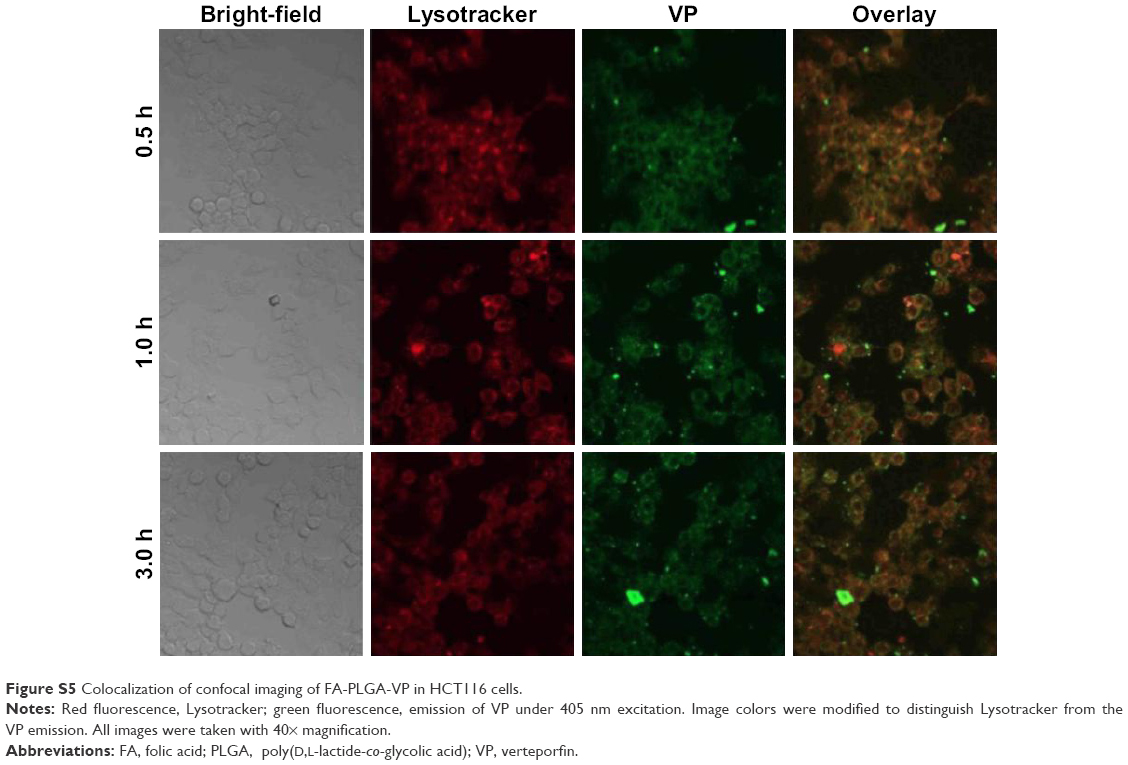 | Figure S5 Colocalization of confocal imaging of FA-PLGA-VP in HCT116 cells. |
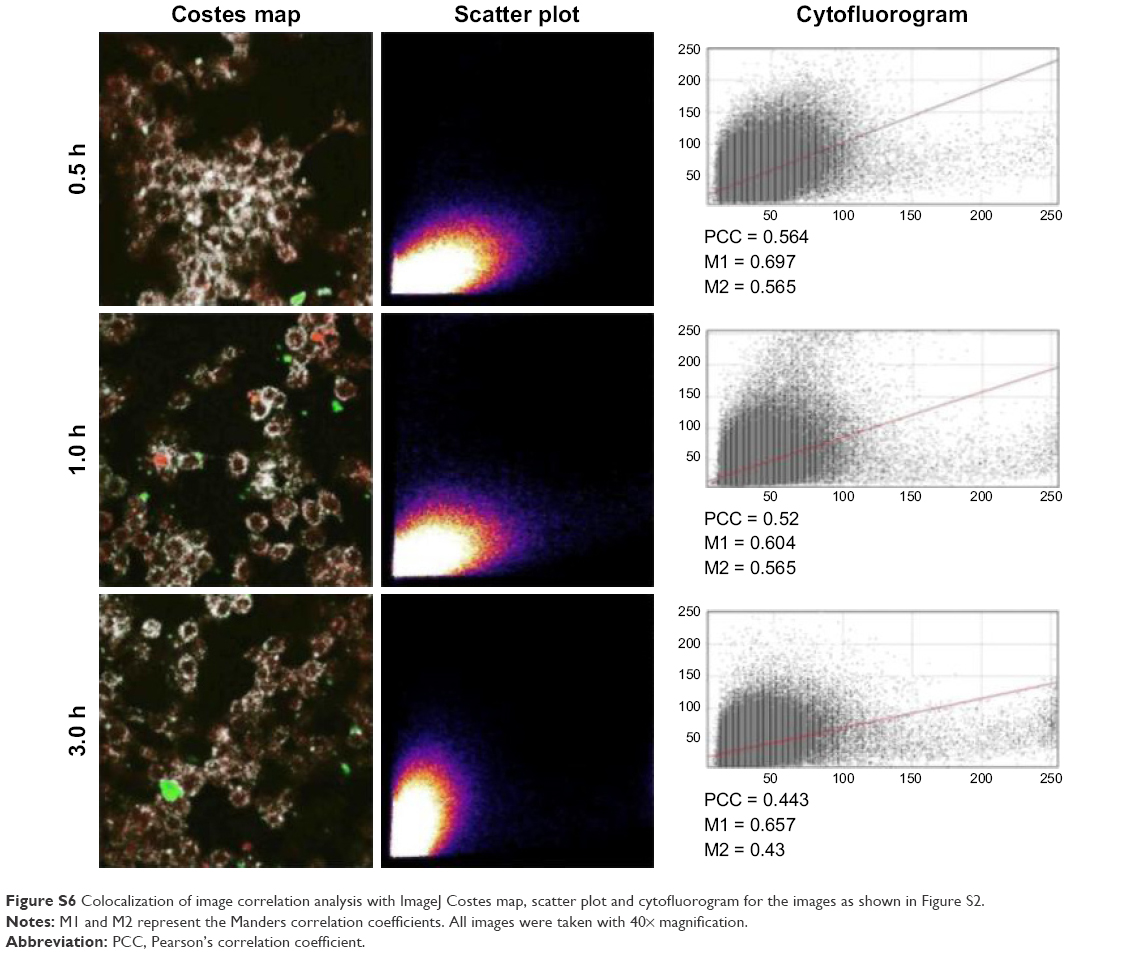 | Figure S6 Colocalization of image correlation analysis with ImageJ Costes map, scatter plot and cytofluorogram for the images as shown in Figure S2. |
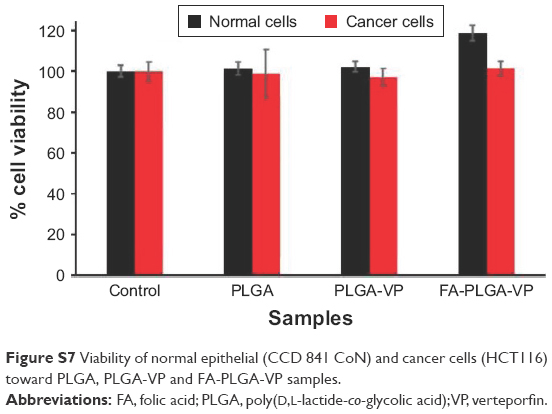
Cytotoxicity of NPs on HCT116 and CCD 841 CoN cells
Figure S7 shows the cellular viability after incubation with different NP samples with the same concentration of PLGA. The viability of both CCD 841 CoN and HCT116 cells was not visibly affected after treatment with >95% viability in all cell samples. Hence, we chose this concentration of NP samples for PDT experiments in this study.
 | Figure S7 Viability of normal epithelial (CCD 841 CoN) and cancer cells (HCT116) toward PLGA, PLGA-VP and FA-PLGA-VP samples. |
PDT with 690 nm irradiation
This section demonstrated the PDT effect on colorectal cancer cell incubated with FA-PLGA-VP under 690 nm irradiation. Figure S8 shows the image of HCT116 cells with different treatments. The PDT effects were analyzed using the live/dead cell kit by differentially staining live and dead cells. The live cells are characterized by their ability to convert nonfluorescent calcein acetoxymethyl ester to fluorescent (green) calcein.3 This calcein remains in the cytoplasm, and its fluorescence can be imaged in laser scanning confocal microscopy at 494 nm excitation. On the other hand, dead cells are permeable, enabling access of ethidium homodimer-1 to the nuclei. Nuclei-bound ethidium homodimer-1 is fluorescent (red) at 528 nm excitation. Figure S8 shows that almost all cells are alive in control cells as well as cells exposed to light. Most of the cells are alive in the FA-PLGA-VP-treated sample, even though there is a red signal from dead cells in the FA-PLGA-VP-treated cells. The FA-PLGA-VP sample treated with 690 nm light shows that most of the cells are dead after 10 min of irradiation. This is due to the fact that FA in the FA-PLGA-VP increased cellular uptake of NPs, whereas 690 nm irradiation triggered the VP in the mitochondria, thereby inducing a stronger cell-killing effect.
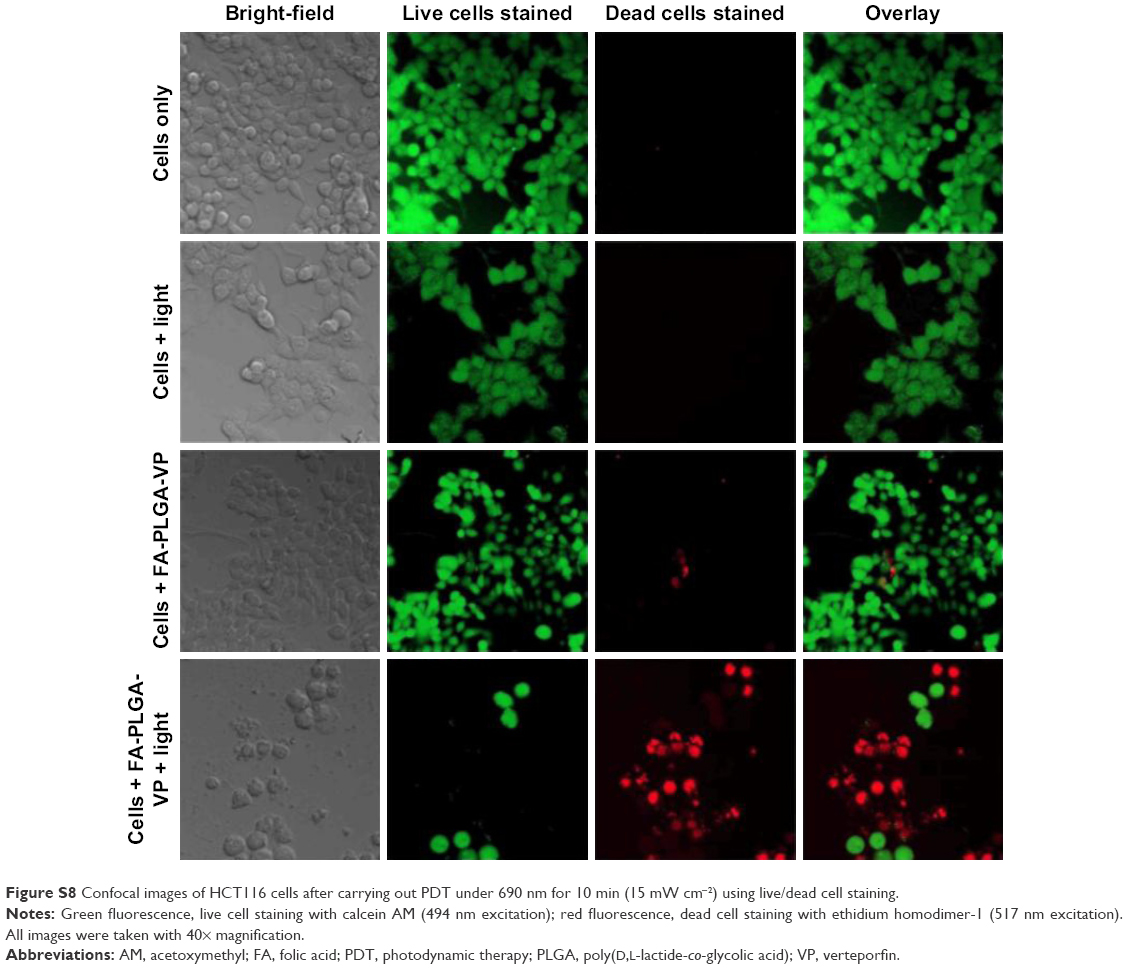 | Figure S8 Confocal images of HCT116 cells after carrying out PDT under 690 nm for 10 min (15 mW cm-2) using live/dead cell staining. |
References
Hu Y, Zhao Z, Ehrich M, Fuhrman K, Zhang C. In vitro controlled release of antigen in dendritic cells using pH-sensitive liposome-polymeric hybrid nanoparticles. Polymer. 2015;80:171–179. | ||
Chandrasekar D, Sistla R, Ahmad FJ, Khar RK, Diwan PV. Folate coupled poly (ethyleneglycol) conjugates of anionic poly (amidoamine) dendrimer for inflammatory tissue specific drug delivery. J Biomed Mater Res A. 2007;82(1):92–103. | ||
Bourke S, Mason HS, Borok Z, Kim K-J, Crandall ED, Kemp PJ. Development of a lung slice preparation for recording ion channel activity in alveolar epithelial type I cells. Respir Res. 2005;6(1):1. |
 © 2018 The Author(s). This work is published and licensed by Dove Medical Press Limited. The full terms of this license are available at https://www.dovepress.com/terms.php and incorporate the Creative Commons Attribution - Non Commercial (unported, v3.0) License.
By accessing the work you hereby accept the Terms. Non-commercial uses of the work are permitted without any further permission from Dove Medical Press Limited, provided the work is properly attributed. For permission for commercial use of this work, please see paragraphs 4.2 and 5 of our Terms.
© 2018 The Author(s). This work is published and licensed by Dove Medical Press Limited. The full terms of this license are available at https://www.dovepress.com/terms.php and incorporate the Creative Commons Attribution - Non Commercial (unported, v3.0) License.
By accessing the work you hereby accept the Terms. Non-commercial uses of the work are permitted without any further permission from Dove Medical Press Limited, provided the work is properly attributed. For permission for commercial use of this work, please see paragraphs 4.2 and 5 of our Terms.