")
Back to Journals » Patient Preference and Adherence » Volume 12
Women’s preferences, willingness-to-pay, and predicted uptake for single-nucleotide polymorphism gene testing to guide personalized breast cancer screening strategies: a discrete choice experiment
Authors Wong XY, Groothuis-Oudshoorn CGM, Tan CS , van Til JA, Hartman M, Chong KJ, IJzerman MJ , Wee HL
Received 17 April 2018
Accepted for publication 28 June 2018
Published 18 September 2018 Volume 2018:12 Pages 1837—1852
DOI https://doi.org/10.2147/PPA.S171348
Checked for plagiarism Yes
Review by Single anonymous peer review
Peer reviewer comments 2
Editor who approved publication: Dr Johnny Chen
Xin Yi Wong,1 Catharina GM Groothuis-Oudshoorn,2 Chuen Seng Tan,3 Janine A van Til,2 Mikael Hartman,3,4 Kok Joon Chong,5 Maarten J IJzerman,2,6,7 Hwee-Lin Wee1,3
1Department of Pharmacy, Faculty of Science, National University of Singapore, Singapore, Republic of Singapore; 2Department of Health Technology and Services Research, Faculty of Behavioural, Management and Social Sciences, Technical Medical Centre, University of Twente, Enschede, The Netherlands; 3Saw Swee Hock School of Public Health, National University of Singapore and National University Health System, Singapore, Republic of Singapore; 4Department of Surgery, Yong Loo Lin School of Medicine, National University of Singapore, Singapore, Republic of Singapore; 5Department of Medicine, Yong Loo Lin School of Medicine, National University of Singapore, Singapore, Republic of Singapore; 6Faculty of Medicine, Dentistry and Health Sciences, University of Melbourne, Melbourne, Australia; 7Victorian Comprehensive Cancer Centre, Melbourne, Australia
Background: Single-nucleotide polymorphism (SNP) gene test is a potential tool for improving the accuracy of breast cancer risk prediction. We seek to measure women’s preferences and marginal willingness-to-pay (mWTP) for this new technology.
Materials and methods: We administered a discrete choice experiment (DCE) to English-speaking Singaporean women aged 40–69 years without any history of breast cancer, enrolled via door-to-door recruitment with quota sampling by age and ethnicity. DCE attributes comprise: 1) sample type (buccal swab and dried blood spot), 2) person conducting pretest discussion (specialist doctor, non-specialist doctor, and nurse educator), 3) test location (private family clinic, public primary-care clinic, and hospital), and 4) out-of-pocket cost (S$50, S$175, and S$300). Mixed logit model was used to estimate the effect of attribute levels on women’s preferences and mWTP. Interactions between significant attributes and respondent characteristics were investigated. Predicted uptake rates for various gene testing scenarios were studied.
Results: A total of 300 women aged 52.6±7.6 years completed the survey (100 Chinese, Malay, and Indian women, respectively). Sample type (P=0.046), person conducting pretest discussion, and out-of-pocket cost (P<0.001) are significantly associated with going for SNP gene testing. Women with higher income and education levels are more willing to pay higher prices for the test. Preferences in terms of mWTP across ethnic groups appear similar, but Chinese women have greater preference heterogeneity for the attributes. Predicted uptake for a feasible scenario consisting of buccal swab, pretest discussion with nurse educator at the hospital costing S$50 is 60.5%. Only 3.3% of women always opted out of the SNP gene test in real life. Reasons include high cost, poor awareness, and indifference toward test results.
Conclusion: SNP gene testing may be tailored according to individual preferences to encourage uptake. Future research should focus on outcomes and cost-effectiveness of personalized breast cancer screening using SNP gene testing.
Keywords: single-nucleotide polymorphisms, gene testing, personalized breast cancer screening, precision medicine, women’s preferences, willingness-to-pay, predicted uptake, discrete choice experiment
Introduction
Breast cancer is a leading cause of morbidity and mortality in women worldwide. In 2015, it reached 2.4 million cases in incidence while accounting for 15.1 million disability-adjusted life years.1 Mammography is currently the best screening tool for breast cancer and is linked to reduction in breast cancer mortality.2 However, with the current one-size-fits-all age-based screening, false positives and overdiagnosis are common.3 Hence, an optimized screening strategy based on individual woman’s risk estimates has been advocated. It is suggested as being more efficient and effective than the age-based approach.4 Under this strategy, women at higher risk may undergo screening more frequently, while women at lower risk may be screened less frequently, allowing for earlier detection of breast cancer in the former and reducing harms associated with excessive screening in the latter.
Several risk stratification tools such as the Tyrer-Cuzick Model5 and the Breast Cancer Screening Consortium Risk Calculator6 are available. Researchers have recommended these tools to be incorporated in screening decisions.7 However, they are limited by moderate discriminatory accuracy.8,9 Recent genome-wide association studies have discovered multiple single-nucleotide polymorphisms (SNPs) in the population that are associated with breast cancer.10–15 Although each SNP confers only low to moderate risk, they occur at higher frequencies than higher-penetrance BRCA mutations.16 When combined into a polygenic risk score (PRS), these SNPs improved the discriminatory accuracy of the existing risk assessment models17,18 and refined risk classification by shifting women at borderline low and high risk into low- and high-risk groups, respectively.19 Hence, risk stratification using PRS information may potentially inform risk-based screening strategies.20
Furthermore, little is known about women perspectives regarding SNP gene testing for breast cancer risk.21–23 Increasingly, regulators such as the United States Food and Drug Administration as well as the European Medicines Agency have been working on incorporating risk–benefit perspectives of patients in regulatory assessments.24,25 Likewise, in the health technology assessment process, the engagement of end-users broadens the perspective of recommendations given to decision makers26 and provides a real-world understanding of the benefits and risks of health technologies and possible future uptake.27
Discrete choice experiments (DCEs) have been used to assess personal preferences, risk–benefit trade-offs and marginal rates of substitution (eg, marginal willingness-to-pay [mWTP]) in breast cancer screening.28–31 This led to better understanding of women’s trade-offs between benefits and costs of screening including intangible ones like false positives and overdiagnosis,28,31 importance of process attributes such as screening time and desire for privacy in influencing screening uptake29 and heterogeneity in preferences according to their socioeconomic background and health status.31 DCEs conducted in cancer gene testing32–35 found that respondents value risk information and surveillance advice much more than assistance with decision making,32 prefer combinations of test characteristics that reflect future genomic testing more closely than current genetic testing33 and value cost and privacy more than reduction in false negatives.35 Yet, preferences for a one-time SNP gene testing to guide personalized screening strategies in breast cancer have not been extensively investigated. Hence, we aimed to estimate women’s preferences and mWTP for the various aspects of SNP gene testing and to predict uptake in a multi-ethnic Singapore population using DCE.
Material and methods
Recruitment and sample size
The study was conducted among women in the Singapore general population in December 2016. Multistage cluster sampling was employed (accompanying details in Supplementary materials). Screening-age women between 40 and 69 years were selected based on pre-specified ethnic quotas. Other eligibility criteria include Singapore citizenship and no prior history of breast cancer. Face-to-face surveys were conducted, and responses were recorded on tablet. All respondents provided written informed consent prior to participation. The study was approved by the National Healthcare Group Domain Specific Review Board (reference number: 2016/00184). Based on the Orme’s Rule of Thumb,36 the minimum sample size required is 75. We aimed for 100 women in each of the three ethnicities, with a total of 300 women. This was planned before the publication of a practical guide on sample size requirements by de Bekker-Grob et al.37
Ethics approval
All procedures performed in studies involving human participants were in accordance with the ethical standards of the institutional and/or national research committee and with the 1964 Helsinki Declaration and its later amendments or comparable ethical standards.
Study measures
Respondents were taken through a two-page explanation on SNP gene testing before completing the DCE. Sociodemographic characteristics, family history of breast cancer, and mammogram screening history were solicited. Respondents received S$30 (~US$23) shopping vouchers as compensation for their time and effort.
DCE construction
As cost was included as one of the characteristics, mWTP can be calculated, to resemble real-world situations where money is spent to obtain improvement in certain characteristics of a good or service. Our DCE was developed based on good research practices.38 Details can be found in Supplementary materials. Input from screening-age women in a qualitative study,39 clinicians, health service researchers, and the literature informed the choice of attributes and their associated levels for the DCE (Table 1). Notably, women in the study expected at least 90% test accuracy, defined as “how accurate the SNPs gene test is, in assessing risk of developing breast cancer,” before they would consider doing the test. They were less concerned about overdiagnosis or false positives. Due to the lack of realistic estimates of risk stratification benefits, for example, proportion of late-stage cancers diagnosed and biopsy rate,40 we did not include them in the DCE.
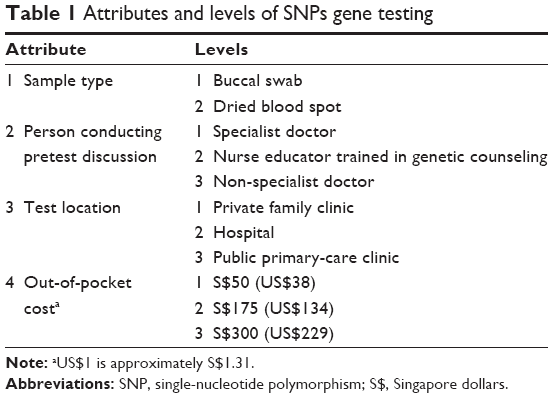 | Table 1 Attributes and levels of SNPs gene testing |
Respondents were presented with a series of choice tasks and asked to choose one out of two alternatives labeled A and B in each task. They were then asked if they would really go for it in real life. This is known as a dual-response none question (closed-ended question in Part B of Figure 1, sample choice task). It prevents overestimation of screening uptake as preference for one option over another does not mean that the preferred option will be endorsed. Reasons for not going for the test were solicited in the open-ended question in Part B.
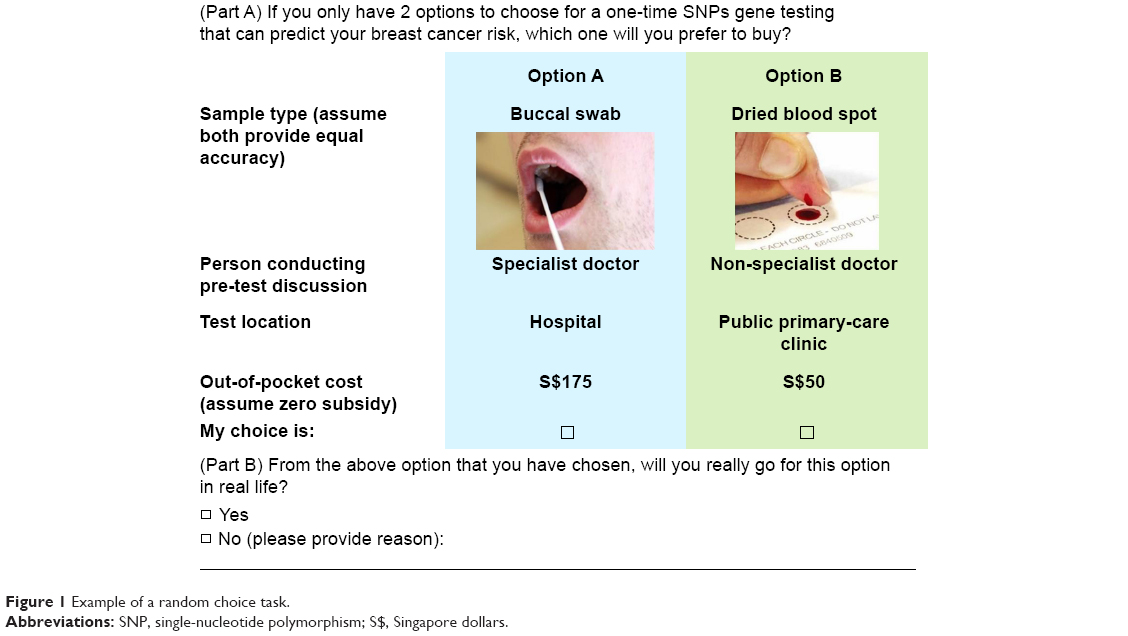 | Figure 1 Example of a random choice task. |
Sawtooth Lighthouse Studio 6.4.4. (Sawtooth Software, Orem, UT, USA) was used to generate 100 unique questionnaire versions, replicated in each of the three ethnicities, each containing one fixed task and 10 choice tasks randomly generated using balanced overlap method. It allowed for moderate attribute level overlap across alternative scenarios and better discrimination when respondents use non-compensatory rules in making decisions between choice alternatives.41 Although this reduced statistical efficiency as the number of levels that were directly compared was reduced, it lightened the cognitive burden on the respondents. A subset of the full-choice design (ie, fractional factorial design) was sampled for each respondent, while ensuring level balance and near-orthogonality within each respondent’s profile.42 It was logically assumed that option A (buccal swab, specialist doctor, hospital, and S$50) would be preferred to option B (dried blood spot, nurse educator, hospital, and S$300) in the first (fixed) task, as revealed in the qualitative study. Hence, respondents who chose option B were excluded out of concerns that their data may be invalid.
Statistical analysis
Women’s preferences
Respondent characteristics were described using counts and percentages for categorical variables and mean (SD) and median (interquartile range) for continuous variables. DCE data were estimated using mixed logit model in the preference space to calculate the part-worth utilities (PWUs) or preference weights for all attribute levels using Stata 14.2 (StataCorp LLC, College Station, TX, USA). Mixed logit was chosen over other models, for example, conditional logit, as it accounts for preference heterogeneity around parameter estimates among respondents, which was observed in our data as indicated by a likelihood ratio test for the joint significance of the standard deviations.43 A main effects model was estimated, with the attribute levels for “sample type,” “person conducting pretest discussion,” and “test location” being effects-coded and “out-of-pocket cost” being coded as a continuous variable, as our data showed a linear relationship with PWU when “out-of-pocket cost” was coded as categorical. Alternative-specific constants (ASC) for choosing the left-sided alternative and not to go for the test in real life (closed-ended question in Part B) were also included in the main effects model. Interactions between significant attribute levels and respondent characteristics were studied to determine the latter’s effect on preferences for the attribute levels. The first category of each characteristic is the reference level (Table 2). The final model was built using forward selection, where all attributes (main effects) were included, and only interaction terms between significant attributes and respondent characteristics (P<0.05) were considered.
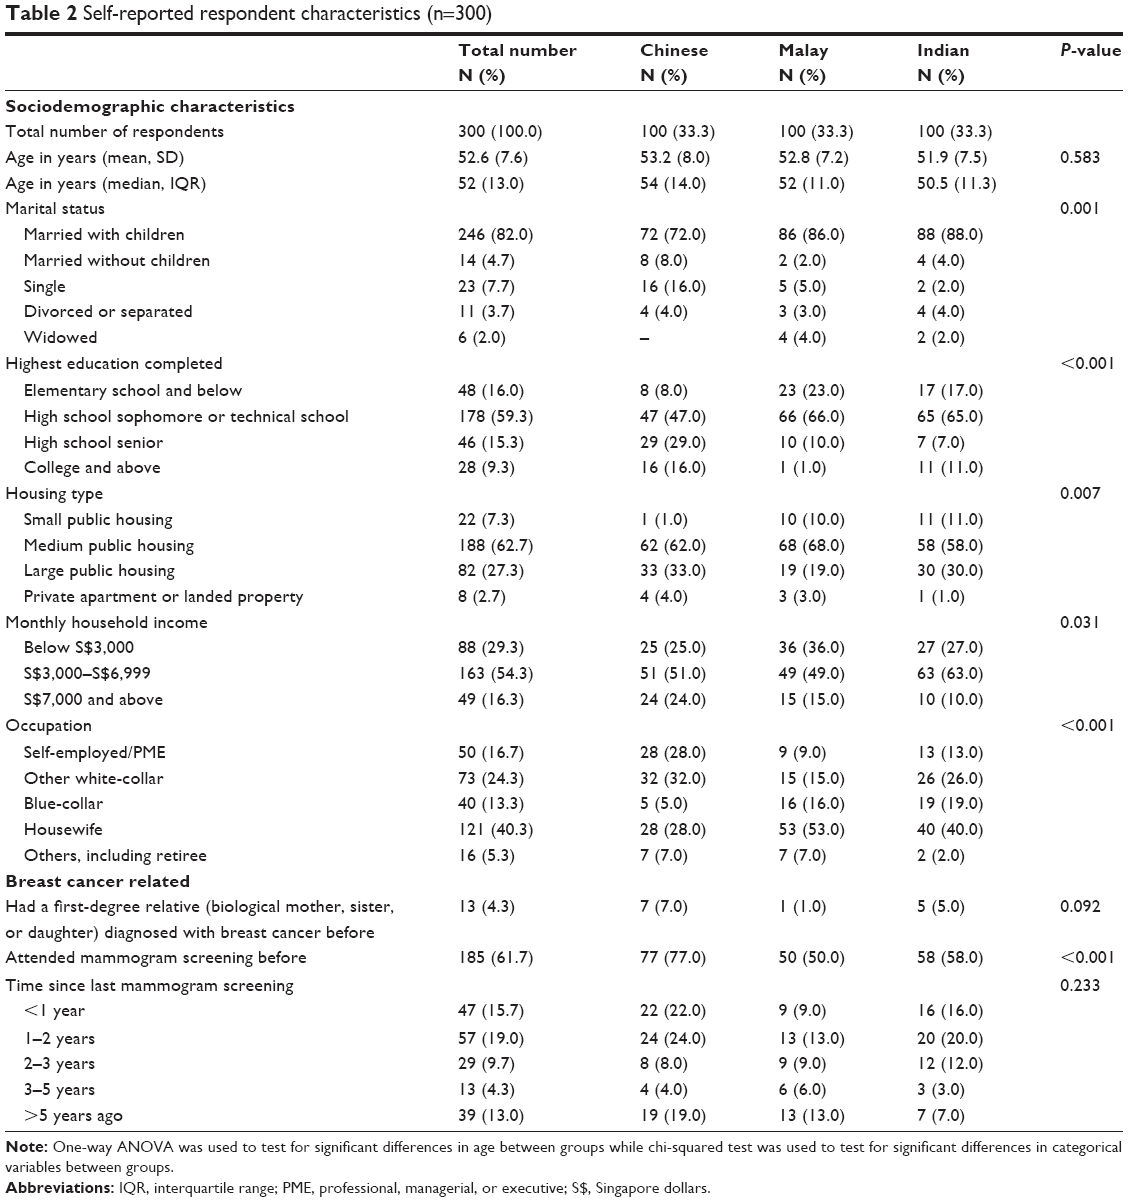 | Table 2 Self-reported respondent characteristics (n=300) |
mWTP
Preferences among the ethnic groups were compared using marginal rates of substitution between out-of-pocket cost and other attributes, which is the same as mWTP. This resulted in normalization of coefficients by eliminating the scale coefficient and allowing direct comparison of preferences across the groups. mWTP of the overall study population was also studied, as it indicates the additional out-of-pocket cost that women are willing to pay in exchange for a more preferred level within an attribute. These were derived by estimating the mixed logit model in WTP space rather than preference space,44 with the cost coefficient being lognormally distributed and all other attribute coefficients being normally distributed. To assess mWTP heterogeneity, individual-level parameters were obtained post-estimation to construct probability density and cumulative density functions.45
Predicted uptake
In budget impact analysis and program planning, one will be interested in predicted uptake. Details on the calculation of predicted uptake using PWU is in Supplementary materials. The mean indirect utility over all possible testing alternatives is fixed at zero. This means that the predicted uptake rates are estimated relative to the uptake rate of the grand mean. Alternatives include a realistic base case scenario reflecting current genetic testing (buccal swab, specialist doctor, hospital, and S$175) and other options that are feasible, cheaper or pricier, and most preferred by the study population.
Dual-response none
Respondent choice in the closed-ended question of Part B (yes or no) was analyzed together with Part A, forming the DCE data. Proportion of women who chose not to undergo SNP gene test in real life at least once or all the time were described using counts and percentages. Responses to the open-ended question of Part B, that is, reasons for not going for the test were analyzed for commonality and coded accordingly, to derive categories of common responses.
Results
Respondent characteristics
A total of 300 women completed the survey (300 out of 598 eligible dwelling units; 50.2% response rate). On average, the respondents took 22.6 minutes (SD: 10.5 minutes) to complete it. Reasons for non-participation included refusal and non-availability for re-appointment. The average age of respondents was 52.6 years (SD 7.6 years). Other respondent characteristics are presented in Table 2.
Women’s preferences and mWTP (n=300)
Parameter estimates for the attribute levels are shown in Table 3. All levels of sample type (P=0.046), person conducting pretest discussion, and out-of-pocket cost are statistically significant (P<0.001), while all levels of test location are nonsignificant. Respondents preferred an SNP gene test that is less invasive (buccal swab), involving a pretest discussion with specialist doctor at a private family clinic. The least preferred combination is a more invasive test (dried blood spot) involving a non-specialist doctor at a public primary-care clinic. There is a positive association between choosing the left-sided alternative and opting for SNP gene testing (P<0.001), reflecting a left-sided bias. However, a comparison between main effects models including and excluding the ASC “Choose left” found that the preference ranking within each attribute is similar except for the test location attribute (Table S1), which is not significantly associated with going for SNP gene testing. In the model that included ASC “Choose left,” private family clinic is most preferred, followed by hospital and public primary-care clinic. In the model that excluded ASC “Choose left,” private family clinic is most preferred, followed by public primary-care clinic and hospital.
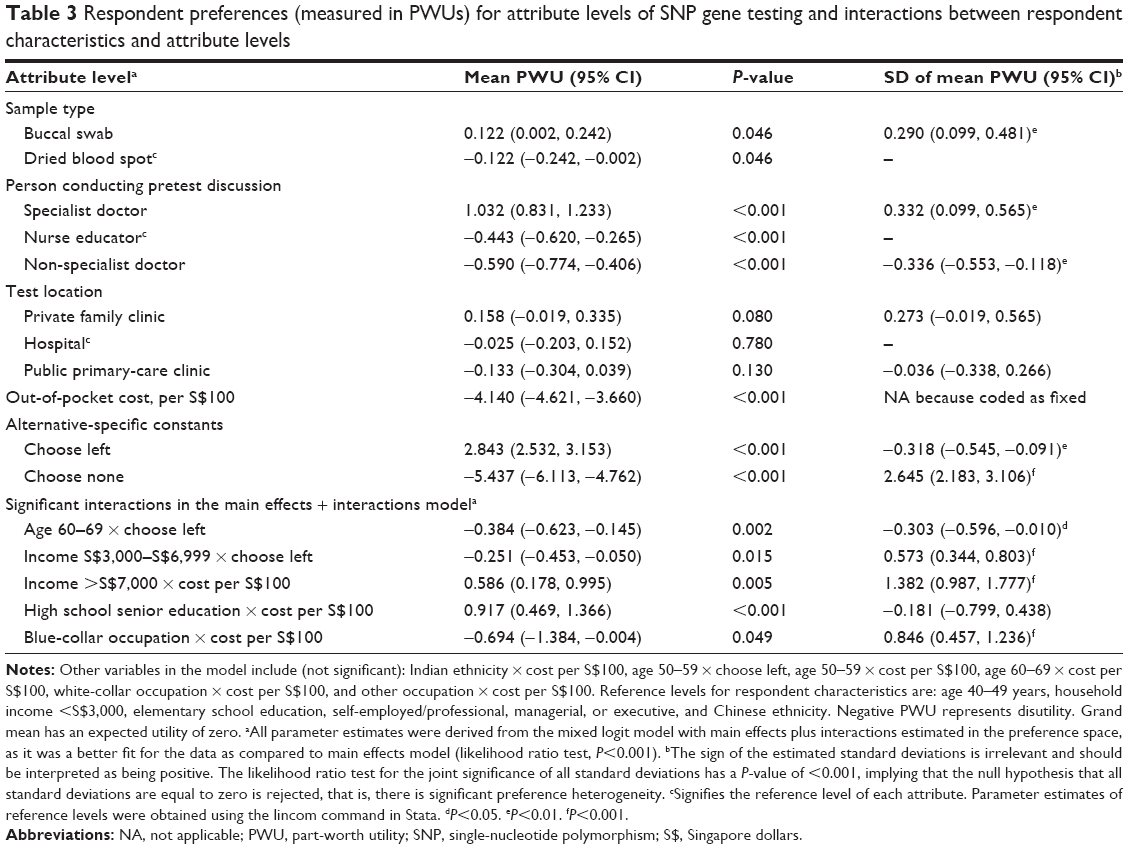 | Table 3 Respondent preferences (measured in PWUs) for attribute levels of SNP gene testing and interactions between respondent characteristics and attribute levels |
Interactions between respondent characteristics and attribute levels are also shown in Table 3. Among four attributes and two ASCs, the interactions are significant only for out-of-pocket cost and ASC “Choose left.” Those with household income >S$7,000 and high school senior education have overall lesser disutility toward out-of-pocket cost (P=0.005 and <0.001, respectively), while blue-collar occupation attached greater disutility to cost (P=0.049). This implies that higher income women and those holding professional, managerial, or executive (PME, reference level) jobs are more willing to pay out-of-pocket than lower income women and blue-collar workers. Women with household income between S$3,000 and S$6,999 and women aged between 60 and 69 years attached lesser utility toward the left-sided alternative (P=0.015 and 0.002, respectively). Except for private family clinic, public primary-care clinic, and the interaction term between high school senior education and cost, we observed that the estimated SD coefficients for all other attribute levels are significant, indicating the presence of preference heterogeneity (Table 3).
Probability density and cumulative density functions of individual mWTP are presented in Figure 2. Women are willing to pay to transit to buccal swab, specialist doctor, and to a lesser degree private family clinic, and not willing to pay for non-specialist doctor and public primary-care clinic, where the mWTP values are less than zero. Respondents are willing to pay the most for the transition from nurse educator to specialist doctor at S$28.39 (95% CI S$25.35, S$31.42) and least willing to pay for the transition from nurse educator to non-specialist doctor at −S$16.53 (95% CI −S$19.18, −S$13.88) (Table 4).
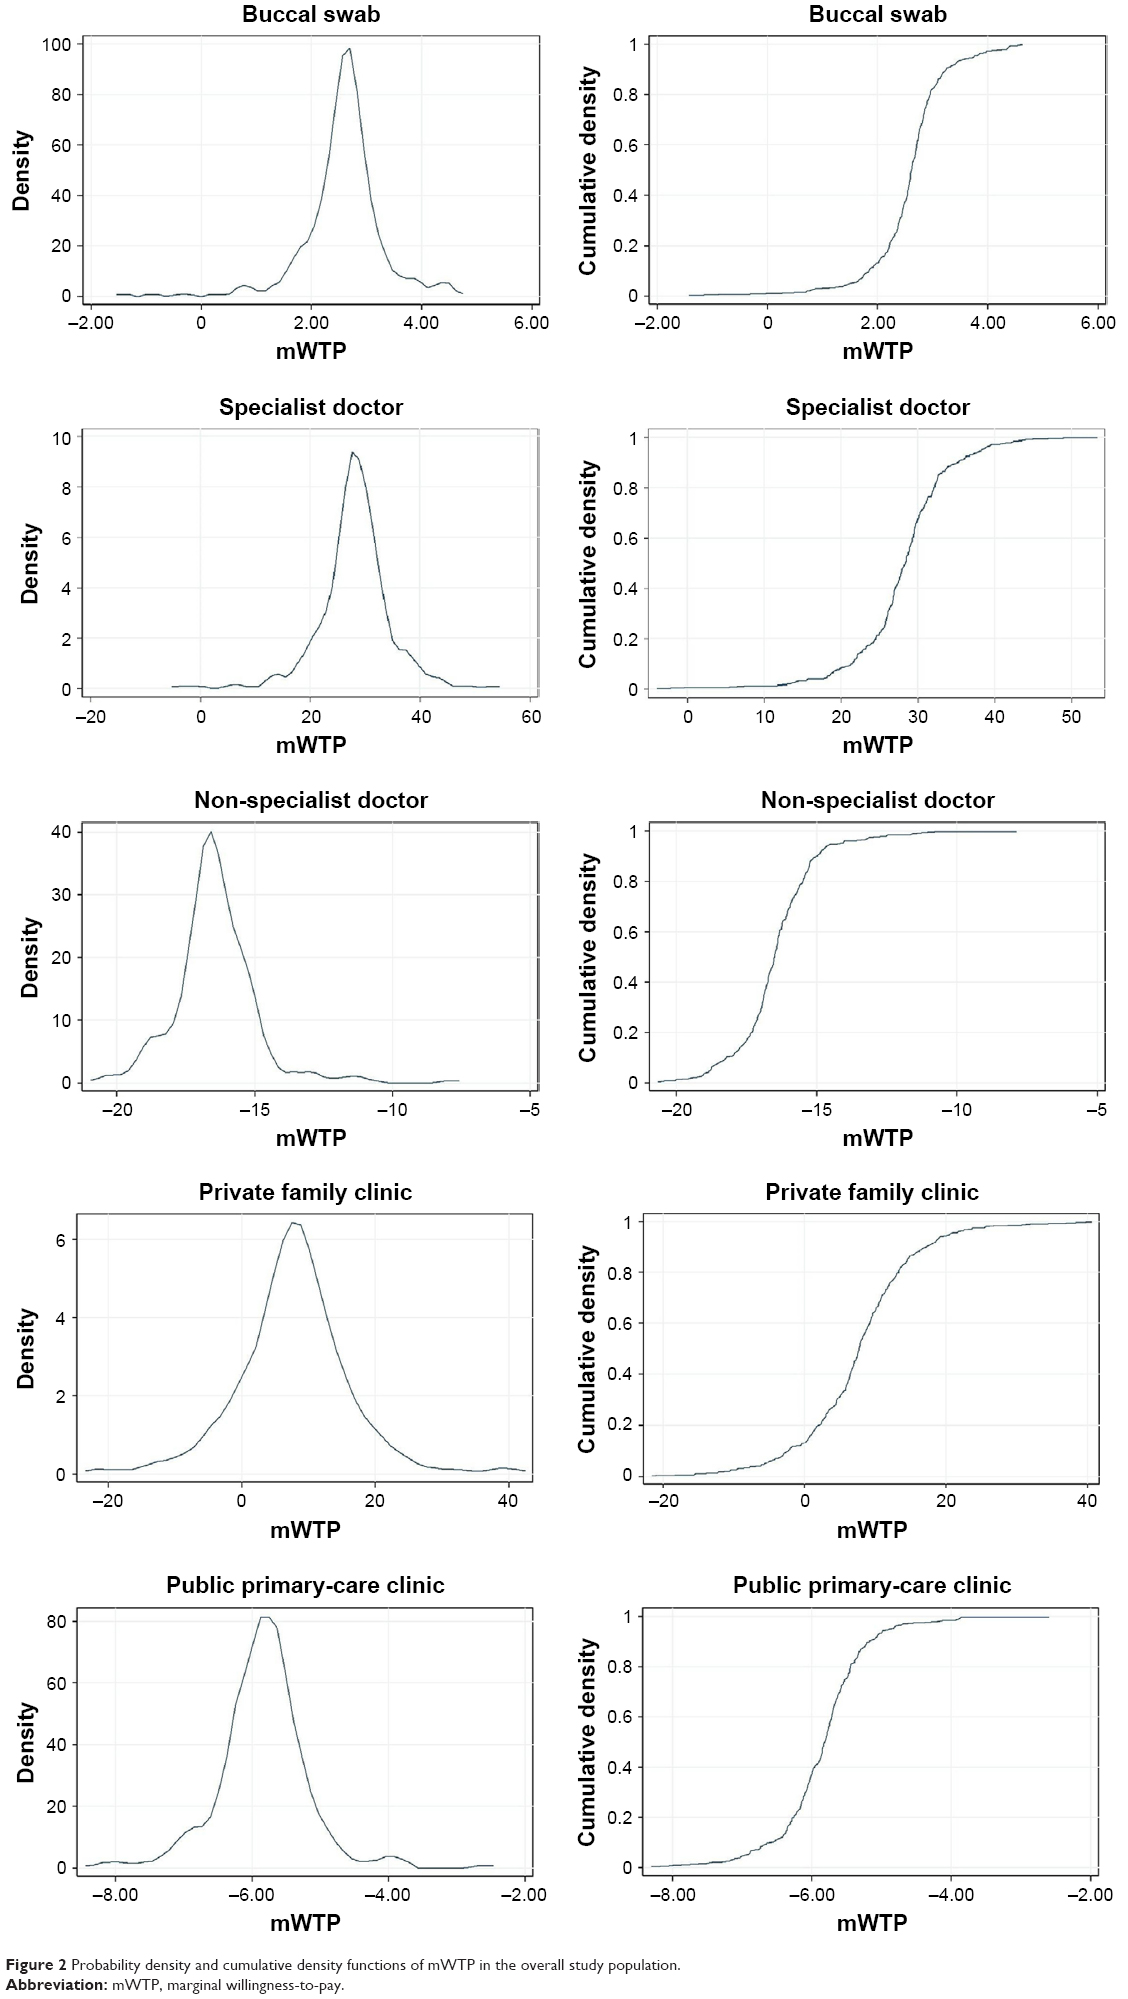 | Figure 2 Probability density and cumulative density functions of mWTP in the overall study population. |
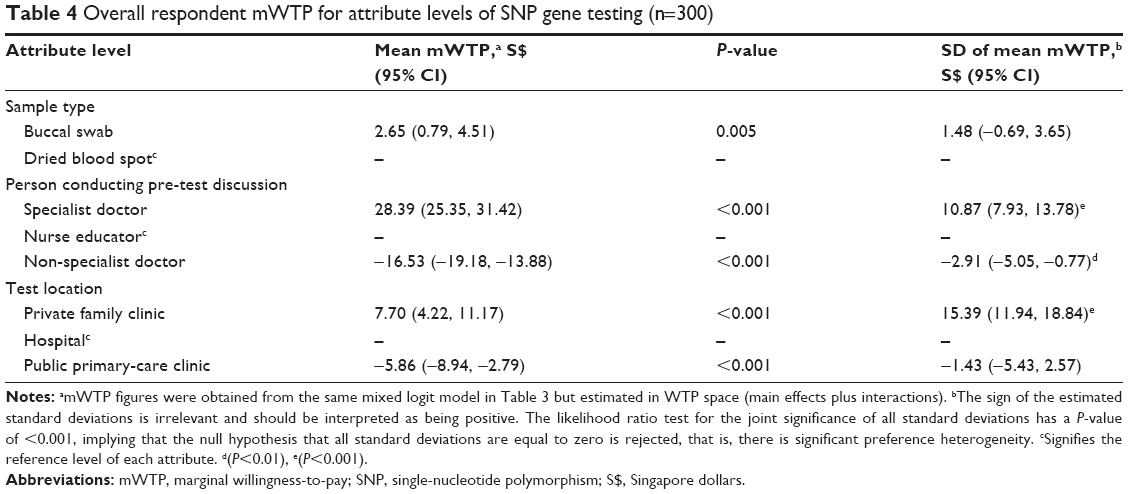 | Table 4 Overall respondent mWTP for attribute levels of SNP gene testing (n=300) |
Subgroup analyses
Preferences among ethnic groups are represented by mWTP distributions in Figure 3 and summarized in Table 5. In general, they seem to be rather similar. With reference to the probability density functions, the Indians have narrower density distribution for buccal swab, concentrated around mWTP of S$2.66. Together with the Malays, their densities are slightly shifted toward higher mWTP than the Chinese. For specialist doctor, the Malays have lower mWTP, depicted by the higher density than Chinese and Indians around mWTP of S$15–S$25. For non-specialist doctor, the Chinese appear to have a much longer right tail toward higher mWTP, although it is still in the negative range. They also appear to be more willing to pay for private family clinic, with higher density around mWTP of S$13–S$25. Cumulative density functions for all attributes seem to be comparable except for private family clinic, where the median mWTP of Chinese is S$8.31 as compared to S$6.99 in Malays and S$7.63 in Indians (Table 5). Chinese women have greater preference heterogeneity for the attributes as compared to the other two ethnicities, judging by the longer tails at both ends of the probability density functions.
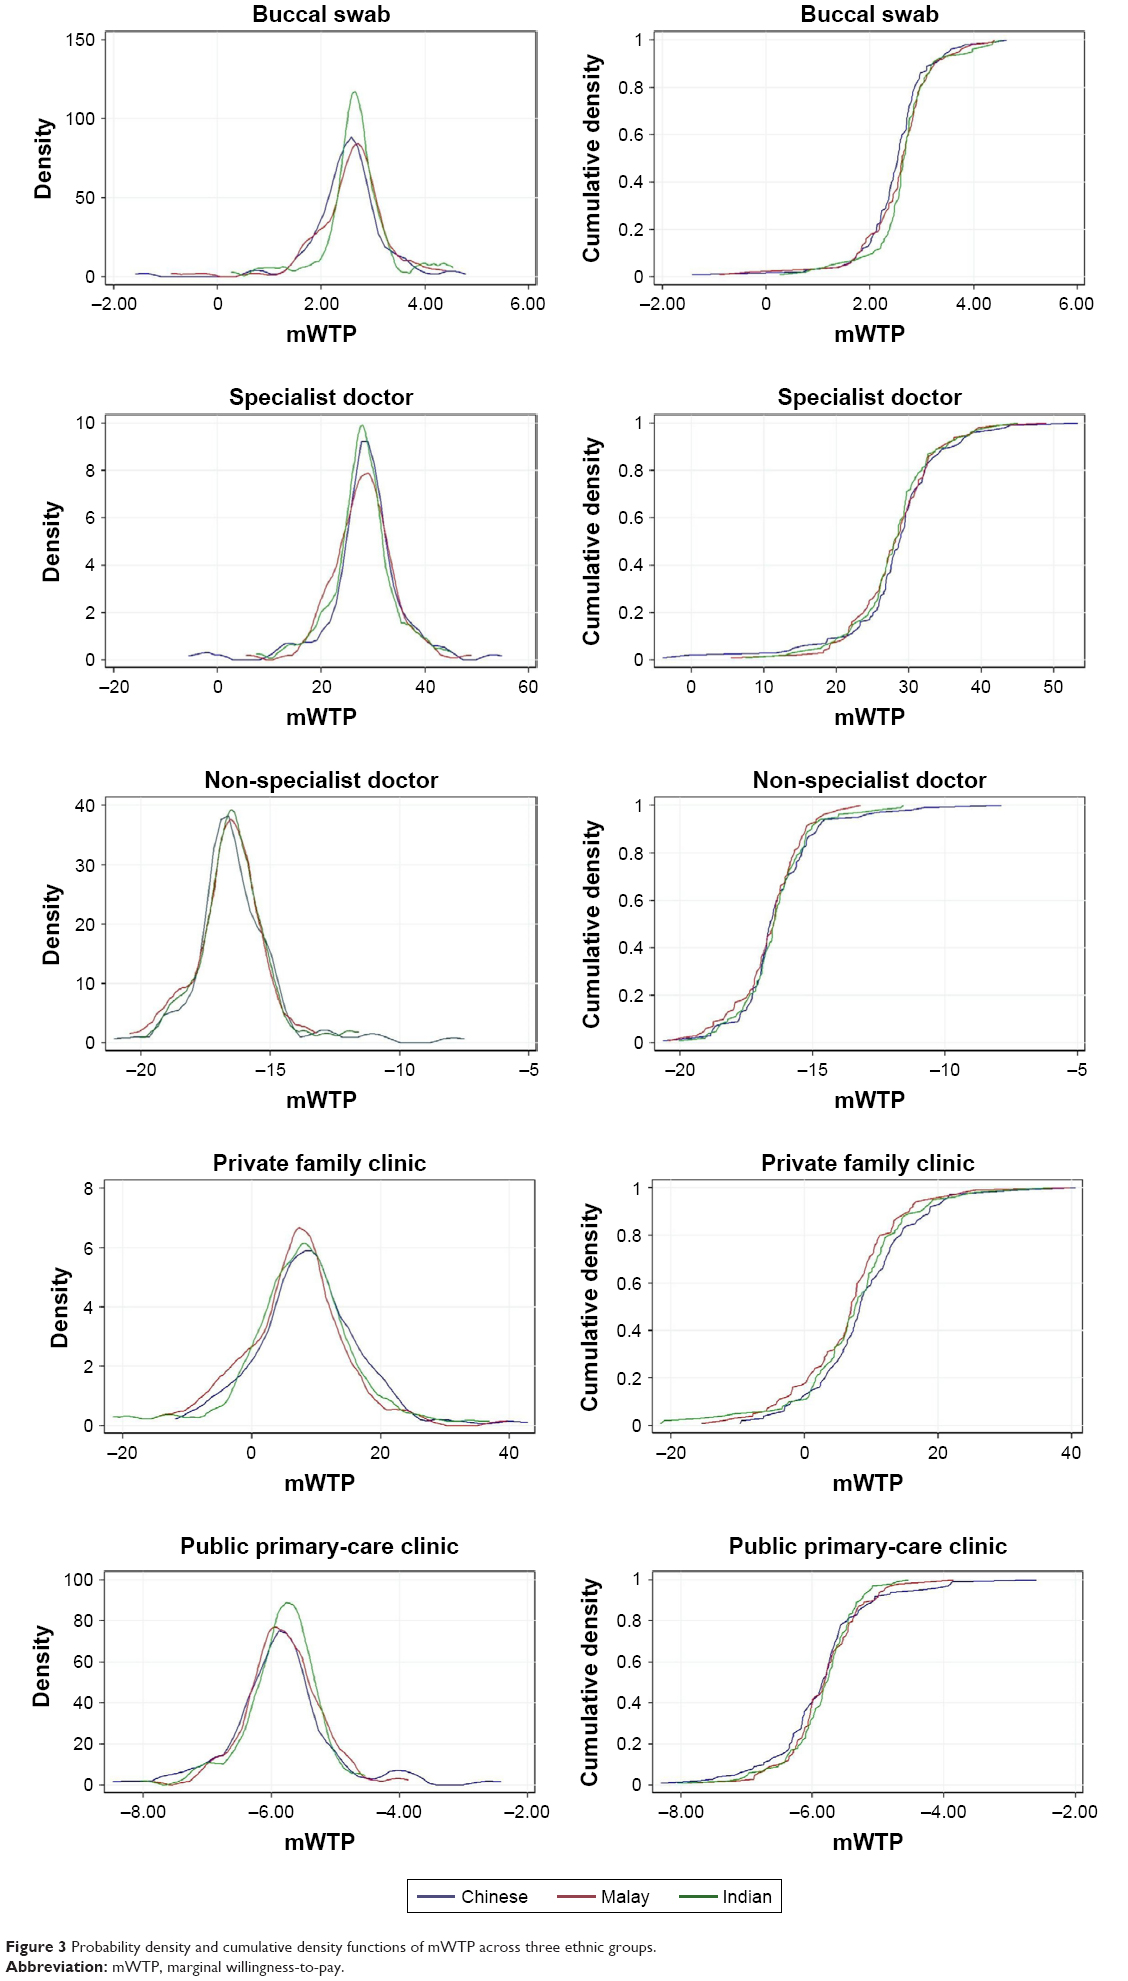 | Figure 3 Probability density and cumulative density functions of mWTP across three ethnic groups. |
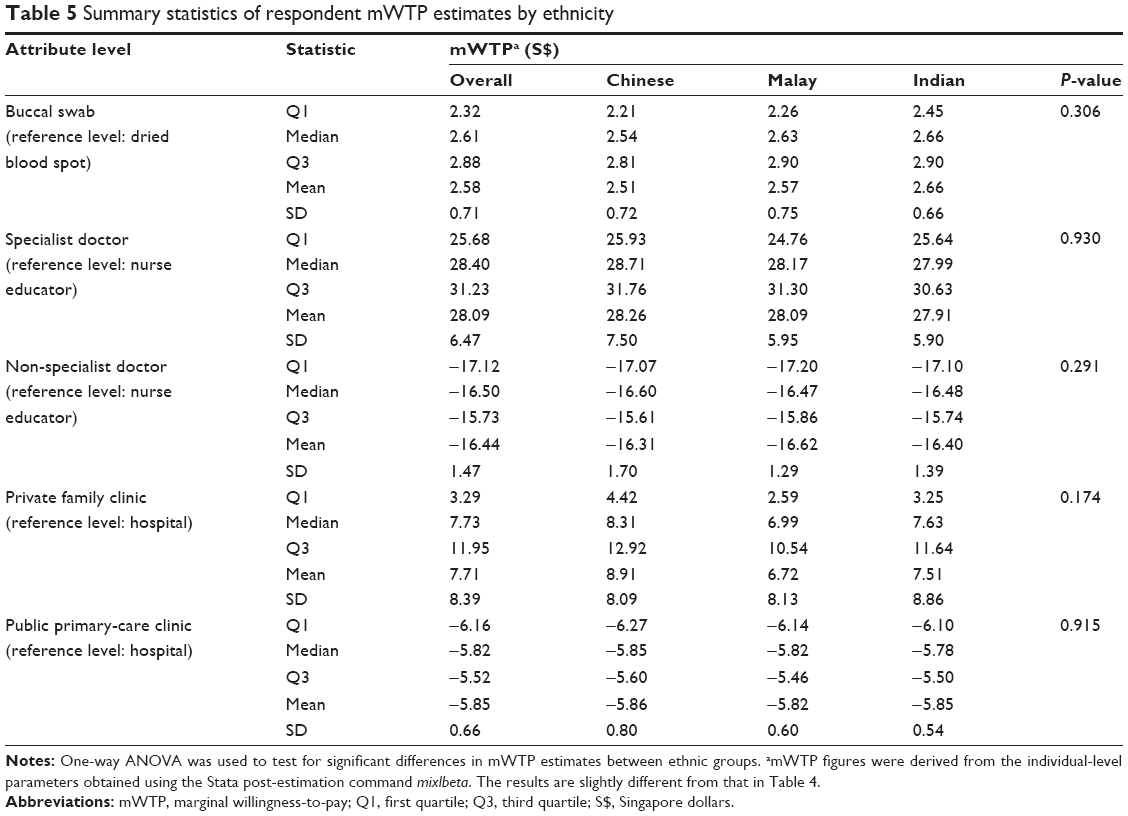 | Table 5 Summary statistics of respondent mWTP estimates by ethnicity |
Predicted uptake rates in various scenarios
Predicted uptake rates for various scenarios are shown in Table 6. A realistic base case scenario consisted of less invasive testing (buccal swab) involving a pretest discussion with a specialist doctor at the hospital which costs S$175. Other scenarios include a feasible alternative that substitutes specialist doctor with nurse educator at a lower fee, cheaper alternative at S$50, pricier alternative at S$300, and the alternative consisting of the most preferred attribute levels at the population level (n=300). As compared to the base case, predicted uptake increase from 3.7% to 60.5% in feasible alternative and increase to 87.0% in cheaper alternative and 88.9% in most preferred alternative. Uptake decrease to almost 0% in pricier alternative, where cost is the highest at S$300.
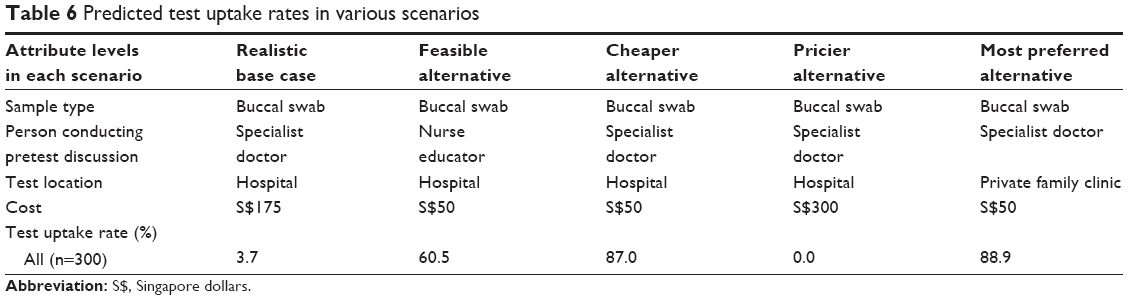 | Table 6 Predicted test uptake rates in various scenarios |
Dual-response none
One hundred of 300 women (33.3%) answered “No” to “Will you really go for this option in real life?” at least once in 10 choice tasks; 10 in 300 (3.3%) women always opted out of the SNP gene test in real life; 333 out of 3,000 choice tasks (11.0%) are answered as “No.” Reasons include high cost (n=223), unaware of such tests (n=72), not keen to know the results (n=10), lack of time (n=10), afraid of taking blood (n=7), currently healthy therefore test is unnecessary (n=6), person conducting pretest discussion is not a specialist doctor (n=3), and others (n=2).
Discussion
This is the first study to quantify women’s preferences, mWTP, and predicted uptake for SNP gene testing in breast cancer. Our findings highlight the importance of incorporating culturally and linguistically appropriate services, as advocated by the National Committee of Quality Assurance which focuses on improving the quality of healthcare.46 We found that person conducting the pretest discussion and cost are significantly associated with women’s choice of getting tested, while sample type (noninvasive buccal swab preferred) is only marginally significant (P=0.046). While preference for pretest discussion was not previously investigated, a recent DCE found that patients with chronic lymphocytic leukemia prefer to receive genomic test results from a hospital consultant doctor or specialist nurse rather than general practitioner or junior doctor.33 Similar to our findings, cost influences the attendance of cancer screening31 as well as pharmacogenetic test that predicts risk of life-threatening adverse drug reactions.47 Respondents also preferred noninvasive procedures in genome-based colorectal cancer screening scenarios.48
Although we observed a bias toward the left-sided alternative, there is little difference between preference weights of attribute levels including and excluding the ASC “Choose left.” Nonetheless, we considered the possibility that left-sided alternatives are consistently superior throughout the questionnaire. This is not found to be true when we checked through the design. Respondents could have been influenced by the first (fixed) task where option A was superior. Alternatively, they might have applied simplifying heuristics when undertaking this survey. However, we tried to minimize the application of heuristics by getting interviewers to emphasize to the respondents that either option may appeal more to them. We also did not observe any serial non-traders who always chose the left-sided option in every choice task.
Through the interactions analyses, we found that women with higher household income and education level were more willing to pay higher prices for SNP gene testing, while blue-collar workers were less willing than the self-employed or PME. This is in line with several studies demonstrating association between socioeconomic factors, for example, income and education on screening test uptake.49–51 We observed significant preference heterogeneity for most attribute levels, suggesting the importance of tailoring SNP gene testing packages according to individual preferences, to maximize utility. Both the mean PWU and SD coefficients for buccal swab were significant at 5% level. By calculating the cumulative density function under the standardized normal curve, we find that 66% of the distribution is above zero, while 34% is below zero. This implies that buccal swab is associated with positive utility among about two-thirds of the respondents. The policy implication could be to provide buccal swab to those who self-select this option. Although preferences in terms of mWTP across ethnic groups appear to be comparable, there are subtle differences in mWTP for private family clinic and extent of preference heterogeneity. Nonetheless, cost-effectiveness of a one-size-fits-all strategy versus a personalized strategy should be empirically studied.
Women were willing to pay more to discuss with a specialist doctor, but not with a non-specialist doctor. However, this may not be the best use of specialist doctor’ time. Since we found that nurse educator was preferred after specialist doctor, they can be considered as alternatives to specialist doctors. Research has shown that nurses trained in genetic counseling are well-positioned in providing such services52 and can be a cost-effective alternative to clinical geneticists.53 In many countries around the world including Singapore, experienced nurses are in shortage. Hence, institutions may consider training life science graduates or other allied health professionals as genetic counselors. We believe that women will be receptive toward genetic counselors if their proficiency and cost-effectiveness are demonstrated clearly.
As for predicted uptake, the feasible alternative in Table 6 appeared to be relatively well-received, achieving rates similar to that of a pharmacogenetic test to prevent severe adverse reactions47 and genome-based colorectal cancer screening.48 The cheaper and most preferred alternative may also become feasible in the future, as the cost of multi-panel gene testing becomes more affordable.54 The two most common reasons for opting out of the test in real life were high cost (n=233) and lack of awareness of such tests (n=72). This shows that the end-user’s sensitivity toward price and knowledge of the health technology can influence its subsequent uptake. Nonetheless, only 3.3% of respondents always opted out, as compared to 21.4% who opted out of diabetes lifestyle management programs55 and 29.0% who opted out of medically supervised benzodiazepine discontinuation programs.56
There are some limitations in this study. First, we assumed that both alternatives are equally highly accurate. Our study conclusions may change, depending on the clinical validity and utility of SNP gene testing. Second, the actual uptake of breast cancer screening in Singapore is rather low. Only about 40% of women aged 50–59 years and 38% of women aged 60–69 years surveyed in 2010 who participated in screening in the past 2 years.57 Similarly, only about 35% of our study sample attended mammogram screening within the past 2 years. Actual uptake of SNP gene testing may be even lower, as it only predicts the risk and not the actual occurrence of breast cancer. Nonetheless, SNP gene testing holds the promise of reducing screening harms for those at lower risk and detecting cancers earlier for those at higher risk. A large-scale prospective, randomized controlled trial is underway to determine whether screening based on personalized risk is as safe, less morbid, and more preferred by women than age-based screening.20 Other limitations include the uncertainty surrounding the use of heuristics or simplifying tactics to make decisions. Due to the nature of our sampling and recruitment, our study population tend to comprise housewives and women who were not working. They might have received lower education and have lower health literacy as compared to the general women population between 40 and 69 years. In addition, we could not reach out to women staying in condominiums or private apartments who earn higher incomes58 and may have higher health literacy. Last but not least, almost 50% of the eligible households did not participate in the study. These women may be less concerned with health-related issues and less willing to undergoing SNP gene testing in real life. Thus, our study findings may not be generalizable to them.
Conclusion
Sample type, person conducting pretest discussion, and out-of-pocket cost are significantly associated with preference for SNP gene testing. Women with higher income and education levels were more willing to pay higher prices for the test. SNP gene testing using buccal swab involving a pretest discussion with a trained nurse educator at the hospital is more preferred and may be more cost-effective than the base case scenario involving specialist doctor at a higher cost. It could be personalized according to individual preferences to encourage uptake. Future research should focus on establishing the clinical validity and utility of SNP gene testing, the long-term outcomes of risk-based screening and prevention strategies, in terms of patients’ experiences and survival as well as the cost-effectiveness of tailored breast cancer screening using SNP gene testing.
Data availability
The data sets used and/or analyzed during the current study are available from the corresponding author on reasonable request.
Acknowledgments
We thank A/Prof Alex Cook, PhD (Saw Swee Hock School of Public Health) for providing editorial assistance as well as two anonymous reviewers for suggesting substantial improvements. This study was supported by the Singapore Ministry of Health Health Services Research Competitive Research Grant, administered by National Medical Research Council (Grant number: HSRG/13MAY006). The study sponsor had no role in the study design, collection, analysis, and interpretation of data; in the writing of the manuscript; and in the decision to submit the manuscript for publication.
Disclosure
The authors report no conflicts of interest in this work.
References
Global Burden of Disease Cancer Collaboration, Fitzmaurice C, Allen C, et al. Global, regional, and national cancer incidence, mortality, years of life lost, years lived with disability, and disability-adjusted life-years for 32 cancer groups, 1990 to 2015: a systematic analysis for the global burden of disease study. JAMA Oncol. 2017;3(4):524–548. | ||
Weedon-Fekjær H, Romundstad PR, Vatten LJ. Modern mammography screening and breast cancer mortality: population study. BMJ. 2014;348:g3701. | ||
Løberg M, Lousdal ML, Bretthauer M, Kalager M. Benefits and harms of mammography screening. Breast Cancer Res. 2015;17(1):63. | ||
Darabi H, Czene K, Zhao W, Liu J, Hall P, Humphreys K. Breast cancer risk prediction and individualised screening based on common genetic variation and breast density measurement. Breast Cancer Res. 2012;14(1):R25. | ||
Tyrer J, Duffy SW, Cuzick J. A breast cancer prediction model incorporating familial and personal risk factors. Stat Med. 2004;23(7):1111–1130. | ||
Breast Cancer Surveillance Consortium Risk Calculator. Breast Cancer Surveillance Consortium. Available from: https://tools.bcsc-scc.org/BC5yearRisk/calculator.htm. Accessed January 8, 2018. | ||
Pace LE, Keating NL. A systematic assessment of benefits and risks to guide breast cancer screening decisions. JAMA. 2014;311(13):1327–1335. | ||
Amir E, Freedman OC, Seruga B, Evans DG. Assessing women at high risk of breast cancer: a review of risk assessment models. J Natl Cancer Inst. 2010;102(10):680–691. | ||
Tice JA, Cummings SR, Smith-Bindman R, Ichikawa L, Barlow WE, Kerlikowske K. Using clinical factors and mammographic breast density to estimate breast cancer risk: development and validation of a new predictive model. Ann Intern Med. 2008;148(5):337–347. | ||
Easton DF, Pooley KA, Dunning AM, et al. Genome-wide association study identifies novel breast cancer susceptibility loci. Nature. 2007;447(7148):1087–1093. | ||
Turnbull C, Ahmed S, Morrison J, et al. Genome-wide association study identifies five new breast cancer susceptibility loci. Nat Genet. 2010;42(6):504–507. | ||
Fletcher O, Johnson N, Orr N, et al. Novel breast cancer susceptibility locus at 9q31.2: results of a genome-wide association study. J Natl Cancer Inst. 2011;103(5):425–435. | ||
Zheng W, Zhang B, Cai Q, et al. Common genetic determinants of breast-cancer risk in East Asian women: a collaborative study of 23 637 breast cancer cases and 25 579 controls. Hum Mol Genet. 2013;22(12):2539–2550. | ||
Purrington KS, Slager S, Eccles D, et al. Genome-wide association study identifies 25 known breast cancer susceptibility loci as risk factors for triple-negative breast cancer. Carcinogenesis. 2014;35(5):1012–1019. | ||
Michailidou K, Beesley J, Lindstrom S, et al. Genome-wide association analysis of more than 120,000 individuals identifies 15 new susceptibility loci for breast cancer. Nat Genet. 2015;47(4):373–380. | ||
Ripperger T, Gadzicki D, Meindl A, Schlegelberger B. Breast cancer susceptibility: current knowledge and implications for genetic counselling. Eur J Hum Genet. 2009;17(6):722–731. | ||
van Veen EM, Brentnall AR, Byers H, et al. Use of single-nucleotide polymorphisms and mammographic density plus classic risk factors for breast cancer risk prediction. JAMA Oncol. 2018;4(4):476–477. | ||
Shieh Y, Hu D, Ma L, et al. Joint relative risks for estrogen receptor-positive breast cancer from a clinical model, polygenic risk score, and sex hormones. Breast Cancer Res Treat. 2017;166(2):603–612. | ||
Shieh Y, Hu D, Ma L, et al. Breast cancer risk prediction using a clinical risk model and polygenic risk score. Breast Cancer Res Treat. 2016;159(3):513–525. | ||
Esserman LJ, WISDOM Study and Athena Investigators. The WISDOM Study: breaking the deadlock in the breast cancer screening debate. NPJ Breast Cancer. 2017;3(1):34. | ||
Young MA, Forrest LE, Rasmussen VM, et al. Making sense of SNPs: women’s understanding and experiences of receiving a personalized profile of their breast cancer risks. J Genet Couns. 2018;27(3):702–708. | ||
Howe R, Miron-Shatz T, Hanoch Y, Omer ZB, O’Donoghue C, Ozanne EM. Personalized medicine through SNP testing for breast cancer risk: clinical implementation. J Genet Couns. 2015;24(5):744–751. | ||
Graves KD, Peshkin BN, Luta G, Tuong W, Schwartz MD. Interest in genetic testing for modest changes in breast cancer risk: implications for SNP testing. Public Health Genomics. 2011;14(3):178–189. | ||
Johnson FR, Zhou M. Patient preferences in regulatory benefit-risk assessments: a US perspective. Value Health. 2016;19(6):741–745. | ||
Mühlbacher AC, Juhnke C, Beyer AR, Garner S. Patient-focused benefit-risk analysis to inform regulatory decisions: the european union perspective. Value Health. 2016;19(6):734–740. | ||
Hailey D, Nordwall M. Survey on the involvement of consumers in health technology assessment programs. Int J Technol Assess Health Care. 2006;22(4):497–499. | ||
Facey K, Boivin A, Gracia J, et al. Patients’ perspectives in health technology assessment: a route to robust evidence and fair deliberation. Int J Technol Assess Health Care. 2010;26(3):334–340. | ||
Gyrd-Hansen D. Cost-benefit analysis of mammography screening in Denmark based on discrete ranking data. Int J Technol Assess Health Care. 2000;16(3):811–821. | ||
Gerard K, Shanahan M, Louviere J. Using stated preference discrete choice modelling to inform health care decision-making: a pilot study of breast screening participation. Appl Econ. 2003;35(9):1073–1085. | ||
Vass CM, Rigby D, Payne K. Investigating the heterogeneity in women’s preferences for breast screening: does the communication of risk matter? Value Health. 2018;21(2):219–228. | ||
Sicsic J, Pelletier-Fleury N, Moumjid N. Women’s benefits and harms trade-offs in breast cancer screening: results from a discrete-choice experiment. Value Health. 2018;21(1):78–88. | ||
Peacock S, Apicella C, Andrews L, et al. A discrete choice experiment of preferences for genetic counselling among Jewish women seeking cancer genetics services. Br J Cancer. 2006;95(10):1448–1453. | ||
Buchanan J, Wordsworth S, Schuh A. Patients’ preferences for genomic diagnostic testing in chronic lymphocytic leukaemia: a discrete choice experiment. Patient. 2016;9(6):525–536. | ||
Veldwijk J, Lambooij MS, Kallenberg FG, et al. Preferences for genetic testing for colorectal cancer within a population-based screening program: a discrete choice experiment. Eur J Hum Genet. 2016;24(3):361–366. | ||
Knight SJ, Mohamed AF, Marshall DA, Ladabaum U, Phillips KA, Walsh JME. Value of genetic testing for hereditary colorectal cancer in a probability-based US online sample. Med Decis Mak. 2015;35(6):734–744. | ||
Orme B. Sample Size Issues for Conjoint Analysis. Research Publishers LLC. Available from: https://www.sawtoothsoftware.com/download/techpap/samplesz.pdf. Accessed January 8, 2018. | ||
de Bekker-Grob EW, Donkers B, Jonker MF, Stolk EA. Sample size requirements for discrete-choice experiments in healthcare: a practical guide. Patient. 2015;8(5):373–384. | ||
Bridges JF, Hauber AB, Marshall D, et al. Conjoint analysis applications in health – a checklist: a report of the ISPOR Good Research Practices for Conjoint Analysis Task Force. Value Health. 2011;14(4):403–413. | ||
Wong XY, Chong KJ, van Til JA, Wee HL. A qualitative study on Singaporean women’s views towards breast cancer screening and single nucleotide polymorphisms (SNPs) gene testing to guide personalised screening strategies. BMC Cancer. 2017;17(1):776. | ||
Women Informed to Screen Depending on Measures of Risk (Wisdom Study) (WISDOM). ClinicalTrials.gov. Available from: https://clinicaltrials.gov/ct2/show/NCT02620852. Accessed February 9, 2018. | ||
Orme B. Including Holdout Choice Tasks in Conjoint Studies. Sawtooth Software. Available from: https://www.sawtoothsoftware.com/download/techpap/inclhold.pdf. Accessed June 8, 2018. | ||
Reed Johnson F, Lancsar E, Marshall D, et al. Constructing experimental designs for discrete-choice experiments: report of the ISPOR Conjoint Analysis Experimental Design Good Research Practices Task Force. Value Health. 2013;16(1):3–13. | ||
Lancsar E, Fiebig DG, Hole AR. Discrete choice experiments: a guide to model specification, estimation and software. Pharmacoeconomics. 2017;35(7):697–716. | ||
Train KE, Weeks M. Discrete choice models in preference space and willingness-to-pay space. In: Scarpa R, Alberini A, editors. Application of Simulation Methods in Environmental and Resource Economics. Dordrecht: Springer; 2005:1–16. | ||
Train KE. Individual-level parameters. In: Discrete Choice Methods with Simulation. Cambridge: Cambridge University Press; 2009:295–319. | ||
Health Care Disparities. National Committee of Quality Assurance. Available from: http://www.ncqa.org/hedis-quality-measurement/research/health-care-disparities. Accessed February 9, 2018. | ||
Dong D, Ozdemir S, Mong Bee Y, Toh S-A, Bilger M, Finkelstein E. Measuring high-risk patients’ preferences for pharmacogenetic testing to reduce severe adverse drug reaction: a discrete choice experiment. Value Health. 2016;19(6):767–775. | ||
Groothuis-Oudshoorn CG, Fermont JM, van Til JA, IJzerman MJ. Public stated preferences and predicted uptake for genome-based colorectal cancer screening. BMC Med Inform Decis Mak. 2014;14(1):18. | ||
Wong HZ, Lim WY, Ma SS, Chua LA, Heng DM. Health screening behaviour among Singaporeans. Ann Acad Med Singapore. 2015;44(9):326–334. | ||
Loy EY, Molinar D, Chow KY, Fock C. National Breast Cancer Screening Programme, Singapore: evaluation of participation and performance indicators. J Med Screen. 2015;22(4):194–200. | ||
Wee LE, Koh GC, Chin RT, Yeo WX, Seow B, Chua D. Socioeconomic factors affecting colorectal, breast and cervical cancer screening in an Asian urban low-income setting at baseline and post-intervention. Prev Med. 2012;55(1):61–67. | ||
Calzone KA, Cashion A, Feetham S, et al. Nurses transforming health care using genetics and genomics. Nurs Outlook. 2010;58(1):26–35. | ||
Torrance N, Mollison J, Wordsworth S, et al. Genetic nurse counsellors can be an acceptable and cost-effective alternative to clinical geneticists for breast cancer risk genetic counselling. Evidence from two parallel randomised controlled equivalence trials. Br J Cancer. 2006;95(4):435–444. | ||
Crawford B, Adams SB, Sittler T, et al. Multi-gene panel testing for hereditary cancer predisposition in unsolved high-risk breast and ovarian cancer patients. Breast Cancer Res Treat. 2017;163(2):383–390. | ||
Veldwijk J, Lambooij MS, de Bekker-Grob EW, Smit HA, de Wit GA. The effect of including an opt-out option in discrete choice experiments. PLoS One. 2014;9(11):e111805. | ||
Marti J, Bachhuber M, Feingold J, Meads D, Richards M, Hennessy S. Financial incentives to discontinue long-term benzodiazepine use: a discrete choice experiment investigating patient preferences and willingness to participate. BMJ Open. 2017;7(10):1–9. | ||
Epidemiology and Disease Control Division. National Health Survey 2010. Ministry of Health, Singapore. Available from: https://www.moh.gov.sg/content/dam/moh_web/Publications/Reports/2011/NHS2010%20-%20low%20res.pdf. Accessed February 9, 2018. | ||
Department of Statistics Singapore. General Household Survey 2015: Table 87 Resident Households by Monthly Household Income from Work and Type of Dwelling. Government of Singapore; 2015. Available from: https://www.singstat.gov.sg/publications/ghs/ghs2015content. Accessed February 15, 2018. |
Supplementary materials
Additional information on study methods
Multi-stage cluster sampling
A market research company was commissioned to recruit respondents and implement the survey. Geographical clusters were first selected from the company’s own residential sampling frame using systematic sampling. Due to access difficulties, condominium and private apartment dwellers (13.9% of the population) were excluded.1 Households in each Primary Sampling Unit were then selected door-to-door. Only one respondent per household could participate in the study.
Discrete choice experiment (DCE) survey development
To fully capture women’s views and beliefs toward single-nucleotide polymorphism gene testing to guide personalized screening strategies, focus group discussions involving screening-age Singaporean women were conducted. Data saturation was reached after four sessions. It was found that accuracy, invasiveness, cost, and side effects influence women’s uptake of the test.
A pilot DCE survey was then conducted in 20 respondents, recruited in the same manner. Some respondents considered cousins as first-degree relatives in the question on family history of breast cancer. As such, we modified the question to read “has your biological mother, sister or daughter been diagnosed with breast cancer before?” Three out of 20 respondents did not understand the term “nurse educator.” Hence, we included an explanation of the role of a nurse educator in the two-page write-up.
Statistical analyses
Predicted uptake can be measured using the following formula:2,3
|
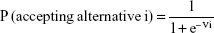
where Vi is the expected utility of alternative i, or the sum of part-worth utilities for the attributes corresponding to the specific levels. An alternative with expected utility V equals to zero is assumed to have a 50% probability of acceptance. Due to effects coding, all parameters are estimated relative to the grand mean, which has an expected utility of zero.
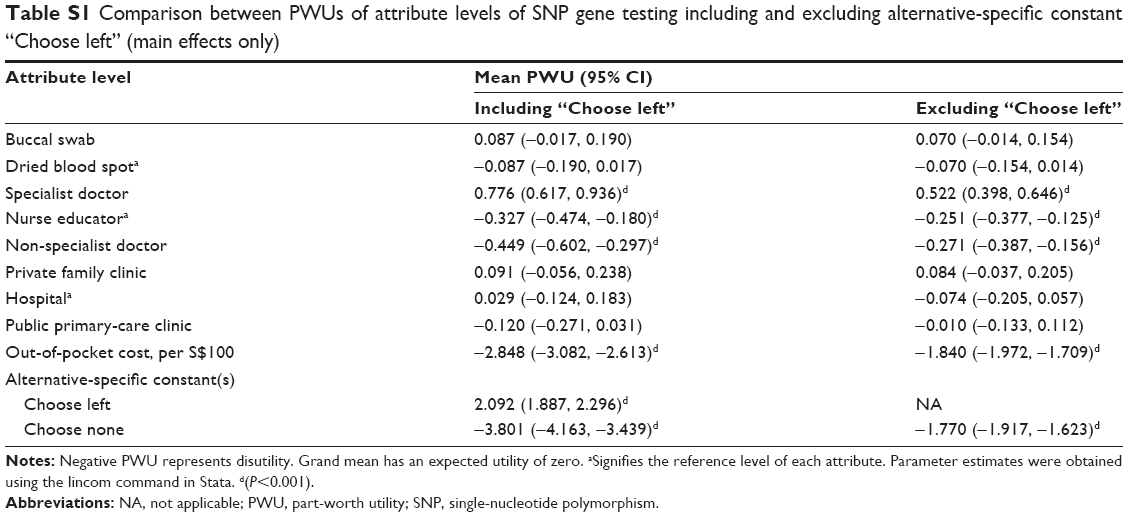 | Table S1 Comparison between PWUs of attribute levels of SNP gene testing including and excluding alternative-specific constant “Choose left” (main effects only) |
References
Department of Statistics Singapore. General Household Survey 2015. Government of Singapore. Available from: https://www.singstat.gov.sg/-/media/files/publications/ghs/ghs2015/ghs2015.pdf, Page V. Accessed January 8, 2018. | ||
Gerard K, Shanahan M, Louviere J. Using discrete choice modelling to investigate breast screening participation. In: Ryan M, Gerard K, Amaya-Amaya M, editors. Using Discrete Choice Experiments to Value Health and Health Care. Netherlands: Springer; 2008:117–137. | ||
Hall J, Kenny P, King M, Louviere J, Viney R, Yeoh A. Using stated preference discrete choice modelling to evaluate the introduction of varicella vaccination. Health Econ. 2002;11(5):457–465. |
 © 2018 The Author(s). This work is published and licensed by Dove Medical Press Limited. The full terms of this license are available at https://www.dovepress.com/terms.php and incorporate the Creative Commons Attribution - Non Commercial (unported, v3.0) License.
By accessing the work you hereby accept the Terms. Non-commercial uses of the work are permitted without any further permission from Dove Medical Press Limited, provided the work is properly attributed. For permission for commercial use of this work, please see paragraphs 4.2 and 5 of our Terms.
© 2018 The Author(s). This work is published and licensed by Dove Medical Press Limited. The full terms of this license are available at https://www.dovepress.com/terms.php and incorporate the Creative Commons Attribution - Non Commercial (unported, v3.0) License.
By accessing the work you hereby accept the Terms. Non-commercial uses of the work are permitted without any further permission from Dove Medical Press Limited, provided the work is properly attributed. For permission for commercial use of this work, please see paragraphs 4.2 and 5 of our Terms.