")
Back to Journals » Diabetes, Metabolic Syndrome and Obesity » Volume 8
Withdrawal of sulfonylureas from patients with type 2 diabetes receiving long-term sulfonylurea and insulin combination therapy results in deterioration of glycemic control: a randomized controlled trial
Authors Srivanichakorn W, Sriwijitkamol A, Kongchoo A, Sriussadaporn S, Plengvidhya N, Lertwattanarak R , Vannasaeng S, Thongtang N
Received 23 November 2014
Accepted for publication 6 January 2015
Published 2 March 2015 Volume 2015:8 Pages 137—145
DOI https://doi.org/10.2147/DMSO.S78008
Checked for plagiarism Yes
Review by Single anonymous peer review
Peer reviewer comments 3
Editor who approved publication: Professor Ming-Hui Zou
Weerachai Srivanichakorn,1 Apiradee Sriwijitkamol,2 Aroon Kongchoo,2 Sutin Sriussadaporn,2 Nattachet Plengvidhya,2 Raweewan Lertwattanarak,2 Sathit Vannasaeng,2 Nuntakorn Thongtang2
1Division of Ambulatory Medicine, 2Division of Endocrinology and Metabolism, Department of Medicine, Faculty of Medicine, Siriraj Hospital, Mahidol University, Thailand
Background: The benefit of sulfonylureas (SUs) to patients with type 2 diabetes mellitus receiving long-term insulin treatment is unclear. This study evaluated glycemic control and beta-cell function after SU withdrawal in these patients.
Methods: In this 8-week randomized controlled study, patients with type 2 diabetes who had been treated with insulin for at least 3 years plus moderate to high doses of SUs were randomly assigned to withdrawal (n=16) or continuation (n=16) of SUs. Clinical characteristics, glycemic control, hypoglycemic events, and insulin secretion, including homeostasis model assessment of beta-cell function (HOMA-B) score, C-peptide concentration, and Matsuda index, were evaluated at baseline and after 2 and 8 weeks.
Results: Thirty patients (16 in the SU withdrawal group and 14 in the SU continuation group) completed the study. Median duration of diabetes was 17 (range 5–40) years. Baseline clinical characteristics, glycemic control, and HOMA-B were similar in the two groups, but the mean fasting C-peptide concentration was higher in the SU withdrawal group. After 8 weeks, the SU withdrawal group showed a significant increase in mean glycosylated hemoglobin levels from 7.8%±0.5% (62±5 mmol/mol) to 8.6%±1.2% (71±13 mmol/mol; P=0.002), whereas the SU continuation group showed a slight but not significant increase from 7.7%±0.5% (61±5 mmol/mol) to 7.9%±1.2% (63±13 mmol/mol; P=0.37). Insulin secretion, as measured by C-peptide and HOMA-B, decreased by 18% and 36%, respectively, in the SU withdrawal group. Hypoglycemic events were significantly more frequent in the SU continuation group whereas body weight did not change significantly in either group.
Conclusion: Withdrawal of SU from patients with type 2 diabetes receiving long-term combination treatment with SU and insulin resulted in deterioration of glycemic control and insulin secretion.
Keywords: insulin, sulfonylurea withdrawal, type 2 diabetes, long-term combination
Introduction
Since their introduction in the 1950s, sulfonylureas (SUs) have remained one of the major therapeutic classes in the treatment of type 2 diabetes mellitus (DM). The UK Prospective Diabetes Study (UKPDS) has provided extensive insights into their efficacy and clinical utility, finding that more intensive glucose control with SU or insulin in patients newly diagnosed with type 2 DM could reduce the risk of microvascular complications.1 The UKPDS study also showed progressive deterioration in glycemic control over time,2 with most patients requiring long-term combinations of hypoglycemic agents to maintain glycemic control. For example, 53% of UKPDS patients treated initially with an SU required additional insulin therapy over the next 6 years, suggesting that progressive loss of pancreatic beta-cell function is the primary mechanism of SU failure.2
Several guidelines, including the American Association of Clinical Endocrinologists/American College of Endocrinology consensus statement,3 the American Diabetes Association and the European Association for the Study of Diabetes consensus statement,4,5 and the Canadian Diabetes Association Clinical Practice Guidelines Expert Committee6 recommend that SU be withdrawn from patients with type 2 DM receiving pre-mixed or basal post-prandial insulin therapy to prevent the hypoglycemia and weight gain associated with combined therapy. However, previous studies have shown the benefit of SUs in insulin-treated patients,7–9 although it remains unclear whether an SU would remain effective after long-term combination therapy with insulin. The primary objectives of this study were to evaluate glycemic control, insulin secretion, hypoglycemia, and change in body weight after withdrawal of SU in type 2 DM patients who had received long-term insulin treatment. Secondary endpoints included a determination of clinical predictors of responses to SUs.
Patients and methods
Subjects
Patients with type 2 DM, aged 30–75 years, who had been treated with insulin for at least 3 years in combination with an SU at half of the recommended maximum daily dose or higher, were included. All subjects had glycosylated hemoglobin (HbA1c) levels below 8.5% (<69 mmol/mol, International Federation of Clinical Chemistry) at enrollment and had been receiving stable insulin doses (<10% dosage adjustment) for at least 3 months. Patients receiving metformin could also be included. Patients were excluded if they had another type of diabetes, were being treated with combinations of SU and once-daily insulin, or had received a thiazolidinedione. Other exclusion criteria included a history of clinically significant heart disease (New York Heart Association functional class greater than II or abnormalities other than non-specific ST-T wave changes on electrocardiography), peripheral vascular disease, pulmonary disease, impaired renal function, poor blood pressure control, electrolyte abnormalities, and neuromuscular disease. The protocol was approved by the Siriraj institutional review board, and all subjects provided written consent.
Study design
The protocol for this randomized controlled study is shown in Figure 1. Subjects were asked to visit the metabolic unit of the Division of Endocrinology and Metabolism, Siriraj Hospital, four times after 10–12 hours of overnight fasting. At screening (visit 1), each subject underwent a complete history, physical examination, and screening laboratory tests, including tests of fasting plasma glucose (FPG), HbA1c, C-peptide, total cholesterol, triglycerides, high-density lipoprotein cholesterol, and anti-glutamic acid decarboxylase antibody. All subjects received information about diabetes, including material on diet, exercise, medications, and diabetes control strategies. Within 2 weeks (visit 2), subjects returned to the metabolic unit for a 75 g oral glucose tolerance test; insulin therapy had been withheld for 24–36 hours before the test. At this visit, blood was collected before, and every 15 minutes for 2 hours after, ingestion of glucose 75 g for measurement of plasma glucose and insulin concentrations. The patients were randomized using a table of random numbers into two groups, ie, an SU withdrawal group (n=16) and an SU continuation group (n=16). The outcome assessors were blinded to treatment. SU treatment was halted in the SU withdrawal group, while the same doses of insulin and/or metformin were continued. In the SU continuation group, all medications were continued at their previous doses. Two weeks after randomization (visit 3), subjects returned to the metabolic unit for the second oral glucose tolerance test, as well as for physical examination and laboratory tests, including tests of FPG, HbA1c, and C-peptide. Hypoglycemic events were reviewed with each subject. At the final visit, 8 weeks after randomization (visit 4), hypoglycemic events were reviewed, and body weight, FPG, HbA1c, total cholesterol, triglycerides, and high-density lipoprotein cholesterol were measured.
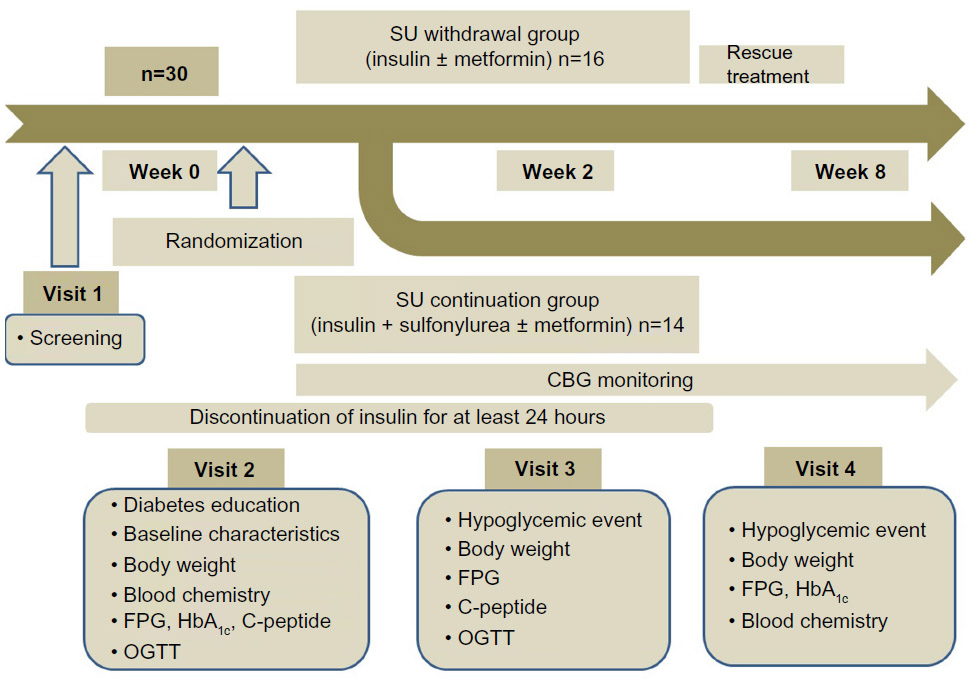 | Figure 1 Study flow chart. |
Rescue therapy
After randomization, all subjects were asked to check their fasting capillary blood glucose concentrations at least once every other day with glucometers (Accu-Chek Performa, Roche, Basel, Switzerland). Rescue therapy was initiated if the fasting capillary blood glucose level was higher than 16.7 mmol/L (300 mg/dL) or was at least 40% higher than baseline for at least two consecutive measurements. SUs were restarted in these patients and titrated to their previous doses within 1 week.
Laboratory analyses
Plasma glucose levels were measured by the hexokinase method using an automated Modular P 800. HbA1c levels were measured by turbidimetric inhibition immunoassay using a COBAS Integra 800 analyzer (Roche). Plasma insulin levels were determined by radioimmunoassay (insulin-CT; MP Biomedicals Inc., Santa Ana, CA, USA), and C-peptide levels by radioimmunometric assay (IRMA-C-PEP; Cisbio, Codolet, France).
Insulin secretion and calculation of insulin sensitivity
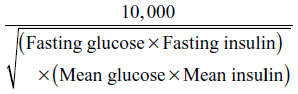
Insulin secretion was evaluated by measuring fasting plasma C-peptide levels and homeostasis model assessment of beta-cell function (HOMA-B). Insulin sensitivity was calculated using homeostasis model assessment of insulin resistance (HOMA-IR)10 and the Matsuda index, which has been shown to correlate strongly with whole-body glucose disposal measured with an insulin clamp (r=0.73, P<0.0001).11,12 The Matsuda index was calculated from plasma glucose and insulin concentrations obtained during the oral glucose tolerance test using the formula:
Deterioration of glycemic control was defined as a >0.5% (>5 mmol/mol, International Federation of Clinical Chemistry) increase in HbA1c levels from baseline. SU responders were defined as subjects who showed deterioration of glycemic control after SU withdrawal and who showed restored glycemic control after an SU was restarted. Hypoglycemia was defined as a capillary blood glucose level below 3.9 mmol/L, with or without symptoms.
Statistical analysis
A sample size of 16 patients per group was required to provide a 90% power to detect a between-group difference of at least 1% of HbA1c with an error of 0.05 and a 10% dropout. Two subjects originally enrolled in the SU continuation group were excluded from the final analysis. One developed acute cholecystitis during the study and the other was later found to have type 1 DM, as shown by positivity for anti-glutamic acid decarboxylase antibody. Therefore, the final analysis included 14 subjects in the SU continuation group and 16 in the SU withdrawal group.
Continuous data are expressed as the mean ± standard deviation or median, depending on their distribution, and compared using Student’s t-tests and non-parametric tests. The Mann-Whitney U test was used to compare absolute and percent changes in parameters between the SU withdrawal group and the SU continuation group. Categorical data were compared using Chi-square tests. Relative risk of glycemic deterioration after SU withdrawal was assessed using multiple logistic regression analysis. Clinical predictors of SU responders among subjects in the SU withdrawal group were assessed using univariate logistic analysis. All statistical analyses were performed using Statistical Package for the Social Sciences version 13.0 software (SPSS Inc., Chicago, IL, USA), with a P-value less than 0.05 considered to be statistically significant.
Results
Subject characteristics
Thirty subjects, nine males and 21 females, of mean age 63.1±7.7 years, were investigated. The median duration of diabetes was 17.0 (range 5–40) years, median duration of SU treatment was 14.5 (range 0.25–40) years, and median duration of insulin treatment was 5.5 (range 3–20) years. Sixteen subjects in the SU withdrawal group and 14 in the SU continuation group were included in the final analysis. Table 1 shows the baseline demographic and clinical characteristics of these patients. There were no differences between groups in age, duration of diabetes, duration of SU therapy, body composition, HbA1c, FPG, or current medications. Fasting plasma C-peptide levels (1.30±0.4 nmol/L versus 0.94±0.5 nmol/L; P=0.03) and HOMA-IR (3.7±1.9 versus 2.5±1.4; P=0.01) were significantly higher at baseline in the SU withdrawal group than in the SU continuation group.
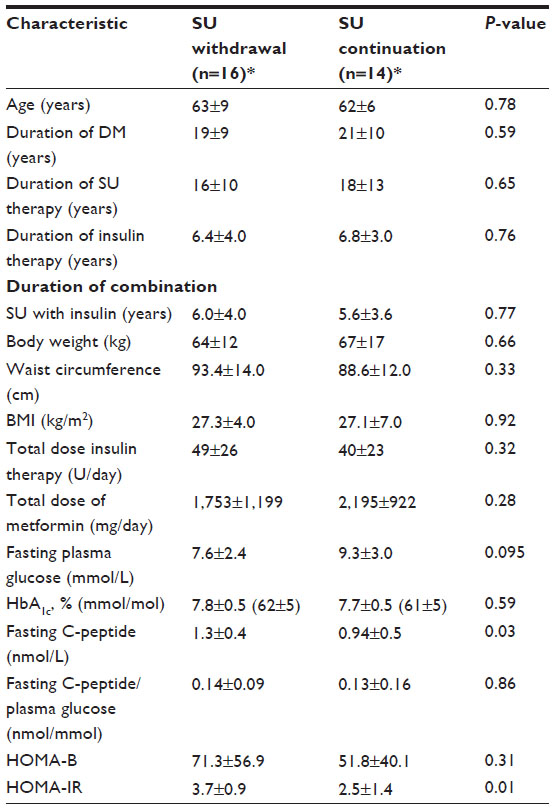 | Table 1 Baseline demographic and clinical characteristics of the study patients |
Effect of SU withdrawal on glycemic control
After 8 weeks, mean HbA1c increased significantly in the SU withdrawal group from 7.8%±0.5% (62±5 mmol/mol) to 8.6%±1.2% (71±13 mmol/mol; P=0.002), as did mean FPG (from 8.0±2.0 mmol/L to 11.0±4.0 mmol/L; P=0.005). However, in the SU continuation group, mean HbA1c changed from 7.7%±0.5% (61±5 mmol/mol) to 7.9%±1.2% (63±13 mmol/mol; P=0.37) and mean FPG from 9.3±3.0 mmol/L to 10.0±4.4 mmol/L (P=0.54; Figure 2A and B). Although glycemic control deteriorated significantly in the SU withdrawal group, none of these subjects required rescue therapy during the study period. Median changes from baseline in HbA1c (+0.9% [+10 mmol/mol] versus +0.2% [+3 mmol/mol]; P=0.009) and FPG (+2.1 mmol/L versus ±0.5 mmol/L; P=0.014) were significantly greater in the SU withdrawal group than in the SU continuation group (Table 2).
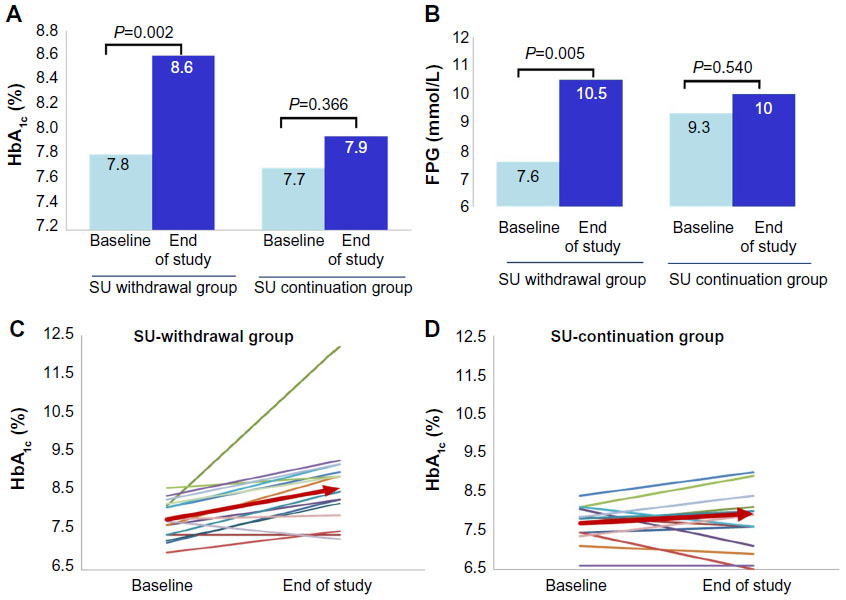 | Figure 2 Comparisons of glycemic control at baseline and at the end of the study in the SU withdrawal group and SU continuation group. (A) Mean HbA1c, (B) mean FPG, changes in HbA1c in individual patients in the (C) SU withdrawal group and (D) the SU continuation group. The arrow demonstrates the mean HbA1c of the group. |
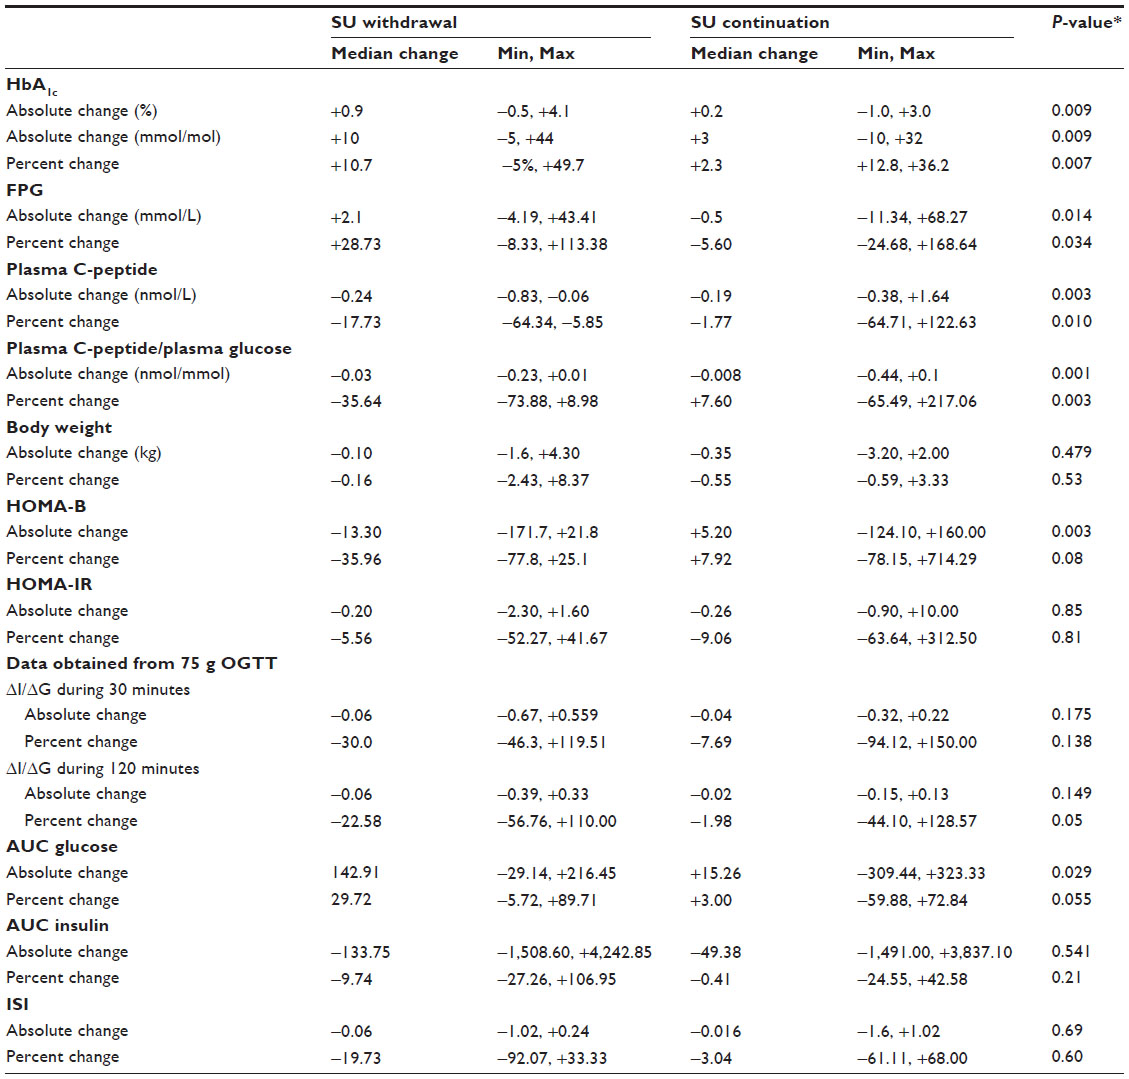 | Table 2 Changes from baseline in parameters of glycemic control, insulin secretion, and insulin resistance |
Deterioration in glycemic control occurred in 12 of 16 (75%) subjects in the SU withdrawal group, compared with five of 14 (35.7%) in the SU continuation group (Figure 2C and D). The relative risk of glycemic deterioration after SU withdrawal was 7.143 (95% confidence interval 1.10–46.22; P=0.04) after adjustment for poor glycemic control at baseline (HbA1c >8%).
Effect of SU withdrawal on insulin secretion and insulin resistance
Two weeks after SU withdrawal, mean plasma glucose levels during the oral glucose tolerance test showed significantly greater increases at all time points than at baseline (from 6.1±2.0 mmol/L to 7.4±2.0 mmol/L; P=0.01), as did the mean area under the curve (AUC) for glucose (from 445.0±114.0 mmol/L to 555.3±121.4 mmol/L; P=0.001). The median AUC for glucose was significantly greater in the SU withdrawal group than in the SU continuation group (+143.0 mmol/L versus +15.3 mmol/L; P=0.029; Figure 3A and B). Insulin secretion, as assessed by changes in median fasting C-peptide levels (−0.24 nmol/L versus –0.19 nmol/L; P=0.003), median fasting C-peptide/glucose ratio (–0.03 nmol/mmol versus +0.008 nmol/mmol; P=0.001) and median HOMA-B (−13.30 versus +5.20; P=0.003), was significantly lower in the SU withdrawal than in the SU continuation group (Figure 3C and D, Table 2). However, the ratio of change of insulin and glucose from baseline (ΔI/ΔG) after 75 g oral glucose tolerance test over 30 minutes and 120 minutes did not differ significantly in the two groups (Table 2 and Figure 3B), and nor did insulin resistance as assessed by changes in HOMA-IR and insulin sensitivity index (Table 2).
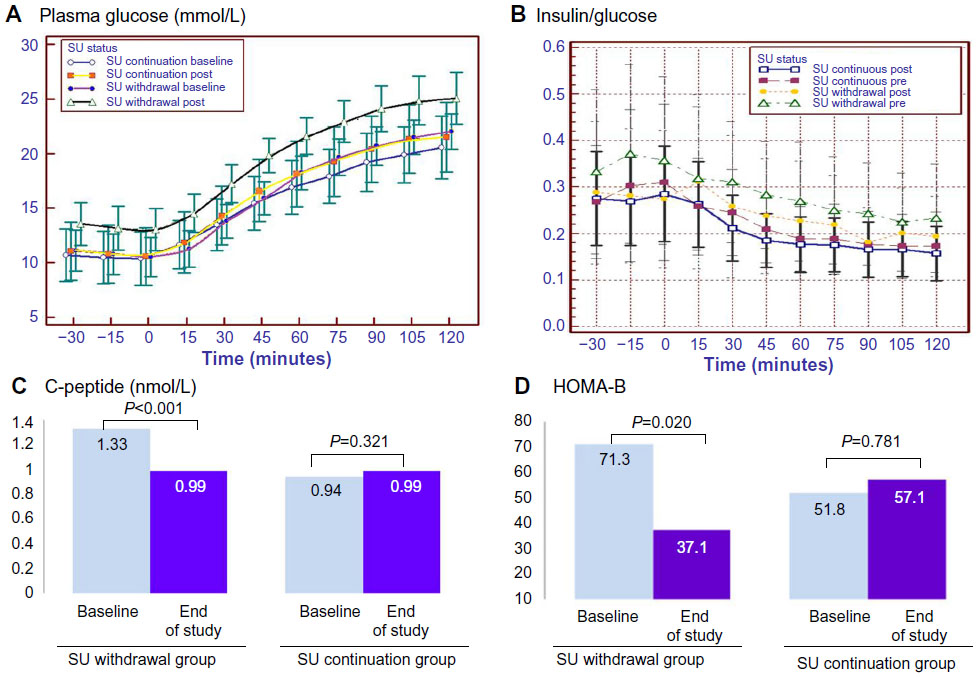 | Figure 3 Change in markers of insulin secretion during a 75 g oral glucose tolerance test. (A) Plasma glucose, (B) insulin/glucose ratio, (C) mean fasting C-peptide and (D) HOMA-B at baseline and the end of study in the SU withdrawal group and SU continuation group. |
Adverse effects of SU continuation
Hypoglycemic events were significantly more frequent in the SU continuation group than in the SU withdrawal group (8.5±1.2 versus 0.6±2.5 per 1,000 persons; P=0.032). None of the subjects experienced a severe hypoglycemic event during the study. Moreover, there were no significant differences in body weight changes from baseline in the two groups (Table 2).
Clinical predictors associated with SU response
Mean HOMA-B was significantly higher (84 versus 36; P=0.03) and mean dosage of insulin significantly lower (41.5 versus 69.5 units; P=0.004) in SU responders than in SU non-responders. However, age, duration of diabetes, duration of SU use, duration of insulin use, duration of combination treatment, mean HbA1c, mean fasting C-peptide, and insulin resistance parameters did not differ between the two groups.
Discussion
Progressive loss of beta-cell function is important in the pathophysiology of type 2 DM and may be responsible for SU failure. Although several studies13–17 have indicated that combinations of SU and insulin can be used to treat these patients after secondary oral drug failure, few studies support this recommendation. The present study found that withdrawal of SU from patients with a long duration of diabetes requiring insulin therapy resulted in a significant deterioration of glycemic control in most cases. Mean HbA1c levels increased from 7.8%±0.5% (62±5 mmol/mol) to 8.6%±1.2% (71±13 mmol/mol) after SU discontinuation. This deterioration of glycemic control was paralleled by a significant decrease in insulin secretion, as measured by C-peptide, HOMA-B, and fasting C-peptide/glucose ratio. Taken together, these findings suggest that SUs enhance insulin secretion, even in patients with a long duration of diabetes (mean 18.7 [range 5–34] years) and on long-term insulin (mean 6.4 [range 3–20] years).
Our results are in agreement with recent findings showing that combinations of lower daily insulin dosages and SUs improved glycemic control.13,18,19 Previous studies have shown that withdrawing SUs from patients with a recent history of secondary SU failure requiring insulin resulted in deterioration of glycemic control.7,8 Furthermore, adding glimepiride to insulin and metformin in patients with long-term type 2 DM was found to be effective in lowering HbA1c and reducing the requirement for exogenous insulin.20 Thus, our results provide further evidence that SUs remain effective in subjects with a long duration of diabetes. We also found that withdrawing an SU resulted in impaired insulin secretion, even in patients with type 2 DM requiring insulin therapy due to secondary SU failure.
The molecular mechanisms underlying the responsiveness of some patients to SU therapy after long-term treatment are unclear. Subjects may have residual beta-cell function sufficient for SU stimulation of insulin production. The mean baseline C-peptide level in our study subjects was 1.14±0.17 nmol/L (3.42±1.32 ng/mL). We found that high HOMA-B and lower doses of insulin were predictors of response to SUs, in agreement with results showing that these factors are indicative of residual beta-cell function sufficient for SU stimulation of insulin secretion. Furthermore, genetic factors such as the OATP1B3 gene may play a role in determining response to SU.21 A recent study also showed no significant difference in beta-cell function after 3.5 years of intensive glucose control with insulin plus metformin treatment or a triple oral hypoglycemic regimen including an SU, indicating that good glycemic control is an important factor in preserving beta-cell function in patients with type 2 diabetes rather than a choice of therapy itself.22
Our study has several limitations. SUs have drawbacks in the treatment of type 2 DM, such as weight gain, risk of hypoglycemia, and beta-cell exhaustion. However, we found that SU withdrawal for 8 weeks did not significantly alter subject weight. Although the frequency of hypoglycemic events was significantly higher in the SU continuation group, its incidence was lower than in previous studies (<1%), with no subject experiencing severe hypoglycemia. These results are consistent with those of a meta-analysis which found that the frequency of hypoglycemia was similar in patients receiving this combination and in those receiving intensive insulin therapy.18,19
Conclusion
This study shows that most patients who had been treated with long-term SU and insulin experienced deterioration in glycemic control and insulin secretion after SU withdrawal, suggesting that this class of drugs remained effective even at a long duration of diabetes stage (median 17 years). Although neither group experienced significant changes in body weight after 8 weeks, the combined regimen slightly increased the risk of hypoglycemia. These studies suggest that, in the absence of hypoglycemic events, SUs should be continued along with insulin therapy.
Acknowledgments
The authors thank Peter Hokland from the Departments of Clinical Medicine and Medical Haematology, Aarhus University, Denmark, for manuscript review and recommendations. The authors also thank Suthipol Udompunthurak from the Department of Health Research and Development, Faculty of Medicine, Siriraj Hospital, Mahidol University, Bangkok, Thailand, for statistical support. This work was supported by a grant from the Routine to Research Unit, Faculty of Medicine Siriraj Hospital, Mahidol University Bangkok Thailand (NT and AS).
Disclosure
The authors report no conflicts of interest relevant to this article.
References
[No authors listed]. Intensive blood-glucose control with sulphonylureas or insulin compared with conventional treatment and risk of complications in patients with type 2 diabetes (UKPDS 33). UK Prospective Diabetes Study (UKPDS) Group. Lancet. 1998;352(9131):837–853. | |
Wright A, Burden AC, Paisey RB, Cull CA, Holman RR. Sulfonylurea inadequacy: efficacy of addition of insulin over 6 years in patients with type 2 diabetes in the UK Prospective Diabetes Study (UKPDS 57). Diabetes Care. 2002;25(2):330–336. | |
Rodbard HW, Jellinger PS, Davidson JA, et al. Statement by an American Association of Clinical Endocrinologists/American College of Endocrinology consensus panel on type 2 diabetes mellitus: an algorithm for glycemic control. Endocr Pract. 2009;15(6):540–559. | |
McGill JB. Selecting among ADA/EASD tier 1 and tier 2 treatment options. J Fam Pract. 2009;58(9 Suppl Treating):S26–S34. | |
Inzucchi SE, Bergenstal RM, Buse JB, et al. Management of hyperglycemia in type 2 diabetes: a patient-centered approach: position statement of the American Diabetes Association (ADA) and the European Association for the Study of Diabetes (EASD). Diabetes Care. 2012;35(6):1364–1379. | |
Harper W, Clement M, Goldenberg R, et al. Canadian Diabetes Association 2013 clinical practice guidelines for the prevention and management of diabetes in Canada: pharmacologic management of type 2 diabetes. Can J Diabetes. 2013;37 Suppl 1:S61–S68. | |
Landstedt-Hallin L, Arner P, Lins PE, Bolinder J, Olsen H, Groop L. The role of sulphonylurea in combination therapy assessed in a trial of sulphonylurea withdrawal. Scandinavian Insulin-Sulphonylurea Study Group Research Team. Diabet Med. 1999;16(10):827–834. | |
Nyback-Nakell A, Adamson U, Lins PE, Landstedt-Hallin L. Glycaemic responsiveness to long-term insulin plus sulphonylurea therapy as assessed by sulphonylurea withdrawal. Diabet Med. 2007;24(12):1424–1429. | |
Abraira C, Henderson WG, Colwell JA, et al. Response to intensive therapy steps and to glipizide dose in combination with insulin in type 2 diabetes. VA feasibility study on glycemic control and complications (VA CSDM). Diabetes Care. 1998;21(4):574–579. | |
Levy JC, Matthews DR, Hermans MP. Correct homeostasis model assessment (HOMA) evaluation uses the computer program. Diabetes Care. 1998;21(12):2191–2192. | |
Matsuda M, DeFronzo RA. Insulin sensitivity indices obtained from oral glucose tolerance testing: comparison with the euglycemic insulin clamp. Diabetes Care. 1999;22(9):1462–1470. | |
Soonthornpun S, Setasuban W, Thamprasit A, Chayanunnukul W, Rattarasarn C, Geater A. Novel insulin sensitivity index derived from oral glucose tolerance test. J Clin Endocrinol Metab. 2003;88(3):1019–1023. | |
Ravnik-Oblak M, Mrevlje F. Insulin versus a combination of insulin and sulfonylurea in the treatment of NIDDM patients with secondary oral failure. Diabetes Res Clin Pract. 1995;30(1):27–35. | |
Del Prato S, Pulizzi N. The place of sulfonylureas in the therapy for type 2 diabetes mellitus. Metabolism. 2006;55(5 Suppl 1):S20–S27. | |
Gutniak M, Karlander SG, Efendic S. Glyburide decreases insulin requirement, increases beta-cell response to mixed meal, and does not affect insulin sensitivity: effects of short- and long-term combined treatment in secondary failure to sulfonylurea. Diabetes Care. 1987;10(5):545–554. | |
Lundershausen R, Orban S, Pissarek D, Panzram G. [Long-term effect of combination glibenclamide-insulin treatment in the secondary failure of sulfonylurea therapy – results of a one-year double blind study]. Wien Klin Wochenschr. 1987;99(17):603–608. German. | |
Nauck MA, Duran S, Kim D, et al. A comparison of twice-daily exenatide and biphasic insulin aspart in patients with type 2 diabetes who were suboptimally controlled with sulfonylurea and metformin: a non-inferiority study. Diabetologia. 2007;50(2):259–267. | |
Pugh JA, Wagner ML, Sawyer J, Ramirez G, Tuley M, Friedberg SJ. Is combination sulfonylurea and insulin therapy useful in NIDDM patients? A metaanalysis. Diabetes Care. 1992;15(8):953–959. | |
Johnson JL, Wolf SL, Kabadi UM. Efficacy of insulin and sulfonylurea combination therapy in type II diabetes. A meta-analysis of the randomized placebo-controlled trials. Arch Intern Med. 1996;156(3):259–264. | |
Nyback-Nakell A, Adamson U, Lins PE, Landstedt-Hallin L. Adding glimepiride to insulin + metformin in type 2 diabetes of more than 10 years’ duration – a randomised, double-blind, placebo-controlled, cross-over study. Diabetes Res Clin Pract. 2014;103(2):286–291. | |
Meyer Zu Schwabedissen HE, Bottcher K, Steiner T, et al. OATP1B3 is expressed in pancreatic beta-islet cells and enhances the insulinotropic effect of the sulfonylurea derivative glibenclamide. Diabetes. 2014;63(2):775–784. | |
Harrison LB, Adams-Huet B, Raskin P, Lingvay I. Beta-cell function preservation after 3.5 years of intensive diabetes therapy. Diabetes Care. 2012;35(7):1406–1412. |
 © 2015 The Author(s). This work is published and licensed by Dove Medical Press Limited. The full terms of this license are available at https://www.dovepress.com/terms.php and incorporate the Creative Commons Attribution - Non Commercial (unported, v3.0) License.
By accessing the work you hereby accept the Terms. Non-commercial uses of the work are permitted without any further permission from Dove Medical Press Limited, provided the work is properly attributed. For permission for commercial use of this work, please see paragraphs 4.2 and 5 of our Terms.
© 2015 The Author(s). This work is published and licensed by Dove Medical Press Limited. The full terms of this license are available at https://www.dovepress.com/terms.php and incorporate the Creative Commons Attribution - Non Commercial (unported, v3.0) License.
By accessing the work you hereby accept the Terms. Non-commercial uses of the work are permitted without any further permission from Dove Medical Press Limited, provided the work is properly attributed. For permission for commercial use of this work, please see paragraphs 4.2 and 5 of our Terms.