")
Back to Journals » Clinical Ophthalmology » Volume 10
Wide-field laser ophthalmoscopy for imaging of gas-filled eyes after macular hole surgery
Authors Nakao S, Arita R, Sato Y, Enaida H, Ueno A, Matsui T, Salehi-Had H, Ishibashi T, Sonoda K
Received 5 April 2016
Accepted for publication 9 June 2016
Published 24 August 2016 Volume 2016:10 Pages 1623—1630
DOI https://doi.org/10.2147/OPTH.S109900
Checked for plagiarism Yes
Review by Single anonymous peer review
Peer reviewer comments 2
Editor who approved publication: Dr Scott Fraser
Shintaro Nakao,1 Ryoichi Arita,1 Yuki Sato,2 Hiroshi Enaida,3 Akifumi Ueno,2 Takaaki Matsui,2 Hani Salehi-Had,4 Tatsuro Ishibashi,1 Koh-hei Sonoda1
1Department of Ophthalmology, Graduate School of Medical Sciences, Kyushu University, 2Ohshima Hospital of Ophthalmology, Fukuoka, 3Department of Ophthalmology, Faculty of Medicine, Saga University, Saga, Japan; 4Atlantis Eyecare, Huntington Beach, CA, USA
Background and objective: Existing ophthalmoscopy methods are unable to obtain clear fundus autofluorescence (FAF) images in gas-filled eyes. The purpose of this study was to evaluate the capability of wide-field laser ophthalmoscopy (Optos) in obtaining FAF images in gas-filled eyes for the assessment of macular hole (MH) closure after surgery.
Methods: This was an interventional case series. Eighteen consecutive patients with unilateral MH underwent vitrectomy with internal limiting membrane peeling and 20% sulfur hexafluoride gas tamponade. FAF images using Optos were recorded preoperatively and postoperatively (days 1, 2, and 7).
Results: On postoperative days 1, 2, and 7, FAF images were obtained from 11/18 (61.1%), 9/18 (50.0%), and 17/18 eyes (94.4%), respectively, using Optos. The quality of FAF images using Optos was sufficient to determine MH closure in 9/18 (50.0%) of gas-filled eyes postoperatively. Quantitative analysis of FAF images was helpful in determining complete or partial closure of the MH.
Conclusion: FAF imaging using Optos might be a useful adjunct to optical coherence tomography as a supportive method to guide the release from facedown posturing in some cases of MH.
Keywords: Optos, fundus autofluorescence, facedown, gas, vitrectomy
Introduction
Macular hole (MH) is a full-thickness defect of the retinal tissue involving the anatomical fovea. The advent of vitrectomy surgery and subsequent refinements of surgical techniques have led to improved visual outcomes.1,2 Currently, MH treatment includes small-gauge pars plana vitrectomy with internal limiting membrane (ILM) peeling and placement of intraocular air or gas tamponade, followed by facedown posturing by the patient. The single surgery anatomical closure rate of MH is >90%.3 Despite a high success rate, significant controversy exists over the duration of facedown posturing.4,5 Apart from the inconvenience, prolonged facedown positioning imposes physical, mental, and medical risks that can be a major burden for elderly patients. Diagnosis of MH closure in gas-filled eyes is important in cases selected for long periods of posturing.
Recently, various studies have indicated that monitoring of MH closure through the air bubble in patients with a gas-filled eye could be achieved by postoperative optical coherence tomography (OCT).3 This method could be useful in cases selected for long periods of facedown posturing.6 However, good quality OCT images in gas-filled eyes are not always obtainable.
Fundus autofluorescence (FAF), derived from the lipofuscin-laden retinal pigment epithelium, has been introduced as a new tool for the diagnosis and evaluation of MH surgical outcomes.7,8 In normal eyes, autofluorescence of the retinal pigment epithelium underlying the fovea is decreased due to the absorption of excitation light by the yellow macular pigment in the overlying retina. An increased intensity of an autofluorescence spot in the macula is consistent with a loss of foveal tissue, especially in a complete full-thickness MH.7 FAF disappearance from the MH could occur after successful surgical repair.8
An ultrawide-field scanning laser ophthalmoscope with a green (532 nm) and a red (633 nm) laser (Optos 200TX; Optos PLC, Dunfermline, Scotland, UK) has been developed and is widely used in clinical ophthalmology. The device scans up to 200° and has an image capture time of 0.25 second in nonmydriatic conditions. Color, fluorescein angiography, and FAF imaging are available from the same platform. The efficacy of Optos in diabetic retinopathy has been reported,9 and a recent report showed that FAF changes detected with Optos was also useful in evaluating the characterization of rhegmatogenous retinal detachment.10 In this study, we examined the diagnostic utility of Optos in evaluating MH closure in gas-filled eyes.
Patients and methods
Although Optos is noninvasive, written informed consent was obtained from all patients. A total of 18 consecutive eyes of 18 patients with unilateral MHs, who underwent vitrectomy between July 2013 and October 2015, were included in the study. Full preoperative ophthalmologic examinations including best-corrected visual acuity, slit lamp examination, fundus examination, axial length measurement with the IOL master (Carl Zeiss Meditec AG; Jena, Germany), spectral domain-OCT (SD-OCT) (HRA; Heidelberg Engineering GmbH, Dossenheim, Germany) or OCT RS-3000 (Nidek, Gamagori, Japan), and Optos 200TX FAF (Optos PLC) were performed for every patient. This study was approved by the Oshima Hospital of Ophthalmology ethics committee and was performed in accordance with the ethical standards laid down by the Declaration of Helsinki.
Surgical technique
Surgery consisted of standard pars plana vitrectomy using a 25-gauge system. All patients underwent surgery with vitrectomy and posterior hyaloid dissection, epiretinal membrane excision when present, and ILM peeling (ILM dissection with a diameter not less than 2,500 μm), and was assisted in all cases with brilliant blue G staining and a final fluid–air exchange. The brilliant blue G solution (Coomassie BBG 250; Sigma-Aldrich Co., St Louis, MO, USA) was prepared at a concentration of 0.25 mg/mL in BSS plus (Alcon, Fort Worth, TX, USA). Phacoemulsification with implantation of an intraocular lens was performed on all cataractous eyes. Air–gas exchange was performed with 20% sulfur hexafluoride (SF6) to tamponade the retina immediately after the vitrectomy. The gas completely filled the vitreous cavity.
Estimation of MH
On preoperative day 1 and postoperative days 1, 2, and 7, OCT and Optos 200TX FAF were imaged in all patients. These images were compressed into high-quality jpeg files and evaluated independently by two independent masked retina specialists (SN and RA) for the status of the MH at the indicated postoperative days. When the estimations of the two observers were different, a third observer (HE) who was also masked to the clinical status would estimate the status. In this study, facedown posturing continued until MH closure including bridge formation was confirmed by OCT. When MH closure was confirmed by OCT, the facedown position was discontinued, although the patients were instructed to avoid a supine position. When OCT showed the MH to be open or when it was inconclusive, the facedown position was maintained, even if decreased autofluorescence was observed in Optos.
Quantitative analysis of autofluorescence
FAF images from Optos were used for the quantitative analysis in the fovea by evaluating an area that is two-disc diameters in size. Each FAF image was saved as a jpeg file and cropped to two-disc diameter size with standardized illumination and contrast using Adobe Photoshop CS3 (Adobe Systems, San Diego, CA, USA). A horizontal line was drawn through the center of the MH in ImageJ 1.42K (National Institutes of Health, USA) using the OCT image or the color fundus photo preoperatively. In all cases, this line was carefully determined in postoperative images using location of retinal vessels and reference to the preoperative image. The intensity of each FAF image on the drawn line in the fovea was calculated with ImageJ 1.42K. The maximum and minimum values were configured as 100 and 0, respectively. From the values, the intensity of the MH autofluorescence was calculated as a percentage of the preoperative OCT image or the color fundus photo. The intensity graphs were created using Excel 2008 (Microsoft Corporation, Redmond, WA, USA).
Results
To evaluate the utility of FAF imaging by Optos in estimating MH status in the gas-filled eye, the study included 18 consecutive eyes of 18 patients (nine eyes of nine females and nine eyes of nine males) with unilateral MHs. Age ranged from 31 to 79 years. Preoperatively, 16 eyes were phakic, and two eyes were pseudophakic. Thus, 14 eyes received phacovitrectomy and four eyes received vitrectomy alone. One eye had a stage 1b MH (5.6%), three eyes had a stage 2 MH (16.7%), five eyes had a stage 3 MH (27.8%), and nine eyes had a stage 4 MH (50.0%). The size of the MHs ranged from 82 to 706 μm (average ± standard deviation [SD]; 390±172 μm). These are summarized in Table 1.
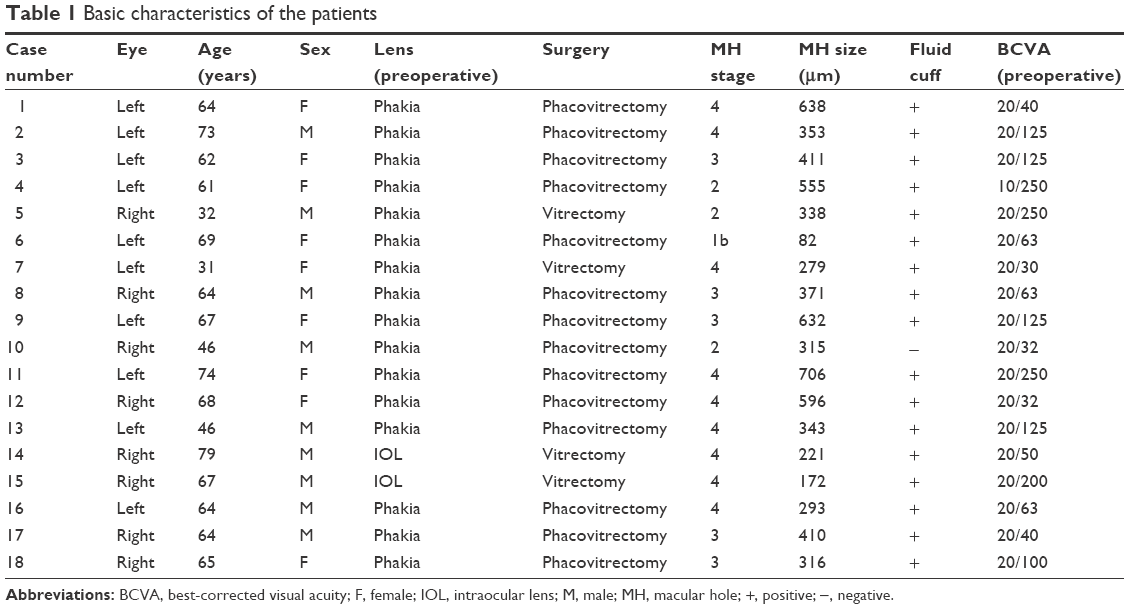 | Table 1 Basic characteristics of the patients |
Preoperatively, one patient with stage 1b MH showed small but definitive increased autofluorescence in the fovea compared with the surrounding foveal area (case 6). All three patients with stage 2 MH showed intense autofluorescence at the site of the hole at preoperative Optos imaging. Clear increased autofluorescence signal at the MH area could not be shown with preoperative Optos imaging in two cases of the stage 3 and two cases of the stage 4 MH, respectively (40.0% and 22.2%) (Table 2). In contrast, all MH could be diagnosed by OCT before surgery.
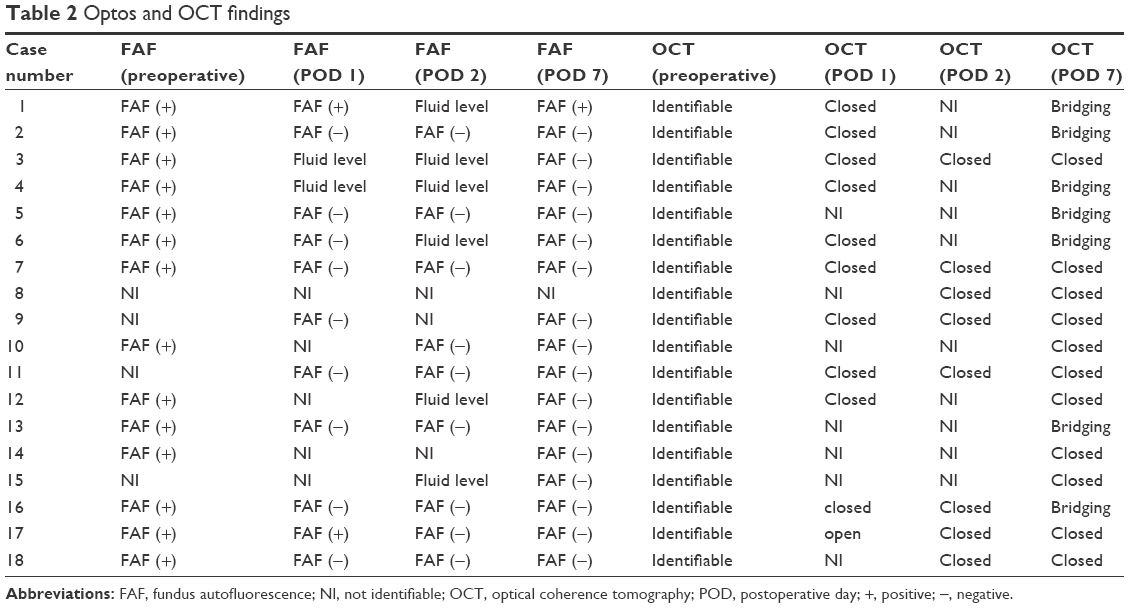 | Table 2 Optos and OCT findings |
On postoperative day 1, 11 of 18 eyes (61.1%) had Optos images that were of a quality that could be used for quantitative analysis of MH closure (Table 3). Among the seven postoperative Optos-undetectable cases, two cases (cases 3 and 4) could not be used due to the gas–water interface at the MH area. The remaining five eyes (cases 8, 10, 12, 14, and 15) did not show interpretable images in spite of the gas fill being over 60% of the vitreous cavity. Quantitative analysis in cases with clear FAF images showed that the FAF intensity before surgery was 75.4%±16.7% (mean ± SD), whereas the intensity was 45.5%±17.2% (mean ± SD) 1 day after surgery (n=14 and 11, respectively) (Table 4). The postoperative status of the MH could be determined by OCT in eleven of 18 eyes (61.1%) on day 1 after the surgery (Table 2). The finding between the FAF and OCT was consistent in eleven of 18 eyes (61.1%) on postoperative day 1 (Table 3).
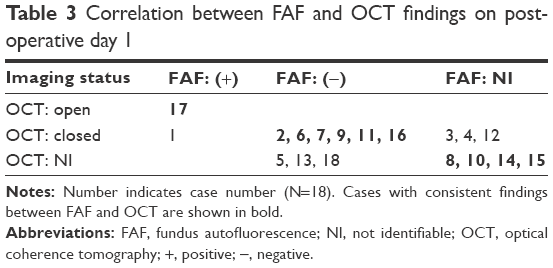 | Table 3 Correlation between FAF and OCT findings on postoperative day 1 |
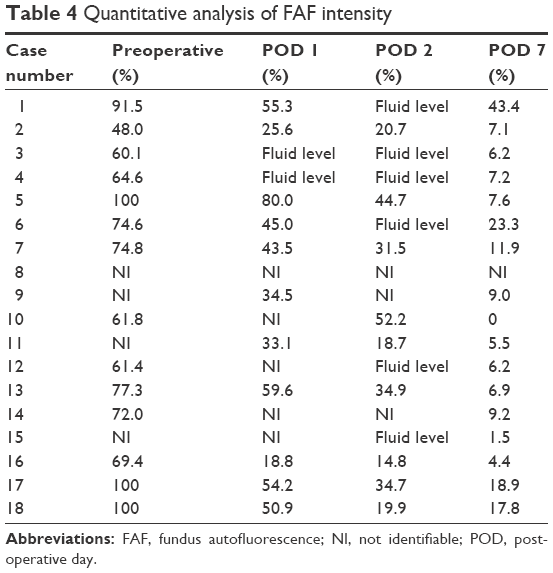 | Table 4 Quantitative analysis of FAF intensity |
On postoperative day 2, nine of 18 eyes (50.0%) could be imaged by Optos. In six eyes (33.3%), a clear FAF image could not be obtained due to the gas–water interface being in the MH area. The reason for Optos imaging failure in the other three eyes was unknown (16.7%). OCT assessable images could be obtained in eight cases on postoperative day 2 (Table 2).
On postoperative day 7, 17 of 18 eyes (94.4%) could be imaged by Optos, and decreased FAF signals were obtained in the macula of most cases (Table 2). In one eye (case 1), FAF demonstrated persistent small hyperfluorescence in the fovea. Quantitative analysis showed that the FAF intensity was 17.1%±13.6% (mean ± SD) 7 days after surgery (Table 4). In contrast, clear images of the macula were obtained in all eyes by OCT. OCT could confirm MH closure in all cases on postoperative day 7.
Case presentation
Case 18
A 65-year-old woman had a stage 3, 316 μm MH in the right eye (Figure 1A). Visual acuity was decreased to 20/100. The study of preoperative FAF images obtained with Optos revealed an autofluorescence signal corresponding to the MH (Figure 1B and C). On day 1 after vitrectomy, OCT was not identifiable clearly (Figure 1D). In accordance with the observation, a foveal autofluorescence signal could not be detected by Optos in the SF6 gas-filled eye (Figure 1E and F). On postoperative day 7 after the gas disappeared, OCT confirmed that the hole was closed with small subfoveal space (Figure 1G). Optos also could not detect any significant foveal autofluorescence signal (Figure 1H and I). Quantitative analysis showed a gradual decrease in FAF intensity during MH closure after the surgery (Figure 1J–L, Table 4).
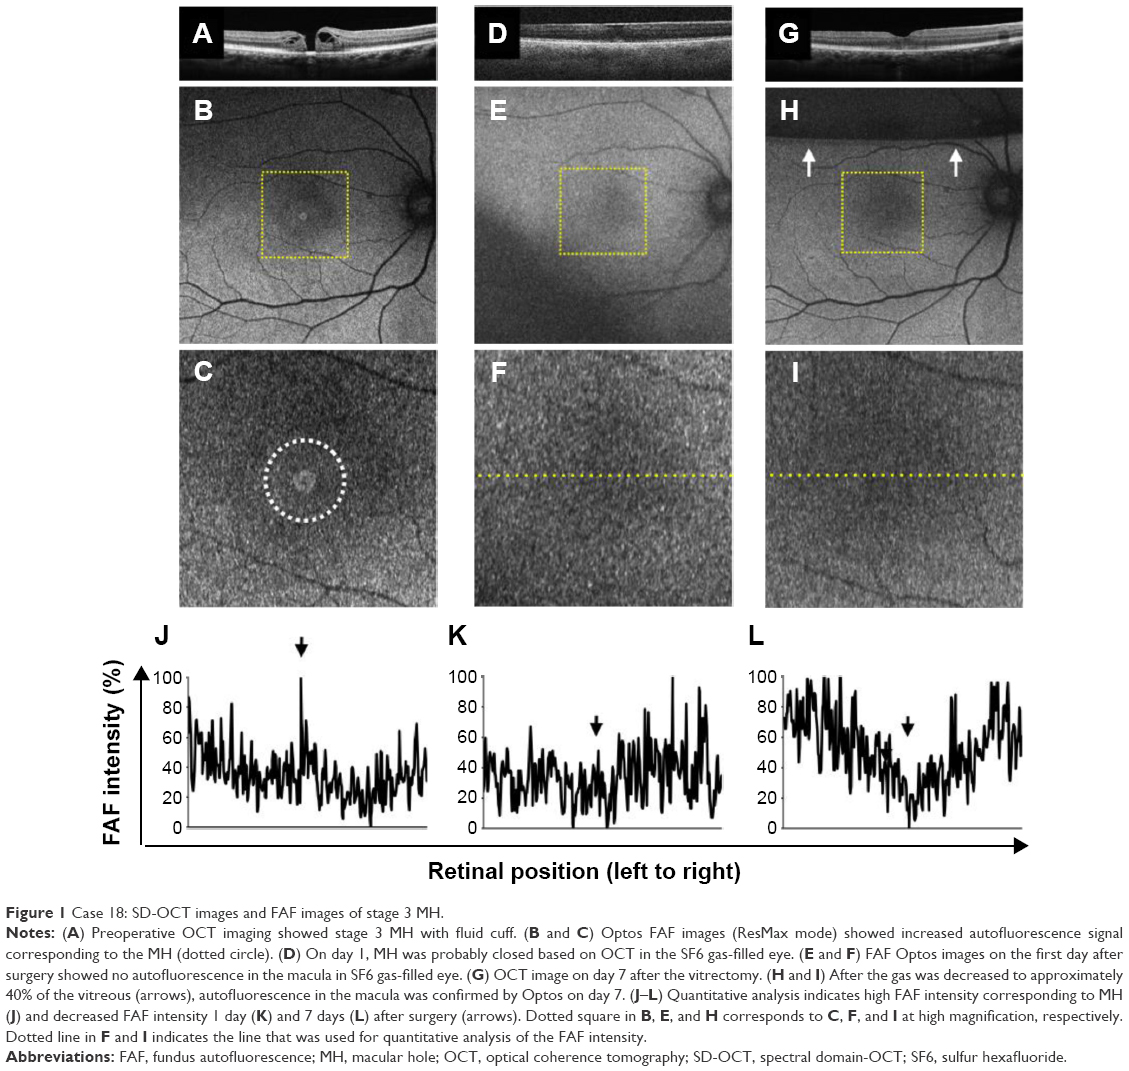 | Figure 1 Case 18: SD-OCT images and FAF images of stage 3 MH. |
Case 1
A 64-year-old woman had a stage 4 MH in the left eye (Figure 2A). The visual acuity was decreased to 20/40. The smallest MH diameter was 638 μm. Study of FAF images obtained with Optos showed an increased autofluorescence signal corresponding to the MH (Figure 2B and C). This patient underwent surgery with pars plana vitrectomy and posterior hyaloid dissection and ILM peeling assisted with brilliant blue G staining, and a final air–gas exchange with 20% SF6 gas. On postoperative day 1, OCT showed bridge formation (foveal detachment) (Figure 2D). Study of FAF images obtained with Optos showed reduced but persistent autofluorescence in the macula in the SF6 gas-filled eye (Figure 2E and F). After reabsorption of the gas, the OCT examination confirmed foveal detachment (Figure 2G). FAF imaging by Optos showed a ring of hypoautofluorescence surrounding the central area of relative hyperautofluorescence (Figure 2H and I). The quantitative analysis confirmed high FAF intensity (91.5%) before the operation and decreased FAF intensity (55.3% and 43.4%) 1 and 7 days after the surgery, respectively (Figure 2J–L, Table 4). This case indicates that bridge formation (foveal detachment) could decrease FAF intensity.
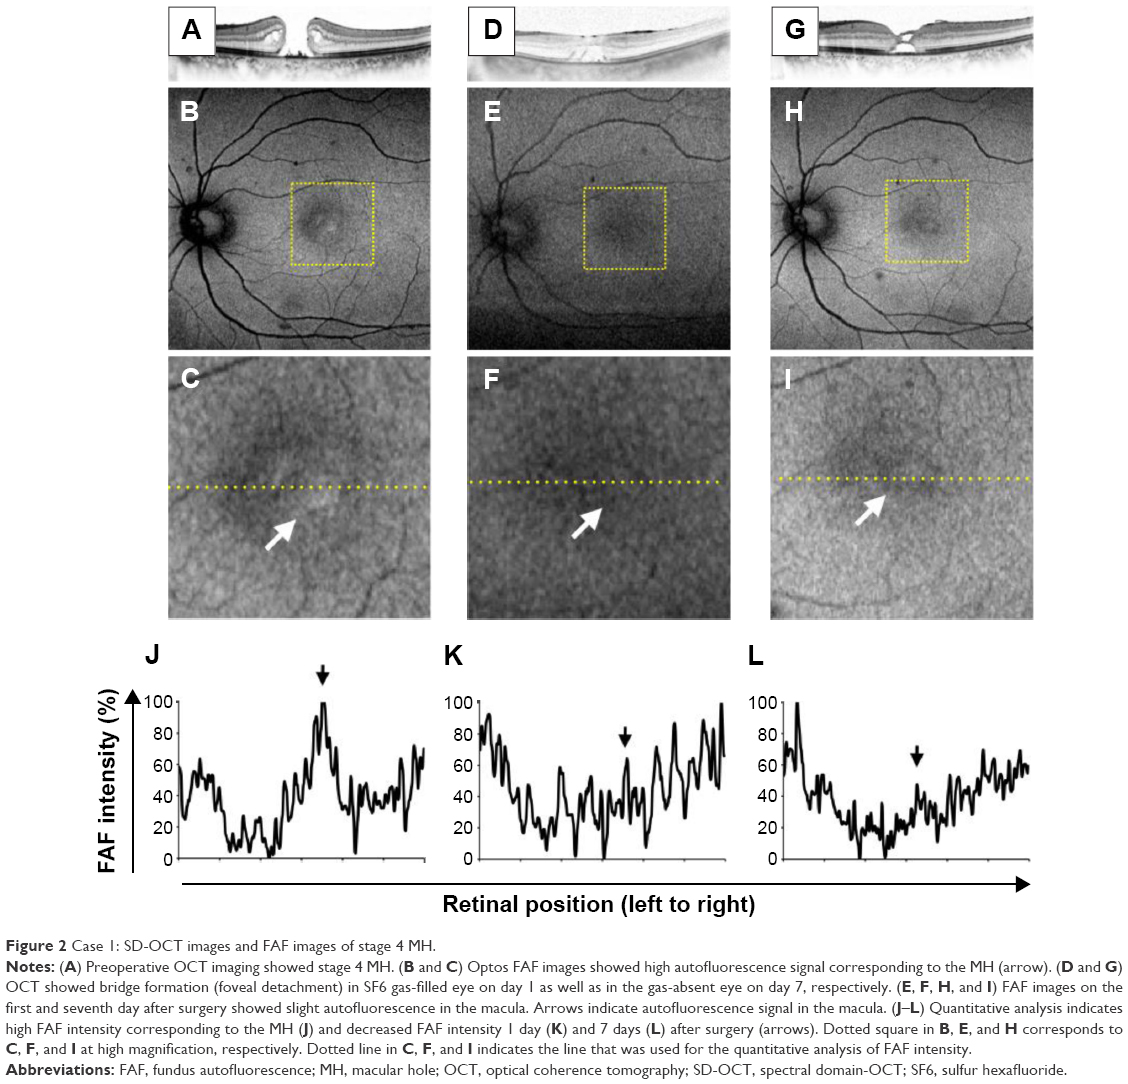 | Figure 2 Case 1: SD-OCT images and FAF images of stage 4 MH. |
Discussion
The diagnosis of idiopathic full-thickness MH is usually made by biomicroscopic examination and OCT. The surgical repair of MH involves pars plana vitrectomy with removal of the ILM and filling of the vitreous cavity with gas followed by facedown posturing by the patient. In most facilities, actual anatomical closure of the MH after surgery is confirmed mainly by OCT. Recent studies have demonstrated the ability of OCT to successfully image the macula through gas and to guide the duration of facedown posturing.3,6,8,11 However, a few studies have reported MH reopening after OCT-guided releasing of facedown posturing.12 Arima et al13 reported a case of an anatomically closed MH reopening, 2 days after the release of facedown positioning where OCT showed anatomical closure of the MH, but bright hyperfluorescence in the fovea was detected by FAF imaging.13 Thus, OCT and FAF imaging may exhibit discrepant findings in some cases. Furthermore, in this study, either FAF or OCT in six of 18 eyes (33.3%) was not identifiable on postoperative day 1 (Table 3). Therefore, this current study suggests that FAF imaging by Optos, and OCT could be complementary tools in estimating postoperative MH status.
In one case, Optos detected reduced but persistent autofluorescence in the macula in an SF6 gas-filled eye in spite of OCT showing bridge formation (case 1). Although this case did not result in reopening of the MH after release of the facedown positioning, reopening of a closed MH with bridge formation might occur in some cases. In another case (case 2), reduced autofluorescence was detected on Optos FAF imaging on day 7 after surgery in spite of bridge formation on OCT. The difference in FAF intensity between case 1 and case 2 might be due to the thickness of the bridging retinal tissue. The bridging tissue in case 1 may have been too thin to block the excitation wave light. The FAF image early after MH surgery could be an important indicator of the degree of MH closure. Furthermore, our finding suggests that maintenance of the facedown position may be required depending on FAF intensity. However, further investigations with larger sample sizes would be necessary to determine the threshold of reduced autofluorescence that would predict a possible reopening of a closed MH after surgery.
As gas-filled eyes shift toward high myopia,14 OCT images have to be taken with a −20 diopter adjustment.11 OCT imaging also requires a high level of technical skill, and there is a steep learning curve involved in obtaining good quality OCT images of gas-filled eyes. In this study, on postoperative day 1, OCT images and FAF images could be obtained from 11/18 eyes and 11/18 eyes, respectively. In three cases, OCT was insufficient to determine MH closure, but FAF produced analyzable images. Optos-imaged FAF could thus be a helpful imaging modality in evaluating MH closure and complementing OCT analysis. However, the image quality might be affected in patients with postsurgical corneal conditions, increased intraocular pressure, or inflammation of anterior segment. In this study, four of the 18 MHs could not be detected by Optos FAF imaging before surgery. These four cases were either stage 3 or stage 4 MH. It is possible that the area of decreased foveal autofluorescence in these cases represents the floating of the operculum or the cuff of neurosensory retinal detachment surrounding the MH. Non-Optos FAF devices are unable to obtain good quality images in gas-filled eyes. The myopic shift in gas-filled eyes may be a reason why clear FAF images cannot be obtained with non-Optos FAF devices. Optos is widely used in clinical ophthalmology because of the wide-angle view of the retina that it captures.9,10 The system also includes an auto-focusing technology, which enables images to be taken regardless of the axial length.15 Therefore, the use of Optos to obtain high-quality images of a gas-filled eye circumvents the technical challenges posed by other fundus cameras or the OCT.
The gas–water interface in the gas-filled eye often disturbs OCT imaging. Optos imaging of the macular area could also be disturbed by the gas–water interface in some cases. Changing the orientation of the subject’s face or the eye fixation may improve the FAF image quality. In this study, lid retractors were not used in Optos imaging, which may have been useful based on a previous report utilizing an eyelid speculum in Optos imaging,16 and this technique may be used in future studies to obtain better quality FAF images.
Conclusion
In conclusion, we report that Optos can provide high-quality FAF images from gas-filled eyes after MH surgery in some cases. FAF imaging using Optos and subsequent quantitative analysis of these images might be a useful tool for the surgeon in deciding the release of the patient from facedown posturing.
Acknowledgments
We thank Chuo Sango Co. for the technical support. We also thank Masanori Miyazaki, Yuji Oshima, Yasuhiro Ikeda, and Shigeo Yoshida for helpful suggestions. This study is supported by grants from Japan Society for the Promotion of Science KAKENHI, Grant-in-Aid for Young Scientists (A) number 25713057 (SN).
Disclosure
The authors report no conflicts of interest in this work.
References
Kadonosono K, Itoh N, Uchio E, Nakamura S, Ohno S. Staining of internal limiting membrane in macular hole surgery. Arch Ophthalmol. 2000;118:1116–1118. | ||
Kelly NE, Wendel RT. Vitreous surgery for idiopathic macular holes. Results of a pilot study. Arch Ophthalmol. 1991;109:654–659. | ||
Eckardt C, Eckert T, Eckardt U, Porkert U, Gesser C. Macular hole surgery with air tamponade and optical coherence tomography-based duration of face-down positioning. Retina. 2008;28:1087–1096. | ||
Krohn J. Duration of face-down positioning after macular hole surgery: a comparison between 1 week and 3 days. Acta Ophthalmol Scand. 2005;83:289–292. | ||
Iezzi R, Kapoor KG. No face-down positioning and broad internal limiting membrane peeling in the surgical repair of idiopathic macular holes. Ophthalmology. 2013;120:1998–2003. | ||
Masuyama K, Yamakiri K, Arimura N, Sonoda Y, Doi N, Sakamoto T. Posturing time after macular hole surgery modified by optical coherence tomography images: a pilot study. Am J Ophthalmol. 2009;147:481–488;e482. | ||
Ciardella AP, Lee GC, Langton K, Sparrow J, Chang S. Autofluorescence as a novel approach to diagnosing macular holes. Am J Ophthalmol. 2004;137:956–959. | ||
Shiragami C, Shiraga F, Nitta E, Fukuda K, Yamaji H. Correlation of increased fundus autofluorescence signals at closed macula with visual prognosis after successful macular hole surgery. Retina. 2012;32:281–288. | ||
Wessel MM, Aaker GD, Parlitsis G, Cho M, D’Amico DJ, Kiss S. Ultra-wide-field angiography improves the detection and classification of diabetic retinopathy. Retina. 2012;32:785–791. | ||
Witmer MT, Cho M, Favarone G, Chan RV, D’Amico DJ, Kiss S. Ultra-wide-field autofluorescence imaging in non-traumatic rhegmatogenous retinal detachment. Eye (Lond). 2012;26(9):1209–1216. | ||
Yamashita T, Kawano H, Sonoda Y, Yamakiri K, Sakamoto T. Early imaging of macular hole closure: a diagnostic technique and its quality for gas-filled eyes with spectral domain optical coherence tomography. Ophthalmologica. 2013;229:43–49. | ||
Shah SP, Manjunath V, Rogers AH, Baumal CR, Reichel E, Duker JS. Optical coherence tomography-guided facedown positioning for macular hole surgery. Retina. 2013;33:356–362. | ||
Arima M, Miyazaki M, Kohno R, Hata Y, Ishibashi T. An early “reopening” case of idiopathic macular hole; supportive usefulness of fundus autofluorescence. Graefes Arch Clin Exp Ophthalmol. 2009;247:711–714. | ||
Thaller VT. Indirect funduscopy in a gas filled eye: an observation. Br J Ophthalmol. 1986;70:155–156. | ||
Nakao S, Arita R, Nakama T, et al. Wide-field laser ophthalmoscopy for mice: a novel evaluation system for retinal/choroidal angiogenesis in mice. Invest Ophthalmol Vis Sci. 2013;54:5288–5293. | ||
Inoue M, Yanagawa A, Yamane S, Arakawa A, Kawai Y, Kadonosono K. Wide-field fundus imaging using the Optos Optomap and a disposable eyelid speculum. JAMA Ophthalmol. 2013;131:226. |
 © 2016 The Author(s). This work is published and licensed by Dove Medical Press Limited. The full terms of this license are available at https://www.dovepress.com/terms.php and incorporate the Creative Commons Attribution - Non Commercial (unported, v3.0) License.
By accessing the work you hereby accept the Terms. Non-commercial uses of the work are permitted without any further permission from Dove Medical Press Limited, provided the work is properly attributed. For permission for commercial use of this work, please see paragraphs 4.2 and 5 of our Terms.
© 2016 The Author(s). This work is published and licensed by Dove Medical Press Limited. The full terms of this license are available at https://www.dovepress.com/terms.php and incorporate the Creative Commons Attribution - Non Commercial (unported, v3.0) License.
By accessing the work you hereby accept the Terms. Non-commercial uses of the work are permitted without any further permission from Dove Medical Press Limited, provided the work is properly attributed. For permission for commercial use of this work, please see paragraphs 4.2 and 5 of our Terms.