")
Back to Journals » Psychology Research and Behavior Management » Volume 12
Why Do Most Restrained Eaters Fail in Losing Weight?: Evidence from an fMRI Study
Authors Su Y, Bi T , Gong G, Jiang Q, Chen H
Received 23 August 2019
Accepted for publication 3 December 2019
Published 19 December 2019 Volume 2019:12 Pages 1127—1136
DOI https://doi.org/10.2147/PRBM.S228430
Checked for plagiarism Yes
Review by Single anonymous peer review
Peer reviewer comments 2
Editor who approved publication: Dr Igor Elman

Yanhua Su,1 Taiyong Bi,1 Gaolang Gong,2,3 Qiu Jiang,4,5 Hong Chen4,5
1Center for Mental Health Research in School of Management, Zunyi Medical University, Zunyi 563000, People’s Republic of China; 2State Key Laboratory of Cognitive Neuroscience and Learning, IDG/McGovern Institute for Brain Research, Beijing Normal University, Beijing 100875, People’s Republic of China; 3Beijing Key Laboratory of Brain Imaging and Connectomics, Beijing Normal University, Beijing, People’s Republic of China; 4Key Laboratory of Cognition and Personality (SWU), Ministry of Education, Chongqing 400715, People’s Republic of China; 5School of Psychology, Southwest University, Chongqing 400715, People’s Republic of China
Correspondence: Hong Chen
School of Psychology, Southwest University, Beibei, Chongqing 400715, People’s Republic of China
Email [email protected]
Qiu Jiang
Department of Psychology, Southwest University, Chongqing 400715, People’s Republic of China
Email [email protected]
Background: Restraint dieting is a key step in the avoidance of obesity and other eating problems, but why some restraint eaters (REs) succeed and some fail in dieting is unknown. The difference between successful REs (S-REs) and unsuccessful REs (US-REs) is still unknown. This is the first study to compare the fMRI reactivity among US-REs, S-REs and unrestrained eaters (UREs) in a food-related Go/NoGo paradigm.
Methods: Functional magnetic resonance imaging (fMRI) was used to examine the neural responses corresponding to the success of dieting in REs. Eighteen S-REs, 17 US-REs and 17 UREs were asked to perform a Go/No-Go task after being shown pictures of either high-caloric or low-caloric food.
Results: fMRI results revealed stronger activations for high-caloric food in areas associated with executive function and inhibition (i.e., middle frontal gyrus and cerebellum) among S-REs than among US-REs. In contrast, both US-REs and UREs showed stronger activations for low-caloric food in reward areas (i.e., orbitofrontal cortex (OFC)) than S-REs.
Conclusion: Our results provide evidence that food temptations may trigger processes of successful inhibition control in S-REs, whereas US-REs may fail in resisting the attraction to high-caloric food, thereby showing a high probability of overeating.
Keywords: successful and unsuccessful restrained eaters, measurement of restrained eating, inhibition control, fMRI
Introduction
Some theories and researches suggest that there is a widespread dissatisfaction among people especially women with their body shape due to the unrealistic beauty standards in the present society.1–3 Plenty of survey data revealed that women reported lower body satisfaction,4,5 were more likely to diet6 than men do. Even women who are not overweight often aspire for losing weight.7 In modern societies characterized by abundant and easily accessible foods, the prevalence of overweight and obesity is constantly increasing.8 Restrained eating is a very popular means of weight regulation. People who chronically restrict food intake to lose weight or to avoid weight gain are called restrained eaters (REs).9 However, some REs seem to be able to maintain their initial weight loss in the long term, while others fail.10–12 Indeed, it has been experimentally shown that the population of REs consists of two subpopulations that include successful restrained eaters (S-REs) and unsuccessful restrained eaters (US-REs). The S-REs are characterized by the combination of high restraint and low tendency towards overeating, thereby having a low susceptibility towards failure of restraint. In contrast, US-REs are characterized by the combination of high restraint and high tendency towards overeating, thereby having a high susceptibility towards failure of restraint.13,14 For example, Jansen, Nederkoorn, van Baak, Keirse, Guerrieri, Havermans15 pointed out that only the high-restrained eaters who were also highly impulsive showed disinhibition of food intake when exposed to tasty foods, whereas dieting would be much easier and probably much more successful for low-impulsive high-restrained eaters. Why do some REs fail but some succeed in losing weight?
A growing body of evidence links restrained eating to deficits in inhibition control.16–19 Inhibitory control, which refers to the ability to stop or suppress responses that are no longer required, are inappropriate, or are in conflict with current goals,20 has long been postulated to play a key role in successful weight control21,22 and food intake.23 Indeed, emerging behavioural data supported the thesis that REs are associated with less efficient response inhibition and may have increased vulnerability to overeating.15,24–26 Although it has repeatedly been shown that people high in self-reported dietary restraint are worse at inhibition than unrestrained eaters (UREs), some studies found the opposite, namely, that REs were better at inhibiting responses to food cues in a computer task than UREs.23 Moreover, one study has also revealed that there is no difference in food-related inhibitory control between S-REs and US-REs when the self-control resources are non-depleted, while US-REs show a decrease in food-related inhibitory control after ego depletion.27 Most recently, Ganor-Moscovitz, Weinbach, Canetti, Kalanthroff28 found that high REs were better able than low REs to inhibit a response following the presentation of food compared to non-food stimuli. In contrast, low REs were better than high REs at inhibiting a response following non-food compared to food stimuli. Previous studies have presented mixed findings on the inhibition ability of REs due to the limited amount of neural evidence and limitations of behavioural measures. Since the evidence outlined above suggested that REs who are less impulsive are more likely to become S-REs,27,29 it is unclear why these successful individuals should have been more successful initially than their unsuccessful counterparts. One reason may be that the successful REs may show advantages in the function of the inhibition control system, which may help to explain why some REs succeed in losing weight but others fail.
In recent years, functional magnetic resonance imaging (fMRI) studies have begun to provide insights into the difference in the processing of food stimuli. fMRI studies suggest that REs’ behaviourally apparent increased reward response to foods is also reflected in an increased responsiveness of their brains’ reward circuitry during both viewing and tasting food.30–32 Although the evidence outlined above suggests that REs have altered functional brain responses to food, the neural differences in inhibitory control between S-REs and US-REs are yet to be fully understood. To the best of our knowledge, only one fMRI study investigated whether dietary restraint is associated with specific patterns of brain responses. The results showed that cortical areas involved in controlling inappropriate behavioural responses, such as the dorsal prefrontal cortex (DPFC), are particularly activated in successful dieters in response to meal consumption. In response to the same stimulation, the orbitofrontal cortex (OFC) was significantly more activated in non-dieters than in successful dieters.33 However, this study only compared the neural responses between successful REs and controls. The difference between successful REs and failed REs is still unknown. In addition, the participants of this study were nine females approximately 40 years of age. It is unknown whether younger females show the same results. Systematically examining the inhibition ability of REs would be beneficial in uncovering the mechanism of a successful diet and in selecting the optimal treatment for individuals at risk for obesity. Therefore, this is first study to compare the fMRI reactivity among US-REs, S-REs and UREs in a food-related Go/NoGo paradigm and assess whether the neurocognitive functions of inhibition differed among three groups. Based on the literature reviewed above, we hypothesized that S-REs viewing highly caloric food, relative to US-REs, would show more activation in the area related to inhibition and less activity in reward circuitry.
Methods
Participants
Only women were recruited because men and women differ in how and why they gain and lose their weight.34
All participants were healthy, right-handed, young women from Southwest University (SWU) in Chongqing, China. The exclusion criteria included self-reported current medical and/or psychiatric conditions, including eating disorder diagnoses, a history of such conditions, and/or use of medication to treat current medical and/or psychiatric conditions. Furthermore, all participants had a body mass index (BMI) within the average range (M = 21.12, SD = 4.13) and no significant difference between S-REs, US-REs and UREs (F(2,49) = 0.564, p = 0.573). Obese subjects (BMI ≥ 30 kg/m2) were also excluded because of potential neuroanatomical differences that vary as a function of BMI as well as subjects those who had a normal BMI for more than 6 months (Gunstad et al, 2008). Participants were paid 50 RMB for their participation. Table 1 summarizes the characteristics of each group. The research was approved by the human research ethics committee at Southwest University and the number of ethical committee acceptance was H19051. All volunteers provided written, informed consent prior to participation.
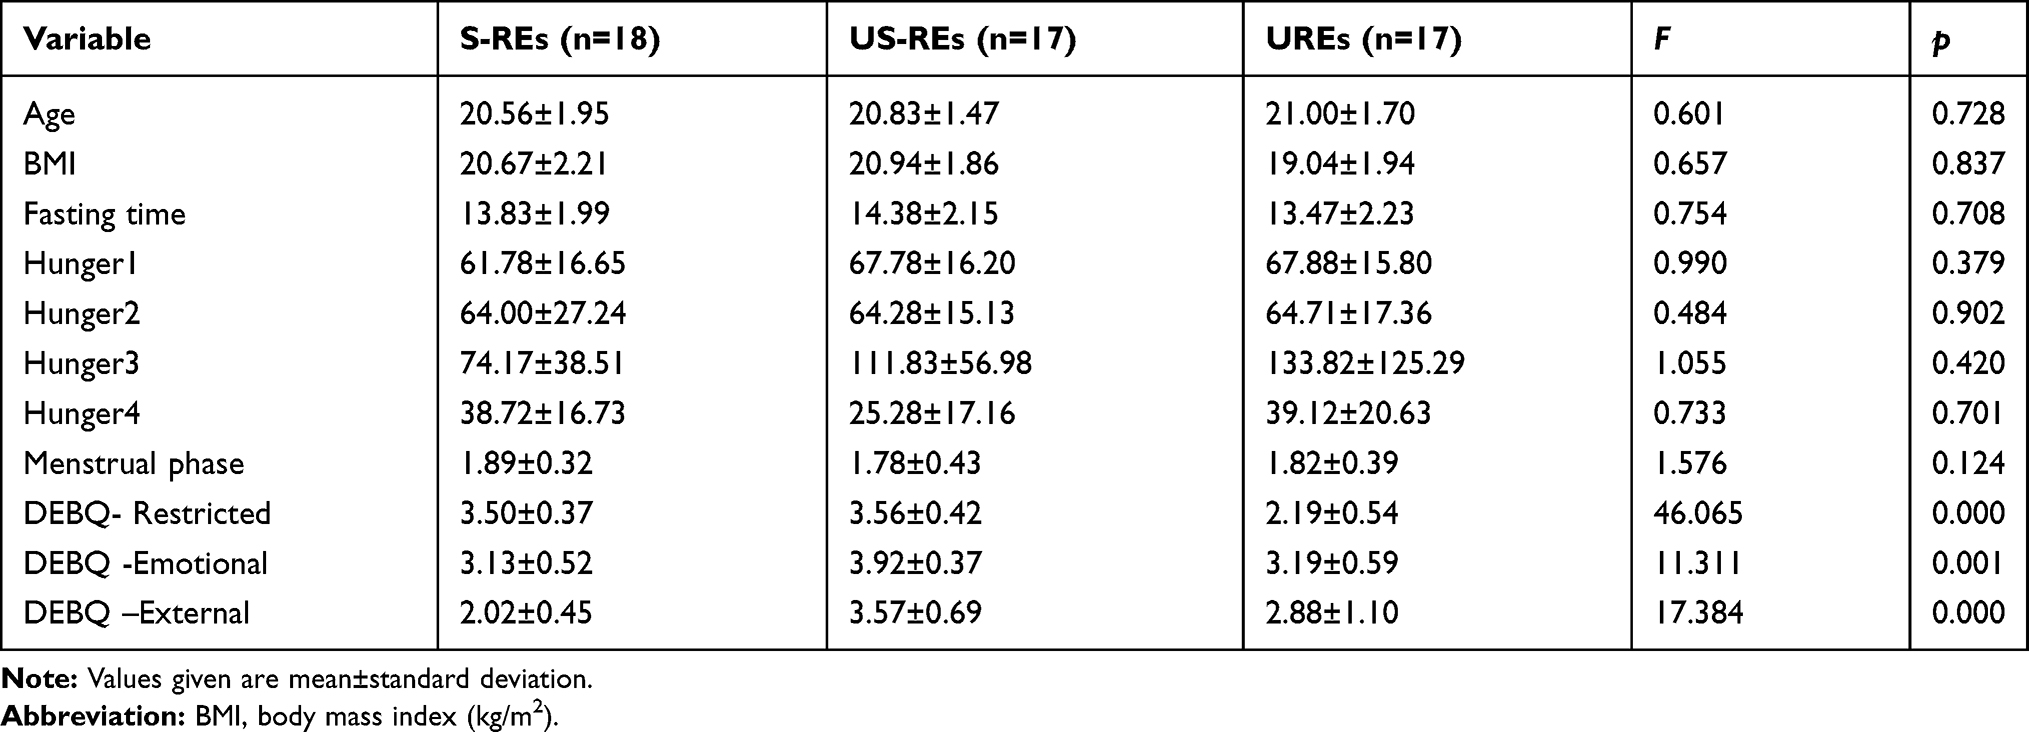 |
Table 1 Demographic Characteristics of the Sample |
Measures
Eligible women were instructed to fast overnight following their evening meal and to refrain from eating and drinking all liquids except water prior to their scan. All scans were conducted between 9:30 and 11:30 AM. Fasting status was confirmed by self-reports upon arrival. Participants completed the demographics questionnaire and then rated their hunger and mood using a verbal hunger questionnaire and their mood on the associated measures scale. Demographic information assessed included age, height, weight and phase of the menstrual cycle. Women were asked how many days had passed since their last menstrual period occurred.
We first measured the hunger state of each participant. A previous study showed that hunger state may influence brain activities;35 therefore, this factor should be controlled in further analyses. Second, we divided the participants into two groups of successful REs and failed REs according to Dutch Eating Behavior Questionnaire (DEBQ) score.36
Hunger State
Participants completed a questionnaire frequently used to assess hunger and fullness31 comprising four questions rated on a 0–100 score, except the 3rd item: 1) “How hungry do you feel right now?” (ranging from “not at all” to “extremely”); 2) “How strong is your desire to eat right now?” (ranging from “very weak” to “very strong”); 3) “How much food do you think you could eat right now, taking rice as reference, gram as unit?”; and 4) “How full does your stomach feel right now?” (ranging from “not at all full” to “very full”).
Dutch Eating Behavior Questionnaire (DEBQ)
The DEBQ with subscales for restrained (10 items; e.g., “Do you deliberately eat less in order to not become heavier?”), emotional (13 items; e.g., “Do you have the desire to eat when you are irritated?”), and external (10 items; e.g., “Do you eat more than usual when you see others eating?”) eating was administered and responded to on a Likert-type scale ranging from 1 (“seldom”) to 5 (“very often”).
Participants were subgrouped on the basis of Dutch Eating Behaviour Questionnaire (DEBQ) scores.37 The S-REs (n=18) were eligible to participate if they scored more than 2.7 on the Restrained Eating subscale of the DEBQ and less than 3.0 on the Emotional and External Eating subscales of the DEBQ. The US-REs (n=17) scored more than 2.7 on the Restrained Eating subscale of the DEBQ and more than 3.0 on the Emotional and External Eating subscales of the DEBQ. The UREs (n=17) who never or infrequently dieted scored less than 1.6 on the Restrained Eating subscale of the DEBQ.38
Procedure
Participants viewed 120 different pictures from two categories. These pictures were selected from other study.38 Thirty pictures with appetizing high-caloric food items (mainly snacks: fast food, sweets and desserts) differed from low-caloric food pictures in the dimension of food content but not in the dimensions of arousal, happiness and familiarity. Each picture was identical in size (1028 by 768 pixels), resolution (72 dots per inch), brightness, and background (see Figure 1).
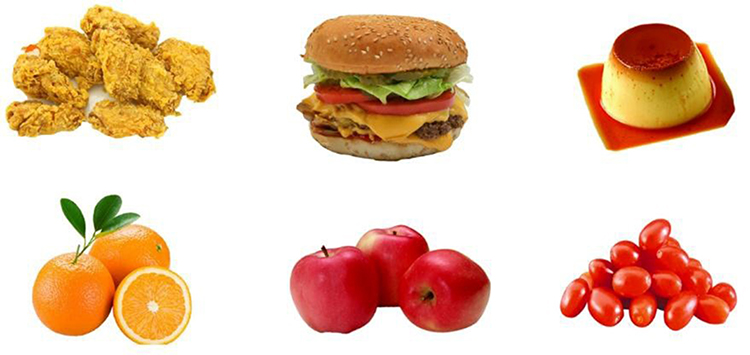 |
Figure 1 The examples of high caloric (First line) and low caloric food (Second line). |
Three functional runs were carried out. Each run consisted of 40 trials. For each trial, a picture of low-caloric food (go trial, 75% occurrence) or a picture of high-caloric food (no-go trial, 25% occurrence) was presented for 1000 ms. Examples of go trials included pictures of broccoli, carrots, cabbage, and eggplants. Examples of no-go trials included pictures of chocolate cake, pie, and ice cream. Trials were separated by a fixation cross, which was presented for intervals ranging from 8 to 12 s to capture the full haemodynamic response (see Figure 2). Subjects were instructed to respond with a button press to low-caloric food but to withhold their responses to high-caloric food and to respond as quickly and accurately as possible. In the present study, E-Prime 2.0 as the software platform was used to present the stimulus. Reaction times were measured from the beginning of trial onset. Trials were presented in pseudo-randomized order, designed so that high-caloric food appeared with equal frequency after 1, 2, and 3 low-caloric food presentations. Subjects viewed stimuli through an adjustable mirror attached to the head coil. MRI acquisition was synchronized with the paradigm. In addition, different people have different appetite or eating habits;39 therefore, the individualized food pictures were used in the present study to control this effect. Prior to scanning, all participants were required to rate the food pictures on the dimension of familiarity and appetizing on the 5-point Likert (1= “minimum familiarity/liking” to 5= “maximum familiarity/liking”), and we selected the picture score above 3 including 4 and 5.
 |
Figure 2 An example of a trail. |
fMRI Data Acquisition
Functional magnetic resonance imaging data were gathered while participants viewed the stimuli. Scans were obtained from a Symphony/Sonata 3 Tesla whole-body scanner (Siemens Magnetom Trio TIM, Erlangen, Germany) with an eight-channel phased array coil. Functional images were obtained using a T2*-weighted echo-planar imaging (EPI) sequence (TR = 2000 ms, TE = 30 ms, flip angel = 90°, FOV = 192 mm × 192 mm, interslice skip = 0.99 mm; matrix size = 64 × 64; 32 slices, 3.4 mm × 3.4 mm × 3 mm voxels). High-resolution T1-weighted structural images were recorded with a total of 176 slices at a thickness of 1 mm and in-plane resolution of 0.98 × 0.98 mm2, using a magnetization prepared gradient echo sequence (TR = 1900 ms; TE = 2.52 ms; flip angle = 9°; FOV = 250 mm).
fMRI Pre-Processing
Data pre-processing and subsequent statistical analysis was performed with Statistical Parametric Mapping 8 (SPM8) (http://www.fil.ion.ucl.ac.uk/spm/; Wellcome Department of Imaging Neuroscience, London, UK) and Matrix Laboratory (MATLAB; MathWorks, Inc., Natick, Massachusetts, United States). The following conventional fMRI pre-processing steps were applied: 1) the middle slice in the slice timing correction was used as the reference slice; 2) the data were realigned to estimate and modify the six parameters of head movement; 3) the realigned images were co-registered to the anatomic images obtained for each participant; 4) these images were normalized to MNI space using high-dimensional diffeomorphic anatomical registration through exponentiated lie algebra (DARTEL), using a custom template to normalize images based off individual brain images rather than a common template;40 5) then the images were smoothed with a full width at a FWHM of 8 mm Gaussian kernel.41 And high-pass filter was set at 128 s, low-pass filter was achieved by convolution with haemodynamic response function. The resulting images had cubic voxels of 3.4 × 3.4 × 3 mm3.
After these pre-processing steps, a first-level statistical analysis was conducted on individual data using the general linear model.42 For the first-level analyses, we computed contrast images for each subject using the high-caloric vs. low-caloric activity. Restrained Status was the between-groups factor and Image Type was the within-participants variable. These images were fed into a second-level analysis using a one-way analysis of variance (ANOVA) to compare the three participant types regarding their brain responses to pictures of high- or low-caloric food, and post hoc 2-sample t-tests were used to further specify participants’ type differences. Activation maps of the US-REs, S-REs and UREs and the subtraction results were presented by overlaying the statistical maps onto the standardized MNI anatomical image with a threshold of p<0.001 (uncorrected) and cluster size≥10 voxels.43 All results are reported using an MNI coordinate system.
Results
The results showed that the three groups did not differ significantly on any of the age, BMI, hunger fasting time or menstrual phase measures. Descriptive statistics in this study are found in Table 1.
Trials with incorrect responses and with responses that were too fast (reaction times less than 200 ms) or too slow (RTs more than 1000 ms) were excluded. Through the analysis of mean RT of low-caloric food (Go condition), no significant differences were found in the three groups (group: S-REs, US-REs and UREs) (F (2, 49) =2.350, p=0.106). There was a significant main effect on runs (F(1, 49) = 61.270, p<0.001). A post hoc test on runs demonstrated that run2 and run3 were quicker than run1, but there was no difference between run2 and run3. Finally, the mixed effects analysis of variance showed there were no interaction between groups and runs (F(2, 4) =0.700, p=0.594).
fMRI Results
In the no-go condition, the main difference was that S-REs demonstrated significantly greater activation than US-REs in the middle frontal gyrus and cerebellum.
Moreover, compared with UREs, the S-REs showed increased activation in the middle frontal gyrus (p<0.05 FWE-corrected), middle cingulate gyrus and cerebellum. In contrast, the UREs showed more activation in the inferior OFC and caudate than the S-REs. More interesting, the main difference was that US-REs demonstrated significantly greater activation than S-REs in the middle/inferior OFC and hippocampus. In addition, compared to US-REs, UREs demonstrated significantly increased activation in the superior frontal gyrus and cerebellum (see Table 2 and Figure 3).
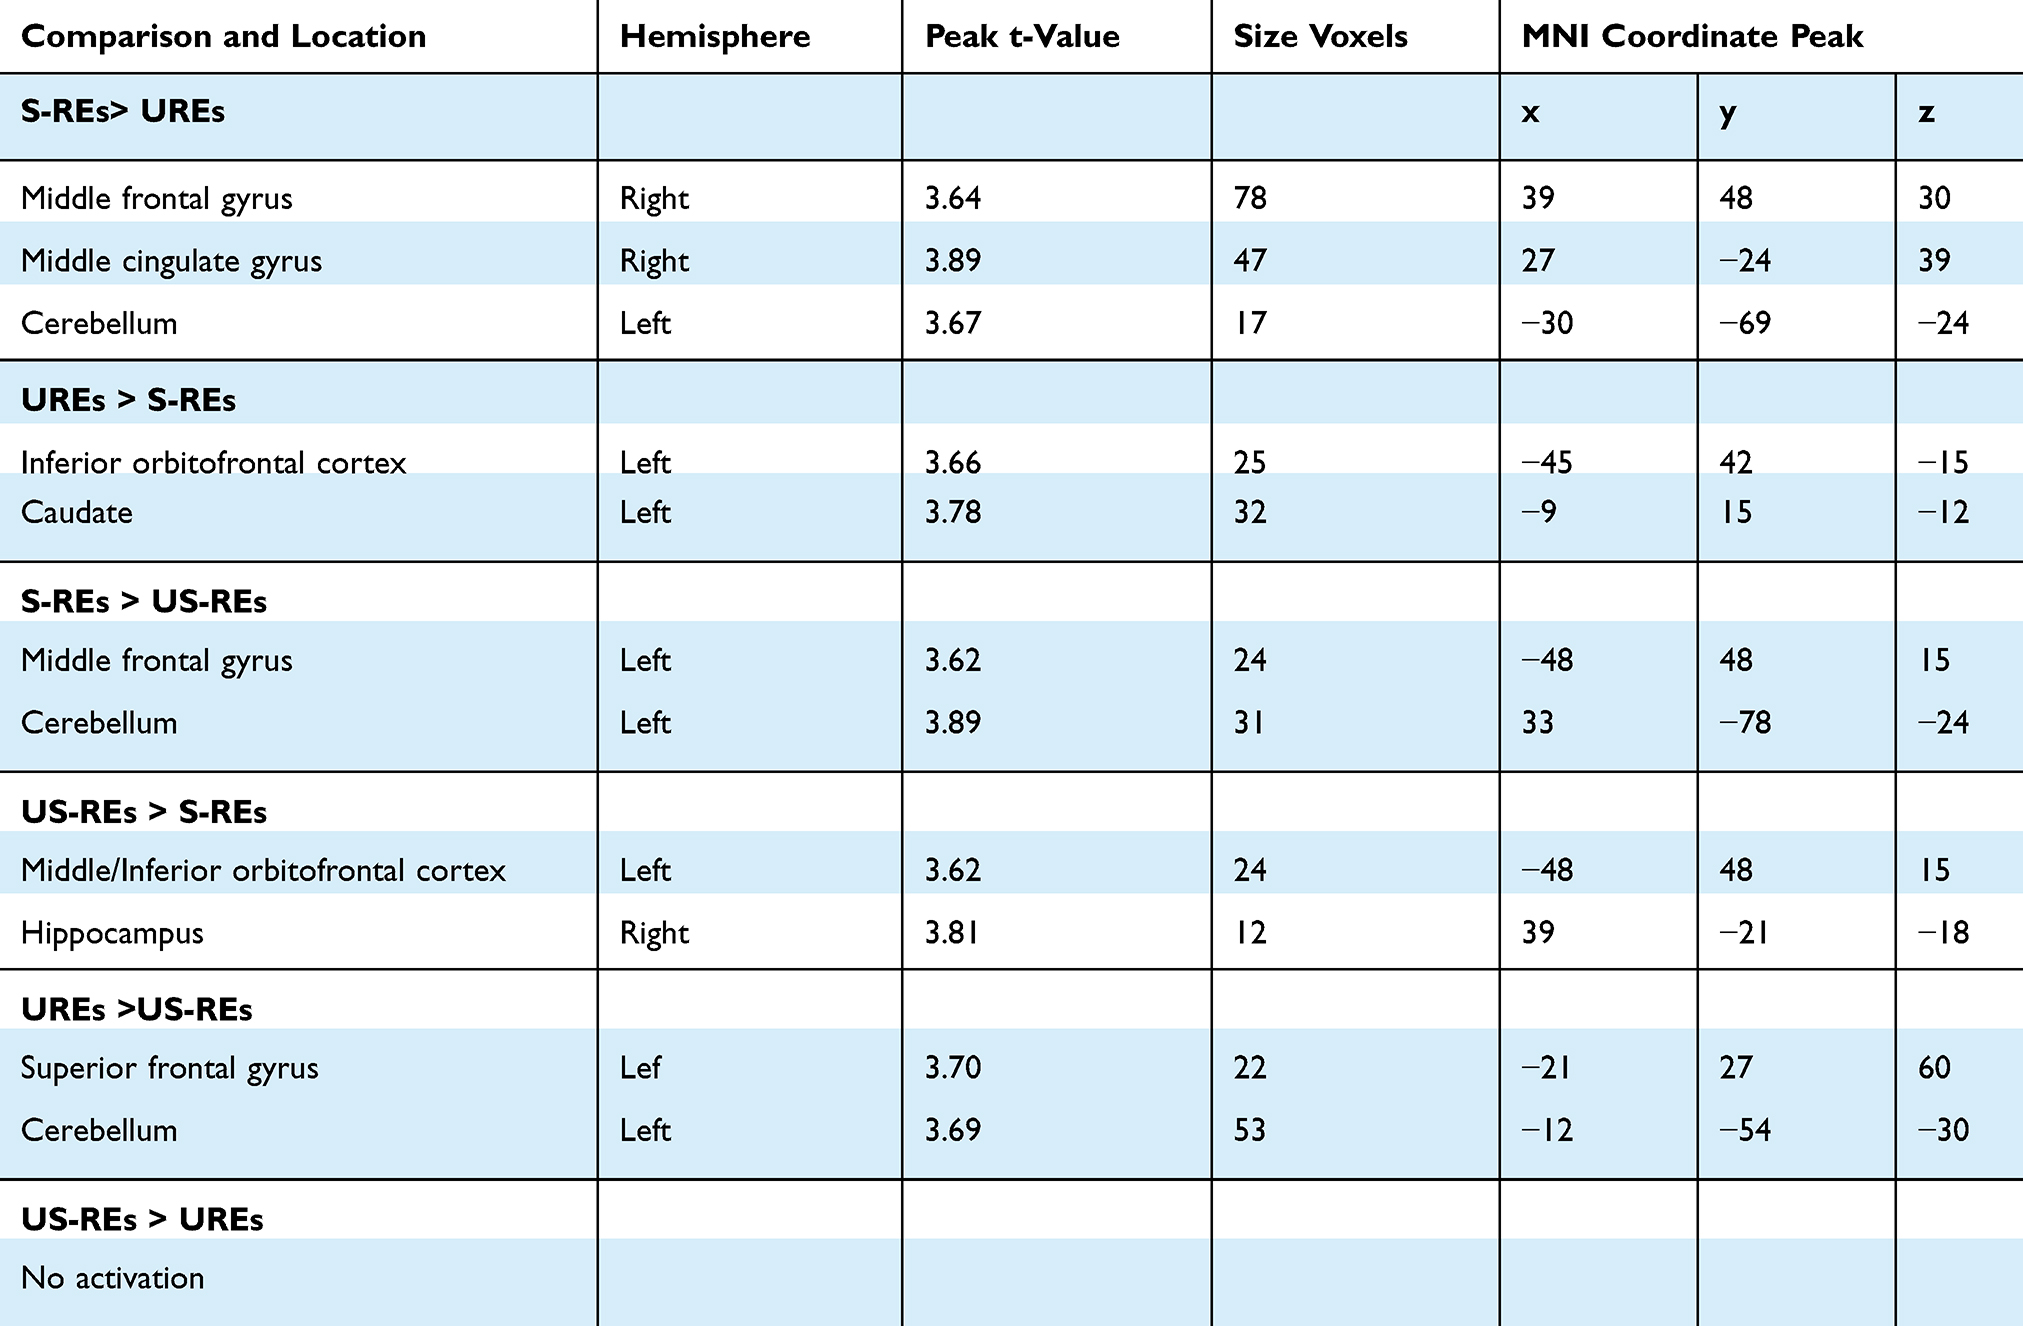 |
Table 2 Local Maxima During Participants Judged the Pictures in the Whole Brain Under High-Caloric Condition. Regions are Shown for the Contrast Conditions at P<0.001 with an Extent Threshold of 10 Voxels Among Participants |
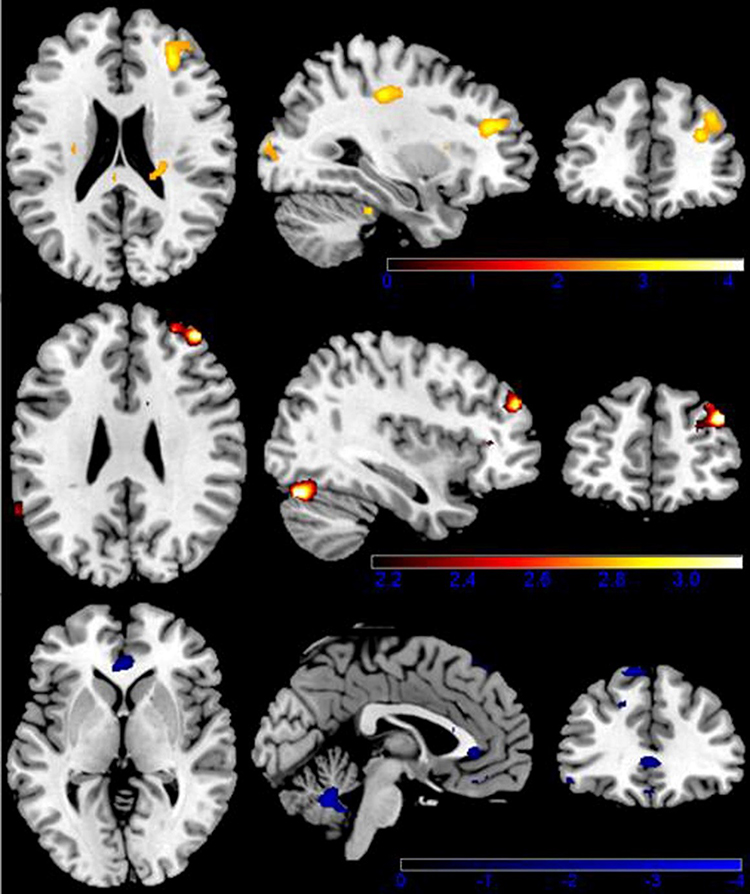 |
Figure 3 Brain activation when viewing highly caloric food stimuli. Color-coded areas represent activation in restrained eaters (red) and unrestrained eaters (blue). Upper limit z score (represented by color-coded bars) was used to portray activated areas. |
Furthermore, S-REs demonstrated significantly greater activation than UREs in the middle frontal gyrus and cerebellum in response to low-calorie food stimuli. Moreover, compared with S-REs, the UREs showed increased activation in the caudate and inferior OFC. More interesting, the main difference was that US-REs demonstrated significantly greater activation than S-REs in the middle OFC (see Table 3).
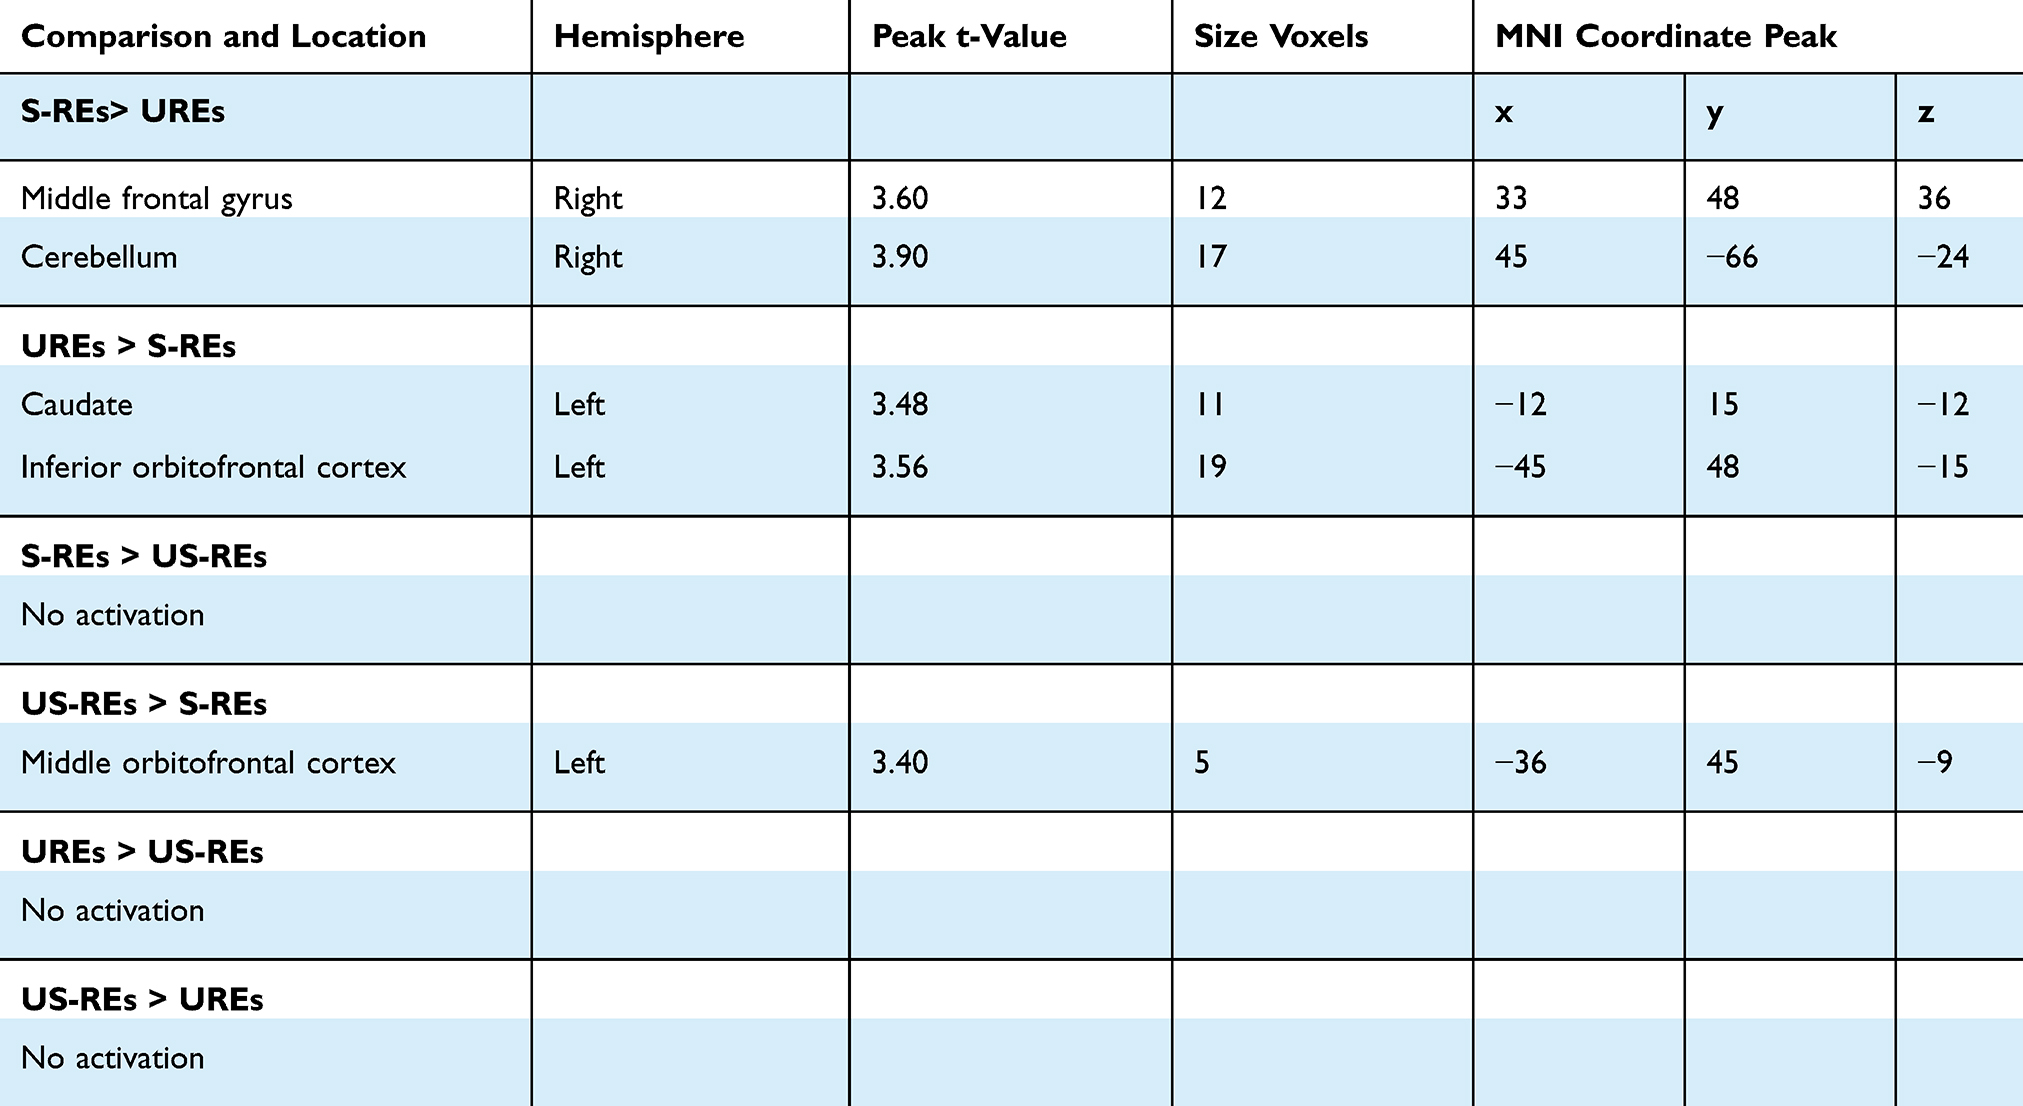 |
Table 3 Local Maxima During Participants Judged the Pictures in the Whole Brain Under Low Caloric Condition. Regions are Shown for the Contrast Conditions at P<0.001 with an Extent Threshold of 10 Voxels Among Participants |
Discussion
This study used fMRI to investigate the neural correlates of inhibitory control that vary among S-REs, US-REs and UREs. The behaviour data demonstrated that run 2 and run 3 were quicker than run1, but there was no difference between run2 and run3. The significant difference probably is due to practice effects.44 Moreover, the practice reduces the time and strengthens associations between task-irrelevant stimuli.45 The major fMRI findings from this study were that, overall, regardless of whether the food stimuli were high caloric or low caloric, S-REs demonstrated significantly greater activation than US-REs and UREs in the middle frontal gyrus and cerebellum. In contrast, the US-REs and UREs showed more activation in the middle/inferior orbitofrontal cortex (OFC) and hippocampus than the S-REs. Second, compared with S-REs, UREs showed increased activation in the caudate and inferior OFC.
The results were in line with the general hypothesis that S-REs were found to demonstrate significantly greater activation than US-REs and UREs in the middle frontal gyrus and middle cingulate gyrus. The middle frontal gyrus is mainly involved in inhibition.46 Inhibition is a biologically based function mediated by the frontal lobes, in particular, the prefrontal cortex.47 For instance, cocaine users showed inhibitory deficits in a go/no-go task that involved distinct activation of frontal cortices.48,49 We also found activation for S-REs in the cerebellum, an area implicated in modulating lower-level processing of food stimuli.50 More interesting, compared with S-REs, the US-REs and UREs showed increased activation in the caudate, inferior OFC, and hippocampus. The caudate has previously been reported to participate in habit learning and addiction.51 Similarly, obese women showed greater activation to high-caloric foods vs. neutral images in the caudate/putamen (reward/motivation) than lean women. The OFC has been implicated in the desire for food52,53 as well as the motivation to eat54 and expectation of a reward,55,56 as the OFC receives input from a variety of sensory and emotional centres.56,57 Similarly, Coletta, Platek, Mohamed, van Steenburgh, Green, Lowe31 showed that REs were sated (compared to hungry) and had stronger activation in brain areas involved in hunger and reward (OFC, insula) in response to food pictures than UREs. Burger, Stice30 found that participants who were higher in self-reported dietary restraint had stronger activation in the right OFC in response to tasting a milkshake than participants who were lower in self-reported dietary restraint. The same pattern might hint at the possibility of obesity.
In addition, we also found that S-REs demonstrated significantly greater activation than UREs in the middle frontal gyrus and cerebellum in response to low-caloric food stimuli. Recent studies indicate that stopping is associated with activation of a fronto-basal ganglia circuit that includes the inferior frontal gyrus, middle frontal gyrus, medial frontal gyrus and basal ganglia.58–61 Furthermore, some researchers proposed that the middle frontal gyrus was commonly associated with adjusting behaviour after conflict62 and/or adjusting response strategies to balance the opposing demands of the go and stop tasks.60 Evidence is increasing that the cerebellum has a prominent role in feeding behaviour,63 and animal studies have shown that cerebellar lesions alter feeding behaviour and result in weight loss.64,65 In addition, the cerebellum might, in fact, be a “central node” for the regulation of food intake, with connections from and/or to the hypothalamus.63,64 Given that the cerebellum also plays a role in cognitive functioning and emotion regulation,66 the role of the cerebellum in REs requires further exploration.
Last, we also found that US-REs demonstrated significantly greater activation in the middle OFC than S-REs, and the UREs showed more activation in the caudate and inferior OFC. Neuroimaging studies using food images in heavier youth have reported a greater responsivity of neural systems subserving reward and emotion (OFC, putamen, and anterior and middle insula).67–69 In the context of most other studies, our finding of increased activation in the caudate and OFC implies that US-REs may show an enhanced drive for compulsive eating that interferes with the control of eating, in turn, increasing the risk for overeating and future weight gain.
There are some limitations to this preliminary study; for example, the inhibition deficit was analysed based on the spatial activation of food cue processing. Future studies should thus use a combination of the technologies of ERP and fMRI to explore the inhibition ability among REs. Second, participants were grouped based on the DEBQ measure. However, actual eating behaviours probably differed from the performances indicated by the items. Future studies should take into consideration actual eating behaviours when grouping subjects. In addition, Eklund, Nichols, Knutsson70 found that the parametric methods can give a very high degree of false positives for clusterwise inference. As no analysis method is perfect, in this work, we used parametric statistical methods which might result in false-positive rate. In the future fMRI studies, the nonparametric permutation test which is found to produce nominal results for both voxelwise and clusterwise inference for two-sample t tests should take into consideration. Indeed, the observed small clusters have disappeared when we applied an FWE-corrected threshold of p<0.05, but the main brain region (middle frontal gyrus) is still activated.
Conclusion
This study was the first to examine the neural correlates of inhibition ability among S-REs, US-REs, and UREs. The US-REs exhibited reduced neural responses to high-caloric food cues in a neural system that adjusts behaviour after conflict and increased activity in hunger and reward areas. Taken together, the results suggest that S-REs and US-REs had different inhibition abilities, which is an important factor in successful dieting.
Ethics Statement
The research was approved by the human research ethics committee at Southwest University and the number of ethical committee acceptance was H19051. All participants have signed an informed consent prior to their inclusion in our experiments. The study was designed in accordance with tenets of the Declaration of Helsinki.
Disclosure
The authors report no biomedical financial interests or other potential conflicts of interest in this work.
References
1. Pinkasavage E, Arigo D, Schumacher LM. Social comparison, negative body image, and disordered eating behavior: the moderating role of coping style. Eat Behav. 2015;16:72–77. doi:10.1016/j.eatbeh.2014.10.014
2. Strahan EJ, Wilson AE, Cressman KE, Buote VM. Comparing to perfection: how cultural norms for appearance affect social comparisons and self-image. Body Image. 2006;3(3):211–227. doi:10.1016/j.bodyim.2006.07.004
3. Thompson JK, Heinberg LJ, Altabe M, Tantleff-Dunn S. Exacting Beauty: Theory, Assessment, and Treatment of Body Image Disturbance. American Psychological Association; 1999.
4. Aruguete MS, Yates A, Edman JJ. Gender differences in attitudes about fat. N Am J Psychol. 2006;8(1).
5. Poreddi V, Thimmaiah R, Reddy SSN, Kathyayani B, Gandhi S, BadaMath S. Gender differences in body mass index, body weight perception, weight satisfaction, disordered eating and weight control strategies among Indian medical and nursing undergraduates. Invest Educ Enferm. 2017;35(3):276–284. doi:10.17533/udea.iee.v35n3a04
6. Herman CP, Olmsted MP, Polivy J. Obesity, externality, and susceptibility to social influence: an integrated analysis. J Pers Soc Psychol. 1983;45(4):926–934. doi:10.1037/0022-3514.45.4.926
7. Connor-Greene PA. Gender differences in body weight perception and weight-loss strategies of college students. Women Health. 1988;14(2):27–42. doi:10.1300/J013v14n02_03
8. Herrmann MJ, Tesar AK, Beier J, Berg M, Warrings B. Grey matter alterations in obesity: a meta-analysis of whole-brain studies. Obes Rev. 2019;20(3):464–471. doi:10.1111/obr.12799
9. Herman C, Polivy J. Restrained eating. In: Stunkard AJ, editor. Obesity. Philadelphia:: WB Saunders; 1980:208–225.
10. Jeffery RW, Drewnowski A, Epstein LH, Stunkard AJ; Association DRHJHPOJotDoHPAP. Long-term maintenance of weight loss: current status. Health Psychol. 2000;19(1 Suppl):5–16.
11. Mann T, Ward A. Attention, self-control, and health behaviors. Curr Dir Psychol Sci. 2007;16(5):280–283. doi:10.1111/j.1467-8721.2007.00520.x
12. Stroebe W, Mensink W, Aarts H, Schut H, Kruglanski AW. Why dieters fail: testing the goal conflict model of eating. J Exp Soc Psychol. 2008;44(1):26–36. doi:10.1016/j.jesp.2007.01.005
13. Stunkard AJ, Messick S. The three-factor eating questionnaire to measure dietary restraint, disinhibition and hunger. J Psychosom Res. 1985;29(1):71–83. doi:10.1016/0022-3999(85)90010-8
14. van Strien T. The concurrent validity of a classification of dieters with low versus high susceptibility toward failure of restraint. Addict Behav. 1997;22(5):587–597. doi:10.1016/S0306-4603(96)00069-X
15. Jansen A, Nederkoorn C, van Baak L, Keirse C, Guerrieri R, Havermans R. High-restrained eaters only overeat when they are also impulsive. Behav Res Ther. 2009;47(2):105–110. doi:10.1016/j.brat.2008.10.016
16. Fishbach A, Shah JY. Self-control in action: implicit dispositions toward goals and away from temptations. J Pers Soc Psychol. 2006;90(5):820–832. doi:10.1037/0022-3514.90.5.820
17. Hollitt S, Kemps E, Tiggemann M, Smeets E, Mills JS. Components of attentional bias for food cues among restrained eaters. Appetite. 2010;54(2):309–313. doi:10.1016/j.appet.2009.12.005
18. Houben K, Nederkoorn C, Jansen A. Eating on impulse: the relation between overweight and food-specific inhibitory control. Obesity. 2014;22(5):E6–E8. doi:10.1002/oby.20670
19. Nederkoorn C, Eijs YV, Jansen AJP, Differences I. Restrained eaters act on impulse. Pers Individ Dif. 2004;37(8):1651–1658.
20. Verbruggen F, Logan GD. Response inhibition in the stop-signal paradigm. Trends Cogn Sci. 2008;12(11):418–424. doi:10.1016/j.tics.2008.07.005
21. Baker RC, Kirschenbaum DS. Self-monitoring may be necessary for successful weight control. Behav Ther. 1993;24(3):377–394. doi:10.1016/S0005-7894(05)80212-6
22. Kuijer R, De RD, Ouwehand C, Houx B, van den Bos R. Dieting as a case of behavioural decision making. Does self-control matter? Appetite. 2008;51(3):506–511. doi:10.1016/j.appet.2008.03.014
23. Meule A, Lukito S, Vogele C, Kubler A. Enhanced behavioral inhibition in restrained eaters. Eat Behav. 2011;12(2):152–155. doi:10.1016/j.eatbeh.2011.01.006
24. Guerrieri R, Nederkoorn C, Jansen A. The effect of an impulsive personality on overeating and obesity: current state of affairs. Psihologijske Teme. 2008;17(2):265–286.
25. Guerrieri R, Nederkoorn C, Schrooten M, Martijn C, Jansen A. Inducing impulsivity leads high and low restrained eaters into overeating, whereas current dieters stick to their diet. Appetite. 2009;53(1):93–100. doi:10.1016/j.appet.2009.05.013
26. Jasinska AJ, Yasuda M, Burant CF, et al. Impulsivity and inhibitory control deficits are associated with unhealthy eating in young adults. Appetite. 2012;59(3):738–747. doi:10.1016/j.appet.2012.08.001
27. Zhou Y, Gao X, Chen H, Kong F. High-disinhibition restrained eaters are disinhibited by self-regulatory depletion in the food-related inhibitory control. Eat Behav. 2017;26:70–75. doi:10.1016/j.eatbeh.2017.01.010
28. Ganor-Moscovitz N, Weinbach N, Canetti L, Kalanthroff EJA. The effect of food-related stimuli on inhibition in high vs. Low Restrained Eaters. 2018;131:53–58.
29. Van Koningsbruggen GM, Wolfgang S, Aarts H. Successful restrained eating and trait impulsiveness. Appetite. 2013;60(1):81–84. doi:10.1016/j.appet.2012.09.016
30. Burger KS, Stice E. Relation of dietary restraint scores to activation of reward-related brain regions in response to food intake, anticipated intake, and food pictures. Neuroimage. 2011;55(1):233–239. doi:10.1016/j.neuroimage.2010.12.009
31. Coletta M, Platek S, Mohamed FB, van Steenburgh JJ, Green D, Lowe MR. Brain activation in restrained and unrestrained eaters: an fMRI study. J Abnorm Psychol. 2009;118(3):598–609. doi:10.1037/a0016201
32. Demos KE, Kelley WM, Heatherton TF. Dietary restraint violations influence reward responses in nucleus accumbens and amygdala. J Cogn Neurosci. 2011;23(8):1952–1963. doi:10.1162/jocn.2010.21568
33. DelParigi A, Chen K, Salbe A, et al. Successful dieters have increased neural activity in cortical areas involved in the control of behavior. Int J Obes. 2007;31(3):440–448. doi:10.1038/sj.ijo.0803431
34. Holm-Denoma JM, Joiner TE
35. Frank S, Laharnar N, Kullmann S, et al. Processing of food pictures: influence of hunger, gender and calorie content. Brain Res. 2010;1350:159–166. doi:10.1016/j.brainres.2010.04.030
36. Van Strien T, Frijters JE, Bergers GP, Defares PB. The Dutch Eating Behavior Questionnaire (DEBQ) for assessment of restrained, emotional, and external eating behavior. Int J Eat Disord. 1986;5(2):295–315. doi:10.1002/1098-108X(198602)5:2<295::AID-EAT2260050209>3.0.CO;2-T
37. van Strien T. Success and failure in the measurement of restraint: notes and data. Int J Eat Disord. 1999;25(4):441–449. doi:10.1002/(ISSN)1098-108X
38. Kong F, Zhang Y, Chen H, Liu Y. Inhibition ability of food cues between successful and unsuccessful restrained eaters: a two-choice oddball task. PLoS One. 2015;10(4):e0120522. doi:10.1371/journal.pone.0120522
39. Beaver JD, Lawrence AD, Van Ditzhuijzen J, Davis MH, Woods A, Calder AJ. Individual differences in reward drive predict neural responses to images of food. J Neurosci. 2006;26(19):5160–5166. doi:10.1523/JNEUROSCI.0350-06.2006
40. Ashburner J. A fast diffeomorphic image registration algorithm. Neuroimage. 2007;38(1):95–113. doi:10.1016/j.neuroimage.2007.07.007
41. Poldrack RA, Fletcher PC, Henson RN, Worsley KJ, Brett M, Nichols TE. Guidelines for reporting an fMRI study. Neuroimage. 2008;40(2):409–414. doi:10.1016/j.neuroimage.2007.11.048
42. Friston KJ, Holmes AP, Poline J, et al. Analysis of fMRI time-series revisited. Neuroimage. 1995;2(1):45–53. doi:10.1006/nimg.1995.1007
43. Castro-Fornieles J, de la Serna E, Calvo A, et al. Functional MRI with a set-shifting task in adolescent anorexia nervosa: a cross-sectional and follow-up study. Neuropsychologia. 2019;131:1–8. doi:10.1016/j.neuropsychologia.2019.05.019
44. Vallesi A, McIntosh AR, Crescentini C, Stuss DT. fMRI investigation of speed-accuracy strategy switching. Hum Brain Mapp. 2012;33(7):1677–1688.
45. Weissman DH, Woldorff MG, Hazlett CJ, Mangun GR. Effects of practice on executive control investigated with fMRI. Brain Res Cogn Brain Res. 2003;15(1):47–60. doi:10.1016/S0926-6410(02)00215-X
46. Owen AM, McMillan KM, Laird AR, Bullmore E. N-back working memory paradigm: a meta-analysis of normative functional neuroimaging studies. Hum Brain Mapp. 2005;25(1):46–59. doi:10.1002/(ISSN)1097-0193
47. Baddeley A. Exploring the central executive. Q J Exp Psychol A. 1996;49(1):5–28. doi:10.1080/713755608
48. Garavan H, Kaufman JN, Hester R. Acute effects of cocaine on the neurobiology of cognitive control. Philos Trans R Soc Lond B Biol Sci. 2008;363(1507):3267–3276. doi:10.1098/rstb.2008.0106
49. Kaufman JN, Ross TJ, Stein EA, Garavan H. Cingulate hypoactivity in cocaine users during a GO-NOGO task as revealed by event-related functional magnetic resonance imaging. J Neurosci. 2003;23(21):7839–7843.
50. Crossman A, Neary DJN. Cerebellum. In: Neuroanatomy. 2nd ed. Philadelphia, USA: Churchill Livingstone; 2000:117–124.
51. Volkow ND, Wang GJ, Telang F, et al. Cocaine cues and dopamine in dorsal striatum: mechanism of craving in cocaine addiction. J Neurosci. 2006;26(24):6583. doi:10.1523/JNEUROSCI.1544-06.2006
52. Killgore WD, Young AD, Femia LA, Bogorodzki P, Rogowska J, Yurgelun-Todd DA. Cortical and limbic activation during viewing of high- versus low-calorie foods. Neuroimage. 2003;19(4):1381–1394. doi:10.1016/S1053-8119(03)00191-5
53. LaBar KS, Gitelman DR, Parrish TB, Kim YH, Nobre AC, Mesulam MM. Hunger selectively modulates corticolimbic activation to food stimuli in humans. Behav Neurosci. 2001;115(2):493–500. doi:10.1037/0735-7044.115.2.493
54. Killgore WD, Yurgelun-Todd DA. Developmental changes in the functional brain responses of adolescents to images of high and low-calorie foods. Dev Psychobiol. 2005;47(4):377–397. doi:10.1002/dev.20099
55. Kringelbach ML, O’Doherty J, Rolls ET, Andrews C. Activation of the human orbitofrontal cortex to a liquid food stimulus is correlated with its subjective pleasantness. Cereb Cortex. 2003;13(10):1064–1071. doi:10.1093/cercor/13.10.1064
56. Rolls ET. The orbitofrontal cortex and reward. Cereb Cortex. 2000;10(3):284–294. doi:10.1093/cercor/10.3.284
57. Öngür D, Price JL. The organization of networks within the orbital and medial prefrontal cortex of rats, monkeys and humans. Cereb Cortex. 2000;10(3):206–219. doi:10.1093/cercor/10.3.206
58. Aron AR, Behrens TE, Smith S, Frank MJ, Poldrack RA. Triangulating a cognitive control network using diffusion-weighted magnetic resonance imaging (MRI) and functional MRI. J Neurosci. 2007;27(14):3743–3752. doi:10.1523/JNEUROSCI.0519-07.2007
59. Aron AR, Poldrack RA. Cortical and subcortical contributions to stop signal response inhibition: role of the subthalamic nucleus. J Neurosci. 2006;26(9):2424–2433. doi:10.1523/JNEUROSCI.4682-05.2006
60. Chevrier AD, Noseworthy MD, Schachar R. Dissociation of response inhibition and performance monitoring in the stop signal task using event‐related fMRI. Hum Brain Mapp. 2007;28(12):1347–1358. doi:10.1002/(ISSN)1097-0193
61. Rubia K, Smith AB, Brammer MJ, Taylor EJN. Right inferior prefrontal cortex mediates response inhibition while mesial prefrontal cortex is responsible for error detection. NeuroImage. 2003;20(1):351–358. doi:10.1016/s1053-8119(03)00275-1
62. Ridderinkhof KR, Van Den Wildenberg WP, Segalowitz SJ, Carter CS. Neurocognitive mechanisms of cognitive control: the role of prefrontal cortex in action selection, response inhibition, performance monitoring, and reward-based learning. Brain Cogn. 2004;56(2):129–140. doi:10.1016/j.bandc.2004.09.016
63. Zhu J-N, Wang JJ. The cerebellum in feeding control: possible function and mechanism. Cell Mol Neurobiol. 2008;28(4):469–478. doi:10.1007/s10571-007-9236-z
64. Mahler P, Guastavino J-M, Jacquart G, Strazielle C. An unexpected role of the cerebellum: involvement in nutritional organization. Physiol Behav. 1993;54(6):1063–1067. doi:10.1016/0031-9384(93)90325-A
65. Scalera G. Effects of corticocerebellar lesions on taste preferences, body weight gain, food and fluid intake in the rat. J Physiol (Paris). 1991;85(4):214–222.
66. Schmahmann JD. The role of the cerebellum in cognition and emotion: personal reflections since 1982 on the dysmetria of thought hypothesis, and its historical evolution from theory to therapy. Neuropsychol Rev. 2010;20(3):236–260. doi:10.1007/s11065-010-9142-x
67. Bruce A, Holsen L, Chambers R, et al. Obese children show hyperactivation to food pictures in brain networks linked to motivation, reward and cognitive control. Int J Obes. 2010;34(10):1494–1500. doi:10.1038/ijo.2010.84
68. Stice E, Spoor S, Bohon C, Small D. Relation between obesity and blunted striatal response to food is moderated by TaqIA A1 allele. Science. 2008;322(5900):449–452. doi:10.1126/science.1161550
69. Stice E, Yokum S, Blum K, Bohon C. Weight gain is associated with reduced striatal response to palatable food. J Neurosci. 2010;30(39):13105–13109. doi:10.1523/JNEUROSCI.2105-10.2010
70. Eklund A, Nichols TE, Knutsson H. Cluster failure: why fMRI inferences for spatial extent have inflated false-positive rates. Proc Natl Acad Sci. 2016;113(28):7900–7905. doi:10.1073/pnas.1602413113
 © 2019 The Author(s). This work is published and licensed by Dove Medical Press Limited. The full terms of this license are available at https://www.dovepress.com/terms.php and incorporate the Creative Commons Attribution - Non Commercial (unported, v3.0) License.
By accessing the work you hereby accept the Terms. Non-commercial uses of the work are permitted without any further permission from Dove Medical Press Limited, provided the work is properly attributed. For permission for commercial use of this work, please see paragraphs 4.2 and 5 of our Terms.
© 2019 The Author(s). This work is published and licensed by Dove Medical Press Limited. The full terms of this license are available at https://www.dovepress.com/terms.php and incorporate the Creative Commons Attribution - Non Commercial (unported, v3.0) License.
By accessing the work you hereby accept the Terms. Non-commercial uses of the work are permitted without any further permission from Dove Medical Press Limited, provided the work is properly attributed. For permission for commercial use of this work, please see paragraphs 4.2 and 5 of our Terms.