")
Back to Journals » OncoTargets and Therapy » Volume 12
Whole transcriptome sequencing identifies crucial genes associated with colon cancer and elucidation of their possible mechanisms of action
Authors Yang Y , Zhao Y, Zhang W, Bai Y
Received 19 November 2018
Accepted for publication 11 February 2019
Published 10 April 2019 Volume 2019:12 Pages 2737—2747
DOI https://doi.org/10.2147/OTT.S195235
Checked for plagiarism Yes
Review by Single anonymous peer review
Peer reviewer comments 2
Editor who approved publication: Dr Sanjeev K. Srivastava
Yang Yang, Yanan Zhao, Wenlong Zhang, Yuansong Bai
Department of Oncology and Hematology, China-Japan Union Hospital of Jilin University, Changchun, Jilin 130033, People’s Republic of China
Purpose: This study aimed to investigate the key long non-coding RNAs (lncRNAs) associated with colon cancer and elucidate their possible mechanisms of action.
Patients and methods: Eight early-stage (ES) colon tumor tissues, eight late-stage (LS) colon tumor tissues, and eight normal tissues were collected, and they were subjected to high-throughput RNA sequencing. Subsequently, comprehensive bioinformatics analyses, including the identification of differentially expressed mRNAs and lncRNAs, functional enrichment analysis, and construction of a protein–protein interaction network and an miRNA–lncRNA–mRNA regulatory network were performed. Additionally, the expression of key lncRNAs was verified using real-time quantitative PCR (qPCR).
Results: In total, 549 common differentially expressed mRNAs and 30 common differentially expressed lncRNAs were identified in both the ES and LS colon cancer samples upon comparison with the normal samples. Functional enrichment analysis showed that KIAA0125 was significantly enriched in the PI3K-Akt signaling pathway and that MSTRG.35002.1 was markedly enriched in BMP signaling-related functions. Moreover, key miRNA–lncRNA–mRNA relationships, such as hsa-miR-29b-3p-KIAA0125-BCL2 and hsa-miR-29b-3p-MSTRG.35002.1-MMP2, were identified. Notably, the qPCR assay confirmed that KIAA0125 and MSTRG.35002.1 were significantly downregulated in both ES and LS colon tumor tissues compared with normal colon tissues.
Conclusion: Our findings indicate that key lncRNAs, including KIAA0125 and MSTRG.35002.1, may be involved in colorectal cancer (CRC) development. Downregulation of KIAA0125 may contribute to CRC development via sponging of hsa-miR-29b-3p to regulate BCL2 expression or regulating the PI3K-Akt signaling pathway. Downregulation of MSTRG.35002.1 may promote CRC development via sponging of hsa-miR-29b-3p to regulate MMP2 expression or regulating the BMP signaling pathway.
Keywords: colon cancer, differentially expressed mRNAs, differentially expressed lncRNAs, molecular mechanism, CeRNA network
Introduction
Colorectal cancer (CRC) is a common malignant tumor that ranks as the third leading cause of mortality worldwide.1 The 5-year survival rate of patients with CRC decreases from >90% in stage I to ~10% in stage IV.2 Because of its high prevalence and poor prognosis, it remains imperative to explore promising molecular biomarkers or targets to improve prognostic prediction and therapeutic outcomes for CRC.
Non-coding RNAs (ncRNAs) have been revealed to be major components of the human transcriptome, and they are mainly divided into miRNAs (<200 nucleotides) and long ncRNAs (lncRNAs, >200 nucleotides) based on their length. In CRC pathogenesis, the crucial roles of several lncRNAs have been shown to be altered and to play critical roles in tumor biology, including oncogenic lncRNAs, 91H, CCAT1, DANCR, FEZF1-AS1, HOTAIR, HOTTIP, and MALAT13–10 as well as tumor suppressive lncRNA, GAS5, MEG3, LINC01296, RP11-462C24.1, and TUSC7.11–15 For example, upregulation of the lncRNA PANDAR (promoter of CDKN1A antisense DNA damage-activated RNA) promotes the metastasis of CRC by epithelial–mesenchymal transition pathway,16 and silencing of lncRNA PANDAR switches curcumin-induced senescence to apoptosis.17
Furthermore, in 2011, lncRNAs were first revealed to regulate the encoding protein gene level by functioning as a competing endogenous RNA (ceRNA) to sponge miRNAs.18 It has been reported that lncRNA SPRY4-IT1 can function as a ceRNA of miR-101-3p to regulate the proliferation and invasion of CRC cells,19 and lncRNA UICLM can act as a ceRNA of miR-215 to regulate ZEB2 expression, thus promoting liver metastasis in CRC.20 These findings imply that lncRNA, miRNA, and mRNA have interactive roles in CRC development. However, the key lncRNAs associated with CRC are largely unknown, as is their regulatory mechanism. Further identification of the key lncRNAs involved in CRC progression is of great importance.
In this study, high-throughput RNA sequencing of colon tumor tissues and normal colon tissues and subsequent comprehensive bioinformatics analyses were performed to identify key lncRNAs associated with colon cancer, followed by the validation of dysregulated lncRNAs through real-time quantitative PCR (qPCR). Our findings may provide novel insights into the molecular mechanisms underlying colorectal carcinogenesis.
Patients and methods
Patient samples
Eight early-stage (ES) colon tumor tissues were collected from patients who were diagnosed with stage I or II colon cancer (seven men and one woman, age 56.75±11.66 years), and eight late-stage (LS) colon tumor tissues were obtained from patients with stage III or IV colon cancer (four men and four women, age 58.25±11.07 years). The diagnosis of colon cancer was confirmed by surgery, and patients who did not receive radiotherapy or chemotherapy and volunteered to participate in the study and subsequent follow-up were enrolled. Patients with a medical history of diabetes mellitus, hypertension, hepatitis, and pulmonary tuberculosis were excluded. In addition, eight adjacent normal colon tissues, defined as a >5.0 cm distance from the tumor edge, were also obtained from four patients with ES and four patients with LS colon cancer (five men and three women, age 59.86±8.84 years) and used as normal controls (N). All collected clinical tissue samples were quickly frozen in liquid nitrogen and stored at −80°C. This study was conducted in accordance with the Declaration of Helsinki and approved by the ethics review board of China-Japan Union Hospital of Jilin University. Each patient provided signed informed written consent for inclusion in this study and for publication.
Construction of the cDNA library and high-throughput RNA sequencing
Total RNA was extracted from clinical tissue samples using an RNAiso Plus Kit (TaKaRa, Shiga, Japan), followed by the detection of its purity and concentration using agarose gel electrophoresis and a Nanodrop spectrophotometer (Nanodrop Technologies, Wilmington, DE, USA). A poly (A) tail enrichment cDNA library was constructed following standard methods. RNA sequencing was carried out using the Illumina HiSeq 3000 platform. The generated sequencing data, with accession code SRP158734, were deposited in the NCBI database.
Quality control and read alignment
Quality control to obtain clean reads was performed using Trimmomatic (v3.6).21 Subsequently, the obtained clean reads were aligned with the human GRCh38 reference using Tophat 2 version 2.1.122 using the following parameters: read-mismatches, 2; read-edit-dist, 2; and library-type, fr-firststrand.
Transcriptome assembly and identification of differentially expressed mRNAs and differentially expressed lncRNAs
The read alignment results of 24 samples were then subjected to transcriptome assembly using stringtie (v1.33b)23 with the human genome annotation file (v28, GENCODE) as the reference. The gene expression levels in each sample were quantified using cuffquant and cuffnorm.24 After transcriptome assembly, the transcripts with the class codes of types i, u, and x were considered unknown: type i indicated that the predicted transcripts were located in introns, type u indicated that the predicted transcripts were located in the gene area of the reference transcripts, and type x indicated that the exons of the predicted transcripts overlapped with reference transcripts but in the opposite direction. The predicted novel_lncRNAs, named using tracking_id, were then identified by prediction of the coding ability of the transcriptome sequence using Coding Potential Calculator (CPC), Coding-Non-Coding-Index (CNCI), Coding Potential Assessment Tool (CPAT), and PFAM.
The differentially expressed mRNAs and differentially expressed lncRNAs in the ES vs N, LS vs N, and LS vs ES groups were, respectively, identified using the cuffdiff24 tool with a threshold value of q_value <0.05. Clustering heatmap analysis for differentially expressed mRNAs and differentially expressed lncRNAs was then conducted using the pheatmap version 1.0.8 in R3.4.1. Moreover, common differentially expressed mRNAs and common differentially expressed lncRNAs between the ES vs N and LS vs N groups were then identified using a Venn diagram.
Functional enrichment analysis of differentially expressed mRNAs
To understand the biological functions of the differentially expressed mRNAs, Gene Ontology (GO) functions, including biological process (BP), cellular component (CC), and molecular function (MF), as well as Kyoto Encyclopedia of Genes and Genomes (KEGG) pathway enrichment analyses were completed using clusterProfiler v3.2.1.25 A P value of <0.05 calculated from the hypergeometric test was set as the threshold value.
Construction of a protein–protein interaction (PPI) network
Based on the information in the Search Tool for the Retrieval of Interacting Genes26 database that provides both predicted and experimental interactions between proteins, the PPI pairs between common differentially expressed mRNAs were obtained with the required confidence >0.4. Then, the PPI network was constructed using Cytoscape software.27 The network topology property indicators, including degree centrality, betweenness centrality, and closeness centrality, were analyzed using CytoNCA28 in Cytoscape software. A node with a higher score of network topology property indicators indicated a more important role in that node in the PPI network, which was considered as a hub node.
Correlation analysis of lncRNAs and mRNAs
The correlation of gene expression levels between differentially expressed mRNAs and differentially expressed lncRNAs was analyzed by calculating the Pearson correlation coefficient. The Benjamini and Hochberg29 procedure was carried out for multiple-testing adjustment. The p.adjust <0.01 and |cor| >0.5 indicated a significant correlation between lncRNAs and mRNAs, suggesting that these mRNAs were potential targets of lncRNAs.
Prediction of lncRNA function
To thoroughly understand the functions of the lncRNAs, GO BP, and KEGG function enrichment analyses for the target mRNAs of common differentially expressed lncRNAs were also conducted using clusterProfiler v3.2.1, with a cut-off value of P<0.05.
Construction of an miRNA–lncRNA–mRNA regulatory network
The miRNAs targeting differentially expressed mRNAs were predicted using the miRTarBase_2017 database in Enrichr tool30 with p.adjust <0.05, and the miRNA–mRNA regulatory relationships were obtained. Moreover, the binding sites between the above-mentioned miRNAs and lncRNAs were predicated using miRanda31 with the parameters of -sc 140, -en −20, and –strict, and the miRNA–lncRNA regulatory relationships were obtained. By combining the miRNA–mRNA and miRNA–lncRNA regulatory relationships, the miRNA–lncRNA–mRNA regulatory network was then established using Cytoscape software.
Real-time qPCR analysis
To further verify the key differentially expressed lncRNAs identified earlier, qPCR was performed to detect the expression levels in eight ES colon tumor tissues, eight LS colon tumor tissues, and eight normal colon tissues. Real-time qPCR was conducted to detect the expression of lncRNAs using Power SYBR Green PCR Master Mix (Thermo Fisher Scientific, Waltham, MA, USA). The primer sequences (forward and reverse) used for the amplification of targets were as follows: KIAA0125: 5′-TGGCAAAGGCAAGTGAC-3′ and 5′-GGCAGAAGGATGAACCC-3′; MSTRG.35002.1: 5′-TTCATTATCCGAACAAC-3′ and 5′-TGATGCCACTAACCAG-3′; and GAPDH: 5′-TGACAACTTTGGTATCGTGGAAGG-3′ and 5′-AGGCAGGGATGATGTTCTGGAGAG-3′. By normalization with the internal control GAPDH, the relative gene expression was calculated using the 2−ΔΔCT method.
Statistical analysis
The obtained data are presented as the mean ± SD. Using GraphPad Prism 5 (Graphpad Software, San Diego, CA, USA), significant differences between groups were evaluated with Student’s t-test or one-way ANOVA. A statistically significant result was obtained when P<0.05.
Results
Prediction of novel lncRNAs
In total, 2,292, 2,269, 2,042, and 2,368 transcripts were, respectively, identified from the CPC, CNCI, CPAT, and PFAM analyses. An integrated analysis using CPC, CNCI, CPAT, and PFAM analyses identified a total of 1,993 novel_lncRNAs, named using the tracking_id, from 2,368 unknown transcripts.
Identification of differentially expressed mRNAs and differentially expressed lncRNAs
With the cut-off value of q_value <0.05, a total of 805 differentially expressed mRNAs (428 up- and 377 downregulated) and 78 differentially expressed lncRNAs (55 up- and 23 downregulated, Table S1) were identified in the ES vs N group, and 810 differentially expressed mRNAs (480 up- and 330 downregulated) and 65 differentially expressed lncRNAs (41 up- and 24 downregulated, Table S1) were identified in the LS vs N group. However, differentially expressed mRNAs and differentially expressed lncRNAs were not screened out in the LS vs ES group with a q_value <0.05. The cut-off value was then changed to P<0.05, and 235 differentially expressed mRNAs (143 up- and 92 downregulated) and 82 differentially expressed lncRNAs (28 up- and 54 downregulated) were identified in the LS vs ES group. Moreover, heatmap analysis revealed that ES or LS samples could be significantly distinguished from normal (N) tissue samples according to the expression levels of differentially expressed mRNAs or differentially expressed lncRNAs (Figure S1). A subsequent Venn diagram analysis indicated that there were 549 common differentially expressed mRNAs (Figure S2A) and 30 common differentially expressed lncRNAs (Figure S2B) between the ES vs N and LS vs N groups.
Functional enrichment analysis of differentially expressed mRNAs
The results of GO and KEGG pathway enrichment analyses (top ten) are shown in Figure 1. The differentially expressed mRNAs in the ES vs N and LS vs N groups were all markedly enriched in GO functions associated with extracellular matrix organization (BP function), proteinaceous extracellular matrix (CC function), and extracellular matrix structural constituent (MF function). The differentially expressed mRNAs in the LS vs ES group were enriched in the prominent GO functions related to leukocyte migration (BP function), proteinaceous extracellular matrix (CC function), and endopeptidase activity (MF function). In addition, the differentially expressed mRNAs in the ES vs N and LS vs N groups were all significantly enriched in several KEGG pathways, such as the PI3K-Akt signaling pathway, focal adhesion, and extracellular matrix–receptor interaction; the differentially expressed mRNAs in the LS vs ES group were markedly enriched in several KEGG pathways, including the IL-17 signaling pathway, the chemokine signaling pathway, and cytokine–cytokine receptor interaction.
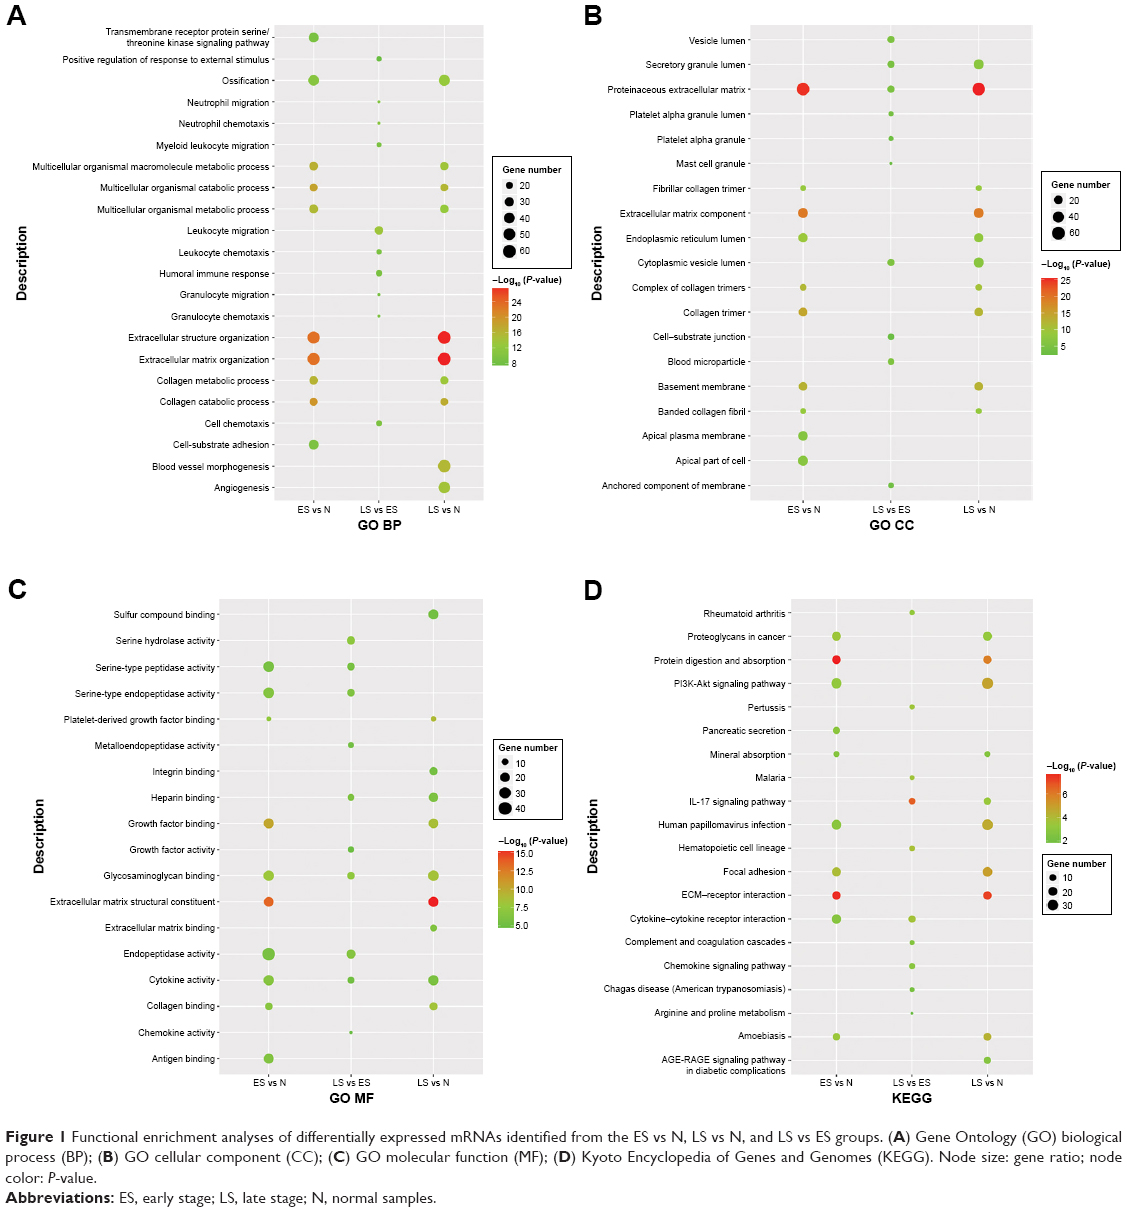 | Figure 1 Functional enrichment analyses of differentially expressed mRNAs identified from the ES vs N, LS vs N, and LS vs ES groups. (A) Gene Ontology (GO) biological process (BP); (B) GO cellular component (CC); (C) GO molecular function (MF); (D) Kyoto Encyclopedia of Genes and Genomes (KEGG). Node size: gene ratio; node color: P-value. |
PPI network analyses
The PPI network constructed using the common differentially expressed mRNAs between the ES vs N and LS vs N groups consisted of 377 nodes and 1,324 interaction pairs (Figure S3). After analysis of network topology properties, the top 15 nodes with the highest scores of degree centrality, betweenness centrality, and closeness centrality were, respectively, identified (Table 1), among which MMP2, MMP9, BCL2, SPP1, BMP2, and CCND1 belonged to the top 15 calculated from the three network topological properties.
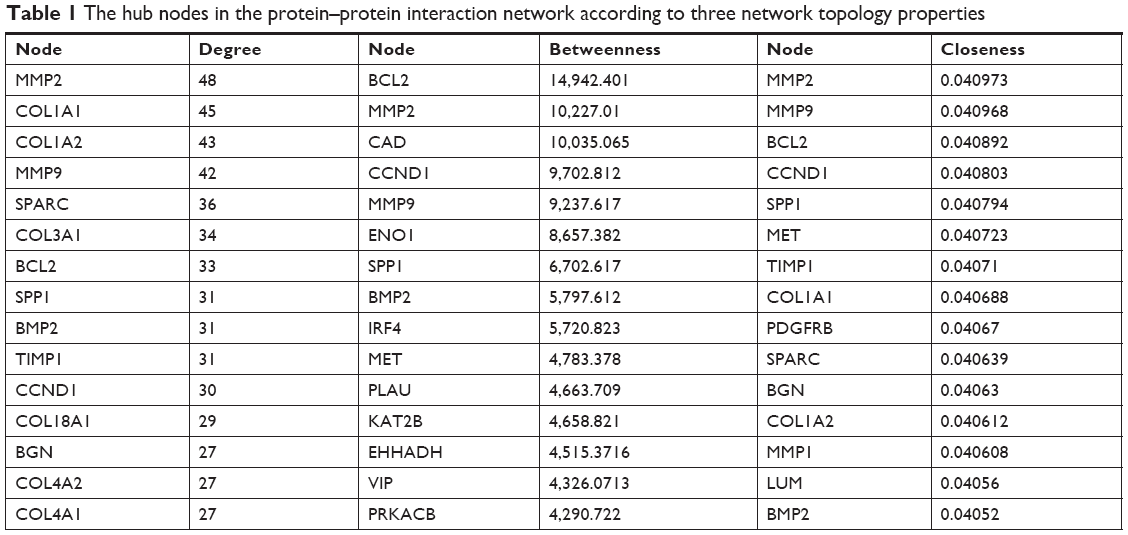 | Table 1 The hub nodes in the protein–protein interaction network according to three network topology properties |
Correlation analysis of lncRNAs and mRNAs
Using Pearson’s correlation analysis, the top ten lncRNAs were MSTRG.9732.1 (number = 402), CTB-28J9.3 (number = 390), MSTRG.25642.1 (number = 372), MAFG-AS1 (number = 312), MSTRG.225.1 (number = 306), MSTRG.35002.1 (number = 302), MSTRG.1647.1 (number = 284), MSTRG.29201.1 (number = 278), MSTRG.25557.1 (number = 275), and RP11-400N13.3 (number = 233) according to the number of their target mRNAs.
Functional analysis of lncRNAs
To better understand the functions of the lncRNAs, GO BP and KEGG pathway enrichment analyses for the target mRNAs of the differentially expressed lncRNAs were conducted (Figure 2). Notably, functional enrichment analysis showed that KIAA0125 was significantly enriched in neutrophil activation (GO BP) and the PI3K-Akt signaling pathway (KEGG). MSTRG.35002.1 (RP1-290B4.1) was markedly enriched in BMP signaling-related functions (GO BP) and steroid hormone biosynthesis (KEGG).
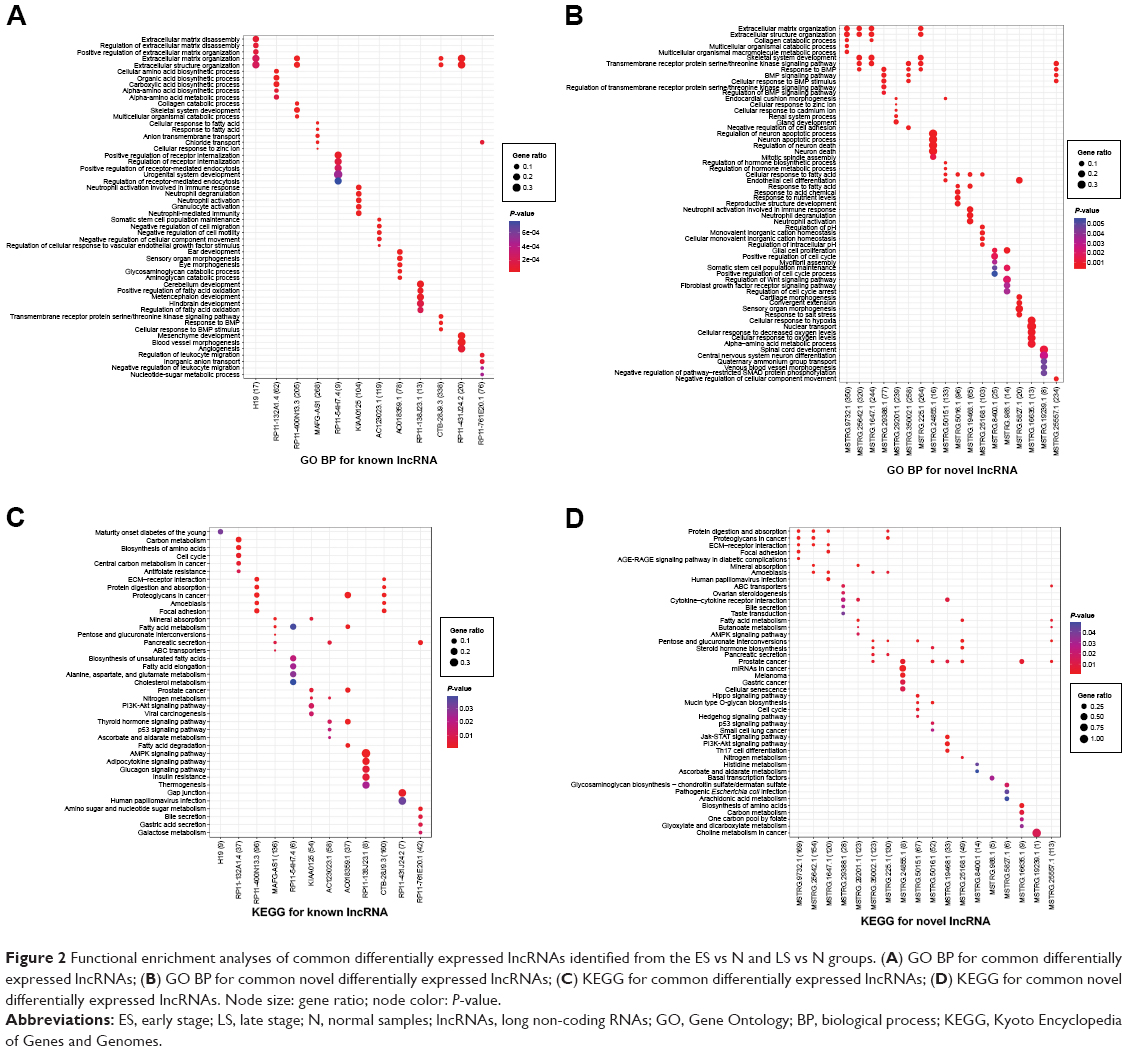 | Figure 2 Functional enrichment analyses of common differentially expressed lncRNAs identified from the ES vs N and LS vs N groups. (A) GO BP for common differentially expressed lncRNAs; (B) GO BP for common novel differentially expressed lncRNAs; (C) KEGG for common differentially expressed lncRNAs; (D) KEGG for common novel differentially expressed lncRNAs. Node size: gene ratio; node color: P-value. |
Construction of an miRNA–lncRNA–mRNA ceRNA regulatory network
The miRNAs targeting common differentially expressed mRNAs were predicted using the miRTarBase_2017 database in Enrichr tool, and the top five miRNAs with the highest number of target mRNAs were identified, including hsa-miR-124-3p, hsa-miR-29a-3p, hsa-miR-29b-3p, hsa-miR-29c-3p, and hsa-miR-4533 (Table 2). By integrating the miRNA–mRNA and miRNA–lncRNA regulatory relationships, the miRNA–lncRNA–mRNA network was then constructed. The miRNA–lncRNA–mRNA regulatory network is shown in Figure 3, in which several ceRNA relationships were revealed. For example, the ceRNA relationships hsa-miR-29b-3p-H19-FSCN1, hsa-miR-29b-3p-KIAA0125-BCL2, and hsa-miR-29b-3p-MSTRG.35002.1-MMP2 were identified. The downregulated lncRNAs MSTRG.35002.1, MSTRG.9732.1, MSTRG.225.1, and KIAA0125 and the upregulated lncRNAs MSTRG.5015.1, MSTRG.25168.1, and MAFG-AS1 were the central nodes in this network, indicating their important roles in this network.
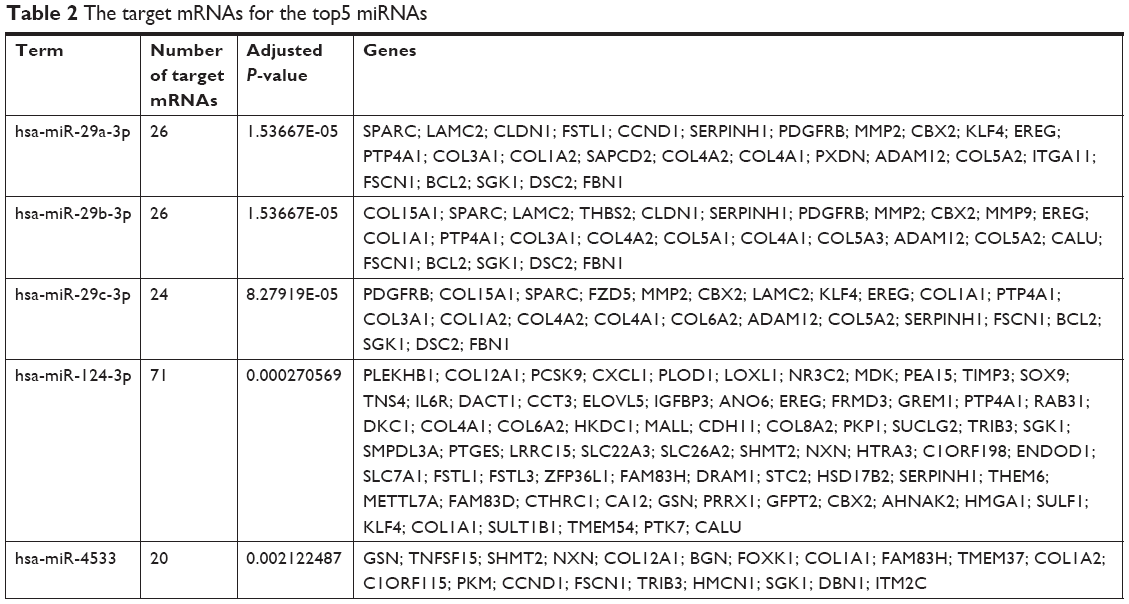 | Table 2 The target mRNAs for the top5 miRNAs |
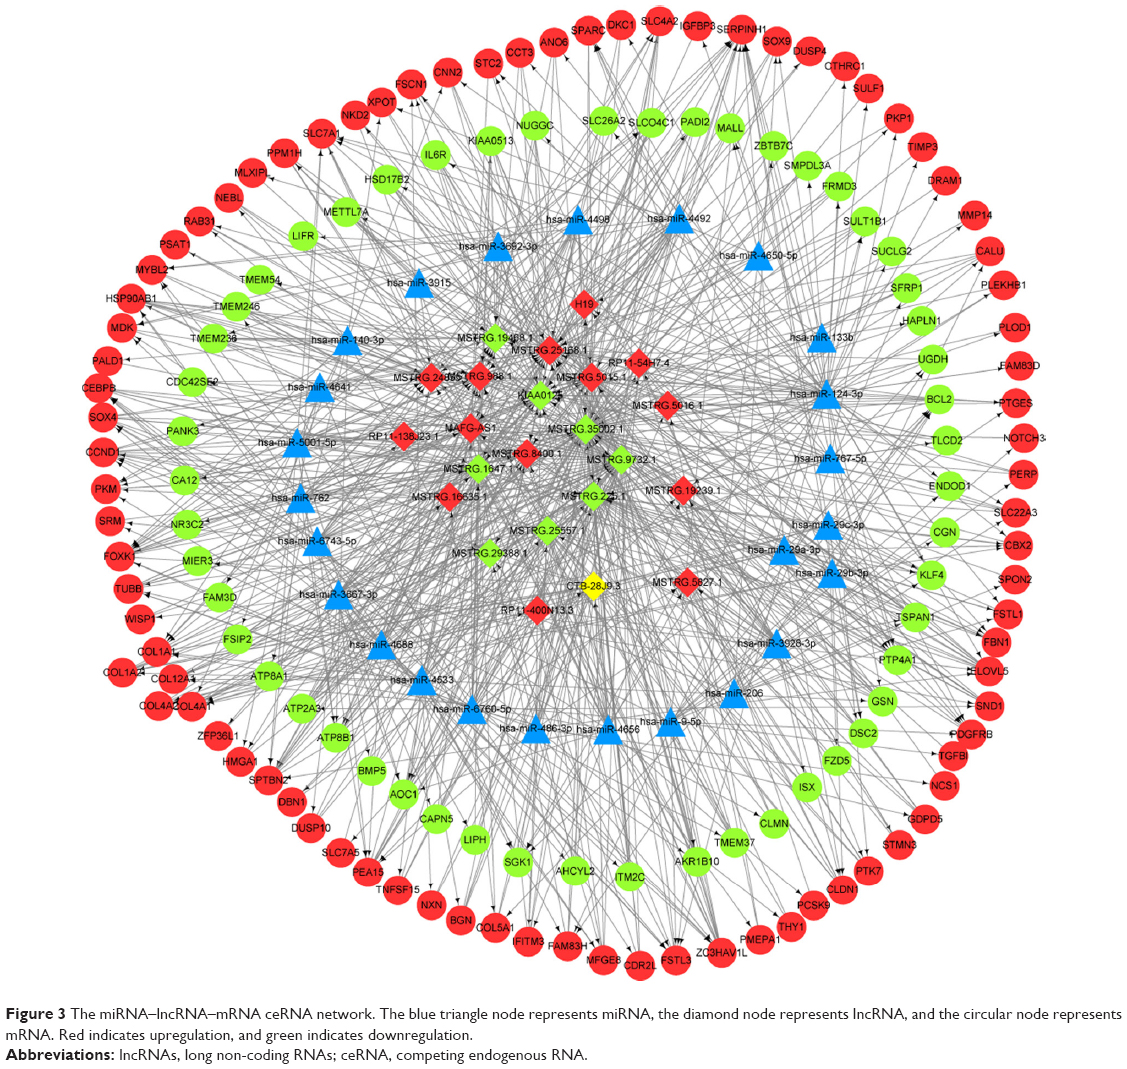 | Figure 3 The miRNA–lncRNA–mRNA ceRNA network. The blue triangle node represents miRNA, the diamond node represents lncRNA, and the circular node represents mRNA. Red indicates upregulation, and green indicates downregulation. |
Validation of the differential expression of KIAA0125 and MSTRG.35002.1 by qPCR
To further verify the differential expression of the key differentially expressed lncRNAs identified earlier, qPCR was conducted to determine their expression levels in ES and LS colon tumor tissues. As shown in Figure 4, KIAA0125 and MSTRG.35002.1 were significantly downregulated in both ES and LS colon tumor tissues compared with normal colon tissues, which was in line with the results of the aforementioned differential expression analysis.
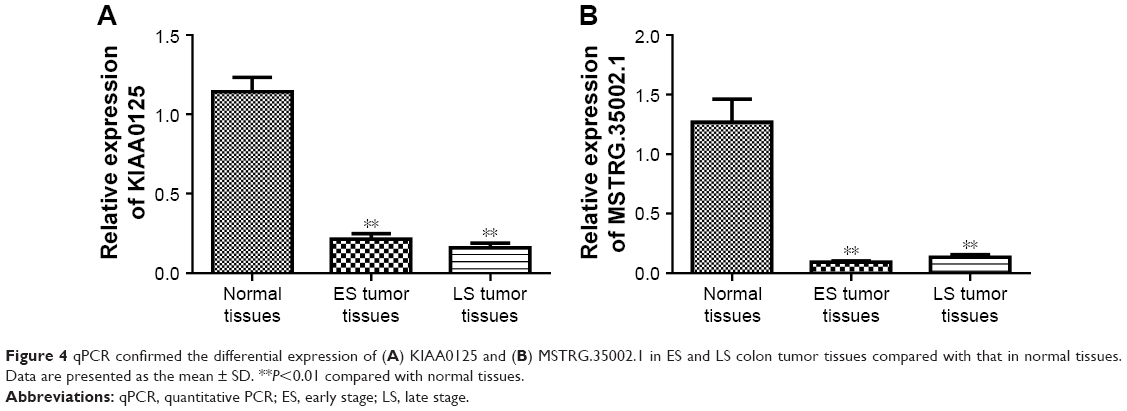 | Figure 4 qPCR confirmed the differential expression of (A) KIAA0125 and (B) MSTRG.35002.1 in ES and LS colon tumor tissues compared with that in normal tissues. Data are presented as the mean ± SD. **P<0.01 compared with normal tissues. |
Discussion
In this study, we investigated the mechanism underlying CRC by high-throughput RNA sequencing of colon cancer samples and normal samples and subsequent bioinformatics analysis. A total of 549 common differentially expressed mRNAs and 30 common differentially expressed lncRNAs were identified in both ES and LS colon cancer samples after comparison with normal samples. MMP2 and BCL2 were identified as hub nodes in the PPI network. In addition, functional analysis of lncRNAs revealed that KIAA0125 was significantly enriched in the PI3K-Akt signaling pathway and that MSTRG.35002.1 was markedly enriched in BMP signaling-related functions. Moreover, key miRNA–lncRNA–mRNA relationships, such as hsa-miR-29b-3p-H19-FSCN1, hsa-miR-29b-3p-KIAA0125-BCL2, and hsa-miR-29b-3p-MSTRG.35002.1-MMP2, were identified in the ceRNA network. Notably, the qPCR assay confirmed the differential expression of KIAA0125 and MSTRG.35002.1.
LncRNA H19, located at chromosome 11p15.5 locus, is expressed in the cell nucleus and cytoplasm.32 It has been shown to act as an oncogene in various cancers, including CRC.33–35 In addition, several lncRNA H19 and miR-29b associated ceRNA relationships have been reported to play important roles in carcinogenesis. For example, LncRNA H19/miR-29b-3p/PGRN axis promoted epithelial–mesenchymal transition of CRC cells by acting on Wnt Signaling.36 LncRNA H19 regulates E2F1 expression by competitively sponging endogenous miR-29a-3p in clear-cell renal cell carcinoma.37 In this study, we found that lncRNA H19 was significantly upregulated in CRC tissues compared with adjacent normal control. Upregulation of H19 might regulate FSCN1 expression by competitively sponging miR-29b-3p. FSCN1 is an actin-binding protein required for the formation of cytoplasmic bundles of microfilaments.38 FSCN1 was reported to be an oncogene in several cancers.39–42 These results indicated our results are reliable.
Increasing evidence has revealed that the aberrant expression of BCL2 is involved in several malignancies, including CRC.43 Given the role of BCL2 in CRC, we believe that the aberrant expression of BCL2 contributes to the development of CRC. In addition, several studies have confirmed that hsa-miR-29b-3p is involved in several human cancers.44 Basal levels of circulating hsa-miR-29b-3p have been shown to be associated with overall survival in patients with metastatic CRC.45 Moreover, hsa-miR-29b-3p is considered to be a promising miRNA-based therapy against CRC, and an miR-29b byproduct sequence has been shown to affect tumor suppressive activities in KRAS mutant colon cancer cells.46 These findings imply that hsa-miR-29b-3p plays a key role in CRC development. Moreover, lncRNA KIAA0125 was first identified to play a role in neurogenesis.47 However, the role of KIAA0125 in CRC has not been determined. In this study, hsa-miR-29b-3p-KIAA0125-BCL2 was a key miRNA–lncRNA–mRNA relationship detected in the ceRNA regulation network, and KIAA0125 was experimentally verified to be downregulated in colon cancer samples. We hypothesize that the downregulation of KIAA0125 may contribute to CRC development via the regulation of BCL2 expression by sponging hsa-miR-29b-3p.
Furthermore, KIAA0125 was found to be significantly enriched in the PI3K-Akt signaling pathway in this study. The PI3K-Akt signaling pathway is involved in regulating cell growth and survival under pathological conditions, including cancer. Accumulating evidence has highlighted the critical role of PI3K-Akt signaling in CRC development and progression.48 Moreover, targeting the PI3K/AKT/mTOR pathway has been suggested to be a promising therapeutic strategy for CRC therapy.49 Given the key role of the PI3K-Akt signaling pathway in CRC, we speculate that KIAA0125 might have significant roles in CRC development.
On the other hand, the hsa-miR-29b-3p-MSTRG.35002.1-MMP2 regulatory relationship was identified in the ceRNA network. Plasma MMP-2 expression was found to be increased in patients with lymph node-positive CRC, and it may be used as a potential predictor in this malignancy.50 Considering the crucial role of hsa-miR-29b-3p and MMP2, we suggest that MSTRG.35002.1, a novel lncRNA, may contribute to CRC development by regulating hsa-miR-29b-3p and MMP2. Furthermore, MSTRG.35002.1 was markedly enriched in BMP signaling-related functions. BMPs and their receptors are widely involved in the pathogenesis of some solid tumors. BMP signaling has been shown to promote cell invasion and bone metastasis in breast cancer via the SMAD pathway.51 Moreover, loss of SMAD4 can regulate BMP signaling to enhance the metastasis of CRC.52 Based on our results, we speculate that MSTRG.35002.1 may regulate CRC development via the BMP signaling pathway.
There are some limitations of this study that should be noted. First, the sample size is relatively small in our study. Only 24 samples were sequenced in this study, and the average age of the included patients was relatively young. Second, because of difficulty in collecting qualified samples, sex distribution was unbalanced in samples of ES group. Third, we only performed qPCR to detect the expression of KIAA0125 and MSTRG.35002.1. The ceRNA relationships, including hsa-miR-29b-3p-KIAA0125-BCL2 and hsa-miR-29b-3p-MSTRG.35002.1-MMP2, and their role in CRC development should be further verified through in vitro and in vivo experiments.
Conclusion
In summary, our findings indicate that key lncRNAs, including KIAA0125 and MSTRG.35002.1, may be involved in CRC development. Downregulation of KIAA0125 may contribute to CRC development by sponging hsa-miR-29b-3p to regulate BCL2 expression or by regulating the PI3K-Akt signaling pathway. Downregulation of MSTRG.35002.1 may promote CRC development by sponging hsa-miR-29b-3p to regulate MMP2 expression or by affecting the BMP signaling pathway. Further functional experiments are needed to verify these observations.
Acknowledgments
This study was supported by the Norman Bethune Program of Jilin University (No 2012201), Science and Technology Development Project of Jilin Province (No 20180101124JC), Special Project for Health Research of Jilin Province (No 2018SCZ031), and Health Technology Innovation Project of Jilin Province (No 3D517ED43430).
Disclosure
The authors report no conflicts of interest in this work.
References
Siegel RL, Miller KD, Fedewa SA, et al. Colorectal cancer statistics, 2017. CA Cancer J Clin. 2017;67(3):104–117. | ||
Tanoue Y, Tanaka N, Nomura Y. Primary site resection is superior for incurable metastatic colorectal cancer. World J Gastroenterol. 2010;16(28):3561–3566. | ||
Deng Q, He B, Gao T, et al. Up-regulation of 91h promotes tumor metastasis and predicts poor prognosis for patients with colorectal cancer. PLoS One. 2014;9(7):e103022. doi:10.1371/journal.pone.0103022 | ||
Alaiyan B, Ilyayev N, Stojadinovic A, et al. Differential expression of colon cancer associated transcript1 (CCAT1) along the colonic adenoma-carcinoma sequence. BMC Cancer. 2013;13:196. doi:10.1186/1471-2407-13-196 | ||
Wang Y, Lu Z, Wang N, et al. Long noncoding RNA DANCR promotes colorectal cancer proliferation and metastasis via mir-577 sponging. Exp Mol Med. 2018;50(5):57. doi:10.1038/s12276-018-0082-5 | ||
Bian Z, Zhang J, Li M, et al. LncRNA-FEZF1-AS1 promotes tumor proliferation and metastasis in colorectal cancer by regulating PKM2 signaling. Clin Cancer Res. 2018;24(19):4808–4819. doi:10.1158/1078-0432.CCR-17-2967 | ||
Luo ZF, Zhao D, Li XQ, et al. Clinical significance of hotair expression in colon cancer. World J Gastroenterol. 2016;22(22):5254–5259. doi:10.3748/wjg.v22.i22.5254 | ||
Tatangelo F, Di Mauro A, Scognamiglio G, et al. Posterior hox genes and hotair expression in the proximal and distal colon cancer pathogenesis. J Transl Med. 2018;16(1):350. doi:10.1186/s12967-018-1725-y | ||
Rui Y, Hu M, Wang P, et al. LncRNA HOTTIP mediated DKK1 downregulation confers metastasis and invasion in colorectal cancer cells. Histol Histopathol. 2018;18043. doi: 10.14670/hh-18-043 | ||
Xu Y, Zhang X, Hu X, et al. The effects of lncRNA MALAT1 on proliferation, invasion and migration in colorectal cancer through regulating sox9. Mol Med. 2018;24(1):52. doi:10.1186/s10020-018-0050-5 | ||
Cheng K, Zhao Z, Wang G, Wang J, Zhu W. LncRNA GAS5 inhibits colorectal cancer cell proliferation via the miR1825p/FOXO3a axis. Oncol Rep. 2018;40(4):2371–2380. doi:10.3892/or.2018.6584 | ||
Zhu Y, Chen P, Gao Y, et al. MEG3 activated by vitamin D inhibits colorectal cancer cells proliferation and migration via regulating clusterin. EBioMedicine. 2018;30:148–157. doi:10.1016/j.ebiom.2018.03.032 | ||
Yuan Z, Yu X, Ni B, et al. Overexpression of long non-coding RNA-CTD903 inhibits colorectal cancer invasion and migration by repressing Wnt/beta-catenin signaling and predicts favorable prognosis. Int J Oncol. 2016;48(6):2675–2685. doi:10.3892/ijo.2016.3447 | ||
Shi D, Zheng H, Zhuo C, et al. Low expression of novel lncRNA RP11-462c24.1 suggests a biomarker of poor prognosis in colorectal cancer. Med Oncol. 2014;31(7):31. doi:10.1007/s12032-014-0374-0 | ||
Xu J, Zhang R, Zhao J. The novel long noncoding RNA TUSC7 inhibits proliferation by sponging MiR-211 in colorectal cancer. Cell Physiol Biochem. 2017;41(2):635–644. doi:10.1159/000457938 | ||
Lu M, Liu Z, Li B, Wang G, Li D, Zhu Y. The high expression of long non-coding RNA PANDAR indicates a poor prognosis for colorectal cancer and promotes metastasis by EMT pathway. J Cancer Res Clin Oncol. 2017;143(1):71–81. doi:10.1007/s00432-016-2252-y | ||
Chen T, Yang P, Wang H, He ZY. Silence of long noncoding RNA PANDAR switches low-dose curcumin-induced senescence to apoptosis in colorectal cancer cells. Onco Targets Ther. 2017;10:483–491. doi:10.2147/OTT.S127547 | ||
Salmena L, Poliseno L, Tay Y, Kats L, Pandolfi PP. A ceRNA hypothesis: the Rosetta stone of a hidden RNA language? Cell. 2011;146(3):353–358. doi:10.1016/j.cell.2011.07.014 | ||
Jin J, Chu Z, Ma P, Meng Y, Yang Y. Long non-coding RNA SPRY4-IT1 promotes proliferation and invasion by acting as a ceRNA of miR-101-3p in colorectal cancer cells. Tumour Biol. 2017;39(7):1010428317716250. doi:10.1177/1010428317716250 | ||
Chen DL, Lu YX, Zhang JX, et al. Long non-coding RNA UICLM promotes colorectal cancer liver metastasis by acting as a ceRNA for microRNA-215 to regulate ZEB2 expression. Theranostics. 2017;7(19):4836–4849. doi:10.7150/thno.20942 | ||
Bolger AM, Lohse M, Usadel B. Trimmomatic: a flexible trimmer for illumina sequence data. Bioinformatics. 2014;30(15):2114–2120. doi:10.1093/bioinformatics/btu170 | ||
Kim D, Pertea G, Trapnell C, Pimentel H, Kelley R, Salzberg SL. TopHat2: accurate alignment of transcriptomes in the presence of insertions, deletions and gene fusions. Genome Biol. 2013;14(4):R36. doi:10.1186/gb-2013-14-4-r36 | ||
Pertea M, Pertea GM, Antonescu CM, Chang TC, Mendell JT, Salzberg SL. StringTie enables improved reconstruction of a transcriptome from RNA-seq reads. Nat Biotechnol. 2015;33(3):290–295. doi:10.1038/nbt.3122 | ||
Trapnell C, Williams B, Pertea G, et al. Transcript assembly and quantification by RNA-seq reveals unannotated transcripts and isoform switching during cell differentiation. Nat Biotechnol. 2010;28(5):511–515. doi:10.1038/nbt.1621 | ||
Yu G, Wang LG, Han Y, He QY. Clusterprofiler: an R package for comparing biological themes among gene clusters. OMICS. 2012;16(5):284–287. doi:10.1089/omi.2011.0118 | ||
Szklarczyk D, Franceschini A, Wyder S, et al. STRING v10: protein–protein interaction networks, integrated over the tree of life. Nucleic Acids Res. 2015;43(Database issue):D447–D452. doi:10.1093/nar/gku1003 | ||
Kohl M, Wiese S, Warscheid B. Cytoscape: software for visualization and analysis of biological networks. Methods Mol Biol. 2011; 696:291–303. doi: 10.1007/978-1-60761-987-1_18 | ||
Tang Y, Li M, Wang J, Pan Y, Wu FX. CytoNCA: a cytoscape plugin for centrality analysis and evaluation of protein interaction networks. Biosystems. 2015;127:67–72. doi:10.1016/j.biosystems.2014.11.005 | ||
Benjamini Y, Hochberg Y. Controlling the false discovery rate: a practical and powerful approach to multiple testing. J R Stat Soc. 1995;57(1):289–300. | ||
Chen, EY, Tan, CM, Kou, Y, et al. Enrichr: interactive and collaborative HTML5 gene list enrichment analysis tool. BMC Bioinformatics. 2013;14(1):128. doi:10.1186/1471-2105-14-128 | ||
John B, Enright AJ, Aravin A, Tuschl T, Sander C, Marks DS. Human microRNA targets. PLoS Biol. 2004;2(11):e363. doi:10.1371/journal.pbio.0020363 | ||
Gabory A, Jammes H, Dandolo L. The H19 locus: role of an imprinted non-coding RNA in growth and development. Bioessays. 2010;32(6):473–480. doi:10.1002/bies.200900170 | ||
Li J, Huang Y, Deng X, et al. Long noncoding RNA H19 promotes transforming growth factor-beta-induced epithelial-mesenchymal transition by acting as a competing endogenous RNA of miR-370-3p in ovarian cancer cells. Onco Targets Ther. 2018;11:427–440. doi:10.2147/OTT.S149908 | ||
Wang M, Han D, Yuan Z, et al. Long non-coding RNA H19 confers 5-Fu resistance in colorectal cancer by promoting SIRT1-mediated autophagy. Cell Death Dis. 2018;9(12):1149. doi:10.1038/s41419-018-1187-4 | ||
Huang Z, Lei W, Hu HB, Zhang H, Zhu Y. H19 promotes non-small-cell lung cancer (NSCLC) development through STAT3 signaling via sponging miR-17. J Cell Physiol. 2018;233(10):6768–6776. doi:10.1002/jcp.26530 | ||
Ding D, Li C, Zhao T, Li D, Yang L, Zhang B. LncRNA H19/miR-29b-3p/PGRN axis promoted epithelial-mesenchymal transition of colorectal cancer cells by acting on Wnt signaling. Mol Cells. 2018;41(5):423–435. doi:10.14348/molcells.2018.2258 | ||
He H, Wang N, Yi X, Tang C, Wang D. Long non-coding RNA H19 regulates E2F1 expression by competitively sponging endogenous miR-29a-3p in clear cell renal cell carcinoma. Cell Biosci. 2017;7:65. doi:10.1186/s13578-017-0193-z | ||
Hashimoto Y, Skacel M, Adams JC. Roles of fascin in human carcinoma motility and signaling: prospects for a novel biomarker? Int J Biochem Cell Biol. 2005;37(9):1787–1804. doi:10.1016/j.biocel.2005.05.004 | ||
Hanker LC, Karn T, Holtrich U, et al. Prognostic impact of fascin-1 (fscn1) in epithelial ovarian cancer. Anticancer Res. 2013;33(2):371–377. | ||
Darnel AD, Behmoaram E, Vollmer RT, et al. Fascin regulates prostate cancer cell invasion and is associated with metastasis and biochemical failure in prostate cancer. Clin Cancer Res. 2009;15(4):1376–1383. doi:10.1158/1078-0432.CCR-08-1789 | ||
Liang Z, Wang Y, Shen Z, et al. Fascin 1 promoted the growth and migration of non-small cell lung cancer cells by activating YAP/TEAD signaling. Tumour Biol. 2016;37(8):10909–10915. doi:10.1007/s13277-016-4934-0 | ||
Zhao W, Gao J, Wu J, et al. Expression of fascin-1 on human lung cancer and paracarcinoma tissue and its relation to clinicopathological characteristics in patients with lung cancer. Onco Targets Ther. 2015;8:2571–2576. doi:10.2147/OTT.S81915 | ||
Liao WT, Ye YP, Zhang NJ, et al. MicroRNA-30b functions as a tumour suppressor in human colorectal cancer by targeting KRAS, PIK3CD and BCL2. J Pathol. 2014;232(4):415–427. doi:10.1002/path.4309 | ||
Yan W, Yang W, Liu Z, Wu G. Characterization of microRNA expression in primary human colon adenocarcinoma cells (SW480) and their lymph node metastatic derivatives (SW620). Onco Targets Ther. 2018;11:4701–4709. doi:10.2147/OTT.S169233 | ||
Ulivi P, Canale M, Passardi A, et al. Circulating plasma levels of miR-20b, miR-29b and miR-155 as predictors of bevacizumab efficacy in patients with metastatic colorectal cancer. Int J Mol Sci. 2018;19:1. doi:10.3390/ijms19010307 | ||
Inoue A, Mizushima T, Wu X, et al. A miR-29b byproduct sequence exhibits potent tumor-suppressive activities via inhibition of NF-κB signaling in KRAS-mutant colon cancer cells. Mol Cancer Ther. 2018;17(5):977–987. doi:10.1158/1535-7163.MCT-17-0850 | ||
Uhrig M, Ittrich C, Wiedmann V, et al. New Alzheimer amyloid beta responsive genes identified in human neuroblastoma cells by hierarchical clustering. PLoS One. 2009;4(8):e6779. doi:10.1371/journal.pone.0006779 | ||
Slattery ML, Mullany LE, Sakoda LC, et al. The PI3k/AKT signaling pathway: associations of miRNAs with dysregulated gene expression in colorectal cancer. Mol Carcinog. 2018;57(2):243–261. doi:10.1002/mc.22752 | ||
Wang XW, Zhang YJ. Targeting mTOR network in colorectal cancer therapy. World J Gastroenterol. 2014;20(15):4178–4188. doi:10.3748/wjg.v20.i15.4178 | ||
Langenskiold M, Holmdahl L, Falk P, Ivarsson ML. Increased plasma MMP-2 protein expression in lymph node-positive patients with colorectal cancer. Int J Colorectal Dis. 2005;20(3):245–252. doi:10.1007/s00384-004-0667-4 | ||
Katsuno Y, Hanyu A, Kanda H, et al. Bone morphogenetic protein signaling enhances invasion and bone metastasis of breast cancer cells through SMAD pathway. Oncogene. 2008;27(49):6322–6333. doi:10.1038/onc.2008.232 | ||
Voorneveld PW, Kodach LL, Jacobs RJ, et al. Loss of SMAD4 alters BMP signaling to promote colorectal cancer cell metastasis via activation of Rho and ROCK. Gastroenterology. 2014;147(1):196–208.e113. doi:10.1053/j.gastro.2014.03.052 |
 © 2019 The Author(s). This work is published and licensed by Dove Medical Press Limited. The full terms of this license are available at https://www.dovepress.com/terms.php and incorporate the Creative Commons Attribution - Non Commercial (unported, v3.0) License.
By accessing the work you hereby accept the Terms. Non-commercial uses of the work are permitted without any further permission from Dove Medical Press Limited, provided the work is properly attributed. For permission for commercial use of this work, please see paragraphs 4.2 and 5 of our Terms.
© 2019 The Author(s). This work is published and licensed by Dove Medical Press Limited. The full terms of this license are available at https://www.dovepress.com/terms.php and incorporate the Creative Commons Attribution - Non Commercial (unported, v3.0) License.
By accessing the work you hereby accept the Terms. Non-commercial uses of the work are permitted without any further permission from Dove Medical Press Limited, provided the work is properly attributed. For permission for commercial use of this work, please see paragraphs 4.2 and 5 of our Terms.