")
Back to Journals » Cancer Management and Research » Volume 10
Whole-body magnetic resonance imaging for the assessment of metastatic breast cancer
Authors Godinho MV , Lopes FP , Costa FM
Received 12 March 2018
Accepted for publication 30 August 2018
Published 6 December 2018 Volume 2018:10 Pages 6743—6756
DOI https://doi.org/10.2147/CMAR.S167924
Checked for plagiarism Yes
Review by Single anonymous peer review
Peer reviewer comments 2
Editor who approved publication: Professor Harikrishna Nakshatri
Marcos Vieira Godinho,1,2 Flavia Paiva Proença Lobo Lopes,1,3 Flavia Martins Costa1
1Clinic of Imaging Diagnosis (CDPI), Rio de Janeiro, RJ, Brazil; 2National Institute of Cancer (INCa), Rio de Janeiro, RJ, Brazil; 3Radiology Department, Federal University of Rio de Janeiro (UFRJ), Rio de Janeiro, RJ, Brazil
Abstract: Breast cancer is the most common type of tumor in women and an important cause of mortality in the female population. The early and precise diagnosis, staging, and treatment of this neoplasia are essential for public health purposes. Technological development, for example, of whole-body magnetic resonance imaging, made possible the adoption of new imaging modalities for a better approach for these patients. This imaging modality is helpful to staging, to therapy response assessment, and to the study of therapeutic changes in bone marrow, because it gives, at the same time, anatomical information using T1- and T2-weighted images, with high spatial resolution and tissue contrast, as well as functional sequences (diffusion-weighted images), which make possible the detection of hypercellular viable tumors.
Keywords: diffusion, hypercellularity, staging, heterogeneity, chemotherapy, necrosis
Introduction
The neoplasms of the breast comprise a heterogeneous group of diseases with distinct behavior and varied clinical and morphological manifestations, displaying different genetic signatures and diverse therapeutic responses.1 The spectrum of proliferative abnormalities in the breast’s lobules and ducts begins with hyperplasia and is followed by atypical hyperplasia, in situ carcinoma, and, finally, invasive carcinoma. Infiltrating ductal carcinoma is the most common histological type of breast cancer. In addition to ductal and lobular carcinomas, other subtypes of breast carcinoma include tubular, mucinous, medullary, micropapillary, and papillary.1
Breast cancer is the most common type of cancer in women (excluding nonmelanoma skin cancer), corresponding to 25% of the total number of cancers in the world, with 1.7 million new cases in 2012. It is also the most frequent cause of death from cancer in women. In Brazil, 57,960 new cases of breast cancer were diagnosed in 2016, and this tumor was responsible for 14,388 deaths in the country in 2013.1
The main predictive and prognostic factors in breast cancer are the tumor’s staging and histological characteristics,1 hormone receptor expression, and, more recently, HER-2 overexpression; these factors are crucial for individualized and effective therapeutic planning based on the clinical status of the patient. During staging, the evaluation of occult metastases in high-risk patients is performed with chest X-ray, abdomen ultrasound, and bone scintigraphy, although there is increasing use of computed tomography (CT), positron emission tomography with CT (PET/CT), and magnetic resonance (MR) imaging.
It is essential to establish an early diagnosis and perform appropriate monitoring of patients in regard to bone (main metastatic site) and visceral metastases, which are more common in the lungs, brain, and liver. It should be pointed out that about 10% of the patients have secondary neoplastic involvement of multiple organs.2
Bone metastasis is a significant clinical problem due to poor prognosis and need for an effective therapeutic strategy upon its detection. Currently, conventional imaging methods such as conventional radiography, CT, and bone scintigraphy are limited in their ability to early detection of bone metastases. In addition to frequently detecting bone disease in late stages – allowing the metastases to increase in volume – these methods often fail to demonstrate the heterogeneity of the tumor’s biological behavior. Consequently, primary or secondary there is a delay to detect treatment resistance, leading to a delay in therapeutic modification.3,4 Controversy remains in regard to the profile of the patients presenting with bone metastases and the best imaging diagnostic methods for staging of distant disease. However, the guidelines by the National Comprehensive Cancer Network recommend the evaluation of metastases in patients who are symptomatic and in those who are asymptomatic but present with clinical staging equal to or exceeding IIIA.2
Within this context, whole-body MR appears as an attractive diagnostic tool, both for early detection of bone metastases, as well as for simultaneous detection of metastases to other sites (liver and brain). The technological development of new devices has allowed the acquisition of rapid sequences with thin slices and high-resolution images, allowing more comfort to the patient and yielding a high sensitivity and specificity to the method. Whole-body MR has also been used in the evaluation of patients with prostate cancer with promising results5 and is currently considered the gold-standard imaging method for evaluation and early detection of bone marrow infiltration in patients with multiple myeloma.6
Whole-body MR: image acquisition protocol
The main objectives of performing whole-body MR in patients with breast cancer include the search for hypercellular lesions for disease staging, assessment of clinical response, and evaluation of post-therapeutic changes and complications.
Whole-body MR combines anatomical T1 and T2 images with functional information using diffusion sequences, which is an advantage of this imaging modality.7
The protocol used is feasible, reproducible, and performed in a relatively short time, considering the fact that the entire body is examined. The duration of the examination has decreased over the years, and quality images are currently obtained with an acquisition time of about 40–45 minutes. In the vast majority of cases, no intravenous contrast media is needed for bone evaluation. However, some radiologists perform gadolinium-based contrast agent injection if liver and brain screenings are planned and if meningeal carcinomatosis is suspected.7
During the whole-body MR examination, the patient is positioned in dorsal decubitus with four coils covering the extension from the skull vertex to the mid-thigh. The evaluation is necessarily performed on a high-field scanner (1.5 T or 3.0 T). T1-weighted sequences in the sagittal plane, 3D T1-Dixon sequences in the coronal and/or axial plane, T2-HASTE sequences in the axial plane, short-tau inversion-recovery (STIR) sequences in the sagittal plane, and diffusion-weighted sequences with b values of 50 s/mm2, and 800 s/mm2 in the axial plane (or 50 s/mm2, 600 s/mm2 and 900 s/mm2, depending on the magnetic field strength and on the protocol) are acquired.
The diffusion-weighted sequence is acquired with fat suppression technique (STIR) and free breathing, reducing the duration of the examination and the presence of magnetic susceptibility artifacts, as well as increasing the signal-to-noise ratio.8
Whole-body MR: interpretation of diffusion-weighted images
Using the diffusion-weighted sequence with b values of 50 s/mm2 and 800 s/mm2, the apparent diffusion coefficient (ADC) map is calculated and can be measured with the use of a region of interest (ROI) placed into the lesion. This sequence evaluates the intracellular, extracellular, and transcellular movement of water molecules, and the evaluation is influenced by the intravascular compartment, or microperfusion component, in values with a lower gradient.9–12 The highest b values are influenced by environments with increased cellularity, such as those of viable tumor tissue.10–12 Due to their hypercellularity, metastases from breast cancer exhibit restricted diffusion, characterized by a hyperintense signal on high b values and a decreased signal on the ADC map.9–12 The ADC analysis may be qualitative, obtained from a visual evaluation of the generated ADC map, or quantitative, obtained from a measurement of the ADC value by placing an ROI covering the largest part of the lesion of interest or by means of histogram analysis.
The evaluation of images obtained with diffusion-weighted sequences with a high b value can also be performed by a three-dimensional reformatted maximum intensity projection (MIP) in inverted grayscale. With this technique, the metastases appear as foci with a hypointense signal on a white background, facilitating the detection of suspicious lesions8,10 (Figure 1) and the exposure of the total metastatic volume in a single whole-body image.
 | Figure 1 A 39-year-old female patient with a diagnosis of breast cancer, as well as bilateral mastectomy and breast prostheses implantation, undergoing chemotherapy. Notes: Whole-body MR with diffusion-weighted images (b800) with three-dimensional reformatted MIP in inverted grayscale in the coronal plane: multiple bone metastases in the ribs, spine, sacrum, pelvis, both scapulas and humeri. The mammary implants are also observed. The findings on bone scintigraphy were similar. Abbreviations: MIP, maximum intensity projection; MR, magnetic resonance. |
Main applications
Assessment of initial staging
Whole-body MR is a powerful tool in the staging of breast cancer before treatment as explained below.
Evaluation of bone metastases
The bone is the most common metastatic site in breast cancer,13 and the bone sites most often involved are those of the axial and proximal appendicular skeleton. Metastatic lesions may be osteolytic, osteoblastic, or mixed.14 Osteolytic lesions are the most frequent ones upon presentation, although osteoblastic lesions predominate in up to 20% of the patients.13
Whole-body MR is the primary imaging method to evaluate bone marrow, including secondary bone involvement, using the protocol described above.
On MR images, osteolytic metastases from breast cancer present with a hypointense signal in T1-weighted sequences and hyperintense signal in STIR sequences,15 with restriction to water diffusion and low signal on the ADC map (Figures 2 and 3). However, there is still no consensus in the literature about the threshold value of quantitative ADC for viable tumor tissue.11
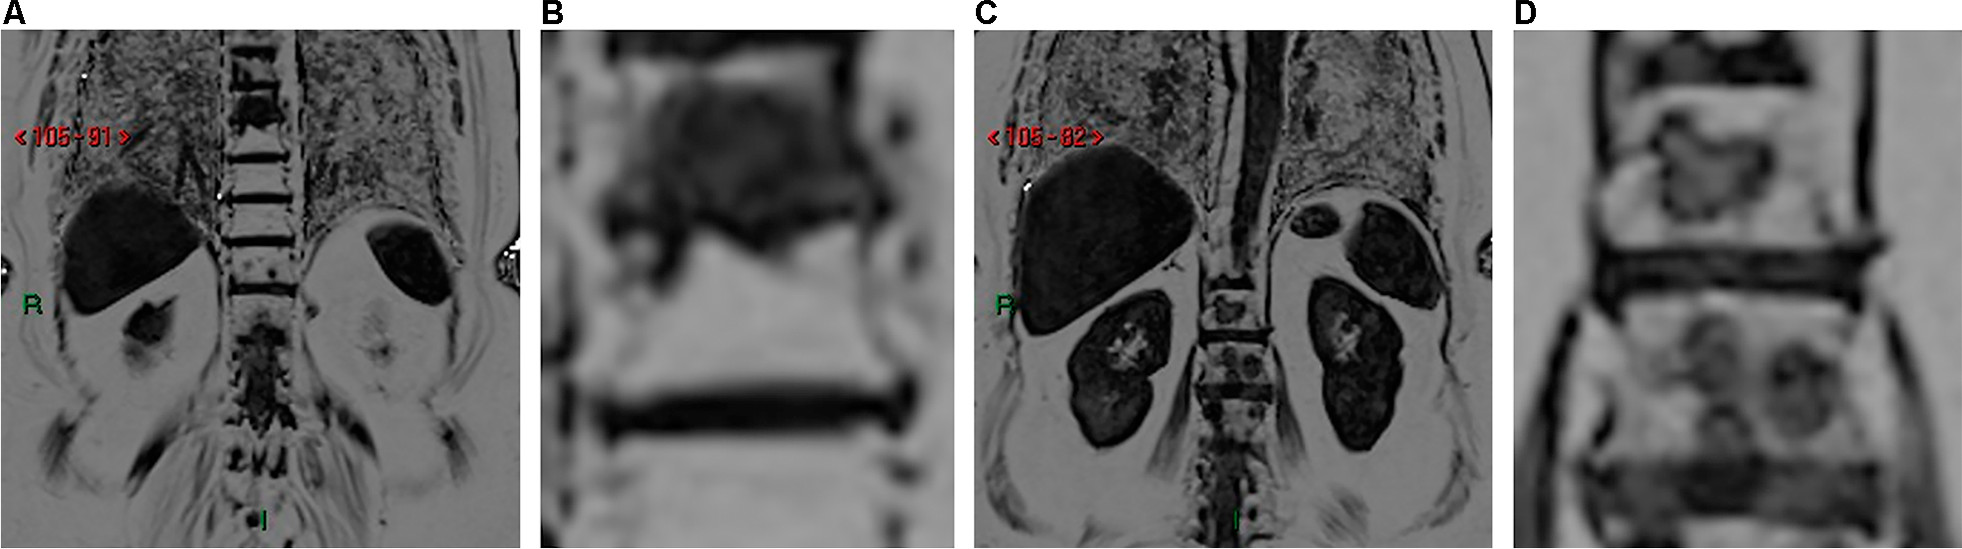
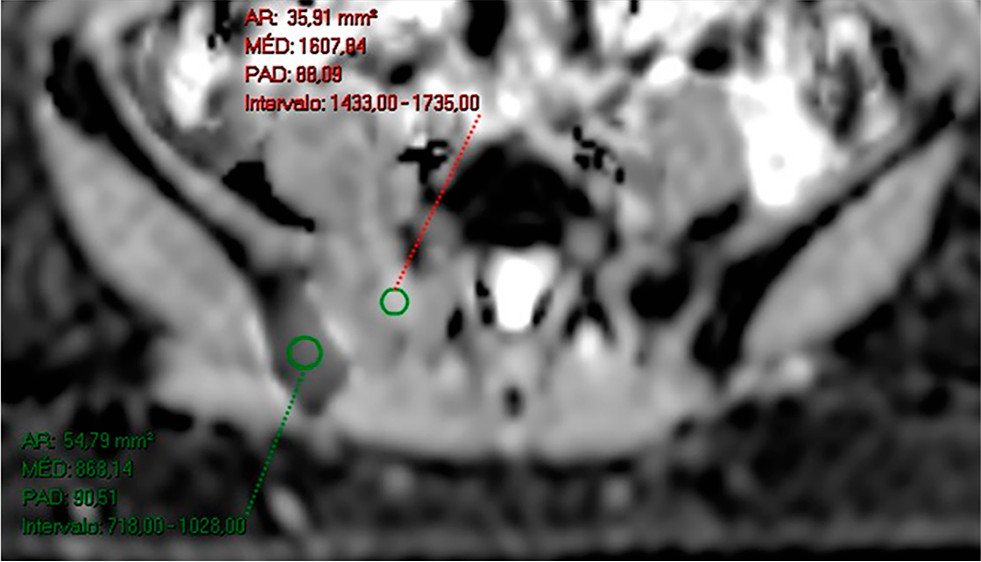 | Figure 2 A 50-year-old female patient diagnosed with breast cancer, undergoing treatment with anastrozole and bisphosphonate. Notes: Imaging evaluation performed in February 2017, after treatment initiation. ADC map in the axial plane showing in the same image a lesion in the right sacral wing with a high ADC value, suggestive of therapeutic response, and another lesion in the right ilium with a low ADC value, suggesting viable neoplastic tissue. Therefore, this case displays a heterogeneous response in the same patient. Abbreviation: ADC, apparent diffusion coefficient. |
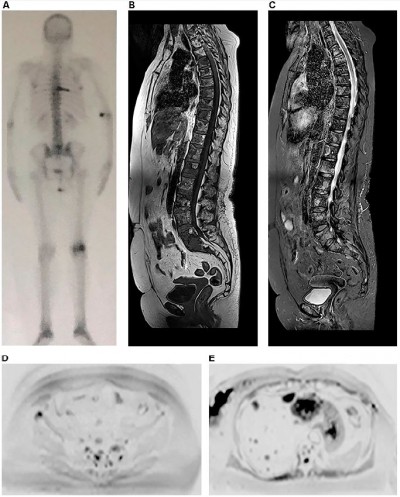
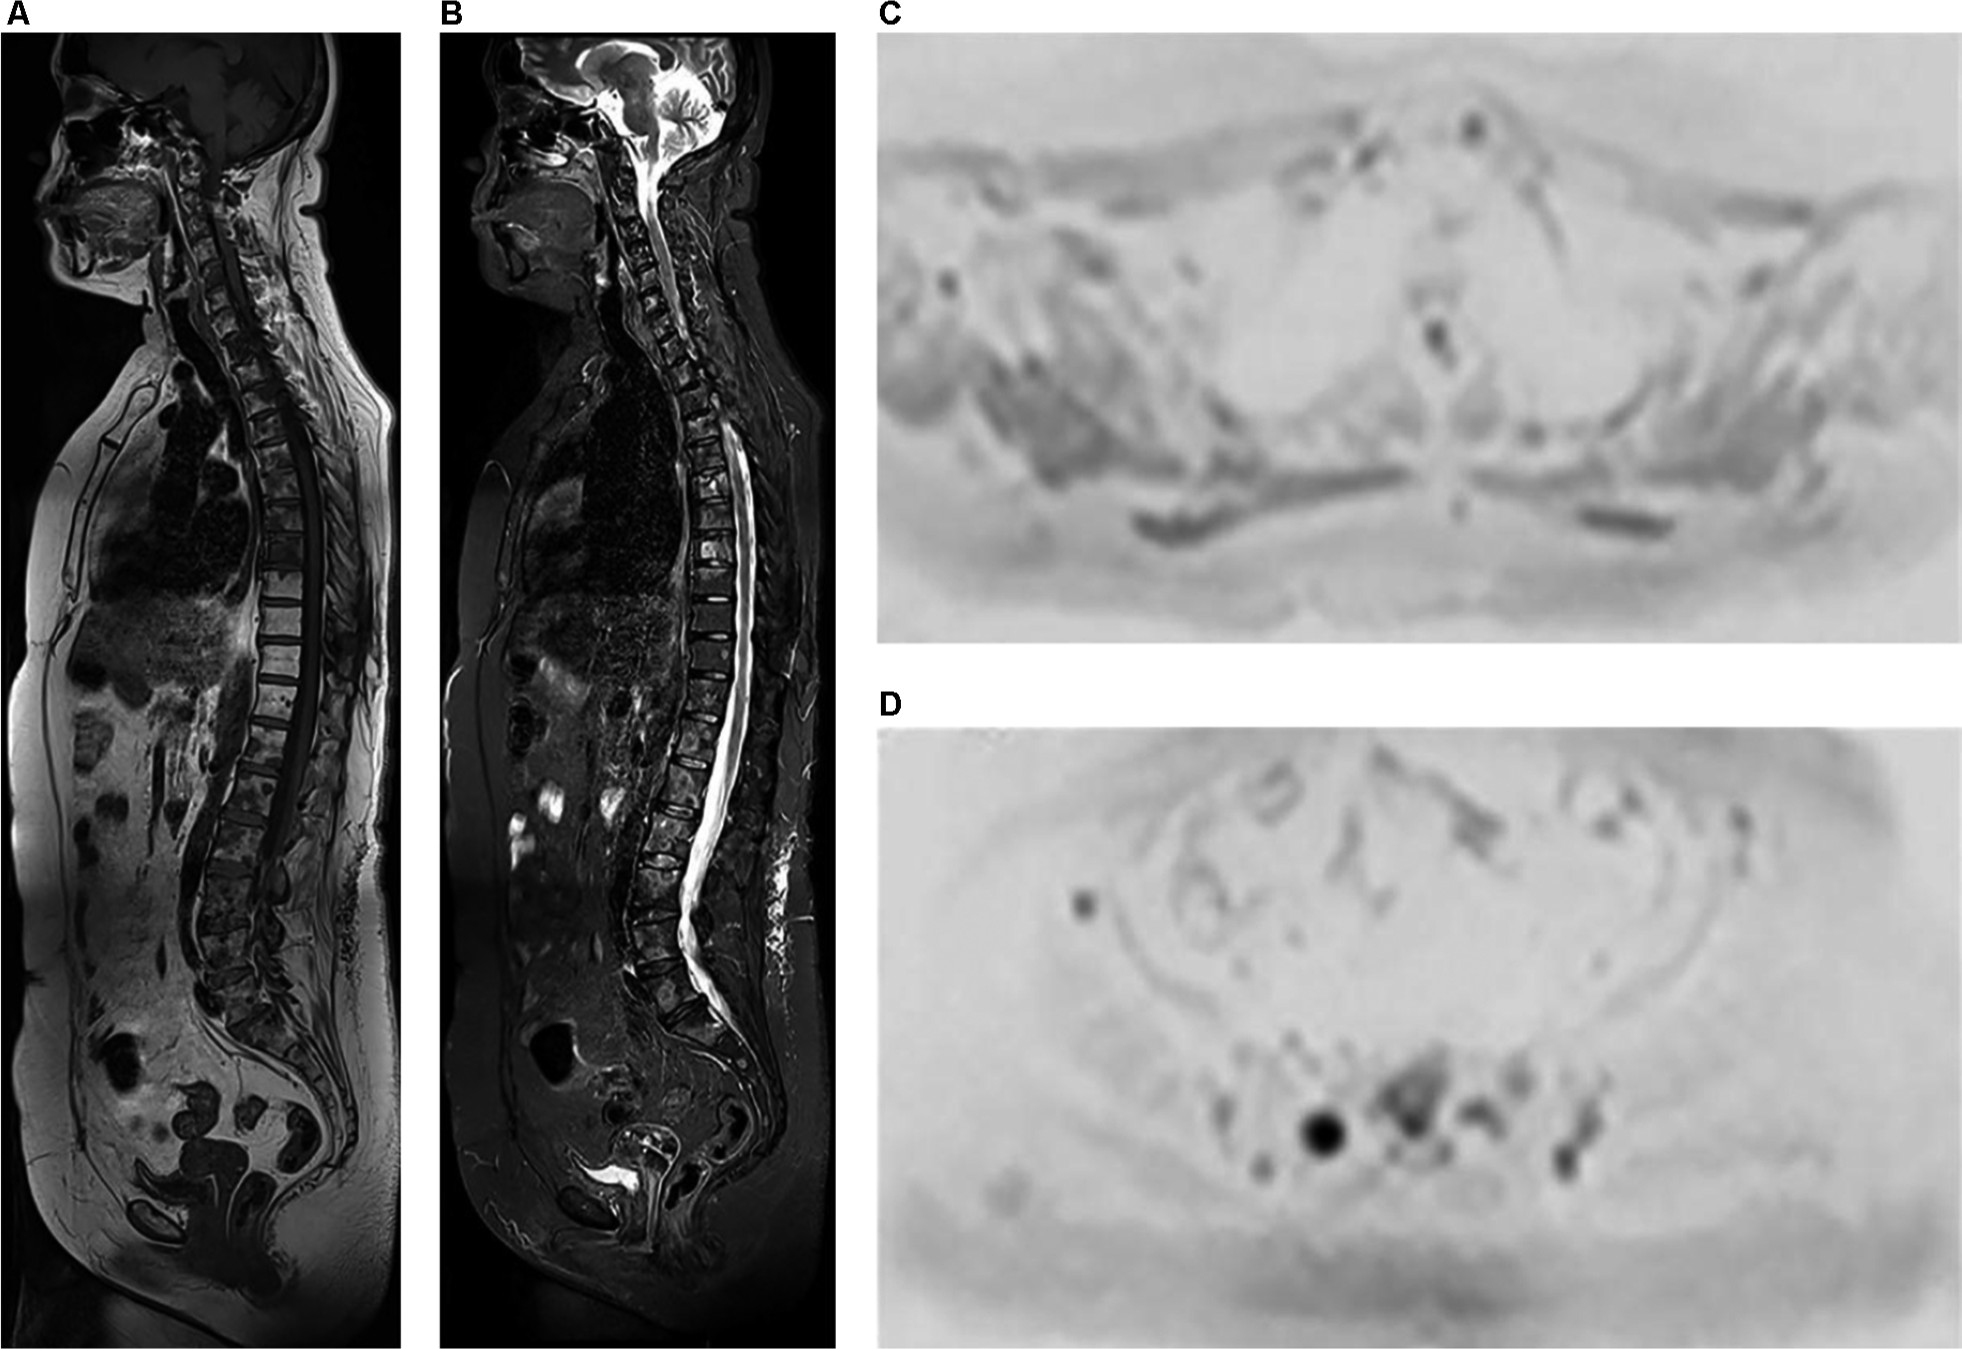
 | Figure 3 A 38-year-old female patient diagnosed with bilateral breast cancer in 2015 underwent a bilateral mastectomy and left axillary dissection in September 2015. Notes: The patient received chemotherapy from October 2015 to March 2016 and radiotherapy in June and July 2016 (28 sessions). She had already been treated with anastrozole and goserelin (March 2016 to June 2017) and initiated use of capecitabine in June 2017 and zoledronic acid in August 2017. She currently complains of lumbar pain. In (A), bone scintigraphy shows an unspecific and discrete focus of uptake in the left iliac crest. In (B) and (C), coronal and sagittal reformatted CT (June 2016) shows sclerotic areas in some vertebrae, the sternum, and ilium and partial collapse of L5, suggestive of lumbar metastasis. Whole-body MR showing discrete hypointense areas in sagittal T1 (D), without expression in sagittal STIR (E), and partial replacement of these lesions by fatty marrow in fat-fraction coronal T1 sequences (F and G). The diffusion-weighted sequence (b800) in inverted grayscale in the axial plane (H) shows no active lesions with diffusion restriction. The set of MR findings suggests lesions with a predominance of therapeutic response. Abbreviations: CT, computed tomography; MR, magnetic resonance; STIR, short-tau inversion-recovery. |
Not infrequently, osteolytic lesions present destruction of cortical bone with an associated soft tissue component. When located in the spine, these lesions may extend to the epidural space and compress the spinal cord and nerve roots, which can be well assessed by the sequences in the sagittal plane presented in the whole-body MR protocol. Furthermore, pathological fractures resulting from metastatic lesions may lead to the collapse of vertebral bodies, resulting in retropulsion of its posterior wall and compression of the dural sac or spinal cord along with neurological symptoms; in this regard, MR helps to distinguish different fractures due to benign diseases and malignant ones.16
Osteoblastic metastases exhibit hypointense signal in T1, T2, and STIR, and those presenting viable tumor tissue typically have a halo of hyperintense signal in STIR and diffusion sequences, which can be used to differentiate these lesions from bony islands.15 This occurs because, histologically, the neoplastic cells predominate in the periphery of the lesion along with osteoclasts that are activated to destroy the surrounding bone and, thus, enable tumor growth.
Evaluation of lymph node metastases
Whole-body MR may also be used to evaluate lymph node involvement of the thoracic segment by breast neoplasm, including the axillary, internal thoracic, mediastinal, and supraclavicular and infraclavicular chains,2 as well as lymph nodes in other areas of the body, including the abdominal chains.
The most used parameter still today is the lymph node size – particularly the dimension of the short axis – and morphology, since reactive benign lymph nodes may also show restricted diffusion.8,11 However, a recent prostate cancer study has demonstrated that the sensitivity of MR in detecting suspicious lymph nodes may increase significantly up to 84%, with a specificity of 89% when a set of alterations are considered simultaneously, namely the node’s short axis dimension, loss of fatty hilum, loss of the characteristic oval shape (becoming round), irregular contour, and presence of restricted diffusion.17 Other authors assert that these same morphologic criteria may be used to assess nodal disease in patients with breast cancer,2 as shown in Figure 4.
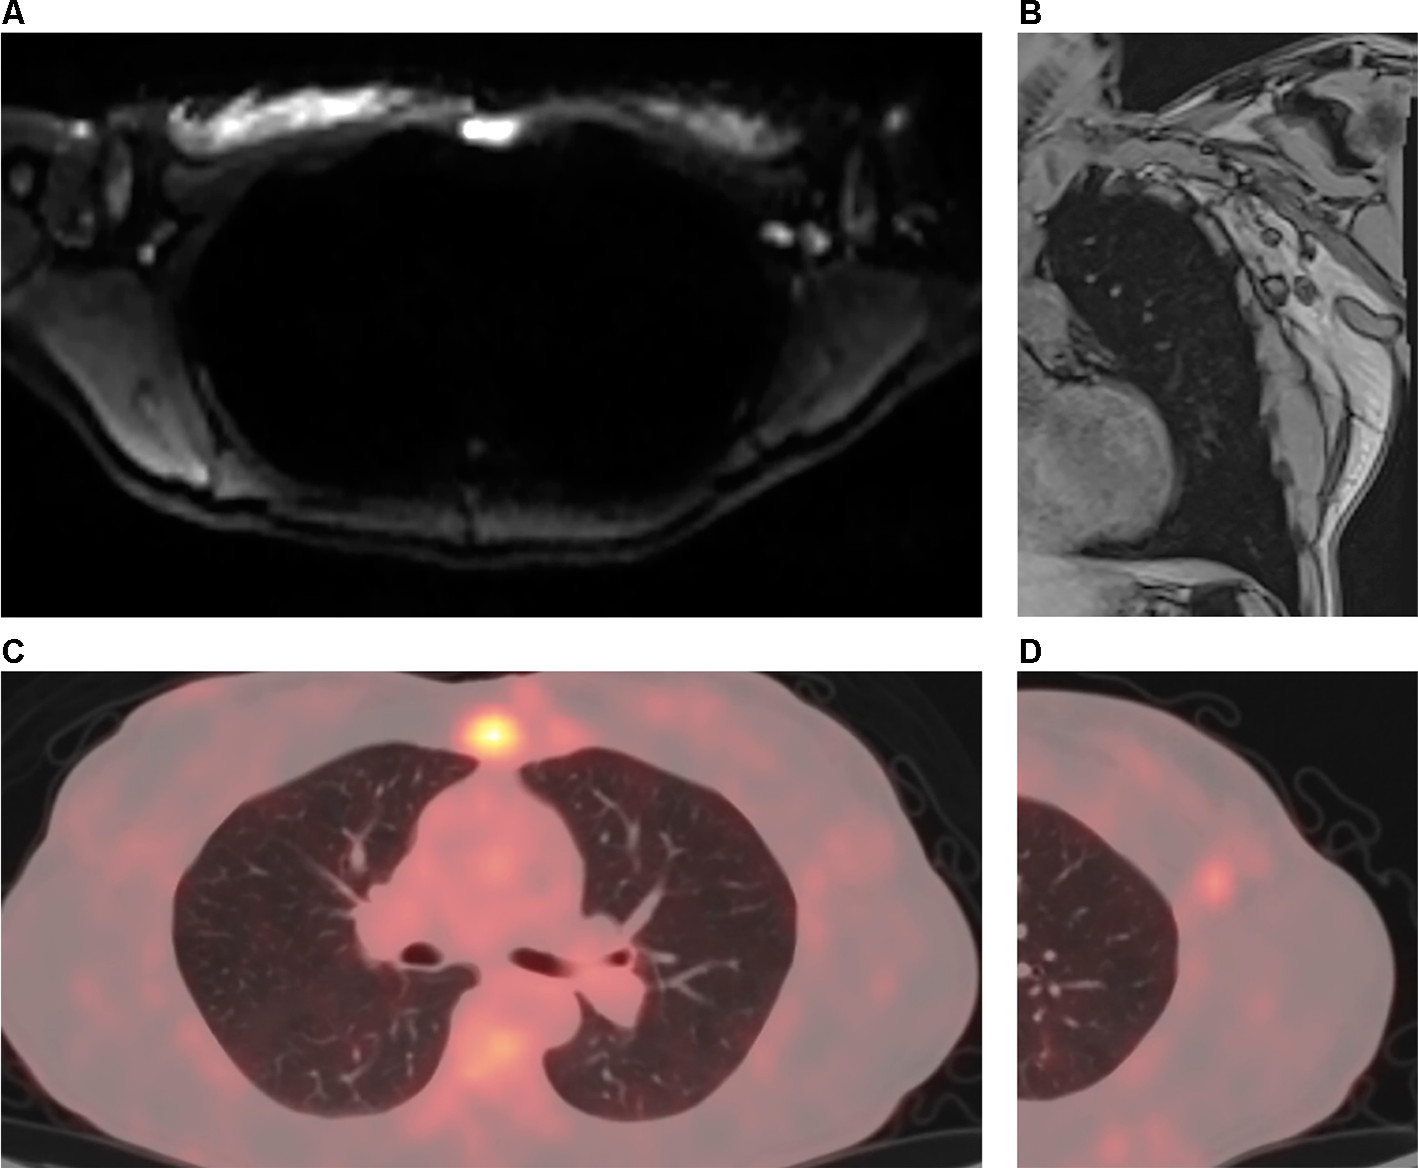 | Figure 4 A 37-year-old female patient with left breast cancer and pain on breathing underwent investigation with whole-body MR and PET/CT. Notes: Axial diffusion-weighted imaging (b800) in standard grayscale (A) shows a lesion with restricted diffusion in the sternum and enlarged axillary lymph nodes on the left, indicating secondary nodal and bone involvement. Coronal T1 out-of-phase sequence (B) shows enlargement of lymph nodes in the left axillary chain, one of which with loss of fatty hilum, also showing an adjacent round lymph node. PET/CT with a fusion of anatomical and functional images in the axial plane (C) showing increased FDG uptake in the body of the sternum, and magnified image at the left axillary level (D) showing lymph node with secondary neoplastic involvement presenting hypermetabolism. Abbreviations: CT, computed tomography; FDG, fluorodeoxyglucose; MR, magnetic resonance; PET, positron emission tomography. |
Lymph nodes with secondary involvement can present an ADC value lower than that of reactional lymph nodes, but this finding is not widely supported in the literature, since the values of benign and malignant lesions may overlap.8,11
Evaluation of visceral metastases
Whole-body MR also plays a role in the detection of secondary visceral involvement. Liver involvement is quite common in patients with breast cancer, and minor hepatic metastases may be detected by MR using diffusion-weighted sequences even before they appear in other sequences. MR is the best imaging modality to detect secondary hepatic tumors18 (Figure 5).
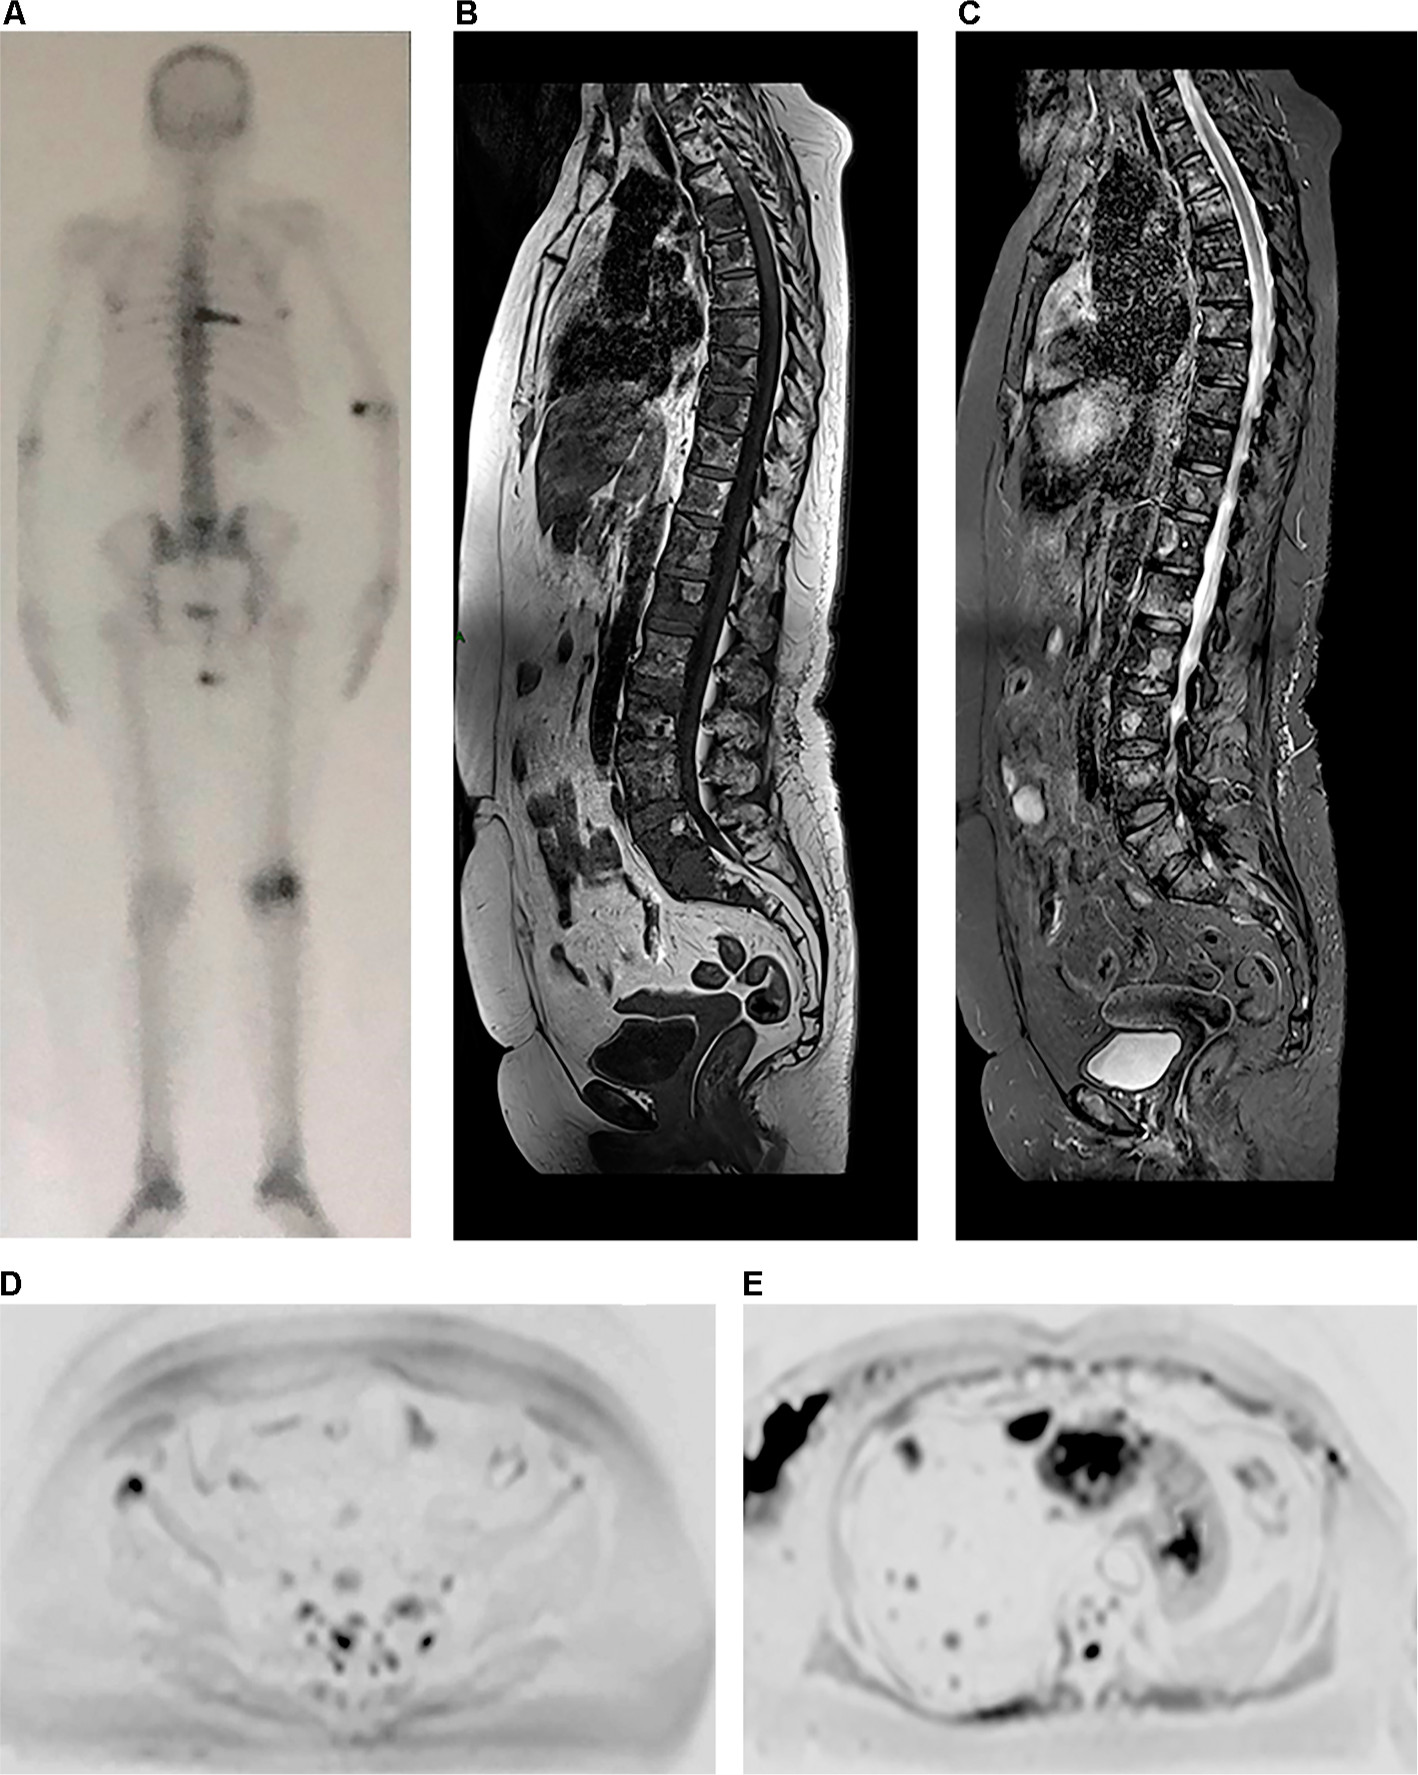 | Figure 5 A 64-year-old female patient with a diagnosis of breast cancer, undergoing hormone therapy and with a complaint of bone pain. Notes: Bone scintigraphy (A) shows increased uptake of technetium-99m in some vertebral bodies and in a left costal arch, which was suspicious for metastatic disease, as well as increased uptake in left femoral condyles, probably due to gonarthrosis. Whole-body MR performed at the same time shows secondary cancer diffusely distributed in the vertebral column in sagittal T1 and STIR sequences (B and C), more clearly defined than those shown on scintigraphy, as well as metastatic focus in the right ilium, which is observed in diffusion-weighted sequence (b800) in inverted grayscale in the axial plane (D) and was not detected by scintigraphy. Multiple hepatic metastases in the same diffusion-weighted sequence (E) are also observed. Abbreviations: MR, magnetic resonance; STIR, short-tau inversion-recovery. |
Secondary hepatic lesions appear with a hypointense signal in T1 and hyperintense signal in T2 and STIR. As stated above, the protocol usually eliminates the need for intravenous gadolinium, but if this contrast medium is used, the hepatic metastases may appear as hypovascular or hypervascular lesions.19
Another site frequently affected by breast cancer metastases are the lungs. With increasing spatial and temporal whole-body MR resolution, these metastases may be seen as foci of diffusion restriction.
Cerebral involvement by breast cancer metastases is also frequent, and MR is the most appropriate imaging method to detect these metastases.18 A protocol combining fluid-attenuated inversion-recovery and diffusion sequences is able to detect some secondary tumors in the skull and brain (Figure 6), but tiny metastatic foci in the brain, as well as meningeal carcinomatosis, may only be detected with the use of intravenous contrast media in a dedicated MR examination of this region.7
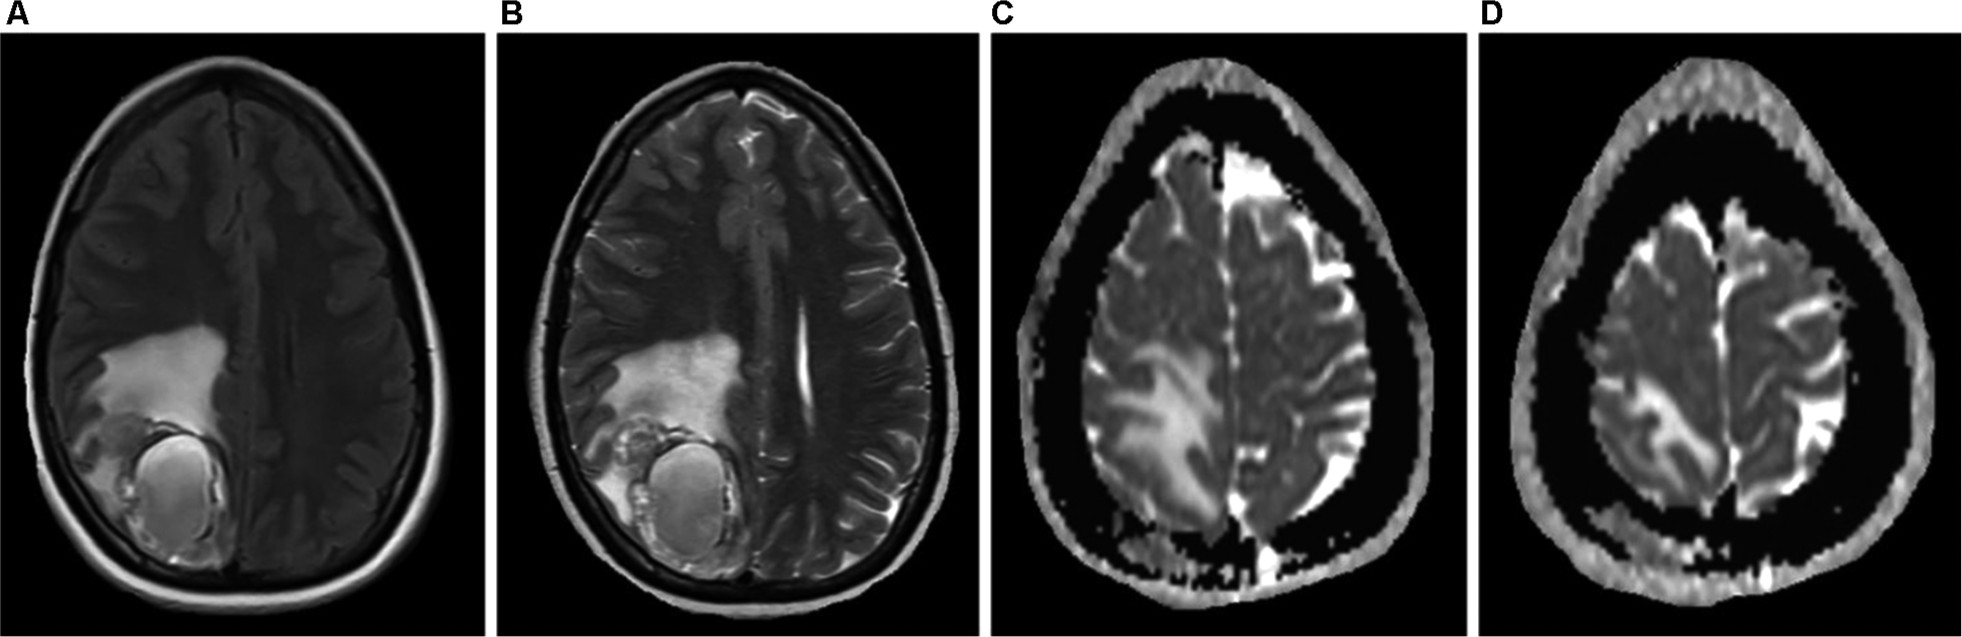 | Figure 6 A 24-year-old female patient diagnosed with ER-positive, PR-positive, HER2-negative invasive ductal carcinoma of the left breast, with a complaint of headache. Notes: The skull station in the FLAIR and T2 sequences in the axial plane (A and B) shows an expansive, heterogeneous lesion with solid peripheral areas and a central cystic/hemorrhagic portion, associated with perilesional edema, located in the parietal lobe. Brain metastases of breast and lung cancers may display areas of cystic degeneration, as in this case. ADC map in the axial plane (C and D) also demonstrates a metastatic lesion with diffusion restriction in right parietal bone. Abbreviations: ADC, apparent diffusion coefficient; FLAIR, fluid-attenuated inversion-recovery. |
Assessment of therapeutic response
In order to evaluate follow-up changes in whole-body MR images, the radiologist must have extensive knowledge of the several treatments administered to the patient and their mechanisms of action, particularly on the bone marrow.
When the treatment response is satisfactory, the expected change is an increase in ADC value, which will be higher or lower depending on the type of administered therapy.20 Lesions without an adequate response will remain with diffusion restriction and low ADC values (Figure 2).
Chemotherapy leads to cell death by inducing necrosis and destruction of a large number of cells, which consequently results in increased free water and high ADC values21 (Figure 2). The ADC values begin to increase 4–11 days after chemotherapy initiation in hepatic metastasis of breast cancer,11 and an approximately 2- to 3-month wait is recommended for an evaluation of the progression by MR.13,22 The chemotherapy leads to increased water content in the bone marrow, observed as hypointense signal on T1 sequences and hyperintense signal in STIR (known as “pseudoprogression phenomenon”); therefore, a combined assessment with diffusion-weighted sequence images is fundamental to avoid an erroneous interpretation of disease progression,13 as shown in Figure 7.
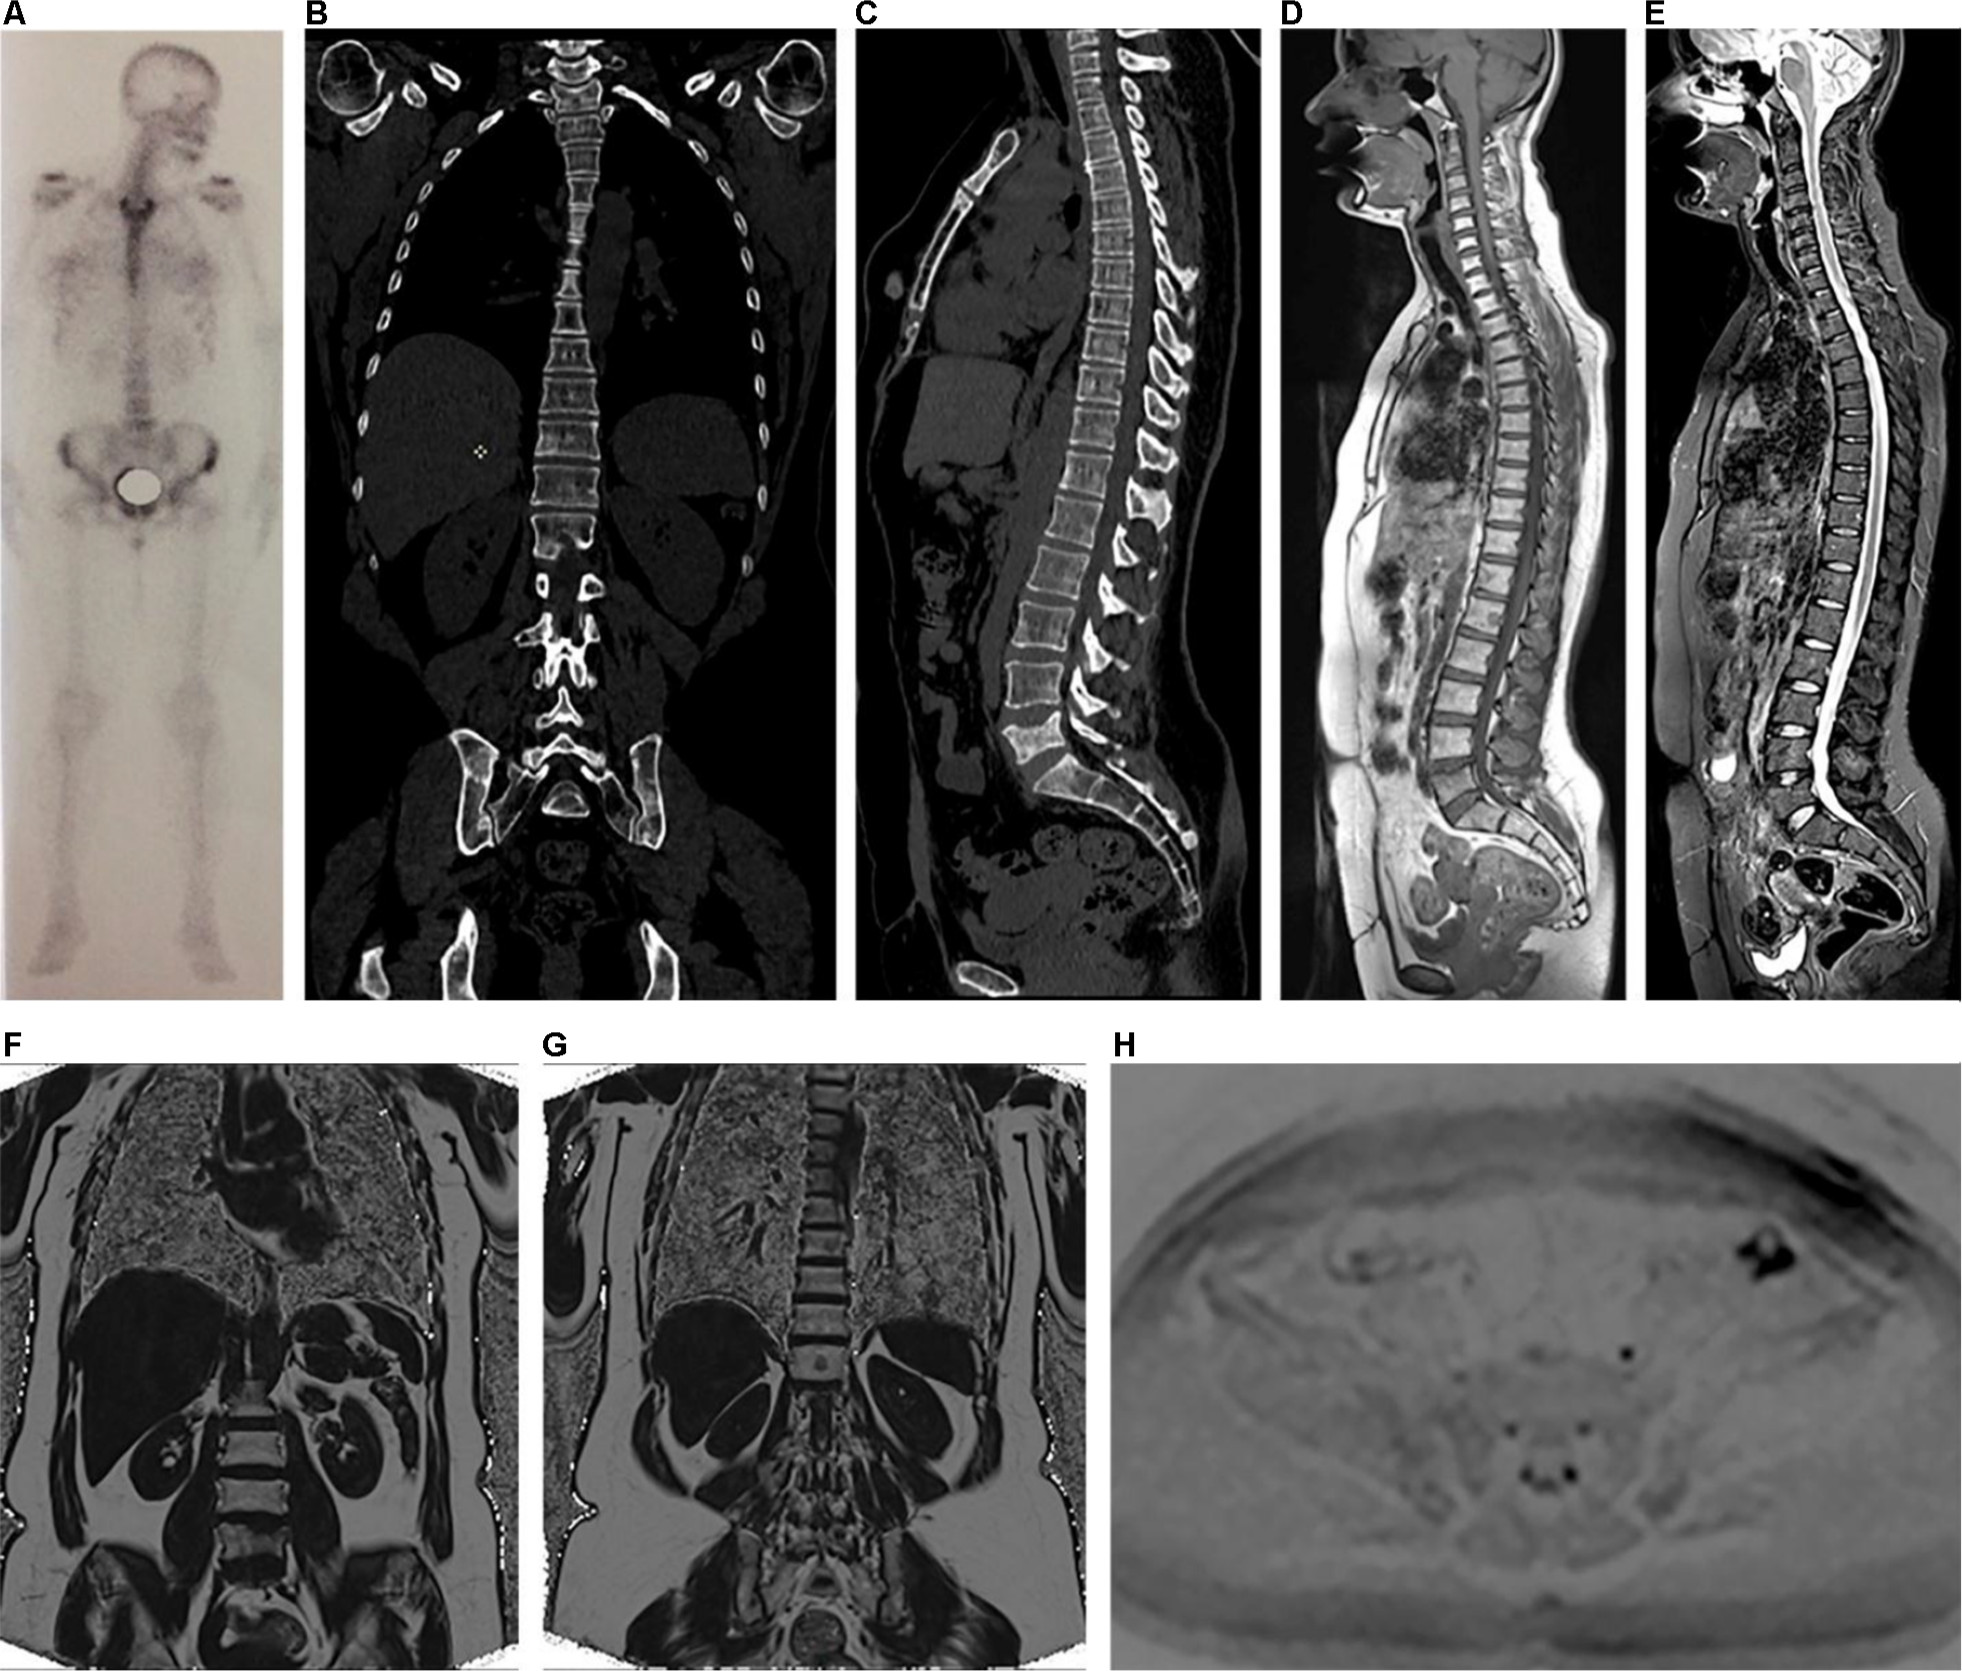
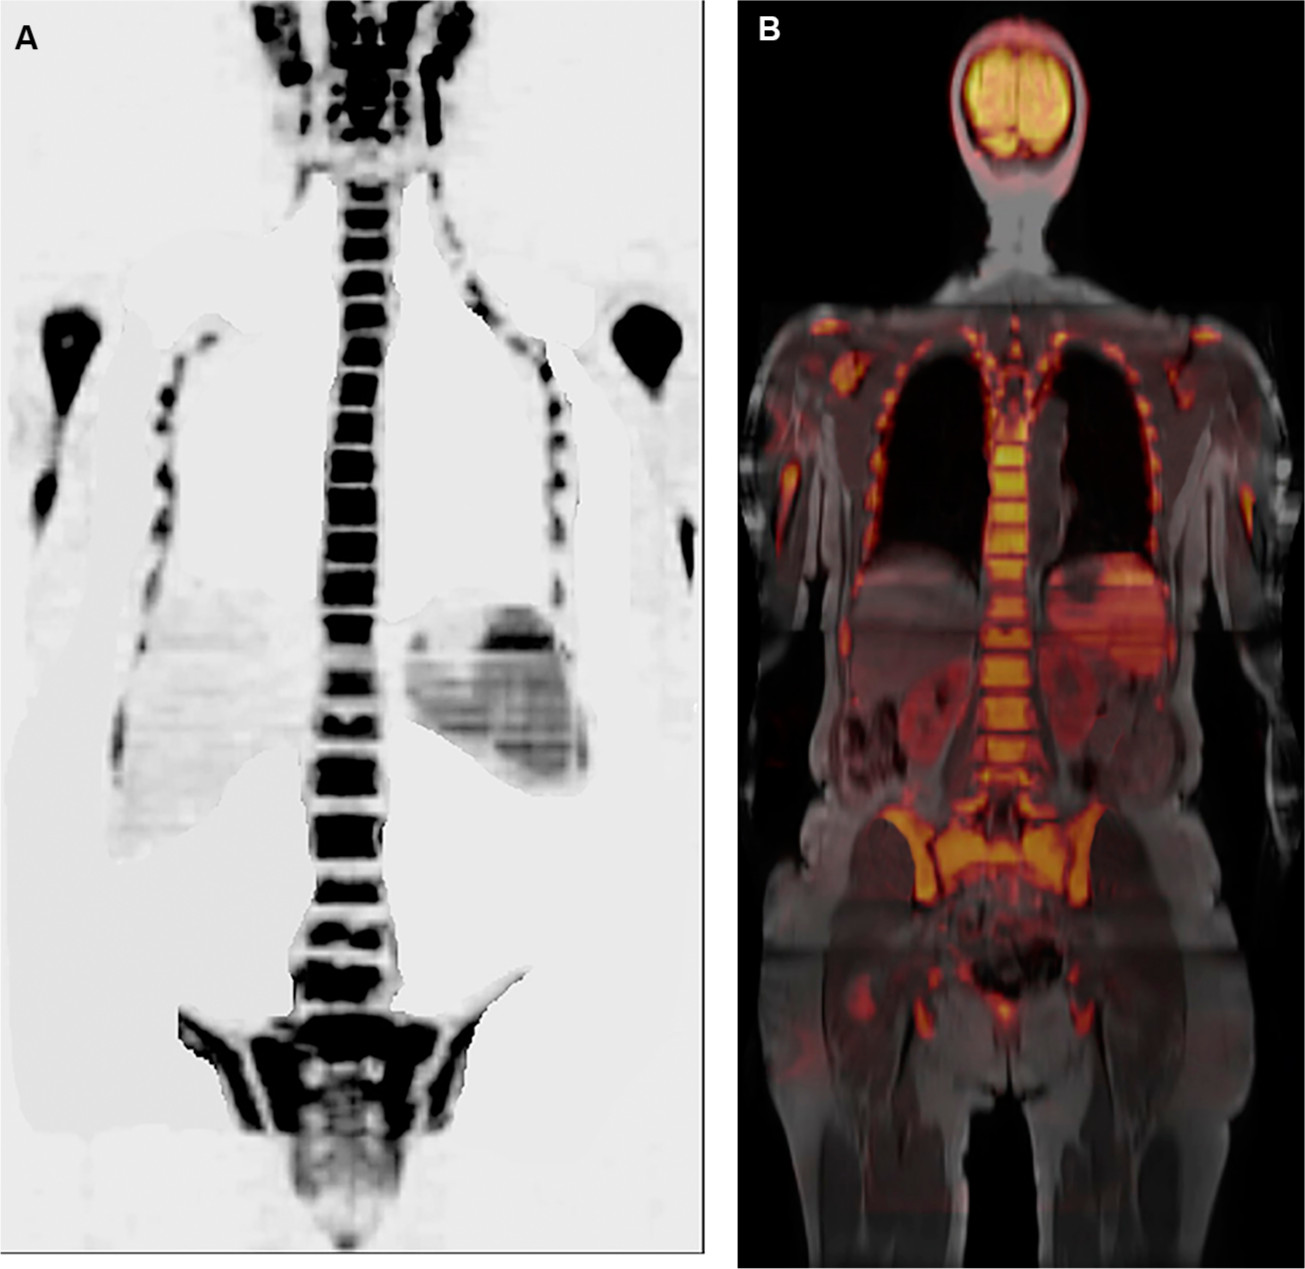
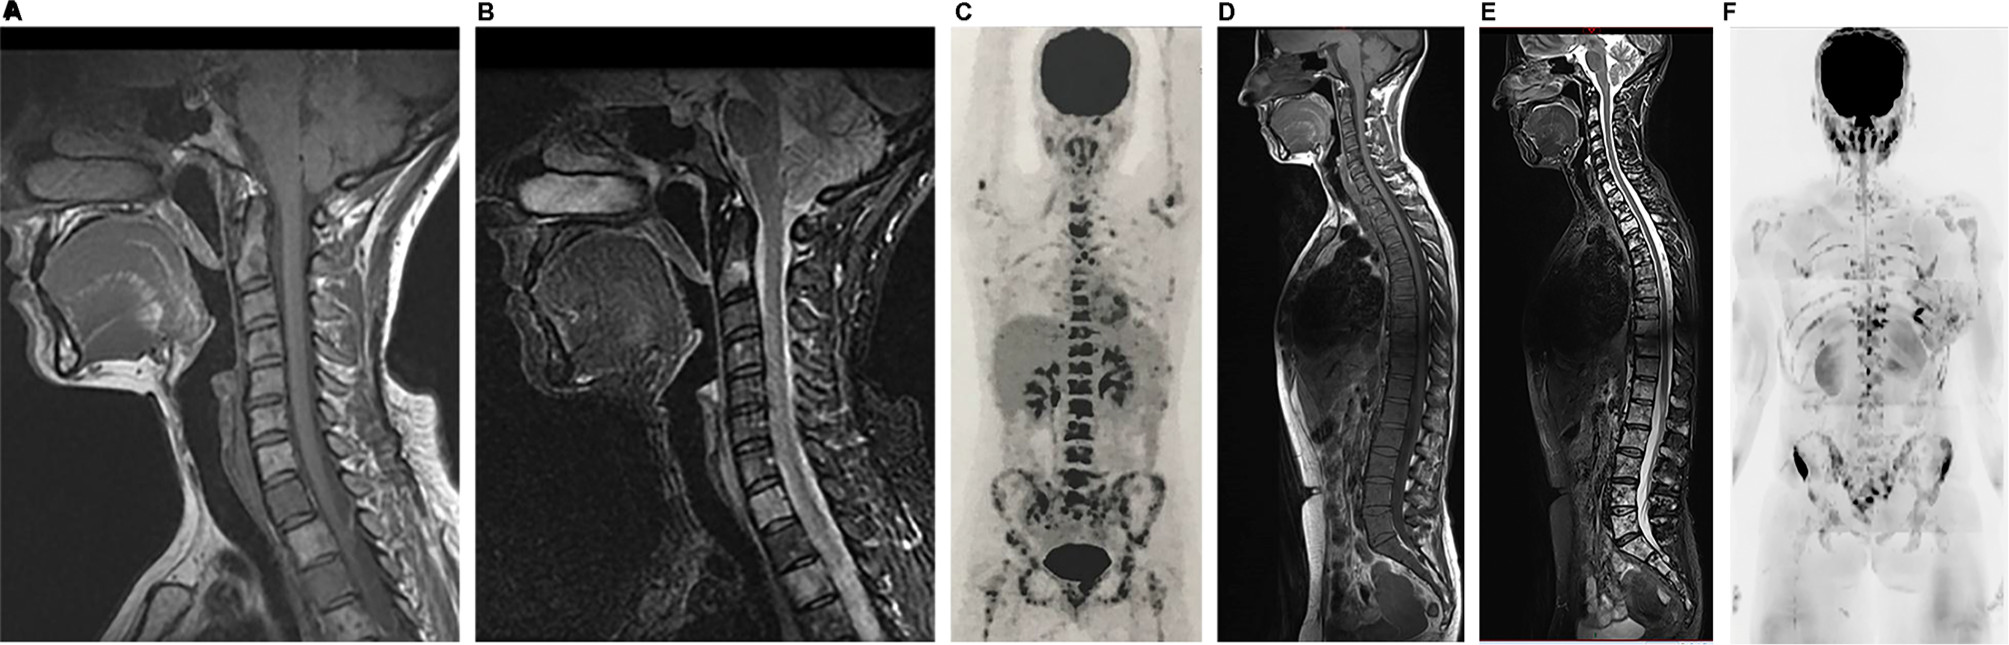 | Figure 7 A 56-year-old female patient with a diagnosis of ER-positive, PR-positive, and HER2-negative invasive ductal carcinoma, undergoing treatment with anthracycline, cyclophosphamide, and tamoxifen. Notes: On the first evaluation in March 2017, cervical spine MR with sagittal T1 and STIR sequences (A and B) show several bone lesions suggestive of metastases along this spine segment. A PET/CT performed in April 2017 showed numerous lesions in axial and proximal appendicular skeletons (C). Based on the PET/CT result, treatment with an aromatase inhibitor, bisphosphonate (zoledronic acid), and target therapy with denosumab was initiated. In June 2017, the patient underwent whole-body MR (D–F). A follow-up analysis based on sagittal T1 sequences alone (A and D) yielded a false interpretation of disease progression due to a lower signal in the bone marrow (E). However, an evaluation of (E) along with the diffusion-weighted sequence (b800) with reformatted MIP in inverted grayscale (F) shows that the latter has no signs of viable tumor tissue in the cervical spine; also, in comparison with the PET/CT images, the number of bone lesions is substantially lower, suggesting a partial response. In other words, a pattern of pseudoprogression is suggested if the T1-weighted sequences are considered alone. Abbreviations: CT, computed tomography; FDG, fluorodeoxyglucose; MIP, maximum intensity projection; MR, magnetic resonance; PET, positron emission tomography; STIR, short-tau inversion-recovery. |
Hormone therapy, in turn, determines cell death secondary to apoptosis, with the modest destruction of the number of cells and a consequent slight increase in ADC values.9,21 Response assessment after multiple types of therapies is shown in Figure 3.
Within the evaluation of the diffusion-weighted sequences, the advances in software applications have allowed the analysis of the ADC by histograms and quantification of tumor volume. Histogram analysis allows quantitative and qualitative assessments of progressive changes in ADC values along treatment, performed at bone sites with secondary involvement. The distribution of the histogram of ADC values is transformed into a graph yielding pre-treatment and post-treatment curves.8,9,23 This analysis has been used in research protocols by Padhani et al23 and can be divided into three ADC tracks: the higher range is considered as a response with tissue necrosis (highly probable response to the treatment), the intermediate range is probably due to microscopic cellular necrosis (likely response), and the lower range is viable tumor tissue (absence of response).20,23 The illustrative diagram in Figure 8 shows how this analysis may be performed.
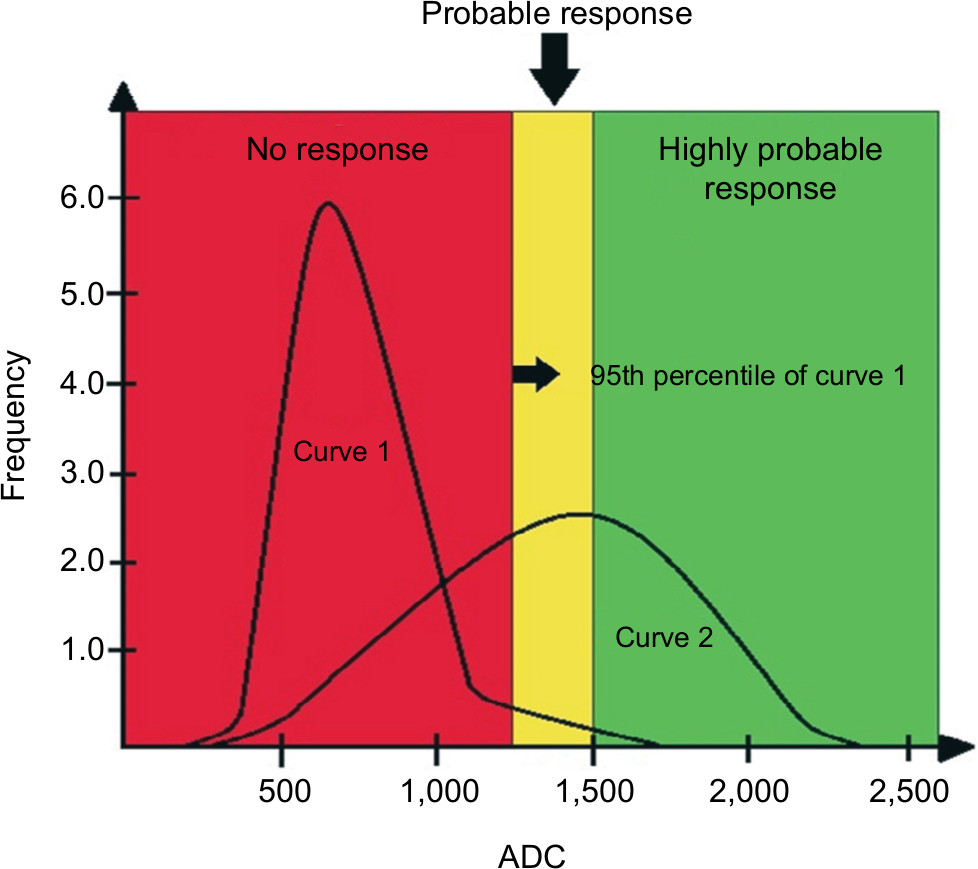 | Figure 8 Illustrative diagram showing curves of hypothetical histogram analysis before treatment (Curve 1) and after treatment (Curve 2), the latter showing a partial therapeutic response. Notes: The curves are divided into three tracks: one above 1,500 µm2/s, another between 1,500 µm2/s and the 95th percentile of the baseline (pre-treatment) curve, and the third one below the 95th percentile. The range above 1,500 µm2/s is considered as a response with tissue necrosis (highly probable response to the treatment), the intermediate range as microscopic cellular necrosis (likely response), and the range below the 95th percentile as viable tumor tissue (absence of response). The red area under Curve 2 corresponds to pixels of metastatic lesions without response to the administered treatment, ie, with viable neoplastic tissue. The yellow and green areas under Curve 2 correspond to pixels of metastatic lesions with a likely and highly likely response, respectively. Abbreviation: ADC, apparent diffusion coefficient. |
Using a program for tumor volume quantification, it is possible to highlight areas of secondary neoplastic involvement based on preselected ADC values to obtain the tumor volume. Serial whole-body MR scans allow the evaluation of the degree of therapeutic response according to a comparative measure of the tumor volume before and after treatment (reduction, stability, or increase).12,24
T1-Dixon sequences yield in-phase, opposed-phase, water-only, and fat-only images and allow the calculation of the fat-fraction map. An ROI placed on any area of interest allows the calculation of the fat-fraction signal (in %) within the studied area. This calculation is often used to evaluate the therapeutic response.
Treatment-naïve lesions feature a very low fat fraction. Serial evaluations along the treatment demonstrate that the interior of metastatic lesions with favorable therapeutic response exhibit a higher percentage of fat, once areas without viable neoplastic tissue are gradually replaced by yellow marrow13 (Figure 9). The degree of fatty infiltration is directly related to the therapeutic success, ie, lesions with a complete response may be entirely replaced by fat.25 This sequence has been useful when used in a standardized manner as one of the criteria to assess treatment response in some types of cancers,5 which can be extended to bone metastasis from breast cancer.13
 | Figure 9 A 50-year-old female patient diagnosed with breast cancer, undergoing treatment with anastrozole and bisphosphonate. Evaluation performed in February 2017 after treatment initiation. Notes: T1-Dixon sequence with fat-fraction map showing a heterogeneous response in the same patient. Metastatic lesions are shown in the dorsal spine, which did not respond to treatment in (A) and (B), while other metastases in the lumbar spine had a good response in (C) and (D). |
Therefore, the fat-fraction map in combination with diffusion-weighted sequences may be useful in the evaluation of treatment response in bone metastases, guiding both the individual therapeutic strategic planning, as well as signaling for its modification when necessary.
Evaluation of post-treatment bone marrow changes
Changes after radiotherapy
Post-actinic acute changes begin to occur approximately 1–2 weeks after radiotherapy and are characterized by reduced cellularity and increased bone marrow edema, with a notable hyperintense signal in STIR in the radiated area. Chronic post-actinic alterations are observed after 3–7 weeks, with a marked fat replacement of the bone marrow, characterized by yellow marrow with a homogeneous hyperintense signal on T1 sequences respecting the limits of the range of irradiated bone15 (Figure 10).
 | Figure 10 A 60-year-old female patient diagnosed with an ER-positive, HER2-negative infiltrating lobular breast carcinoma underwent quadrantectomy and axillary dissection in 2009. Notes: The patient underwent four cycles of chemotherapy, 35 cycles of radiotherapy, and was treated with an aromatase inhibitor for 5 years. In 2015, she was diagnosed with metastasis to the vertebral spine, was treated with a bisphosphonate, and underwent radiotherapy. In 2016, she received another cycle of radiotherapy delivered to the vertebral spine. Sagittal T1 sequence (A) shows multiple hypointense lesions in the vertebral spine, which are hyperintense in the sagittal STIR sequence (B). Diffusion-weighted sequence (b800) in inverted grayscale in the axial plane (C and D) showing the lesions as foci of diffusion restriction in the sacrum and ilium (D). Axial ADC map (E and F) shows low signal intensity in these lesions (F), suggesting viable tumor tissue. In (A), the dorsal spine presents homogeneous fat replacement in the bone marrow, limited to the area irradiated during treatment, an example of late post-actinic change. Abbreviations: ADC, apparent diffusion coefficient; STIR, short-tau inversion-recovery. |
Changes after chemotherapy and hormone therapy
In the acute phase after chemotherapy, there is decreased T1 signal and increased STIR signal due to bone marrow congestion. After 3–4 weeks of chemotherapy, a phenomenon of reconversion of yellow marrow into hematopoietic marrow occurs. After the end of the chemotherapy, there is a reduction in hematopoietic marrow and predominance of yellow marrow.15 Hormone therapy with aromatase inhibitors in postmenopausal women and ovarian failure induced by chemotherapy treatment may lead to osteoporosis and increased risk of fracture, including fractures due to sacral wing insufficiency, a frequent differential diagnosis in sacrum metastases. Diffusion-weighted sequence MR is able to discriminate between these two alterations.15
Bisphosphonates and jaw osteonecrosis
Bisphosphonates are widely used in patients with breast cancer and osteolytic metastases, acting directly or indirectly on osteoclasts and osteoblasts, leading to reduced bone remodeling, in addition to presenting inhibitory effects on inflammatory mediators, which may influence the healing process in bone lesions. They are also used in the treatment of bone pain and osteoporosis, which are often associated in these patients.
The medical literature shows a wide relationship between the use of bisphosphonates and the occurrence of jaw osteonecrosis. This complication is usually painful, is preceded by a dental procedure in 60% of the cases, and has as possible causal factors the suppression of bone turnover and the antiangiogenic effects of the bisphosphonates.15,26,27 On MR, jaw osteonecrosis appears as areas with hypointense signal in T1 and hyperintense signal in STIR, affecting the alveolar processes and, sometimes, the mandibular rami.28,29
Granulocyte colony-stimulating factor and bone marrow hyperplasia
In diffusion-weighted sequences, the bone marrow has its own characteristics, which vary according to the age of the patient. The yellow marrow has a low water content (10%–20%), reducing its signal in diffusion-weighted sequences with high b values (b800). In contrast, the red marrow has increased cellularity and water content (40%–60%), which causes a high signal in diffusion-weighted images. The normal distribution of bone marrow becomes stable after the age of 25 years, with the red marrow predominating in the axial skeleton and the yellow marrow in the appendicular skeleton. Variable degrees of red marrow atrophy and loss of trabecular bone occur after the age of 40 years, especially in women, possibly related to deficient estrogen and osteoporosis, increasing the adiposity of the bone marrow and, thus, reducing its signal in diffusion-weighted sequences.11,22
Granulocyte colony-stimulating factor (G-CSF) is administered to some patients during treatment of breast neoplasm to stimulate the hematopoietic marrow. Marrow hyperplasia is a complicating factor in the interpretation of imaging, since it may simulate diffuse neoplastic infiltration by the absence of signal decrease in the bone marrow out-of-phase T1 sequence in relation to the in-phase sequence, thus generating a false-positive result, or it may obscure the presence of small bone metastases, leading to a false-negative result. Even the ADC values may be altered by hyperplasia and should be interpreted with caution in these cases.11,15,22 This alteration in the diffusion-weighted sequence is due to the increase of both cellularity and water in the spinal cord and emerges within 2 weeks after the first G-CSF dose22 (Figure 11).
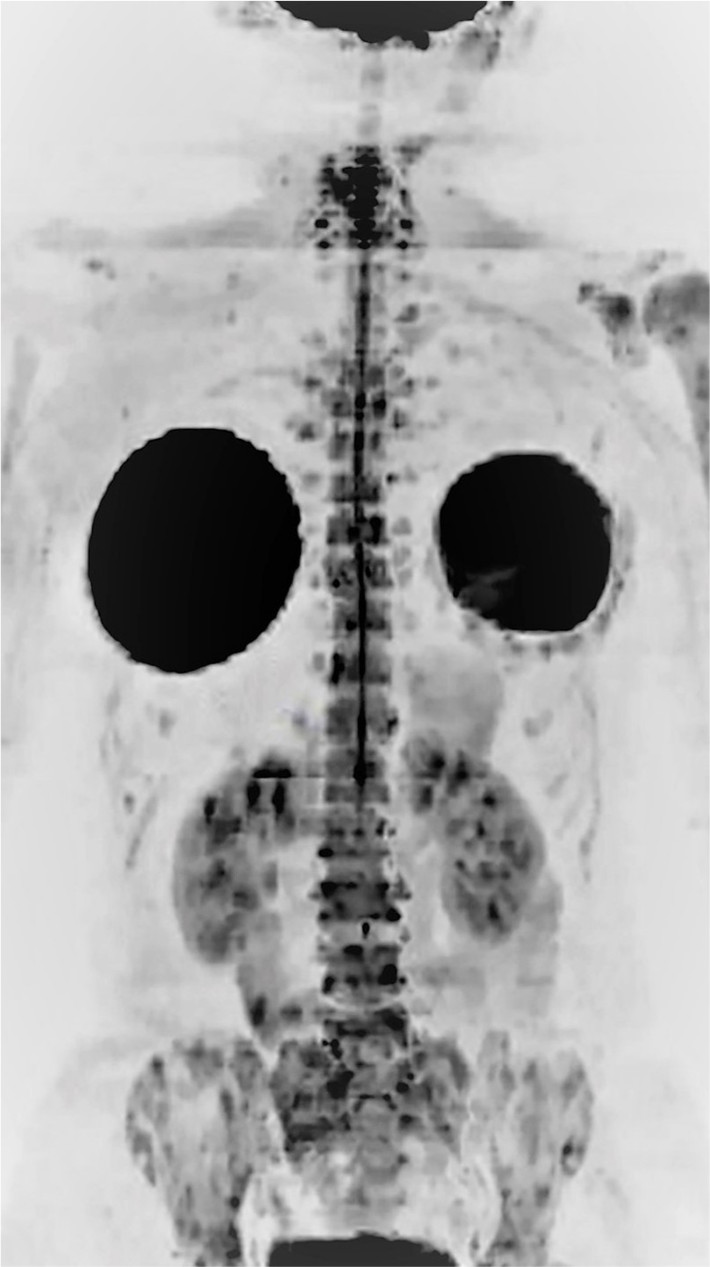
 | Figure 11 A 71-year-old female patient, undergoing treatment with G-CSF, underwent whole-body MR with diffusion-weighted images (b800) with three-dimensional reformatted MIP in inverted grayscale in the coronal plane (A) and post-processing with fusion of in-phase T1 sequence and b800 diffusion-weighted sequence in the coronal plane (B) showing diffuse hyperplasia of the hematopoietic marrow secondary to the use of G-CSF, characterized by extensive diffusion restriction in bone structures. Note: The spleen and salivary glands have restricted diffusion even in the absence of disease, as shown. Abbreviations: G-CSF, granulocyte colony-stimulating factor; MIP, maximum intensity projection; MR, magnetic resonance. |
PET/CT may also show increased fluorodeoxyglucose (FDG) uptake in the hyperplastic marrow, often hindering the interpretation in these cases; therefore, a 3-week wait is recommended after the conclusion of the G-CSF treatment before PET/CT is performed in these patients.30 This PET/CT abnormality, known as flare phenomenon, also occurs in other situations during breast cancer treatment, including 7–10 days after initiation of tamoxifen/fulvestrant administration.13,22
The best way to discriminate between tumor infiltration and hematopoietic marrow hyperplasia is to evaluate with whole-body MR the progression of the lesion after the end of G-CSF therapy, with some centers waiting up to 3 months after the conclusion of the therapy to repeat the scan, although the literature reports bone marrow alterations with restricted diffusion even 6 months after cyclic administration of G-CSF.8
Evaluation of post-treatment changes in other organs
Some drugs used in the treatment of breast cancer, such as tamoxifen, may cause steatosis,18 which may hinder the detection of hepatic metastases by ultrasonography or CT without intravenous contrast media, making the MR evaluation also a good choice in these cases.
Comparison between different imaging modalities in staging and follow-up
Yang et al14 conducted a meta-analysis of studies in various types of neoplasms, including breast cancer, and demonstrated that whole-body MR and PET/CT were superior to CT and bone scintigraphy in terms of sensitivity and specificity to detect bone metastases. According to this meta-analysis, the sensitivity rates for PET/CT, CT, MR, and bone scintigraphy were 89.7%, 72.9%, 90.6%, and 86.0%, respectively, and the specificity rates were 96.8%, 94.8%, 95.4%, and 81.4%, respectively. This higher accuracy may even be useful in defining a more appropriate prognosis for each patient.
Each one of these imaging modalities evaluates different but not always coincident aspects of tumor lesions: bone scintigraphy assesses bone remodeling and osteoblastic activity, CT shows bone destruction and presence of sclerosis (therapeutic or blastic lesions), MR assesses hypercellularity, and PET/CT with FDG evaluates increased glycolytic metabolism.12
Bone scintigraphy has a poor performance in detecting lytic lesions, metastases with low turnover, and metastatic foci in poorly vascularized sites, but is able to show osteoblastic lesions and areas of bone remodeling due to therapeutic response, which presents as increased radiotracer uptake (99mTc-MDP).12,16
In contrast, CT has the ability to demonstrate lytic lesions in the presence of bone destruction. Prior to the destruction, secondary tumors infiltrate the bone marrow and are not adequately demonstrated by this imaging modality.12
Due to the great technological advance of imaging methods, MR of the axial skeleton, whole-body MR, or PET/CT is recommended by some authors as first-choice imaging modalities for initial bone staging in patients with breast cancer, while bone scintigraphy is a second-line method in these cases.12
Evaluation of active osteoblastic metastases is still challenging for current imaging methods. Bone scintigraphy shows a high sensitivity for the detection of blastic lesions but lacks specificity; it also has low sensitivity for lesions that are mainly lytic, as explained above.12 In contrast, PET/CT and MR have limitations in the assessment of purely blastic metastases.11
The progression of bone metastases in patients with advanced breast cancer must be evaluated by MR rather than PET/CT or scintigraphy, according to recommendations by UK’s National Institute for Health and Care Excellence.4 This recommendation is based on the fact that MR allows serial analyses to be performed without the use of ionizing radiation, which is essential in these patients who undergo a great number of scans throughout life and considering that elevated cumulative doses of radiation are related to the risk of development of other cancers.8 Schmidt et al31 also found superior results with whole-body MR when compared with PET/CT in the detection of bone recurrence in breast cancer.
The presence of the flare phenomenon in bone scintigraphy, resulting from a response to treatment and increased bone remodeling, increasing the radiotracer uptake in these areas, usually persists for up to 3 months after treatment start, hindering the assessment with this imaging method.12,22 Another limiting factor associated with bone scintigraphy is the presence of a large number of lesions, resulting in a superscan pattern, which hinders a proper comparison with prior examinations.12 In terms of evaluation of response, bone scintigraphy is also limited by the fact that it only establishes two categories (progression or lack of progression), while PET/CT and MR offer a more detailed distinction, defining the following categories: partial response, complete response, stable disease, and progressive disease.12
CT is also inadequate for monitoring purposes because, in addition to using ionizing radiation and not detecting infiltrative lesions, the RECIST method used for CT monitoring has the limitation of considering bone secondary tumors as nonmeasurable lesions, preventing objective follow-up of these metastases.20
Another point to be considered in study series of patients with breast cancer is that the interpretation of emerging sclerotic areas in the skeleton may be a challenge, since these areas may represent disease progression due to blastic metastases or sclerosis by the response to treatment. This sclerosis secondary to therapeutic response is described by some authors as a CT flare response.32 The presence of a well-delimited rounded area with increased density (>800 HU) on CT is indicative of therapeutic sclerosis, although most lesions do not fit this profile. Serial whole-body MR scans can help evaluate the therapeutic response (Figure 3), since a progressive loss of the halo of hyperintense signal around blastic metastases, which is identified in STIR and diffusion sequence images prior to treatment, suggests a reduction in viable tumor tissue, which generally predominates in the periphery of sclerotic lesions and is one of the criteria adopted to indicate a good response to the administered treatment.13
Compared with whole-body MR, PET/CT seems to have an increased sensitivity for neoplastic axillary and mediastinal lymph nodes.31 However, due to heterogeneous hepatic FDG metabolism, whole-body MR also has greater sensitivity than PET/CT to evaluate small secondary tumors in the liver.31 MR is also superior to PET/CT and other modalities for the detection of metastatic brain lesions when a dedicated MR is done.18
There is still no consensus in the literature regarding the best method for detection of lung metastases. Some authors support PET/CT as currently superior,11 while for others, whole-body MR has a similar sensitivity to that of PET/CT to detect such lesions.31
It should also be emphasized that secondary tumors may have a distinct and heterogeneous behavior within the same patient, which occurs due to several mutations in different clonal cells, resulting, in some cases, in distinct responses to the same treatment (response heterogeneity), which may be more appropriately studied by whole-body MR or PET/CT than by other imaging modalities (Figures 2 and 9). In cases with response heterogeneity, whole-body MR may also guide the best sites with a viable tumor to be biopsied, and it can also help in the decision to change the therapy.
Artifacts, pitfalls, and disadvantages of whole-body MR
Some structures may naturally present with restricted diffusion, representing pitfalls during exam interpretation, including the salivary glands, lymph nodes, spleen, endometrium, and testis.8,10,11 In addition, different artifacts may appear on diffusion-weighted images, for example:
- “Ghosting artifacts” seen in the axial plane, generated by the presence of breast prostheses (Figure 12). These artifacts may be reduced if we use a larger field-of-view (FOV) in the image acquisition.
- “Broken spine”, visualized in diffusion-weighted with sagittal MIP reformatted images in b800 due to failed concatenation between different coil stations, which generates “steps” in the image8 (Figure 12), and the only possible way to minimize this artifact is the installation of new software versions in the computer of the scanner.
- Pulsation artifacts produced by the heart that can impair evaluation of the left liver lobe. A change in the phase direction during image acquisition can be done to mitigate these artifacts.
- Magnetic susceptibility artifacts caused by air inside the stomach or colon.10 Fasting may reduce these gases.
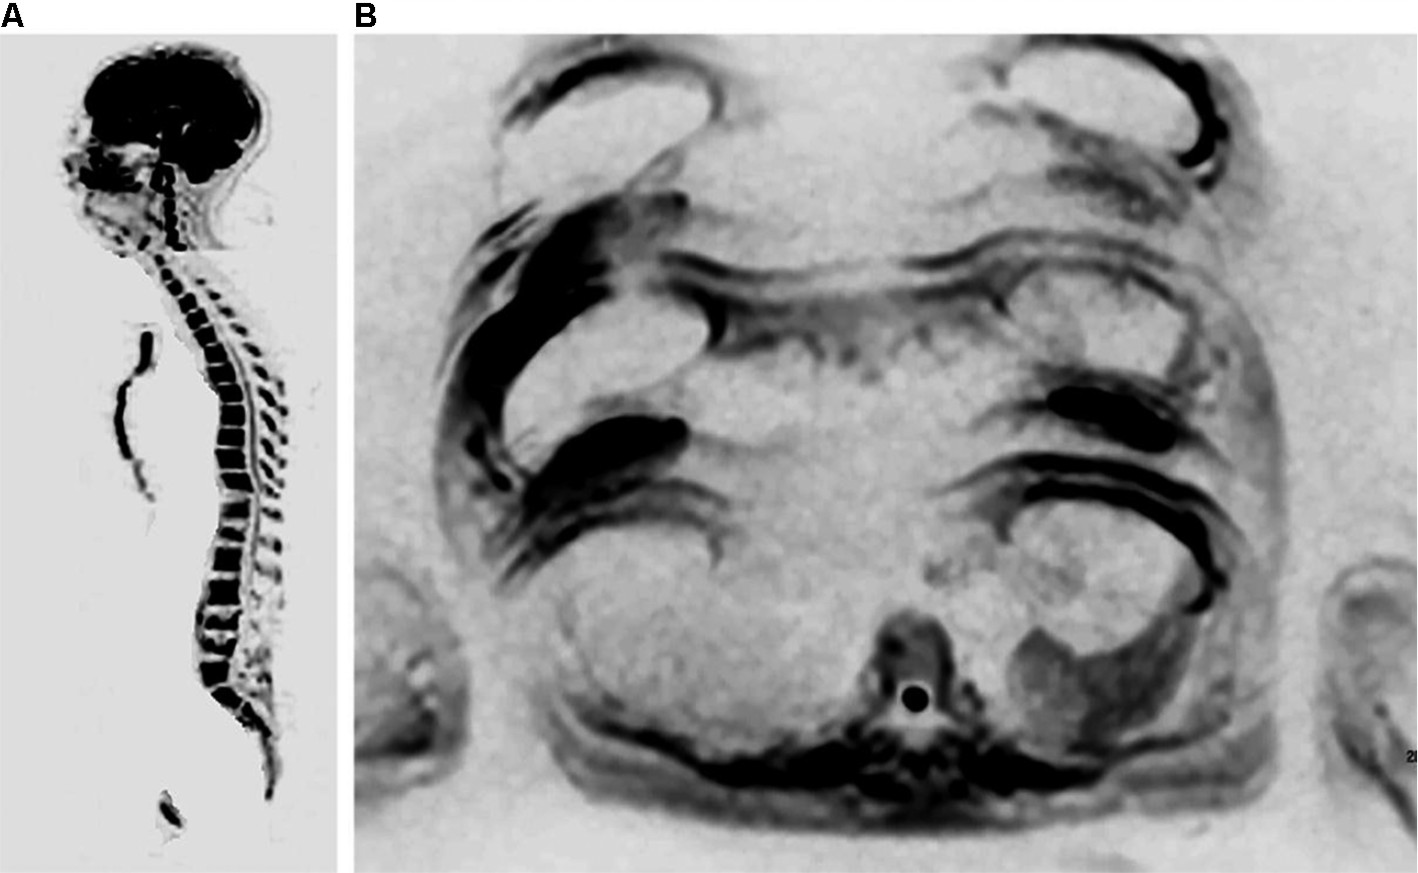 | Figure 12 Different artifacts may appear on diffusion-weighted images. Notes: (A) Whole-body MR with diffusion-weighted images (b800) with three-dimensional reformatted MIP in inverted grayscale in the sagittal plane of a 71-year-old female patient, undergoing treatment with G-CSF, displaying the broken spine artifact between head/neck and chest stations. There is also the collapse of some vertebral bodies caused by prior neoplastic involvement. In (B), whole-body MR with diffusion-weighted images (b800) with three-dimensional reformatted MIP in inverted grayscale in the axial plane of another 56-year-old female patient with a prior history of breast cancer, showing ghosting artifacts produced by the mammary prostheses. A metastatic focus with restricted diffusion was also observed in a vertebral body. Abbreviations: MIP, maximum intensity projection; MR, magnetic resonance. |
Whole-body MR also has some disadvantages, as its use is not indicated in patients with pacemakers, some types of cochlear implants and clips for brain aneurysm surgery, as well as claustrophobic patients and pregnant women in the first trimester. This imaging modality is suitable for children, as well as elderly and hospitalized patients with severe disease if they are able to stay immobile inside the scanner, but if they cannot, it is still possible to do the examination with sedation.
One major restriction of whole-body MR in hospitals and other centers is that most radiologists do not have enough expertise with this examination, because still today it is an imaging modality less common than other ones, such as radiography, CT scan, bone scintigraphy, and PET/CT.
Conclusion
Whole-body MR is an emerging method for the evaluation of patients with breast cancer. It is useful for early and accurate detection of the extent of disease, to monitor the response to treatment, and to evaluate post-therapeutic complications. It is also the best imaging modality to detect metastases in bone and liver, with a sensitivity and specificity similar to or even higher than that of PET/CT. The absence of ionizing radiation and intravenous contrast media make whole-body MR advantageous in relation to other diagnostic modalities, especially considering that the disease requires serial evaluations. Follow-up assessment with whole-body MR also allows the identification of the heterogeneous biological behavior of breast cancer.
Whole-body MR will certainly gain even more space in decision-making regarding the management of patients with various types of cancers, including breast cancer, emerging as a useful tool in therapeutic strategies of a precision medicine.
Acknowledgments
This article was completed without any external funding and the authors received no funding regarding this work.
Disclosure
The authors report no conflicts of interest in this work.
References
Instituto Nacional do Câncer [National Institute of Cancer]. Câncer; tipos de câncer: mama [Cancer; types of cancer: Breast]. Accessed January 1, 2018. Available at: http://www2.inca.gov.br/wps/wcm/connect/tiposdecancer/site/home/mama. Accessed November 12, 2018. Portuguese. | ||
Lee SC, Jain PA, Jethwa SC, Tripathy D, Yamashita MW. Radiologist’s role in breast cancer staging: providing key information for clinicians. Radiographics. 2014;34(2):330–342. | ||
Cardoso F, Costa A, Senkus E, et al. 3rd ESO-ESMO International Consensus Guidelines for Advanced Breast Cancer (ABC 3). Ann Oncol. 2017;28(12):3111. | ||
Mayor S. NICE updates guidance on early and advanced breast cancer. BMJ. 2009;338:b815. | ||
Padhani AR, Lecouvet FE, Tunariu N, et al. Metastasis reporting and data system for prostate cancer: practical guidelines for acquisition, interpretation, and reporting of whole-body magnetic resonance imaging-based evaluations of multiorgan involvement in advanced prostate cancer. Eur Urol. 2017;71(1):81–92. | ||
Moreau P, San Miguel J, Sonneveld P, et a; ESMO Guidelines Committee l. Multiple myeloma: ESMO Clinical Practice Guidelines for diagnosis, treatment and follow-up. Ann Oncol. 2017;28(suppl_4):iv52–iv61. | ||
Lecouvet FE. Whole-Body MR Imaging: musculoskeletal applications. Radiology. 2016;279(2):345–365. | ||
Koh DM, Blackledge M, Padhani AR, et al. Whole-body diffusion-weighted MRI: tips, tricks, and pitfalls. AJR Am J Roentgenol. 2012;199(2):252–262. | ||
Thoeny HC, Ross BD. Predicting and monitoring cancer treatment response with diffusion-weighted MRI. J Magn Reson Imaging. 2010;32(1):2–16. | ||
Koh DM, Collins DJ. Diffusion-weighted MRI in the body: applications and challenges in oncology. AJR Am J Roentgenol. 2007;188(6):1622–1635. | ||
Padhani AR, Koh DM, Collins DJ. Whole-body diffusion-weighted MR imaging in cancer: current status and research directions. Radiology. 2011;261(3):700–718. | ||
Lecouvet FE, Talbot JN, Messiou C, et al; EORTC Imaging Group. Monitoring the response of bone metastases to treatment with magnetic resonance imaging and nuclear medicine techniques: a review and position statement by the European Organisation for Research and Treatment of Cancer imaging group. Eur J Cancer. 2014;50(15):2519–2531. | ||
Woolf DK, Padhani AR, Makris A. Assessing response to treatment of bone metastases from breast cancer: what should be the standard of care? Ann Oncol. 2015;26(6):1048–1057. | ||
Yang HL, Liu T, Wang XM, Xu Y, Deng SM. Diagnosis of bone metastases: a meta-analysis comparing 18FDG PET, CT, MRI and bone scintigraphy. Eur Radiol. 2011;21(12):2604–2617. | ||
Hwang S, Panicek DM. Magnetic resonance imaging of bone marrow in oncology, Part 2. Skeletal Radiol. 2007;36(11):1017–1027. | ||
O’Sullivan GJ, Carty FL, Cronin CG. Imaging of bone metastasis: An update. World J Radiol. 2015;7(8):202–211. | ||
Vallini V, Ortori S, Boraschi P, et al. Staging of pelvic lymph nodes in patients with prostate cancer: usefulness of multiple b value SE-EPI diffusion-weighted imaging on a 3.0 T MR system. Eur J Radiol Open. 2016;3:16–21. | ||
Michaels AY, Keraliya AR, Tirumani SH, Shinagare AB, Ramaiya NH. Systemic treatment in breast cancer: a primer for radiologists. Insights Imaging. 2016;7(1):131–144. | ||
Braga L, Semelka RC, Pietrobon R, Martin D, de Barros N, Guller U. Does hypervascularity of liver metastases as detected on MRI predict disease progression in breast cancer patients? AJR Am J Roentgenol. 2004;182(5):1207–1213. | ||
Hamstra DA, Rehemtulla A, Ross BD. Diffusion magnetic resonance imaging: a biomarker for treatment response in oncology. J Clin Oncol. 2007;25(26):4104–4109. | ||
Figueiras RG, Padhani AR, Goh VJ, et al. Novel oncologic drugs: what they do and how they affect images. Radiographics. 2011;31(7):2059–2091. | ||
Padhani AR, Gogbashian A. Bony metastases: assessing response to therapy with whole-body diffusion MRI. Cancer Imaging. 2011;11(Spec No A):S129–S145. | ||
Padhani AR, Makris A, Gall P, Collins DJ, Tunariu N, de Bono JS. Therapy monitoring of skeletal metastases with whole-body diffusion MRI. J Magn Reson Imaging. 2014;39(5):1049–1078. | ||
Blackledge MD, Collins DJ, Tunariu N, et al. Assessment of treatment response by total tumor volume and global apparent diffusion coefficient using diffusion-weighted MRI in patients with metastatic bone disease: a feasibility study. PLoS One. 2014;9(4):e91779. | ||
Kosmin M, Makris A, Joshi PV, Ah-See ML, Woolf D, Padhani AR. The addition of whole-body magnetic resonance imaging to body computerised tomography alters treatment decisions in patients with metastatic breast cancer. Eur J Cancer. 2017;77:109–116. | ||
Woo SB, Hellstein JW, Kalmar JR. Narrative [corrected] review: bisphosphonates and osteonecrosis of the jaws. Ann Intern Med. 2006;144(10):753–761. | ||
Wood J, Bonjean K, Ruetz S, et al. Novel antiangiogenic effects of the bisphosphonate compound zoledronic acid. J Pharmacol Exp Ther. 2002;302(3):1055–1061. | ||
Chiandussi S, Biasotto M, Dore F, Cavalli F, Cova MA, Di Lenarda R. Clinical and diagnostic imaging of bisphosphonate-associated osteonecrosis of the jaws. Dentomaxillofac Radiol. 2006;35(4):236–243. | ||
García-Ferrer L, Bagán JV, Martínez-Sanjuan V, et al. MRI of mandibular osteonecrosis secondary to bisphosphonates. AJR Am J Roentgenol. 2008;190(4):949–955. | ||
Park SY, Yoo IR, Lee SY, Chung SK, Sohn HS. Effect of colony-stimulating factor on FDG uptake in bone marrow of patients with breast cancer. J Nucl Med. 2012;53(suppl 1):1123. | ||
Schmidt GP, Baur-Melnyk A, Haug A, et al. Comprehensive imaging of tumor recurrence in breast cancer patients using whole-body MRI at 1.5 and 3 T compared to FDG-PET-CT. Eur J Radiol. 2008;65(1):47–58. | ||
Messiou C, Cook G, Reid AH, et al. The CT flare response of metastatic bone disease in prostate cancer. Acta Radiol. 2011;52(5):557–561. |
 © 2018 The Author(s). This work is published and licensed by Dove Medical Press Limited. The full terms of this license are available at https://www.dovepress.com/terms.php and incorporate the Creative Commons Attribution - Non Commercial (unported, v3.0) License.
By accessing the work you hereby accept the Terms. Non-commercial uses of the work are permitted without any further permission from Dove Medical Press Limited, provided the work is properly attributed. For permission for commercial use of this work, please see paragraphs 4.2 and 5 of our Terms.
© 2018 The Author(s). This work is published and licensed by Dove Medical Press Limited. The full terms of this license are available at https://www.dovepress.com/terms.php and incorporate the Creative Commons Attribution - Non Commercial (unported, v3.0) License.
By accessing the work you hereby accept the Terms. Non-commercial uses of the work are permitted without any further permission from Dove Medical Press Limited, provided the work is properly attributed. For permission for commercial use of this work, please see paragraphs 4.2 and 5 of our Terms.