")
Back to Journals » Neuropsychiatric Disease and Treatment » Volume 13
Which psychological, psychophysiological, and anthropometric factors are connected with life events, depression, and quality of life in patients with cardiovascular disease
Authors Slepecky M, Kotianova A , Prasko J , Majercak I , Gyorgyova E, Kotian M, Zatkova M , Popelkova M, Ociskova M , Tonhajzerova I
Received 15 May 2017
Accepted for publication 15 June 2017
Published 4 August 2017 Volume 2017:13 Pages 2093—2104
DOI https://doi.org/10.2147/NDT.S141811
Checked for plagiarism Yes
Review by Single anonymous peer review
Peer reviewer comments 2
Editor who approved publication: Dr Roger Pinder
Milos Slepecky,1 Antonia Kotianova,1,2 Jan Prasko,1,3 Ivan Majercak,4,5 Erika Gyorgyova,5 Michal Kotian,1,2 Marta Zatkova,1 Marta Popelkova,1 Marie Ociskova,3 Ingrid Tonhajzerova6
1Department of Psychology Sciences, Faculty of Social Science and Health Care, Constantine the Philosopher University in Nitra, Nitra, 2Psychagogia, Liptovsky Mikulas, Slovak Republic; 3Department of Psychiatry, Faculty of Medicine and Dentistry, University Palacky Olomouc, University Hospital Olomouc, Olomouc, Czech Republic; 4First Department of Internal Medicine, Faculty of Medicine, Pavol Josef Safarik University in Kosice, 5Internal Medicine and Cardiology Private Practice, MUDr Ivan Majercak, Kosice, 6Department of Physiology and Biomedical Centre Martin, Jessenius Faculty of Medicine in Martin, Comenius University in Bratislava, Martin, Slovakia
Objective: The aim of the study was to determine psychological, psychophysiological, and anthropometric factors connected with life events, level of depression, and quality of life in people at risk for cardiovascular disease and healthy controls.
Methods: This is a cross-sectional study involving arterial hypertension patients and healthy controls. There were several measurements including physical, anthropological, cardiovascular, and psychophysiological measurements and administration of questionnaires.
Results: A total of 99 participants were recruited for this study, 54 healthy controls (mean age: 35.59±13.39 years) and 45 patients with cardiovascular disease (CVD) (mean age: 46.33±12.39 years). The healthy controls and the patients with CVD significantly differed in the mean total score of life events, level of depression, quality of life score, temperature, blood pressure (BP), pulse transit time, heart rate, high-frequency total power, heart rate variability total power, waist-to-height ratio (WHtR), body fat percentage, fat control, pulse wave velocity, and augmentation index. In healthy subjects, the total score of the life events was not correlated with any cardiovascular or anthropometric factor. A score of depression significantly correlated with the WHtR, augmentation index, body fat percentage, and fat control. The quality of life – visual scale correlated with the body temperature, BP, and percentage of body fat. In the group of the patients with CVD, the score of the life events did not correlate with any measured cardiovascular or anthropometric factor. The level of depression correlated with the augmentation index. The quality of life – visual scale significantly correlated with body temperature, WHtR, and fat control.
Conclusion: The patients with CVD reported higher scores of life events, worse quality of life, and a greater level of depressive symptoms than healthy controls. In healthy controls, a higher mean total score of life events significantly negatively correlated with high-frequency total power, and the degree of depression correlated with being overweight. In patients with CVD, a score of depression was linked to being overweight.
Keywords: life events, depression, quality of life, heart rate variability, autonomic nervous system, parameters of cardiovascular system
Introduction
Psychological distress, accompanied by altered fluctuations in the sympathetic nervous system, is often considered a component of an increased cardiovascular risk.1–3 Individuals with an increased baseline activity of sympathetic system and sympathetic nervous system hyperresponsivity might be at an elevated risk for increased blood pressure (BP) if the “balance” among factors is missing.1,4–11
A higher hypertension prevalence in individuals with the depressive disorder has been found by Adamis and Ball12 and Nakagawara et al.13 Shinagawa et al14 showed that a depressive affectivity is related to increased levels of the BP in a 1-week monitoring of 54 patients. The increased frequency of depressive symptoms has been shown in patients with hypertension as well.15 There are also data showing an abnormal reactivity of the autonomic nervous system (ANS) in depression, specifically regarding the elevated sympathetic activity and a poor parasympathetic control.16–18
Emotional distress stimulates the sympathetic activity producing fluctuations in the cardiovascular system – tachycardia, hypertension, and relocation of the blood flow. The cardiovascular system control is particularly sensitive to the ANS governing stimuli.1,19,20 The frequency of the heart beat constantly fluctuates to adapt to the changes in cardiovascular variables such as respiration, BP, body temperature, and so on. Heart rate variability (HRV) has been shown to depend on the mechanisms of control mediated by the sympathetic and parasympathetic nervous systems and their interaction with each other.21 The ANS leads messages through the sympathetic and parasympathetic nervous systems. Sympathetic and parasympathetic partitions function antagonistically to preserve a dynamic modulation of vital functions.21 These systems act through the stellar ganglion and the vagus nerve. The interaction of these messages toward the sinoauricular node is responsible for normal cardiac variability, which can be assessed by monitoring HRV. HRV is a measure of cardiac autonomic function. The most frequently used HRV parameters in ANS evaluation are the frequency domain, time domain, and Poincaré plot factors.22–24 Frequency domain analysis defines variations of low- and high-frequency variability that relate to the activity of the different ANS branches. By using these frequency ranges in HRV, investigators can separate the sympathetic and parasympathetic systems.22,24
Heart rate (HR) is primarily regulated by a vagal activity,22 and this is an indicator of both how the central nervous system (CNS) controls the ANS and how peripheral neurons feed information back to the CNS.23,24 Appropriate work of the sympathetic/parasympathetic dynamic equilibrium at rest as well as in reaction to distress allows the adaptive answer to environment – allostasis.4,25 On the other hand, a lack of flexibility can lead to physical and psychological pathologies.24,26 The sympathetic hyperactivity accompanying parasympathetic hypoactivity could characterize potential pathological mechanism causing the heightened risk of not only a cardiovascular pathology but also depression and anxiety disorders.21,27–30 Reduced HRV reflects amplified sympathetic activity and decreased parasympathetic activity in depressive patients.31–36 and also in anxious patients and would reflect a deficit in the flexibility of emotional and physiological mechanisms.24 Reduced findings in HRV reflect a changed sympathovagal equilibrium of the sinoatrial node. This different equilibrium is characterized by a sympathetic stimulation and by a decreased vagal tone in cardiovascular disease (CVD).37,38 Earlier studies working with the HRV measurements of the cardiovascular autonomic function showed that individuals with overweight have a substantial decline in the parasympathetic activity and an elevation in sympathetic activity, demonstrating an alteration in the sympathovagal equilibrium to sympathetic predominance.39,40
Constant variations in sympathetic and parasympathetic impulses on the sinoatrial node show variations in HR and are a source of the oscillations in the R–R interval around its average rate (HRV).28 The obvious approach to quantify the variability of the HR oscillations is linear – spectral analysis.30 This method is recognized to be a predominantly effective tool in the exploration of autonomic instabilities in numerous disorders.28–32 The spectral analysis can offer information about functional mechanisms inducing three frequency bands – the very low frequency (VLF), the low frequency (LF), and the high frequency (HF).28 There are clear suggestions that the HF represents parasympathetic activity, but we must be careful in the explanation of the VLF and LF frequencies.32
Psychological problems and adverse life events have a role at the beginning of the metabolic syndrome, which is the risk factor for CVDs.41 It is supposed that a higher body weight is associated with clinical CVDs even at moderate degrees as an independent risk factor.42,43 The pathophysiologic mechanisms of cardiovascular dysfunction in obesity have not been fully understood yet, but an autonomic cardiovascular dysregulation has been anticipated as a link connected to the higher body weight and the increased prevalence of heart disease.44
Higher body weight is possibly related to a clinically relevant cardiovascular illness even at modest degrees of obesity.42,43 Nevertheless, the pathophysiologic mechanisms of the cardiovascular dysfunction in overweight have not yet been completely clarified; the changed autonomic cardiovascular regulation was proposed as a potential mechanism that links overweight with the higher prevalence of heart disease.44
Study aims
The purpose of this study was to determine which psychological, psychophysiological, and anthropometric factors are connected with life events, level of depression, and quality of life of people with CVD and healthy controls with the following primary hypotheses:
- Patients with CVDs report more stressful life events, depressive symptoms, and lower quality of life than healthy subjects.
- Stressful life events in the last 2 years correlate with the quality of life and a level of depressive signs.
- In healthy volunteers, the stressful life events and depression are linked to the parameters of the autonomic dysregulation and to the risk factors of the cardiovascular problems, including overweight.
- In patients with CVD, the stressful life events and depression correlate with being overweight.
Methods
A cross-sectional investigation was used to collect data for an evaluation of the relations between the psychological characteristics and the cardiovascular parameters.
Participants
There were two groups of participants:
- The first group was recruited from the general population with requirements of the adult age and the absence of a mental disorder or severe cardiovascular disorder both now and in the past.
- The second group involved patients treated because of arterial hypertension.
Probands were of both sexes, and their age was >21 years. The participants began to enter the trial in March 2014. The recruitment continued until September 2016.
Study settings
The probands were measured on the standard conditions in the outpatient cardiology clinic from 8 am to 1 pm. The measurements included an administration of questionnaires, the physical examination, the measurement of BP, anthropological measurements, parameters of the cardiovascular system, and the measurements of psychophysiological functions in relation to mental stress.
Measurements
Questionnaires
The questionnaires used in the survey were as follows:
- Social Readjustment Rating Scale (SRRS): this life events questionnaire has 43 items, most of which are taken from Holmes and Rahe’s Schedule of Recent Events.45 At a 2-year assessment, the incidence of negative life events since the interview was evaluated with the List of Threatening Events Questionnaire.
- EuroQol Group 5-Dimension Self-Report Questionnaire (EQ-5D): this is a method used for the evaluation of the quality of life in research in medicine.46 This questionnaire includes five broad domains: mobility, self-care, usual activities, pain/discomfort, and anxiety/depression.47 The additional measure is the EQ-5D visual analog scale (VAS).48,49 EQ-5D is extensively used in various countries in different clinical areas.50 EQ-5D is one of the most frequently used measurements with good validity and reliability.51
- Beck Depression Inventory, Second Edition (BDI-II): this inventory describes 21 depressive symptoms. Patients choose which symptoms they perceived in the last 2 weeks and how intense they were.52–54 Internal consistency of this inventory is higher in the psychiatric population (α=0.86) than in the general population (α=0.81).54 Preiss and Vaciř55 published the Czech version.
Physiological measurements
The physiological measurements were as follows:
- HR: sinus tachycardia was defined as HR per minute.
- HRV: the changes in the activity of the ANS were measured by the analytic methods using the power spectral analysis of the beat-to-beat interval (R–R interval) sequences that quantify the HRV. HRV was measured for 5 minutes at rest.
The following data were taken and processed by ProComp Infiniti hardware and software (Thought Technology Ltd., Quebec, Canada):
- Power spectrum was calculated via a fast Fourier transformation for VLF (0.0033–0.04 Hz), LF (0.04–0.15 Hz), and HF (0.15–0.40 Hz) powers.56–58
- Standard deviation of the R–R intervals (SDRR) provided information about total HRV. This measurement shows how much variability exists during a given period, calculated as a standard deviation (SD) of interbeat interval values during a minute. Since the SD is a representation of how spread out the inter beat interval values are, higher SDRR values represent greater variability.
- HRV total power was the sum of all measured frequencies (VLF + LF + HF).
Anthropometric characteristics
Basic anthropometric parameters were measured: weight, height, BP, and HR at rest. These parameters were measured in the morning in a fasting state. A trained research nurse was responsible for the measurements of weight, height, BP, and HR at rest in all subjects. All subjects were weighed in light clothing; jackets, coats, and shoes were removed. The weighing measures were calibrated monthly. Height measurements were taken using a specific piece of measuring equipment. The bioimpedance body composition analysis is used to analyze the frequency of the segmental bioimpedance – the percentage of the body fat, the fat excess above the normal range (fat control). Waist-to-height ratio (WHtR) is defined as the waist perimeter divided by height, both measured in the same units. The WHtR is a measure of the abdominal distribution of body fat. Percentage of body fat (PBF) is the total mass of fat (kg) divided by total body weight (kg) ×100. Fat control is the excess fat above the normal range (kg).
- Data from arteriography examination: all participants underwent an examination of arterial stiffness using the Arteriograph (TensioMed Ltd., Budapest, Hungry), aortic pulse wave velocity (PWVao), the central systolic blood pressure (SBPao), and the augmentation index (AIx) to measure the risk of atherosclerosis. Endothelial dysfunction is preclinical atherosclerosis in otherwise asymptomatic individuals.59 The risk for CVD determines the stiffness/elasticity of the arteries (PWVao and AIx).59
- Electrocardiogram (ECG) and blood volume pulse sensors simultaneously measured HR.
- Pulse transit time (PTT) is the time required by a pulse wave to leave the heart and reach the site where photoplethysmogram (PPG) is measured. The PTT is the result of calculating the time difference between the r-wave or QRS-complex of the ECG signal and the characteristic p-base point or virtual base point of the PPG signal.60,61 Hey et al60 on their research concluded that PTT seems to be an important major method for the detection of stress. PTT was measured by ProComp Infiniti software version 5.
- PWVao is determined by the characteristics of the aortic wall and the BP. The stiffer the aorta, the faster the pulse wave. It is measured in meters per second. An optimal speed is less than 7 m/s; the normal one is between 7 and 9.5 m/s. Increased PWVao values are related to the increased cardiovascular risk and the atherosclerotic damage. PWVao is an independent predictor of coronary heart disease and stroke in seemingly healthy subjects and is related to subclinical coronary atherosclerosis independent of the conventional risk factors and may be a biomarker of the cardiovascular risk in asymptomatic individuals.62
- SBPao is the central systolic blood pressure. SBPao is normal under 140 mmHg. If the arterial stiffness increases, the SBPao gets higher.59 The non-invasively measured central pulse pressure is related to vascular hypertrophy, the degree of atherosclerosis, and cardiovascular events.63
- AIx means the augmentation index (AIx = [P2−P1/pulse blood pressure] ×100). AIx determines the sign of arterial stiffening. It is a strong, independent risk marker for premature coronary artery disease.64 AIx is mainly determined by the peripheral arterial resistance of the small arteries and arterioles that are influenced primarily by endothelial NO synthesis. Normal AIx lies below 33%. The values of AIx are usually negative because physiologically P2 has a lower amplitude than P1.59
- Other somatic measures
- The BP is measured in large arteries of the systemic circulation. In our study, the BP was measured on the left and right hands.
- Thermistor sticks measured temperature (T) on the ring finger of the dominant hand. Peripheral skin temperature measurements reflect the blood flow through the vessels under the skin. An increase in the blood flow in the blood vessels results in a higher temperature.
Statistics
Statistics analysis was performed using the statistical software SPSS 24.0 for Windows (IBM Corporation, Armonk, NY, USA) and the Prism (version 5.0; IBM Corporation; http://www.graphpad.com/prism/prism.htm). The demographic and clinical data have been computed using column statistics. The Shapiro–Wilk test determined the standard distribution of the demographic and clinical data. Differences between scores or measures were computed by unpaired t-tests or Mann–Whitney tests in dichotomous subgroups of data: one-way analysis of variance (ANOVA) or the Kruskal–Wallis test in more than two data categories, according to the type of the data distribution. The Fisher’s exact test and chi-square test were used for the categorical variables. Relationships between the variables were analyzed by the Pearson’s or Spearman’s correlation coefficients, partial correlations using controlled variables of age and sex, and multiple regressions using a backward stepwise regression or a binary logistic regression with the backward logistic regression method. Differences were considered to be significant when P-values were <0.05.
Ethical issues
The study was carried out in accordance with the latest version of the Declaration of Helsinki and the Guideline for Good Clinical Practice (European Medicines Agency; http://www.ema.europa.eu/pdfs/human/ich/013595en.pdf. 20.3.2009). The local ethical committee of the Faculty of Social Science and Health Care, Constantine the Philosopher University in Nitra, approved the study. A written informed consent was obtained from each participant.
Results
Sample description
This study is a cross-sectional investigation of individuals at the age of 18 years or older. In all, 99 probands were involved in the survey. The average age was 40.5±14.0 years. There were more females (63.6%) than males (36.4%) and higher amount of secondary educated people (51.5%). Most of the participants lived with a partner (94.9%) and were employed (70.7%) or students (16.2%). The majority of the participants were overweight or obese: 24.2% were overweight (n=24), 19.2% were in the obesity class I (n=19), 3.0% were in the obesity class II (n=3), and 3.0% were included in the obesity class III (n=3). There were 8.1% participants who were underweight (n=8), and 36.4% participants had a normal weight (n=36). The participant's characteristics are summarized in Table 1.
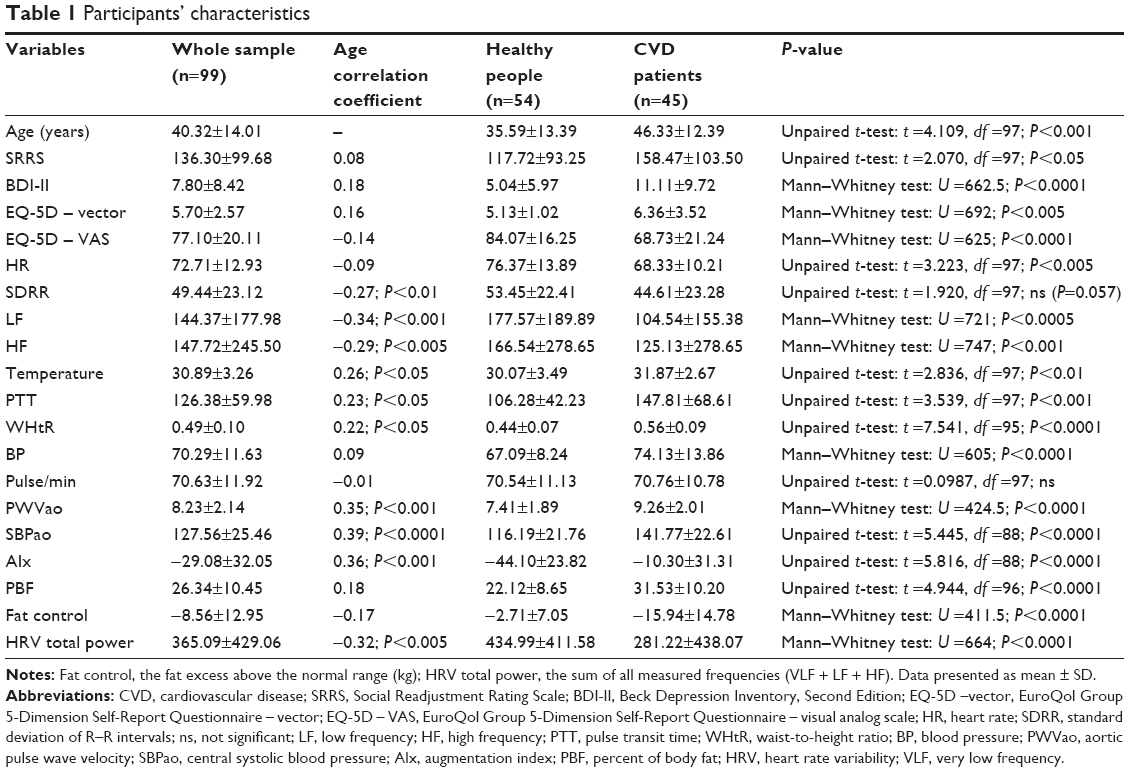 | Table 1 Participants’ characteristics |
Comparison of the probands with CVDs and the healthy individuals
There were 54 healthy participants without any history of a mental or physical illness with the mean age of 35.59±13.39 years and 45 patients with CVD (treated for hypertension) with the average age of 46.33±12.39 years. The patients were statistically significantly older than healthy individuals.
The comparison between the healthy people and the patients treated with CVD shows significant differences between the healthy controls and the CVD patients in all measured psychological questionnaires (SRRS, BDI-II, EQ-5D – VAS, and EQ-5D – vector), psychophysiological variables (temperature, PTT, HR, LF, HF, and HRV total), anthropological variables (WHtR, PBF, and fat control), and cardiovascular variables (BP, PWVao, SBPao, and AIx; Table 1).
The age was significantly correlated with the parameters of ANS SDRR, LF, and HF; body temperature; HRV total; PTT; an anthropometric factor WHtR; and cardiological measures PWVao, SBPao, and AIx (Table 1).
Relationship among various psychosocial factors
A score of the adverse life events according to the SRRS in the whole sample positively correlated with the severity of depressive symptoms assessed by BDI-II and also with the vector of the quality of life measured on an EQ-5D scale, but not with the VAS factor of EQ-5D. The level of depressive symptoms measured by BDI-II positively correlated with both factors of EQ-5D (Table 2).
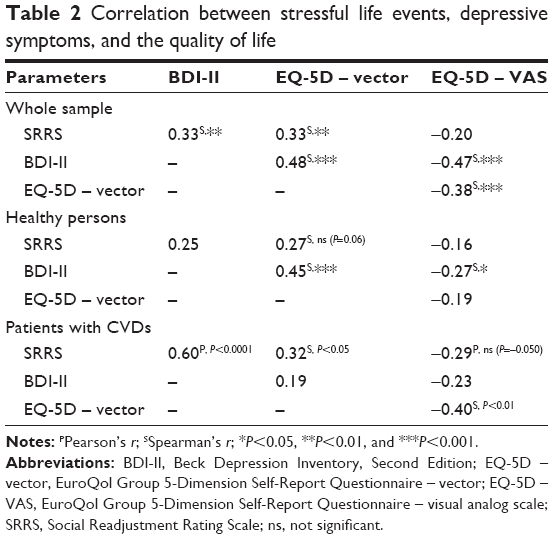 | Table 2 Correlation between stressful life events, depressive symptoms, and the quality of life |
In the control group, there were no correlations between the adverse life events, measured by SRRS, and the severity of depressive symptoms or the quality of life, but there was a correlation between the depression score and both parameters of quality of life.
In the subgroup of patients, there was a highly significant correlation between the stressful life events and the score of depressive symptoms and the EQ-5D – vector.
Relationship among psychosocial and psychophysiological factors in healthy individuals
The total score of SRRS on an individual during the last 2 years correlated negatively with HF (Table 3). The level of depressive symptoms measured by BDI-II correlated with BP, PBF, fat control, and HRV total (Table 3). EQ-5D – vector did not significantly correlate with any parameters of the ANS activity or anthropometric parameters. EQ-5D – VAS correlated significantly with body temperature and PBF.
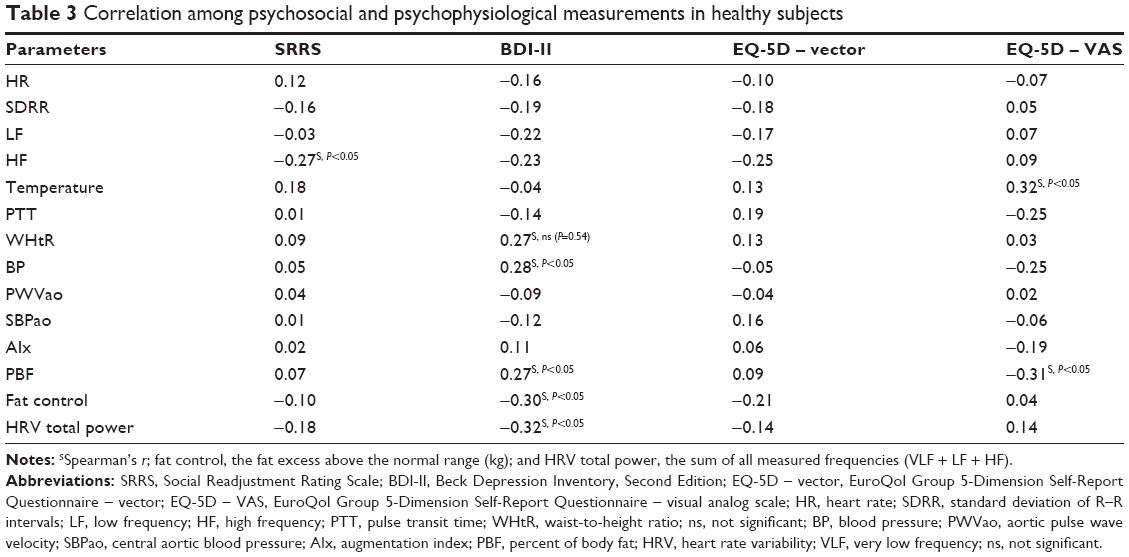 | Table 3 Correlation among psychosocial and psychophysiological measurements in healthy subjects |
In the group of patients with CVD, the stressful life events score measured by SRRS correlated with WHtR and SBPAo. The level of depressive symptoms measured by BDI-II correlated with PTT and AIx (Table 4). EQ-5D – vector significantly correlated with SDRR, PTT, WHtR, and PBF. EQ-5D – VAS significantly correlated with WHtR, PBF, and fat control (Table 4).
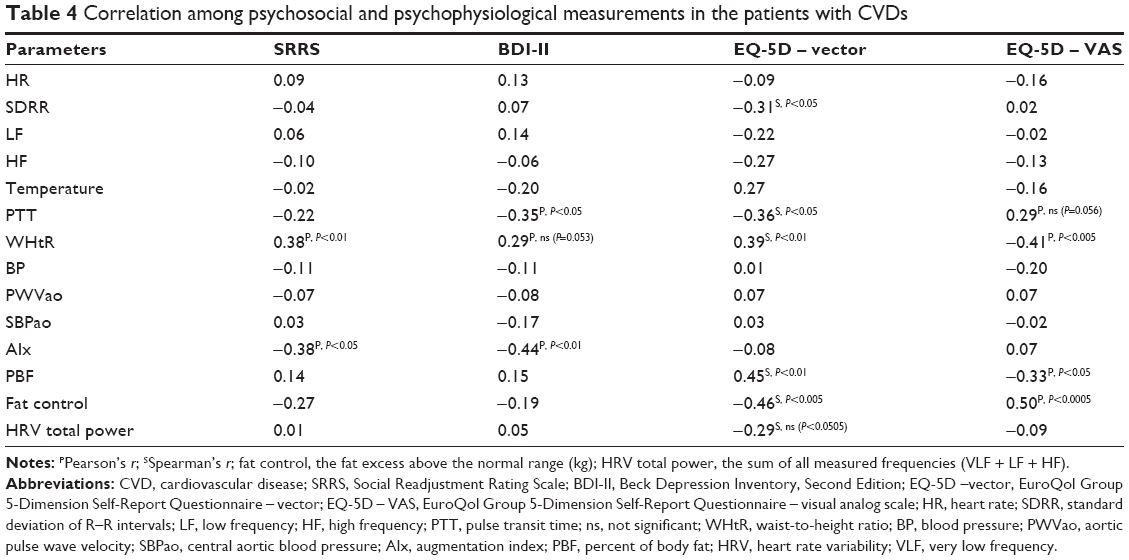 | Table 4 Correlation among psychosocial and psychophysiological measurements in the patients with CVDs |
Partial correlations among the psychosocial and psychophysiological measurements after controlling for age and sex
Because age and sex had an influence on several cardiovascular and anthropometric characteristics, the next step was the calculation of the partial correlations with the controlling for age and sex (Tables 5 and 6).
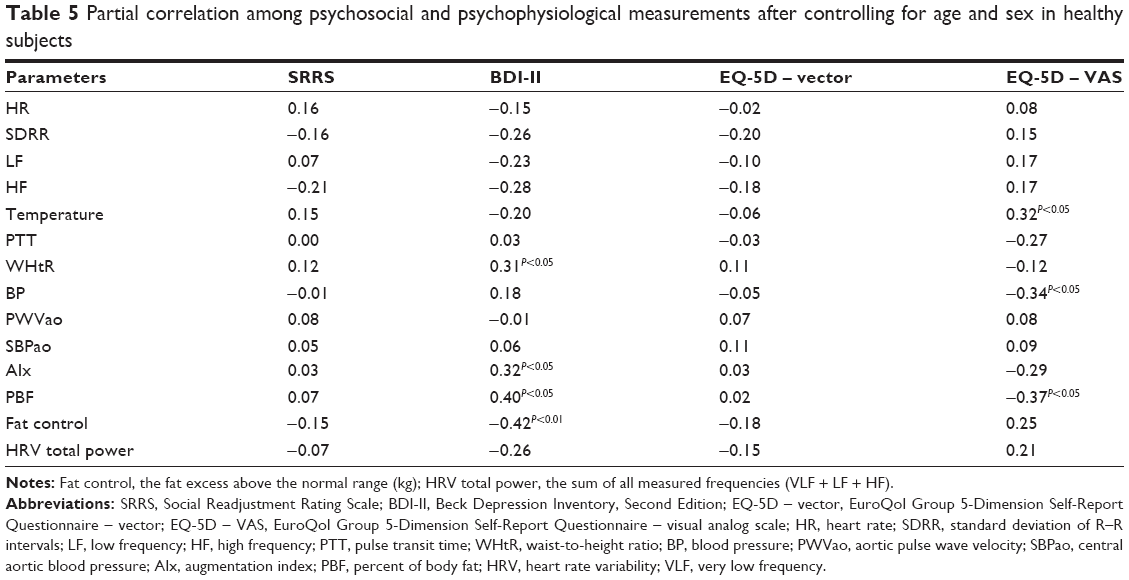 | Table 5 Partial correlation among psychosocial and psychophysiological measurements after controlling for age and sex in healthy subjects |
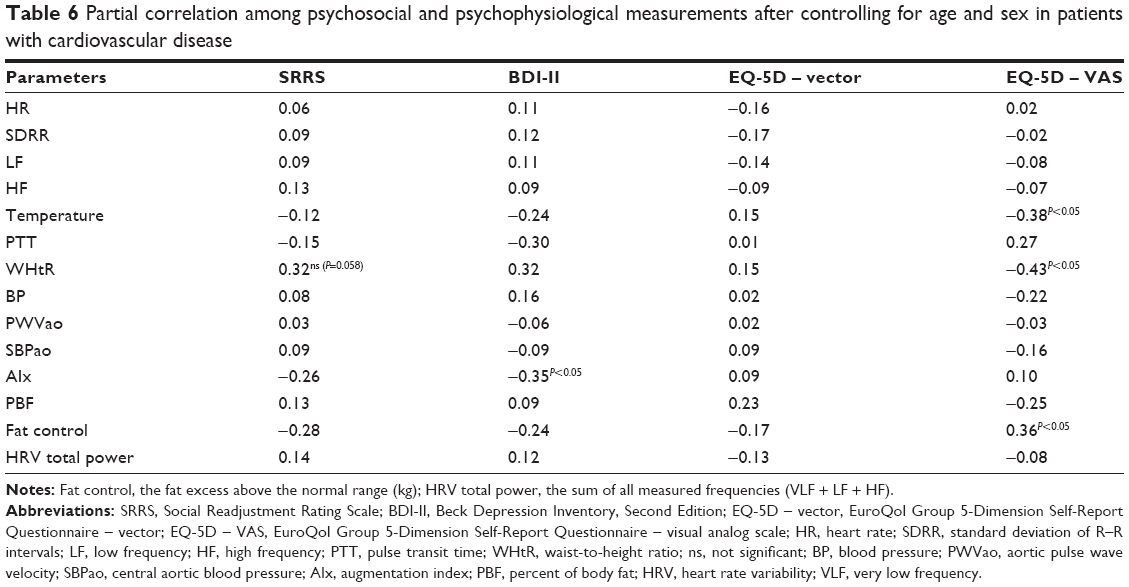 | Table 6 Partial correlation among psychosocial and psychophysiological measurements after controlling for age and sex in patients with cardiovascular disease |
In the healthy subjects, the SRRS total score was not correlated with any cardiovascular or anthropometric factor. BDI-II significantly correlated with the WHtR, AIx, PBF, and fat control. The quality of life measured by EQ-5D – vector did not correlate with any cardiovascular or anthropometric factor. The EQ-5D – VAS correlated with the body temperature, BP, and PBF.
In the group of patients with CVD, SRRS did not correlate with any measured cardiovascular or anthropometric factor, except the WHtR whose correlation was close to the statistically significant level (P=0.058). BDI-II significantly correlated with the AIx. EQ-5D – vector did not correlate with any measured cardiovascular or anthropometric factor. EQ-5D – VAS significantly correlated with body temperature, WHtR, and fat control (Table 6).
Regression analyses
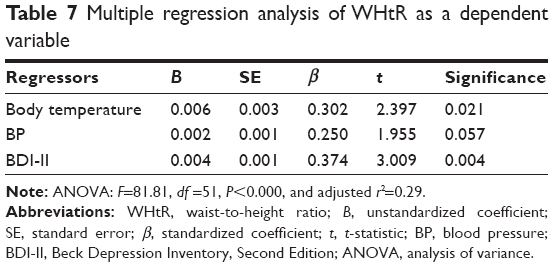
A multiple regression analysis with weighting by age was completed to identify the most important factors connected with WHtR and PBF as risk factors for CVDs. The dependent variable was WHtR. Independent variables were temperature, BP, SRRS, BDI-II, EQ-5D – vector, EQ-5D – VAS, LF total power, HF total power, and HRV total power. All requested variables were entered. The seven backward stepwise regression phases selected body temperature, BP, and BDI-II, which passed with statistical significance (Table 7).
 | Table 7 Multiple regression analysis of WHtR as a dependent variable |
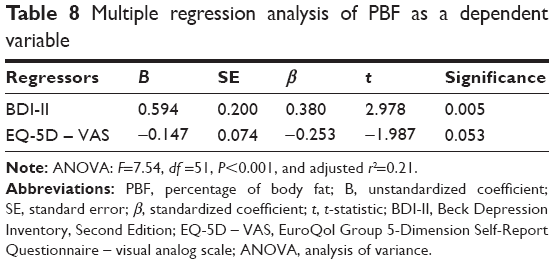
The dependent variable was the sum of PBF. Independent variables were HRV total power, EQ-5D – VAS, WHtR, BDI-II, and fat control. All requested variables were entered. During the four phases of backward stepwise regression, only BDI-II passed with a statistical significance (Table 8).
 | Table 8 Multiple regression analysis of PBF as a dependent variable |
Discussion
The study intention was to explore if the stressful life events experienced in the past 2 years predict depressive symptoms, quality of life, and psychophysiological and anthropometric aspects connected with increased risk factors for the cardiovascular disorders.
The first hypothesis that “Patients with CVDs report more stressful life events, depressive symptoms, and lower quality of life than healthy subjects” was confirmed. The results are also in agreement with the epidemiological findings that the financial stress, work-related stressful events, diseases and deaths, and stress, in general, had the strongest association with the occurrence of myocardial infarction.65–67 In addition, there was increased prevalence of hypertension in patients with depressive disorders12,14 and increased frequency of depression in patients with high BP.15 Moreover, also both parameters of quality of life showed higher levels in healthy controls than in patients with CVD. The same outcome was seen in patients with CVD in many studies.68,69
The second hypothesis that “Stressful life events in the last 2 years correlate with quality of life and a level of depressive symptoms” was not confirmed in our data of the healthy participants, but was confirmed in the patients with CVDs. In the literature, the impact of the stressful life events on the beginning of depression is well documented in the individuals with depression70,71 and also in patients with CVDs.72–76 Why our healthy control group does not display a relation between the severity of depression and the quality of life is unknown, but it is possible to explain it by the overall low level of the stressful life events in the healthy subject sample, which was significantly less than in the cardiovascular patient’s sample.
The third hypothesis that “In healthy volunteers, the stressful life events and depression are linked to the parameters of the autonomic dysregulation and with the risk factors for the cardiovascular problems including overweight” was confirmed partially. No cardiovascular risk factor correlated with the score of stressful life events. However, a higher amount of stressful life events significantly negatively correlated with HF, a possible marker of parasympathetic tone. This means that people who experienced more stressful life events in the last 2 years could display a lower level of parasympathetic tone. There are several findings from other authors that confirm the results of the present study. Our results correspond with the results of the study of Lampert et al73 that showed that total cumulative stress score and cumulative adverse life events were all inversely associated with standard deviation of NN intervals (SDNN), which is linked to the parasympathetic tone. High-frequency variability may be significantly reduced in the patients with depression, indicating that depressive patients have an aberration in the parasympathetic nervous system activity.56,77 The decreased HRV is associated with other CVD risk factors.74 Low HRV is linked to a higher risk of the first cardiovascular incident in people without known CVDs.75
On the other side, there was no correlation between the level of the symptoms of depression and HF in our sample. Nevertheless, nobody from our probands received a diagnosis of depressive disorders. There was a positive correlation between depressive score and PBF and WHtR (on the border of significance) and a negative correlation with fat control in healthy volunteers. In addition, Harding et al88 described differences in the associations between the psychosocial distress, including the stressful life events, and the changes in body mass index (BMI) during a 5-year period, accentuating the influence of the weight status at the beginning. In addition, Barry and Petry86 presented that overweight/obese women experienced higher level of adverse life events than women with normal weight, whereas, for men, obesity (but not overweight) was connected with more adverse life events.87–90 Proper et al91 examined the connection between the manifestation, effect, and adaptation to stressful life events and weight changes and the impact of the initial weight. In a population-based cohort of 2,789 adults, they found no proof of a relationship between stressful life events and change in weight of the whole study sample, but they hypothesized that people with normal weight reacted another way to stressful life events than individuals who were overweight.
The fourth hypothesis that “In patients with cardiovascular problems the stressful life events and depression correlate with the overweight” was confirmed. In the sample of the patients with CVDs, the score of stressful life events significantly correlated with WHtR and AIx, which could be independent risk factors for cardiovascular illness and mortality.78 The earlier investigation has shown that stress can induce higher food intake.79–82 However, it may also suppress eating.81 Dissimilarities in the reactivity to stress lead to alternatives in influence on body weight that could exist between men and women and between the healthy weight and obese adults.79–82 Based on three prospective studies, it was presented that the impact of distress on the body weight varied according to the initial BMI; positive links were only seen in the overweight people.83–86 The pathophysiologic mechanisms of cardiovascular dysfunction in obesity have not been fully understood yet, but autonomic cardiovascular dysregulation has been anticipated as a link connecting the higher body weight and the increased prevalence of the heart disease.44 Obese people have an elevation in sympathetic activity and a reduction in parasympathetic modulation of the cardiac function.39,40
Study limitations
The present investigation has some limitations. The main limitation is the number of the probands. The other one is that we were not able to establish the representativeness of the survey sample for adults in Slovakia because of selection biases with the individuals with a higher education who were willing to participate (the participants had only a secondary school or university education; there were no participants with primary education). The future studies should focus on less-educated patients.
The patients with CVD were treated with various medications, mostly antihypertensive, which might have influenced some measured factors, especially findings connected with the autonomic disbalance and metabolism.
A certain bias affects use of the self-evaluation psychosocial assessment methods. The usage of such questionnaires is influenced by the capability of self-reflection of the probands and their willingness to be open in the reports. In addition, several probands did not fulfill the criteria in the forms fully, so they had to be disqualified from some analyses.
Conclusion
Results suggest some possible mechanisms by which stress may exert adversarial effects on cardiovascular morbidity in healthy people. Primary preventive strategies with stress management training may be beneficial. Monitoring this parameter about others even in psychological aspect could be a significant contribution in preventive cardiology.
The outcome has a substantial impact on thinking about the detection of psychological factors in relation to a higher risk of CVDs and could help in planning the psychoeducational and lifestyle changes in the individuals who experience a high level of the stressful life events to decrease the heart disease risk.88
Acknowledgment
This article was supported by the research grant from the Slovak Research and Development Agency (APVV-15-0502).
Disclosure
The authors report no conflicts of interest in this work.
References
Krantz DS, Manuck SB. Measures of acute physiologic reactivity to behavioral stimuli: assessment and critique. Psychol Bull. 1984;96:435–464. | ||
Treiber FA, Kamarck T, Schneiderman N, Sheffield D, Kapuku G, Taylor T. Cardiovascular reactivity and development of preclinical and clinical disease states. Psychosom Med. 2003;65(1):46. | ||
Lloyd-Jones DM, Walsh JA, Prineas RJ, et al. Association of electrocardiographic abnormalities with coronary artery calcium and carotid artery intima–media thickness in individuals without clinical coronary heart disease (from the Multi-Ethnic Study of Atherosclerosis [MESA]). Am J Cardiol. 2009;104(8):1086–1091. | ||
Lohmeier TE, Dwyer TM, Hildebrandt DA, et al. Influence of prolonged baroreflex activation on arterial pressure in angiotensin hypertension. Hypertension. 2005;46(5):1194–1200. | ||
Lewington S, Clarke R, Qizilbash N, Peto R, Collins R; Prospective Studies Collaboration. Age-specific relevance of usual blood pressure to vascular mortality: a meta-analysis of individual data for one million adults in 61 prospective studies. Lancet. 2002;360(9349):1903–1913. | ||
Conen D, Bamberg F. Noninvasive 24-h ambulatory blood pressure, and cardiovascular disease: a systematic review and meta-analysis. J Hypertens. 2008;26(7):1290–1299. | ||
Ward AM, Takahashi O, Stevens R, Heneghan C. Home measurement of blood pressure and cardiovascular disease: systematic review and meta-analysis of prospective studies. J Hypertens. 2012;30(3):449–456. | ||
Johnston DW, Tuomisto MT, Patching GR. The relationship between cardiac reactivity in the laboratory and in real life. Health Psychol. 2008;27(1):34–42. | ||
Frattola A, Parati G, Cuspidi C, Albini F, Mancia G. Prognostic value of 24-hour blood pressure variability. J Hypertens. 1993;11(10):1133–1137. | ||
Grove JS, Reed DM, Yano K, Hwang LJ. Variability in systolic blood pressure – a risk factor for coronary heart disease? Am J Epidemiol. 1997;145(9):771–776. | ||
Grassi G, Bombelli M, Brambilla G, Trevano FQ, Dell’oro R, Mancia G. Total cardiovascular risk, blood pressure variability and adrenergic overdrive in hypertension: evidence, mechanisms, and clinical implications. Curr Hypertens Rep. 2012;14(4):333–338. | ||
Adamis D, Ball C. Physical morbidity in elderly psychiatric inpatients: prevalence and possible relations between the major mental disorders and physical illness. Int J Geriatr Psychiatry. 2000;15(3):248–253. | ||
Nakagawara M, Witzke W, Matussek N. Hypertension in depression. Psychol Res. 1987;21(1):85–86. | ||
Shinagawa M, Otsuda K, Murakami S, et al. Seven-day (24-h) ambulatory blood pressure monitoring, self-reported depression and quality of life scores. Blood Press Monit. 2002;7(1):69–76. | ||
Rabkin J, Charles E, Kass F. Hypertension and DSM-III depression in psychiatric outpatients. Am J Psychiatry. 1983;140(8):1072–1074. | ||
Cooper SJ, Kelly JG, King DJ. Adrenergic receptors in depression. Effects of electroconvulsive therapy. Br J Psychiatry. 1985;147:23–29. | ||
Roy A, Pickar D, Linnoila M, Potter WZ. Plasma norepinephrine levels in affective disorders. Relationship to melancholia. Arch Gen Psychiatry. 1985;42(12):1181–1185. | ||
Devilliers AS, Russell VA, Carsters ME, et al. Noradrenergic function and hypothalamic-pituitary-adrenal axis activity in primary major depressive disorder. Psychiatry Res. 1987;22(2):127–139. | ||
Fontes MAP, Xavier CH, de Menezes RCA, DiMicco JA. The dorsomedial hypothalamus and the central pathways involved in the cardiovascular response to emotional stress. J Neurosci. 2011;184:64–74. | ||
Zanstra YJ, Johnston DW. Cardiovascular reactivity in real life settings: measurement, mechanisms, and meaning. Biol Psychol. 2011;86(2):98–105. | ||
Jones-Webb R, Jacobs DR, Flack JM, Liu K. Relationship between depressive symptoms, anxiety, alcohol consumption, and blood pressure: results from the CARDIA study. Alcohol Clin Exp Res. 1996;20(3):420–427. | ||
Thayer JF, Lane RD. Claude Bernard and the heart-brain connection: further elaboration of a model of neurovisceral integration. Neurosci Biobehav Rev. 2009;33(2):81–88. | ||
Friedman BH. An autonomic flexibility-neurovisceral integration model of anxiety and cardiac vagal tone. Biol Psychol. 2007;74(2):185–199. | ||
Visnovcova Z, Calkovska A, Tonhajzerova I. Heart rate variability and electrodermal activity as noninvasive indices of sympathovagal balance in response to stress. Acta Medica Martiniana. 2013;13(1):5–13. | ||
McEwen BS, Wingfield JC. The concept of allostasis in biology and biomedicine. Horm Behav. 2003;43:2–15. | ||
Sloan RP, Shapiro A, Baggiela E, Myers M, Gorman JM. Cardiac autonomic control buffers blood pressure variability response to challenge: a psychophysiologic model of coronary artery disease. Psychosom Med. 1999;61(1):58–68. | ||
Smith PA, Graham LN, Mackintosh AF, Stoker JB, Mary DASG. Relationship between central sympathetic activity and stages of human hypertension. Am J Hypertens. 2004;17(3):217–222. | ||
Prasko J, Latalova K, Diveky T, et al. Panic disorder, autonomic nervous system and dissociation – changes during therapy. Neuroendocrinol Lett. 2011;32(5):101–111. | ||
Latalova K, Prasko J, Diveky T, et al. Autonomic nervous system in euthymic patients with bipolar affective disorder. Neuroendocrinol Lett. 2010;31:101–108. | ||
Diveky T, Prasko J, Kamaradova D, et al. Comparison of heart rate variability in patients with panic disorder during cognitive behavioral therapy program. Psychiatr Danub. 2013;25(1):62–67. | ||
Carney RM, Saunders RD, Freedland KE, Stein P, Rich MW, Jaffe AS. Association of depression with reduced heart rate variability in coronary artery disease. Am J Cardiol. 1995;76(8):562–564. | ||
Guinjoan SM, Bernabó JL, Cardinalli DP. Cardiovascular tests of autonomic function and sympathetic skin responses in patients with major depression. J Neurol Neurosurg Psychiatry. 1995;58(3):299–302. | ||
Krittayaphong R, Cascio WE, Light KC, et al. Heart rate variability in patients with coronary artery disease: differences in patients with higher and lower depression scores. Psychosom Med. 1997;59(3):231–235. | ||
Carney RM, Freedland KE, Stein PK, Skala JA, Hoffman P, Jaffe AS. Change in heart rate and heart rate variability during treatment for depression in patients with coronary artery disease. Psychosom Med. 2000;62(5):639–647. | ||
Carney RM, Blumenthal JA, Stein PK, et al. Depression, heart rate variability, and acute myocardial infarction. Circulation. 2001;104(17):2024–2028. | ||
Yeragani VK, Rao KA, Smitha MR, Pohl RB, Balon R, Srinivasan K. Diminished chaos of heart rate time series in patients with major depression. Biol Psychiatry. 2002;51(9):733–744. | ||
Malik M. Heart rate variability. Standards of measurement, physiological interpretation, and clinical use. Task Force of the European Society of Cardiology Cardiology and the North American Society of Pacing and Electrophysiology. Eur Heart J. 1997;17:354–381. | ||
Routledge FS, Campbell TS, McFetridge-Durdle JA, Bacon SL. Improvements in heart rate variability with exercise therapy. Can J Cardiol. 2010;26(6):303–312. | ||
Rabbia F, Silke B, Conterno A, et al. Assessment of cardiac autonomic modulation during adolescent obesity. Obes Res. 2003;11(4):541–548. | ||
Chethan HA, Niranjan M, Basavaraju K. Comparative study of heart rate variability in normal and obese young adult males. Int J Biol Med Res. 2012;3:1621–1623. | ||
Fabre B, Grosman H, Mazza O, et al. Relationship between cortisol, life events and metabolic syndrome in men. Stress. 2013;16(1):16–23. | ||
Prospective Studies Collaboration; Whitlock G, Lewington S, et al. Body-mass index and cause-specific mortality in 900 000 adults: collaborative analyses of 57 prospective studies. Lancet. 2009;373(9669):1083–1096. | ||
Chen Z, Yang G, Zhou M, et al. Body mass index and mortality from ischaemic heart disease in a lean population: 10-year prospective study of 220,000 adult men. Int J Epidemiol. 2006;35(1):141–150. | ||
Kim JA, Park YG, Cho KH, et al. Heart rate variability and obesity indices: emphasis on the response to noise and standing. J Am Board Fam Pract. 2005;18(2):97–103. | ||
Holmes TH, Rahe RH. The Social Readjustment Rating Scale. J Psychosom Res. 1967;11(2):213–218. | ||
The EuroQol Group. EuroQol – a new facility for the measurement of health-related quality of life. Health Policy. 1990;16:199–208. | ||
Cleemput I. A social preference valuations set for EQ-5D health states in Flanders, Belgium. Eur J Health Econ. 2010;11(2):205–213. | ||
Shaw JW, Johnson JA, Coons SJ. US valuation of the EQ-5D health states development and testing of the D1 valuation model. Med Care. 2005;43(3):203–220. | ||
Shafie AA, Hassali MA, Liau SY. A cross-sectional validation study of EQ-5D among the Malaysian adult population. Qual Life Res. 2011;20(4):593–600. | ||
Rabin R, de Charro F. EQ-5D: a measure of health status from the EuroQol Group. Ann Med. 2001;33(5):337–343. | ||
Bulamu NB, Kaambwa B, Ratcliffe J. A systematic review of instruments for measuring outcomes in economic evaluation within aged care. Health Qual Life Outcomes. 2015;13(1):179. | ||
Beck AT, Steer RA, Carbin MG. Psychometric properties of the Beck Depression Inventory: twenty-five years of evaluation. Clin Psychol Rev. 1988;8(1):77–100. | ||
Beck AT, Steer RA. Relationship between the Beck Anxiety Inventory and the Hamilton Anxiety Rating Scale with anxious outpatients. J Anxiety Disord. 1991;5(3):213–223. | ||
Storch EA, Roberti JW, Roth DA. Factor structure, concurrent validity, and internal consistency of the Beck Depression Inventory – second edition in a sample of college students. Depress Anxiety. 2004;19(3):187–189. | ||
Preiss M, Vacíř K. Beckova sebeposuzovací škála depresivity pro dospělé. BDI-II [Beck self-rate scale for depression for adults]. Příručka. Brno: Psychodiagnostika; 1999. Czech. | ||
Javorka K. Heart Rate Variability. Mechanisms, Classification, Clinical Utilization. Martin: Osveta; 2008. | ||
Lipsitz LA, Mietus J, Moody GB, Goldberger AL. Spectral characteristics of heart rate variability before and during a postural tilt: relations to aging and risk of syncope. Circulation. 1990;81:1803–1810. | ||
Ponikowski P, Chua TP, Piepoli M, et al. Chemoreceptor dependence of very low frequency rhythms in advanced chronic heart failure. Am J Physiol. 1997;272(1 pt 2):H438–H447. | ||
Farsky S. Vyšetrovanie arteriálnej tuhosti. Via Pract. 2009;6(4):153–156. | ||
Hey SJ, Byrne E, Halford NG. The interface between metabolic and stress signalling. Ann Bot. 2010;105(2):197–203. | ||
Boll P. Mobile Überwachung der Funktionalität des kardiovaskulären Systems – Konzepte und Simulationen [Monitoring the functionality of the cardiovascular system – concepts and simulations] [dissertation]. Karlsruhe: ITIV; 2008. | ||
Kullo IJ, Bielak LF, Turner ST, Sheedy PF, Peyser PA. Aortic pulse wave velocity is associated with the presence and quantity of coronary artery calcium. Hypertension. 2006;47:174–179. | ||
Roman MJ, Devereux RB, Kizer JR, et al. Central pressure more strongly relates to vascular disease and outcome than does brachial pressure: the Strong Heart Study. Hypertension. 2007;50(1):197–203. | ||
Weber T, Auer J, Eber B, O’Rourke MF. Relationship between reduced elasticity of extracardiac vessels and left main stem coronary artery disease. Eur Heart J. 2004;25(21):1966–1967. | ||
Rozanski A, Blumenthal JA, Davidson KW, Saab PG, Kubzansky L. The epidemiology, pathophysiology, and management of psychosocial risk factors in cardiac practice: the emerging field of behavioral cardiology. J Am Coll Cardiol. 2005;45(5):637–651. | ||
Dimsdale JE. Psychological stress and cardiovascular disease. J Am Coll Cardiol. 2008;51(13):1237–1246. | ||
Vujcic I, Vlajinac H, Dubljanin E, et al. Psychosocial stress and risk of myocardial infarction: a case-control study in Belgrade (Serbia). Acta Cardiol Sin. 2016;32(3):281–289. | ||
Wang L, Wu YQ, Tang X, et al. Profile and correlates of health-related quality of life in Chinese patients with coronary heart disease. Chin Med J (Engl). 2015;128(14):1853–1861. | ||
Tušek-Bunc K, Petek D. Comorbidities and characteristics of coronary heart disease patients: their impact on health-related quality of life. Health Qual Life Outcomes. 2016;14(1):159. | ||
Blonski SC, Conradi HJ, Oldehinkel AJ, Bos EH, de Jonge P. Associations between negative and positive life events and the course of depression: a detailed repeated-assessments study. J Nerv Ment Dis. 2016;204(3):175–180. | ||
Joormann J, Stanton CH. Examining emotion regulation in depression: a review and future directions. Behav Res Ther. 2016;86:35–49. | ||
Perrotti A, Mariet AS, Durst C, et al. Relationship between depression and health-related quality of life in patients undergoing coronary artery bypass grafting: a MOTIV-CABG substudy. Qual Life Res. 2016;25(6):1433–1440. | ||
Lampert R, Tuit K, Hong KI, Donovan T, Lee F, Sinha R. Cumulative stress and autonomic dysregulation in a community sample. Stress. 2016;19(3):269–279. | ||
Colhoun HM, Francis DP, Rubens MB, Underwood SR, Fuller JH. The association of heart-rate variability with cardiovascular risk factors and coronary artery calcification: a study in type 1 diabetic patients and the general population. Diabetes Care. 2001;24(6):1108–1114. | ||
Hillebrand S, Gast KB, de Mutsert R, et al. Heart rate variability and 1st cardiovascular event in populations without known cardiovascular disease: meta-analysis and dose-response meta-regression. Europace. 2013;15(5):742–749. | ||
Bomhof-Roordink H, Seldenrijk A, van Hout HP, van Marwijk HW, Diamant M, Penninx BW. Associations between life stress and subclinical cardiovascular disease are partly mediated by depressive and anxiety symptoms. J Psychosom Res. 2015;78(4):332–339. | ||
Dalack GW, Roose SP. Perspectives on the relationship between cardiovascular disease and affective disorder. J Clin Psychiatry. 1990;51(suppl 7):4–9. | ||
Ashwell M, Gibson S. Waist-to-height ratio as an indicator of ‘early health risk’: simpler and more predictive than using a ‘matrix’ based on BMI and waist circumference. BMJ Open. 2016;6(3):e010159. | ||
Van Strien T, Rookus MA, Bergers GP, Frijters JE, Defares PB. Life events, emotional eating, and change in body mass index. Int J Obes. 1986;10(1):29–35. | ||
Greeno CG, Wing RR. Stress-induced eating. Psychol Bull. 1994;115(3):444–464. | ||
Kivimaki M, Head J, Ferrie JE, et al. Work stress, weight gain and weight loss: evidence for bidirectional effects of job strain on body mass index in the Whitehall II study. Int J Obes (Lond). 2006;30(6):982–987. | ||
Block JP, He Y, Zaslavsky AM, Ding L, Ayanian JZ. Psychosocial stress and change in weight among US adults. Am J Epidemiol. 2009;170(2):181–192. | ||
Rookus MA, Burema J, Frijters JE. Changes in body mass index in young adults in relation to number of life events experienced. Int J Obes. 1988;12(1):29–39. | ||
Rose G, Bengtsson C, Dimberg L, Kumlin L, Eriksson B. Life events, mood, mental strain and cardiovascular risk factors in Swedish middle-aged men. Data from the Swedish part of the Renault/Volvo Coeur Study. Occup Med (Lond). 1998;48(5):329–336. | ||
Sobal J, Rauschenbach B, Frongillo EA. Marital status changes and body weight changes: a US longitudinal analysis. Soc Sci Med. 2003;56(7):1543–1555. | ||
Barry D, Petry N. Gender differences in associations between stressful life events and body mass index. Prev Med. 2008;47(5):498–503. | ||
Brown GW, Harris TO. Social Origins of Depression. London, England: Tavistock; 1978. | ||
Harding JL, Backholer K, Williams ED, et al. Psychosocial stress is positively associated with body mass index gain over 5 years: evidence from the longitudinal AusDiab study. Obesity (Silver Spring). 2014;22(1):277–286. | ||
Harkness KL, Alavi N, Monroe SM, Slavich GM, Gotlib IH, Bagby RM. Gender differences in life events prior to onset of major depressive disorder: the moderating effect of age. J Abnorm Psychol. 2010;119(4):791–803. | ||
Brown GW, Harrington TO. Life Events and Illness. New York, NY: Guilford Press; 1989. | ||
Proper KI, Picavet HS, Bogers RP, Verschuren WM, Bemelmans WJ. The association between adverse life events and body weight change: results of a prospective cohort study. BMC Public Health. 2013;13:957. |
 © 2017 The Author(s). This work is published and licensed by Dove Medical Press Limited. The full terms of this license are available at https://www.dovepress.com/terms.php and incorporate the Creative Commons Attribution - Non Commercial (unported, v3.0) License.
By accessing the work you hereby accept the Terms. Non-commercial uses of the work are permitted without any further permission from Dove Medical Press Limited, provided the work is properly attributed. For permission for commercial use of this work, please see paragraphs 4.2 and 5 of our Terms.
© 2017 The Author(s). This work is published and licensed by Dove Medical Press Limited. The full terms of this license are available at https://www.dovepress.com/terms.php and incorporate the Creative Commons Attribution - Non Commercial (unported, v3.0) License.
By accessing the work you hereby accept the Terms. Non-commercial uses of the work are permitted without any further permission from Dove Medical Press Limited, provided the work is properly attributed. For permission for commercial use of this work, please see paragraphs 4.2 and 5 of our Terms.