")
Back to Journals » Patient Preference and Adherence » Volume 10
Which kind of psychometrics is adequate for patient satisfaction questionnaires?
Authors Konerding U
Received 9 May 2016
Accepted for publication 25 July 2016
Published 5 October 2016 Volume 2016:10 Pages 2083—2090
DOI https://doi.org/10.2147/PPA.S112398
Checked for plagiarism Yes
Review by Single anonymous peer review
Peer reviewer comments 3
Editor who approved publication: Dr Johnny Chen
Uwe Konerding
Trimberg Research Academy, University of Bamberg, Bamberg, Germany
Abstract: The construction and psychometric analysis of patient satisfaction questionnaires are discussed. The discussion is based upon the classification of multi-item questionnaires into scales or indices. Scales consist of items that describe the effects of the latent psychological variable to be measured, and indices consist of items that describe the causes of this variable. Whether patient satisfaction questionnaires should be constructed and analyzed as scales or as indices depends upon the purpose for which these questionnaires are required. If the final aim is improving care with regard to patients’ preferences, then these questionnaires should be constructed and analyzed as indices. This implies two requirements: 1) items for patient satisfaction questionnaires should be selected in such a way that the universe of possible causes of patient satisfaction is covered optimally and 2) Cronbach’s alpha, principal component analysis, exploratory factor analysis, confirmatory factor analysis, and analyses with models from item response theory, such as the Rasch Model, should not be applied for psychometric analyses. Instead, multivariate regression analyses with a direct rating of patient satisfaction as the dependent variable and the individual questionnaire items as independent variables should be performed. The coefficients produced by such an analysis can be applied for selecting the best items and for weighting the selected items when a sum score is determined. The lower boundaries of the validity of the unweighted and the weighted sum scores can be estimated by their correlations with the direct satisfaction rating. While the first requirement is fulfilled in the majority of the previous patient satisfaction questionnaires, the second one deviates from previous practice. Hence, if patient satisfaction is actually measured with the final aim of improving care with regard to patients’ preferences, then future practice should be changed so that the second requirement is also fulfilled.
Keywords: patient satisfaction, questionnaires, psychometrics, reliability, validity, measurement, methodology
Introduction
Patient satisfaction with care plays an important role in establishing a causal relationship between patients’ preferences and patients’ adherence. The extent to which care corresponds to the patients’ preferences will essentially determine satisfaction, and satisfaction, in turn, will presumably essentially determine whether patients adhere to the medical treatment and to the institution which provides the care. In addition to this, satisfaction in itself is an important outcome of care. Hence, there is a strong need to maximize satisfaction, and, consequently, a strong need to measure patient satisfaction with care adequately. Accordingly, numerous questionnaires addressing patient satisfaction have meanwhile been presented. In a recent review,1 33 different questionnaires were mentioned, and there are more patient satisfaction questionnaires not included in this review.
Like all other measurement instruments, patient satisfaction questionnaires should be reliable, that is, they should be associated with as little measurement error as possible, and they should be valid, that is, they should measure what they are supposed to measure. To demonstrate reliability and validity, psychometric analyses are usually performed with each newly presented patient satisfaction questionnaire. These psychometric analyses mostly conform to a similar pattern. This includes performing a principal component analysis (PCA), an exploratory factor analysis (EFA), and/or a confirmatory factor analysis (CFA) with the individual questionnaire items and computing Cronbach’s alpha for the different components or factors.2–23 There are also some contributions in which Rasch analyses have been performed.24–26 In this paper, these approaches are discussed critically. To this end, at first, a general conception pertaining to multi-item measurement questionnaires is introduced; subsequently, the measurement of patient satisfaction is discussed on the basis of this conception; and, finally, conclusions are drawn from this discussion.
General conception
Multi-item questionnaires, which aim at producing quantitative values for one or more latent psychological variables, can be classified into two categories: 1) scales and 2) indices. These two kinds of questionnaires differ with regard to the direction of the relationship between the latent psychological variables and the individual items: in scales, the items are effects of the latent variables; in indices, they are causes27–29 (Figure 1).
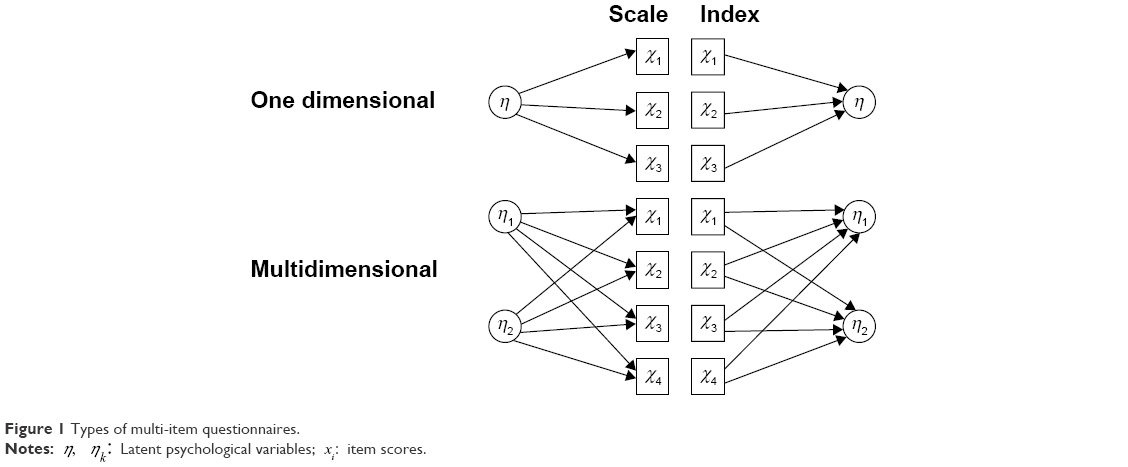 | Figure 1 Types of multi-item questionnaires. |
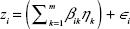
A paradigmatic example of a scale is a test addressing mathematical intelligence. Such a test usually consists of several mathematical tasks. The latent variable “mathematical intelligence” is defined as a construct which determines how well the individual tasks are solved. There are different forms of specifying the relationship between a latent variable and an effect item mathematically. When the response to the item can be understood as a variable that possesses at least interval scale level, the simplest formulation is
|
|

where zi is the z-transformed score of item i, η the latent psychological variable, βi a coefficient which reflects how strongly the latent psychological variable influences item i, and ∈i an error variable. In this equation, η is assumed to be distributed with a zero mean and a variance equal to one, and ∈i with a zero mean and a zero correlation with η. This formulation is identical with the model, which is presupposed in PCA, EFA, and CFA when only the first factor is extracted or, respectively, considered.30 This model refers to z-transformed values and to η distributed with a zero mean and a variance equal to one because, in this case, no additive parameter is required in the formulation and βi is then equal to the correlation between the latent and the observed variable.
A slightly more complicated, but, in most cases, more adequate formulation than Equation 1 would be a model from item response theory (IRT), such as the Rasch model. In such a model, the probabilities of achieving a specific level for the item are predicted.31
Scales can be multidimensional (Figure 1). There might be, for example, two different latent psychological variables, “mathematical intelligence” and “verbal intelligence”, which affect the items of the same test in a different manner. To be specific, verbal intelligence might have no influence on mere algebraic tasks, but some influence on tasks in which a problem is verbally described. With analogous presuppositions as in the description of the one-dimensional case, the simplest mathematical specification of an item influenced by more than one latent psychological variable is
|
|
where m is the number of different latent psychological variables, ηk is the latent psychological variable k, and βik is a coefficient, which reflects how much the latent psychological variable k influences item i. The latent psychological variable is again defined to be distributed with zero mean and a variance of one. The remaining two parameters have the same meaning as in Equation 1. The model described by Equation 2 is the model upon which PCA, EFA, and CFA are based when two or more than two variables are extracted or, respectively, considered.30 In the multidimensional case, a model from IRT, such as a multidimensional Rasch model, would also be possible.32
Paradigmatic examples of indices are instruments addressing health-related quality of life. The items of these indices are selfclassifiers, which address different aspects of health, such as the ability to move or pain. Health-related quality of life does not determine the ability to move or pain. On the contrary, the ability to move and pain determine health-related quality of life. The simplest mathematical specification of items influencing the latent psychological variable is
|
|
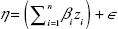
where n is the number of items included in the questionnaire, βi a coefficient which reflects how much the feature described by item i affects the latent psychological variable, and ∈ an error variable with zero mean and zero correlation with the term in brackets. The terms η and zi have the same meaning as in Equations 1 and 2, that is, η is defined to be distributed with zero mean and a variance equal to one and zi is the z-transformed response to item i. As in Equations 1 and 2, this definition and this transformation are applied to make an additive parameter in the model unnecessary.
There can also be multidimensional indices (Figure 1). Such indices would emerge if the items of a multi-item questionnaire are causes of different latent psychological variables. An example might be a questionnaire with items referring to different aspects of the health state which, in turn, have a different impact on different domain-related forms of health-related quality of life, such as health-related quality of life experienced in the vocational context and health-related quality of life experienced in leisure time. The simplest mathematical specification of the idea that the same items influence different latent psychological variables is
|
|
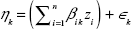
where ηk is the latent psychological variable k, βik a coefficient that reflects how much the aspect addressed by item i affects the latent psychological variable k, and ∈k an error variable with zero mean and zero correlation with the term in brackets. Again, the latent psychological variable is defined to be distributed with zero mean and a variance of one. The remaining terms have the same meaning as in Equation 3.
Scale models as described in Equations 1 and 2 have completely different implications for the relationships between the item scores than the index models as described in Equations 3 and 4. The model of a one-dimensional scale as described in Equation 1 implies that the scores of the individual items correlate with each other. The higher the coefficients βi are, the higher the correlations between the item scores must be. The model of a multidimensional scale as described in Equation 2 implies a specific pattern of correlations between the item scores. The more the coefficients βik for two different items are similar, the more these two different items must correlate. In a similar way, any model of IRT implies a specific structure within the probabilities of solving, or respectively, endorsing the item. In contrast, the models for indices (Equations 3 and 4) imply nothing at all for the relationships between the individual item scores. Two items that do not correlate at all may both have the same impact on the latent psychological variable. For example, experiencing pain and being unable to move are two states which can very well exist independently from each other; but both states have an extreme impact on health-related quality of life.
Because of the differences regarding the relationships between the individual items, statistics based upon these relationships have completely different meanings for scales and for indices. When a scale model holds, the relationships between the items are determined by the latent psychological variables. Therefore, in this case, Cronbach’s alpha is a characteristic of the measurement instrument and can be expected to be stable across different studies, as long as the variances of the sum scores are the same in these different studies. This stability across different studies is one necessary condition for Cronbach’s alpha being interpreted as the lower boundary of the sum score’s reliability. In contrast, when an index model holds, the correlations between the items are not determined by the latent psychological variable. Therefore, in this case, Cronbach’s alpha is not a characteristic of the measurement instrument and cannot be expected to be stable across different studies, even when the variances of the sum scores are the same in these different studies. In this case, Cronbach’s alpha reflects nothing about the sum score’s reliability.
For PCAs, EFAs, and CFAs, the argumentation is analogous. When the multidimensional scale model as described in Equation 2 holds, then the correlations between the items reflect the influences of the different latent psychological variables on the items and, accordingly, the results of PCAs, EFAs, or CFAs reflect these influences. For this reason, the results of PCAs, EFAs, or CFAs constitute characteristics of the measurement instrument and can be expected to be similar in different studies. In contrast, when a multidimensional index model as described by Equation 4 holds, then the correlations between the item scores are not determined by the latent psychological variables. For this reason, the results of PCAs, EFAs, or CFAs cannot reflect anything about these variables. Moreover, these results do not constitute characteristics of the measurement instrument and cannot be expected to correspond to each other in different studies. When an index model holds, the results of PCAs, EFAs, or CFAs only reflect features of the context in which the study is applied, but not features of the latent psychological variables.
For models of IRT, the argumentation is analogous. When an IRT model holds, this implies a certain structure within the probabilities of solving or, respectively, endorsing the items. The parameters of the IRT model can be identified on the basis of this structure, and the relationships between the item parameters of the model can be expected to be more or less the same in all person samples for which the model holds. This should be the case independently of the context in which the study is performed. In this sense, the item parameters determined for the IRT model constitute features of the measurement instrument. If, however, an IRT model is applied when it is actually an index model that holds, then the item parameters will vary with the context in which the study is performed. Moreover, the IRT model cannot be expected to fit to data at all. Accordingly, when it is actually an index model that holds, analyses with an IRT model make no sense.
Because scale and index models differ with regard to their implications for the relationships between the items, Equations 1 and 2 have a completely different epistemological function than Equations 3 and 4. Equations 1 and 2 constitute basic models of statistical procedures with which the model parameters can be estimated from the correlations between the items, that is they constitute the basic models of PCA, EFA, and CFA. As, in contrast, Equations 3 and 4 imply nothing for the correlations between the items, the parameters within these equations cannot be determined solely on the basis of these correlations. The multiplicative parameters in Equations 3 and 4 can, however, be determined when a preliminary measurement of the latent variable is also at hand. In this case, a multivariate linear regression analysis with the preliminary measure of the latent variable as the dependent variable and the items as independent variables can be performed. For Equation 3, this would be one single analysis and for Equation 4, as many analyses as different latent variables are considered. The standardized multiplicative parameters obtained in these analyses would be estimations of the multiplicative parameters in Equations 3 and 4.
The quality of the estimations provided by the multiple regression analysis depends upon the psychometric properties of the preliminary measure of the latent psychological variable. According to classical test theory,33 this preliminary measure is a sum of true value and error. For the analyses presupposed here, the true values should correlate as high as possible with the latent psychological variable in question. If this is the case and if, additionally, a large number of cases are included in the multiple linear regression analysis, then the multiplicative coefficients can be estimated quite accurately, even when the preliminary measure of the latent psychological variable is not particularly reliable. Apart from those biases which result from the true values of the preliminary measure being insufficiently correlated with the latent variable, the accuracy of the estimations can be judged by the corresponding standard errors obtained from the multiple linear regression analysis.
When the estimations are sufficiently accurate, the multiplicative coefficients can be applied for selecting those items which best address the latent psychological variable. Moreover, the unstandardized coefficients of the multiple linear regression can be applied as weights for the item scores. The sum of the weighted item scores can be expected to be more valid than the sum of the unweighted scores and more reliable than the preliminary measure of the latent psychological variable.
The preliminary measure of the latent psychological variable can also be applied for investigating the validity of both unweighted and weighted sum scores. The correlations between both scores with the preliminary measure are estimations of the lower boundaries of the validities of both scores. If the validity of the weighted sum score is estimated with the same data that have been applied for determining the weights by a multivariate linear regression, then this correlation can be computed by drawing the square root of the corresponding squared multiple correlation coefficient. As the validity of a measurement instrument cannot be higher than the square root of its reliability,33 the squared estimations of the validity can also be taken as estimations of the lower boundary of reliability.
Patient satisfaction questionnaires
Based upon the general conception just described, two questions will now be discussed:
- Are present patient satisfaction questionnaires scales or indices?
- Should future patient satisfaction questionnaires be constructed and analyzed as scales or as indices?
Present patient satisfaction questionnaires
To decide whether present patient satisfaction questionnaires are scales or indices, the causal relationships between the individual items of these questionnaires and patient satisfaction must be inspected. This will be done for two examples: 1) the Client Satisfaction Questionnaire with eight items (CSQ-8) of De Wilde and Hendriks5 and 2) the Patient Assessment of Health Care for Outpatients (O-PAHC) of Webster et al.22 The analysis will be performed from two different perspectives: 1) only the content of the items is considered, and 2) additionally, psychological processes which might affect the responses to the items.
Investigating the CSQ-8 from the first perspective yields mixed results. The CSQ-8 contains two items, which are neither effect nor causal items, that is, “How satisfied are you with the amount of help you have received?” and “In an overall, general sense, how satisfied are you with the service you have received?”. These items directly address special types of satisfaction themselves. Two further items are clearly effect items, that is, “If a friend were in need of similar help, would you recommend our programme to him or her?” and “If you were to seek help again, would you come back to our programme?”. The remaining four items are “How would you rate the quality of service received?”, “Did you get the kind of service you wanted?”, “To what extent has our programme met your needs?”, and “Have the services you received helped you to deal more effectively with your problems?”. These items can be seen as addressing causes of satisfaction.
Investigating the 14 items of O-PAHC from the first perspective yields uniform results. Three of these items address whether the nurses “treat with courtesy and respect”, “listen carefully”, and “explain things in an understandable way”; three items address the same features of behavior for the doctors; four items address different aspects of the staff’s communication regarding the disease and the treatment; and two items address the tidiness of the location. Hence, all these items refer to possible causes of satisfaction.
If one investigates present patient satisfaction questionnaires by only considering the content of the items, then most of the present questionnaires exclusively consist of causal items,3–4,8–18,22–23 that is, these questionnaires would be classified as indices. There are, however, also several questionnaires in which different kinds of items are applied together.2,5–7,19–21 These questionnaires cannot be clearly classified as either scales or indices. However, in all of these questionnaires, the majority of the items address causes. Hence, these questionnaires would rather be classified as being indices than scales.
If one additionally takes into consideration that different psychological processes affect the responses to the items, a clear categorization of the items becomes more complicated. It is well known that human judgments are not only determined by the object to be judged but also by the cognitive system of the judge.34 One effect that is produced by this cognitive system is the so-called halo effect.35 For example, judges might answer different concrete questions regarding a specific object quite positively when they have a generally positive attitude toward this object, and quite negatively in the opposite case. In the context of patient satisfaction questionnaires, this might mean that the patients answer all items positively without caring much about the specific contents of the items when they have a generally good feeling about the care, and all items negatively in the opposite case. The more difficult the individual items are to answer, the more a halo effect will work. When such a halo effect exists, all items that address a possible cause of satisfaction are also, to a certain extent, effect items. Hence, when such halo effects are also taken into consideration, no present patient satisfaction questionnaire can be unambiguously classified as either a scale or an index.
Future patient satisfaction questionnaires
There is no adequate psychometric approach for mixtures between scales and indices.28 Hence, a decision must be made. This decision regards both the selection of the items and the psychometric treatment of these items. Presumably, the best way to come to this decision is by referring to the purpose for which patient satisfaction questionnaires are needed. There might, of course, be different purposes and these different purposes might imply different specifications. However, in this paper, only one purpose is considered: improving care with regard to patients’ preferences. To fulfill this purpose, one needs to know both the level of satisfaction and the possible reasons of this level. In other words, one needs good index measurement instruments. This implies that only items referring to possible causes of patient satisfaction should be selected, that the universe of possible causes of patient satisfaction should be covered as fully as possible by the items selected, and that the individual items should be formulated so clearly and concretely that they can easily be answered by the patients without resorting to their general feeling of satisfaction. Moreover, the decision for constructing an index implies that those psychometric analyses should be applied, which have been proposed earlier for indices.
As outlined earlier, reasonable psychometric analyses for indices require a preliminary measurement of the latent psychological variables to be at hand. For patient satisfaction, the best preliminary measurement is, presumably, a direct rating of satisfaction performed by the patients. This direct rating might not be particularly reliable, but it directly addresses what is meant to be measured by the index. If only one satisfaction dimension is considered, the patients should be asked for a rating of overall satisfaction; in the multidimensional case, the patients should be asked for ratings of the different domain-specific satisfactions such as satisfaction with the physicians, satisfaction with the nurses, and satisfaction with the locality. With such direct ratings of satisfaction, items can be selected and the weights for weighted sum scores can be estimated by multivariate linear regression. Moreover, the validity of both the unweighted and the weighted sum scores can be estimated by the correlations between these sum scores and the rating. Some authors of previous publications about patient satisfaction have already analyzed the relationships between sum scores and direct assessments of satisfaction,12,13,15,18,22,36 but only some of them13,18,22 explicitly described this as a test of validity. In a similar way, some authors of previous publications have computed multivariate linear regressions with the items as independent variables and a global satisfaction rating as a dependent variable,4,15,36 but without using the results of these computations as scoring weights.
As the models described by Equations 3 and 4 only constitute the simplest specifications of the idea of items affecting latent psychological variables, there are still more multivariate models that could fruitfully be applied in this context, for example, models with nonlinear relationships or with interactions between the predictor variables.28 These models might lead to still more valid scoring rules for the index and to a better understanding of how the different aspects of care actually affect patient satisfaction.
When patient satisfaction questionnaires are constructed as indices as proposed here, then Cronbach’s alphas do not reflect any characteristics of these questionnaires and, therefore, do not provide any information about these instruments’ reliability. Hence, Cronbach’s alpha should not be used for estimating the reliability of these patient satisfaction questionnaires. Moreover, striving for indices with high Cronbach’s alphas makes little sense. When the items of an index are meant to optimally cover the universe of possible causes of satisfaction, then these items must be, by and large, independent from each other. Striving for this condition would mean minimizing and not maximizing Cronbach’s alpha.37,38
Mathematically it is possible to perform PCAs, EFAs, or CFAs with the individual items of indices constructed as proposed here. These analyses, however, do not provide any information about the characteristics of the measurement instrument, but rather about the context in which the measurement instrument is applied. If the results of PCAs, EFAs, or CFAs applied to patient satisfaction questionnaires are interpreted in this way, they can be valuable. For example, the questionnaire might contain several items addressing the behavior of the nurses and of the physicians. Imagine further that this questionnaire is applied in two different studies performed in the wards of two different hospitals. Imagine also that, in one of these hospitals, nurses and physicians act quite independently from each other, whereas in the other hospital, they act very closely together. This might be reflected by the PCAs, EFAs, or CFAs performed in both studies. In one study, the items for the nurses’ behavior would be associated with a different component or factor than the items for the physicians’ behavior, whereas both sets of items would be associated with the same component or factor in the other study. In this way, the results of PCAs, EFAs, or CFAs can be applied to detect context-specific dependencies or independencies between the different possible causes of patient satisfaction.
Mathematically, it is also possible to compute an IRT model for the items of an index. However, as the structure between the probabilities of endorsing the items is not determined by one or more than one latent psychological variables when an index model holds, the results of such computations have no reasonably interpretable meaning. Therefore, IRT models should not be applied for patient satisfaction questionnaires when they are constructed and meant as proper indices.
Conclusion
If one wants to measure patient satisfaction with the final aim of improving care with regard to the patients’ preferences, then patient satisfaction questionnaires should be constructed as indices. In fact, most previous patient satisfaction questionnaires actually are rather indices than scales. When patient satisfaction questionnaires are constructed as proper indices, then their reliability cannot be determined using Cronbach’s alpha; PCAs, EFAs, or CFAs performed with such questionnaires do not provide information about the characteristics of the measurement instrument, but rather about the context in which the instrument is applied; and IRT models, such as the Rasch model, should not be applied. For proper indices of patient satisfaction, items can be selected and weights for items can be determined using a multiple linear regression with a direct rating of satisfaction as the dependent variable and the individual items as independent variables. The weighted sum score formed with these weights can be expected to be a more valid measure of satisfaction than both direct rating and the unweighted sum score. The validity of both unweighted and weighted sum scores of patient satisfaction indices can be estimated by their correlations with direct assessments of satisfaction. The squares of these correlations will also constitute lower boundaries of the sum scores’ reliability.
Acknowledgments
The author would like to thank Peter Bereza for proofreading the manuscript. He would also like to thank Karin Kampmann for discussing the subject with him and for all that she has done for him.
Disclosure
The author reports no conflicts of interest in this work.
References
Almeida RS, Bourliataux-Lajoinie S, Martins M. Satisfaction measurement instruments for healthcare service users: a systematic review. Cad Saude Publica. 2015;31(1):11–25. | ||
Bitzer EM, Volkmer S, Petrucci M, Weissenrieder N, Dierks ML. Patient satisfaction in pediatric outpatient settings from the parents’ perspective – the Child ZAP: a psychometrically validated standardized questionnaire. BMC Health Serv Res. 2012;12:347. | ||
Clark C, Young MS, Jackson E, et al. Consumer perceptions of integrated trauma-informed services among women with co-occurring disorders. J Behav Health Serv Res. 2008;35(1):71–90. | ||
Coluccia A, Ferretti F, Pozza A. Health Services OutPatient Experience questionnaire: factorial validity and reliability of a patient-centered outcome measure for outpatient settings in Italy. Patient Relat Outcome Meas. 2014;5:93–103. | ||
De Wilde EF, Hendriks VM. The Client Satisfaction Questionnaire: psychometric properties in a Dutch addict population. Eur Addict Res. 2005;11(4):157–162. | ||
Dyer N, Sorra JS, Smith SA, Cleary PD, Hays RD. Psychometric properties of the Consumer Assessment of Healthcare Providers and Systems (CAHPS) Clinician and Group Adult Visit Survey. Med Care. 2012;50 Suppl:S28–S34. | ||
Erci B, Ciftcioglu S. Psychometric evaluation of the primary health-care satisfaction scale in Turkish women. Int J Qual Health Care. 2010;22(6):500–506. | ||
Goel S, Sharma D, Singh A. Development and validation of a patient satisfaction questionnaire for outpatients attending health centres in North Indian cities. J Health Serv Res Policy. 2014;19(2):85–93. | ||
Gonzalez N, Quintana JM, Bilbao A, et al. Development and validation of an in-patient satisfaction questionnaire. Int J Qual Health Care. 2005;17(6):465–472. | ||
Lam WW, Fielding R, Chow L, Chan M, Leung GM, Ho EY. The Chinese medical interview satisfaction scale-revised (C-MISS-R): development and validation. Qual Life Res. 2005;14(4):1187–1192. | ||
Latour JM, Duivenvoorden HJ, Hazelzet JA, van Goudoever JB. Development and validation of a neonatal intensive care parent satisfaction instrument. Pediatr Crit Care Med. 2012;13(5):554–559. | ||
Meehan T, Bergen H, Stedman T. Monitoring consumer satisfaction with inpatient service delivery: the Inpatient Evaluation of Service Questionnaire. Aust N Z J Psychiatry. 2002;36(6):807–811. | ||
Milutinović D, Simin D, Brkić N, Brkić S. The patient satisfaction with nursing care quality: the psychometric study of the Serbian version of PSNCQ questionnaire. Scand J Caring Sci. 2012;26(3):598–606. | ||
Moret L, Nguyen JM, Pillet N, Falissard B, Lombrail P, Gasquet I. Improvement of psychometric properties of a scale measuring inpatient satisfaction with care: a better response rate and a reduction of the ceiling effect. BMC Health Serv Res. 2007;7:197. | ||
Otani K, Kurz RS, Harris LE. Managing primary care using patient satisfaction measures. J Healthc Manag. 2005;50(5):311–324. | ||
Schroder A, Ahlström G, Wilde-Larsson B, Lundqvist LO. Psychometric properties of the quality in psychiatric care – outpatient (QPC-OP) instrument. Int J Ment Health Nurs. 2011;20(6):445–453. | ||
Soufi G, Belayachi J, Himmich S, et al. Patient satisfaction in an acute medicine department in Morocco. BMC Health Serv Res. 2010;10:149. | ||
Tso IF, Ng SM, Chan CLW. The development and validation of the concise outpatient department user satisfaction scale. Int J Qual Health Care. 2006;18(4):275–280. | ||
Vanti C, Monticone M, Ceron D, et al. Italian version of the physical therapy patient satisfaction questionnaire: cross-cultural adaptation and psychometric properties. Phys Ther. 2013;93(7):911–922. | ||
Vanti C, Pillastrini P, Monticone M, et al. The Italian version of the Physical Therapy Patient Satisfaction Questionnaire – [PTPSQ-I(15)]: psychometric properties in a sample of inpatients. BMC Musculoskelet Disord. 2014;15:135. | ||
Vuković M, Gvozdenović BS, Gajić T, Stamatović Gajić B, Jakovljević M, McCormick BP. Validation of a patient satisfaction questionnaire in primary health care. Public Health. 2012;126(8):710–718. | ||
Webster TR, Mantopoulos J, Jackson E, et al. A brief questionnaire for assessing patient healthcare experiences in low-income settings. Int J Qual Health Care. 2011;23(3):258–268. | ||
Wei J, Wang XL, Yang HB, Yang TB. Development of an In-Patient Satisfaction Questionnaire for the Chinese Population. PLoS One. 2015;10(12):e0144785. | ||
Jean-Pierre P, Cheng Y, Paskett E, Shao C, Fiscella K, Winters P. Patient Navigation Research Program. Item response theory analysis of the patient satisfaction with cancer-related care measure: a psychometric investigation in a multicultural sample of 1,296 participants. Support Care Cancer. 2014;22(8):2229–2240. | ||
Solari A, Grzeda M, Giordano A, et al. On behalf of the SIMS-Trial, SIMS-Practice and Agorà studies. Use of Rasch analysis to refine a patient-reported questionnaire on satisfaction with communication of the multiple sclerosis diagnosis. Mult Scler. 2014;20(9):1224–1233. | ||
Ottonello M, Franchignoni F, Giordano A, Benevolo E. Patient satisfaction with hospital rehabilitation: validation of the SAT-16 questionnaire through Rasch analysis. Minerva Med. 2012;103(1):1–11. | ||
Fayers PM, Hand DJ. Factor analysis, causal indicators and quality of life. Qual Life Res. 1997;6(2):139–150. | ||
Fayers PM, Hand DJ. Causal variables, indicator variables and measurement scales: an example from quality of life. J R Stat Society (Stat Soc) Series A. 2002;165(Pt 2):233–261. | ||
Streiner DL. Being inconsistent about consistency: when coefficient alpha does and doesn’t matter. J Pers Assess. 2003;80(3):217–222. | ||
Bartholomew DJ, Steele F, Moustaki I, Galbraith J. Analysis of Multivariate Social Science Data. Statistics in the Social and Behavioral Sciences Series. 2nd ed. Boca Raton, FL: Chapman and Hall/CRC; 2008. | ||
Embretson SE, Reise SP. Item Response Theory for Psychologists (Multivariate Applications Series). 1st ed. New York, NY: Psychology Press; 2009. | ||
Von Davier M, Carstensen CH. Multivariate and Mixture Distribution Rasch Models: Extensions and Applications (Statistics for Social and Behavioral Sciences). New York, NY: Springer; 2007. | ||
Allen MJ, Yen WM. Introduction to Measurement Theory. 2nd ed. LongGrove, IL: Waveland Press; 2002. | ||
Bless H. Social Cognition: How Individuals Construct Reality: Social Psychology. Hove: Publisher-Psychology Press; 2004. | ||
Feeley TH. Comment on halo effects in rating and evaluation research [Special issue: statistical and methodological issues in communication research]. Hum Commun Res. 2002;28(4):578–586. | ||
Sjetne IS, Bjertnaes OA, Olsen RV, Iversen HH, Bukholm G. The Generic Short Patient Experiences Questionnaire (GS-PEQ): identification of core items from a survey in Norway. BMC Health Serv Res. 2011;11:88. | ||
Heyland DK, Jiang X, Day AG, Cohen SR. Canadian Researchers at the End of Life Network (CARENET). The development and validation of a shorter version of the Canadian Health Care Evaluation Project Questionnaire (CANHELP Lite): a novel tool to measure patient and family satisfaction with end-of-life care. J Pain Symptom Manage. 2013;46(2):289–297. | ||
Konerding U. What does Cronbach’s alpha tell us about the EQ-5D? A methodological commentary to “Psychometric properties of the EuroQol Five-Dimensional Questionnaire (EQ-5D-3L) in caregivers of autistic children”. Qual Life Res. 2013;22(10):2939–2940. |
 © 2016 The Author(s). This work is published and licensed by Dove Medical Press Limited. The full terms of this license are available at https://www.dovepress.com/terms.php and incorporate the Creative Commons Attribution - Non Commercial (unported, v3.0) License.
By accessing the work you hereby accept the Terms. Non-commercial uses of the work are permitted without any further permission from Dove Medical Press Limited, provided the work is properly attributed. For permission for commercial use of this work, please see paragraphs 4.2 and 5 of our Terms.
© 2016 The Author(s). This work is published and licensed by Dove Medical Press Limited. The full terms of this license are available at https://www.dovepress.com/terms.php and incorporate the Creative Commons Attribution - Non Commercial (unported, v3.0) License.
By accessing the work you hereby accept the Terms. Non-commercial uses of the work are permitted without any further permission from Dove Medical Press Limited, provided the work is properly attributed. For permission for commercial use of this work, please see paragraphs 4.2 and 5 of our Terms.