")
Back to Journals » International Journal of Chronic Obstructive Pulmonary Disease » Volume 17
When Treatment of Pulmonary Emphysema with Endobronchial Valves Did Not Work: Evaluation of Quantitative CT Analysis and Pulmonary Function Tests Before and After Valve Explantation
Authors Leppig JA, Song L, Voigt DC, Feldhaus FW , Ruwwe-Gloesenkamp C, Saccomanno J, Lassen-Schmidt BC , Neumann K , Leitner K, Hubner RH, Doellinger F
Received 5 April 2022
Accepted for publication 17 September 2022
Published 11 October 2022 Volume 2022:17 Pages 2553—2566
DOI https://doi.org/10.2147/COPD.S367667
Checked for plagiarism Yes
Review by Single anonymous peer review
Peer reviewer comments 3
Editor who approved publication: Professor Min Zhang
Jonas Alexander Leppig,1 Lan Song,2 Dorothea C Voigt,1 Felix W Feldhaus,1 Christoph Ruwwe-Gloesenkamp,3 Jacopo Saccomanno,3 Bianca C Lassen-Schmidt,4 Konrad Neumann,5 Katja Leitner,6 Ralf H Hubner,3 Felix Doellinger1
1Department of Radiology, Charité Universitätsmedizin Berlin, Berlin, Germany; 2Department of Radiology, Peking Union Medical College Hospital, Chinese Academy of Medical Sciences and Peking Union Medical College, Beijing, People’s Republic of China; 3Department of Internal Medicine/Infectious Diseases and Respiratory Medicine, Charité Universitätsmedizin Berlin, Berlin, Germany; 4Fraunhofer Institute for Digital Medicine MEVIS, Bremen, Germany; 5Institute of Biometrics and Clinical Epidemiology, Charité Universitätsmedizin Berlin, Berlin, Germany; 6Department of Internal Medicine, Kantonsspital Aarau AG, Aarau, Switzerland
Correspondence: Jonas Alexander Leppig, Department of Radiology, Charité Universitätsmedizin Berlin, Charité Campus Virchow-Klinikum, Augustenburger Platz 1, Berlin, 13353, Germany, Tel + 49 30 450 627 283, Fax + 49 30 450 527 911, Email [email protected]
Purpose: To investigate changes in quantitative CT analysis (QCT) and pulmonary function tests (PFT) in pulmonary emphysema patients who required premature removal of endobronchial valves (EBV).
Patients and Methods: Our hospital’s medical records listed 274 patients with high-grade COPD (GOLD stages 3 and 4) and pulmonary emphysema who were treated with EBV to reduce lung volume. Prior to intervention, a complete evaluation was performed that included quantitative computed tomography analysis (QCT) of scans acquired at full inspiration and full expiration, pulmonary function tests (PFT), and paraclinical findings (6-minute walking distance test (6MWDT) and quality of life questionnaires). In 41 of these 274 patients, EBV treatment was unsuccessful and the valves had to be removed for various reasons. A total of 10 of these 41 patients ventured a second attempt at EBV therapy and underwent complete reevaluation. In our retrospective study, results from three time points were compared: Before EBV implantation (BL), after EBV implantation (TP2), and after EBV explantation (TP3). QCT parameters included lung volume, total emphysema score (TES, ie, the emphysema index) and the 15th percentile of lung attenuation (P15) for the whole lung and each lobe separately. Differences in these parameters between inspiration and expiration were calculated (Vol. Diff (%), TES Diff (%), P15 Diff (%)). The results of PFT and further clinical tests were taken from the patient’s records.
Results: We found persistent therapy effect in the target lobe even after valve explantation together with a compensatory hyperinflation of the rest of the lung. As a result of these two divergent effects, the volume of the total lung remained rather constant. Furthermore, there was a slight deterioration of the emphysema score for the whole lung, whereas the TES of the target lobe persistently improved.
Conclusion: Interestingly, we found evidence that, contrary to our expectations, unsuccessful EBV therapy can have a persistent positive effect on target lobe QCT scores.
Keywords: chronic obstructive pulmonary disease, pulmonary emphysema, endobronchial valves, lung volume reduction, computed tomography, pulmonary function test
Introduction
Chronic Obstructive Pulmonary Disease
Chronic obstructive pulmonary disease (COPD) is a group of common progressive lung diseases that includes chronic bronchitis and pulmonary emphysema and affects about 2% of the world´s population. Accounting for more than 90% of cases, tobacco smoking is the most common exogenous cause of the development and progression of COPD, while endogenous factors such as α1-antitrypsin deficiency are rare. COPD correlates with the patient’s smoking history and typically manifests as chronic and irreversible pulmonary obstruction with characteristic airflow impairment, which is usually confirmed by spirometry.1–4
A wide range of preventive and therapeutic options are available including lifestyle modification and general treatment (eg, smoking cessation, vaccinations, pulmonary rehabilitation, vitamin D/calcium substitution, or oxygen therapy), drug treatment (eg, inhaled bronchodilators like parasympatholytics or β2-agonists, inhaled corticosteroids, PDE type 4 inhibitors), interventions (eg, endobronchial valves, coiling), and surgical options (eg, partial lung resection and lung transplantation).1,3–5
Pulmonary Function Test (PFT) and Quantitative Computed Tomography (QCT)
The (spirometric) pulmonary function test (PFT) is the gold standard for the diagnosis of COPD, therapy planning, and follow-up, identifying the typical pulmonary manifestations of the disease: hyperinflation, obstruction, and failure of complete expiration. COPD patients commonly show a reduced forced expiratory volume in one second (FEV1), an increased residual volume (RV), an increased total lung capacity (TLC), and a decreased FEV1/forced expiratory volume (FVC) ratio, reflecting their obstructive ventilation disorder. The downside of the PFT is that its validity depends on patients’ cooperation.
An additional tool that has gained popularity in clinical practice for diagnosis and disease monitoring in patients with pulmonary emphysema is quantitative computed tomography (QCT). Emphysematous lung destruction, hyperinflation, and air trapping are typical findings that can be captured by radiological imaging in COPD patients. Emphysematous lung tissue contains more air and less functional lung parenchyma; therefore, the attenuation measured in Hounsfield units (HU) is markedly and visibly decreased on CT scans. Literature found the strongest correlation between microscopically confirmed emphysema and QCT at −950 HU, thus it is generally accepted that the percentage area of lung with attenuation values lower than −950 Hounsfield units (HU) is a valid index of pulmonary emphysema at full inspiration.6
Another QCT finding in emphysema is a reduced difference in lung volume and CT attenuation between inspiration and expiration as a result of chronic hyperinflation and air trapping.7–10
Besides its diagnostic value, QCT provides helpful information for individual treatment planning, eg, for selection of the target lobe based on lobe-specific emphysema grading and interlobar emphysema heterogeneity or for ruling out compromising anatomical variants such as collateral ventilation. In conjunction with PFT, clinical evaluation, and COPD-related questionnaires, QCT is a robust and objective tool for postinterventional patient monitoring. Although QCT parameters are intuitively relevant and commonly used in clinical practice, there is disagreement about their actual relevance in the literature.11–13
Endobronchial Valves (EBV) and Collateral Ventilation (CV)
Numerous studies over the past 15 years have provided evidence for beneficial effects of endoscopic lung volume reduction (ELVR) using one-way endobronchial valves (EBV) as a therapeutic option in selected patients with severe pulmonary emphysema in advanced COPD. Typically, EBV are implanted to restrict airflow to the lobe with the most severe emphysematous destruction, ie, the lobe with the highest emphysema score in QCT. Furthermore, the data show that a lack of therapeutic effect of EBV treatment in most cases is due to the collateral ventilation (CV) phenomenon. In these patients, functional short-circuit airflow connections exist between adjacent lobes, and, as a result, occlusion of the proximal bronchial system with valves will not achieve (relevant) volume reduction of the target lobe. For this reason, functional bronchoscopic testing is performed in many patients prior to EBV implantation. Only CV-negative lung lobes, ie, those in which no functional short-circuit connections to adjacent lobes are detected, are then considered for valve implantation.14–27
When EBV is successful, the target lobe gets dystelectatic or atelectatic, decreases in volume, and allows the healthier rest of the lung to expand. In most cases, EBV insertion is successful, and patients show improvement in terms of lung function, exercise capacity, symptom severity and quality of life. Despite optimal patient selection, which includes selection of the target lobe based on QCT findings and functional testing of the target lobe to exclude CV, there are some patients in whom EBV therapy does not work, and no relevant volume reduction of the target lobe is achieved after the intervention. Due to recent literature, the most common cause of long-term valve dysfunction is the formation of granulation tissue.28 Usually, EBV are removed again. Other reasons for EBV explantation are complications such as infection, hemoptysis, chronic cough, and pneumothorax.6,14,15,19,20
Purpose
Approximately 15 years after the introduction of EBV, despite extensive patient selection, treatment failures persist, and the underlying cause usually remains unclear. Furthermore, our speculation is that in patients with unsuccessful EBV treatment, QCT and PFT findings develop worse after explantation than before implantation. The primary aim of our study was to investigate the effect of EBV explantation on QCT and PFT findings. A secondary aim was to identify possible factors that might predict failure of EBV implantation before the intervention in order to assign these patients to other therapy regimens. Finally, we reviewed patients who actually deteriorated after valve explantation to investigate whether the reason for failure can be found retrospectively. To our knowledge, this is the first study addressing these questions in patients after EBV explantation.
Materials and Methods
This study was approved by the local ethics committee/institutional review board (IRB; Charité Ethikkommission; Entscheid EA2/171/20). Patient consent to retrospective review of their medical records was not required by the ethics committee. Confidential and anonymous evaluation of patient data was guaranteed. The study was conducted in accordance with the Declaration of Helsinki.
Patient Selection and Study Design
Medical records were reviewed to identify patients with high-grade emphysema (GOLD III (30% ≤ FEV1 <50%) and GOLD IV (FEV1 <30%)) who underwent diagnostic workup in our hospital for deciding about further therapeutic management. Our research identified 274 patients treated by EBV insertion from September 2010 to April 2020, among them only 41 patients who had to have the valves removed because of complications (recurrent pneumothorax, valve dislocation, (infectious) exacerbation) or lack of clinical improvement (ie, no therapeutic response).
In this context, it is worth mentioning that although post-interventional pneumothorax is a complication, it can also be interpreted as a sign of a good early response to therapy, since it is usually a consequence of correct EBV implantation and its therapeutic effect. When the target lobe rapidly loses volume after valve implantation, the neighboring lung lobes may hyperexpand and occupy the freed-up space abruptly. Said sudden volume shifts between the individual lung lobes lead to strong tractions may cause tears of visceral pleura and lung parenchyma and may lead to pneumothoraces. Pneumothoraces resulting from EBV therapy do not seem to have a negative impact on further clinical development.29–31
A small share of 10 of these 41 patients who required EBV explantation desired a second attempt of EBV therapy (choosing a different lobe as the target lobe) and therefore underwent full re-evaluation including QCT, PFT, and clinical tests. Only this small subgroup was included in our retrospective analysis (Tables 1–3).
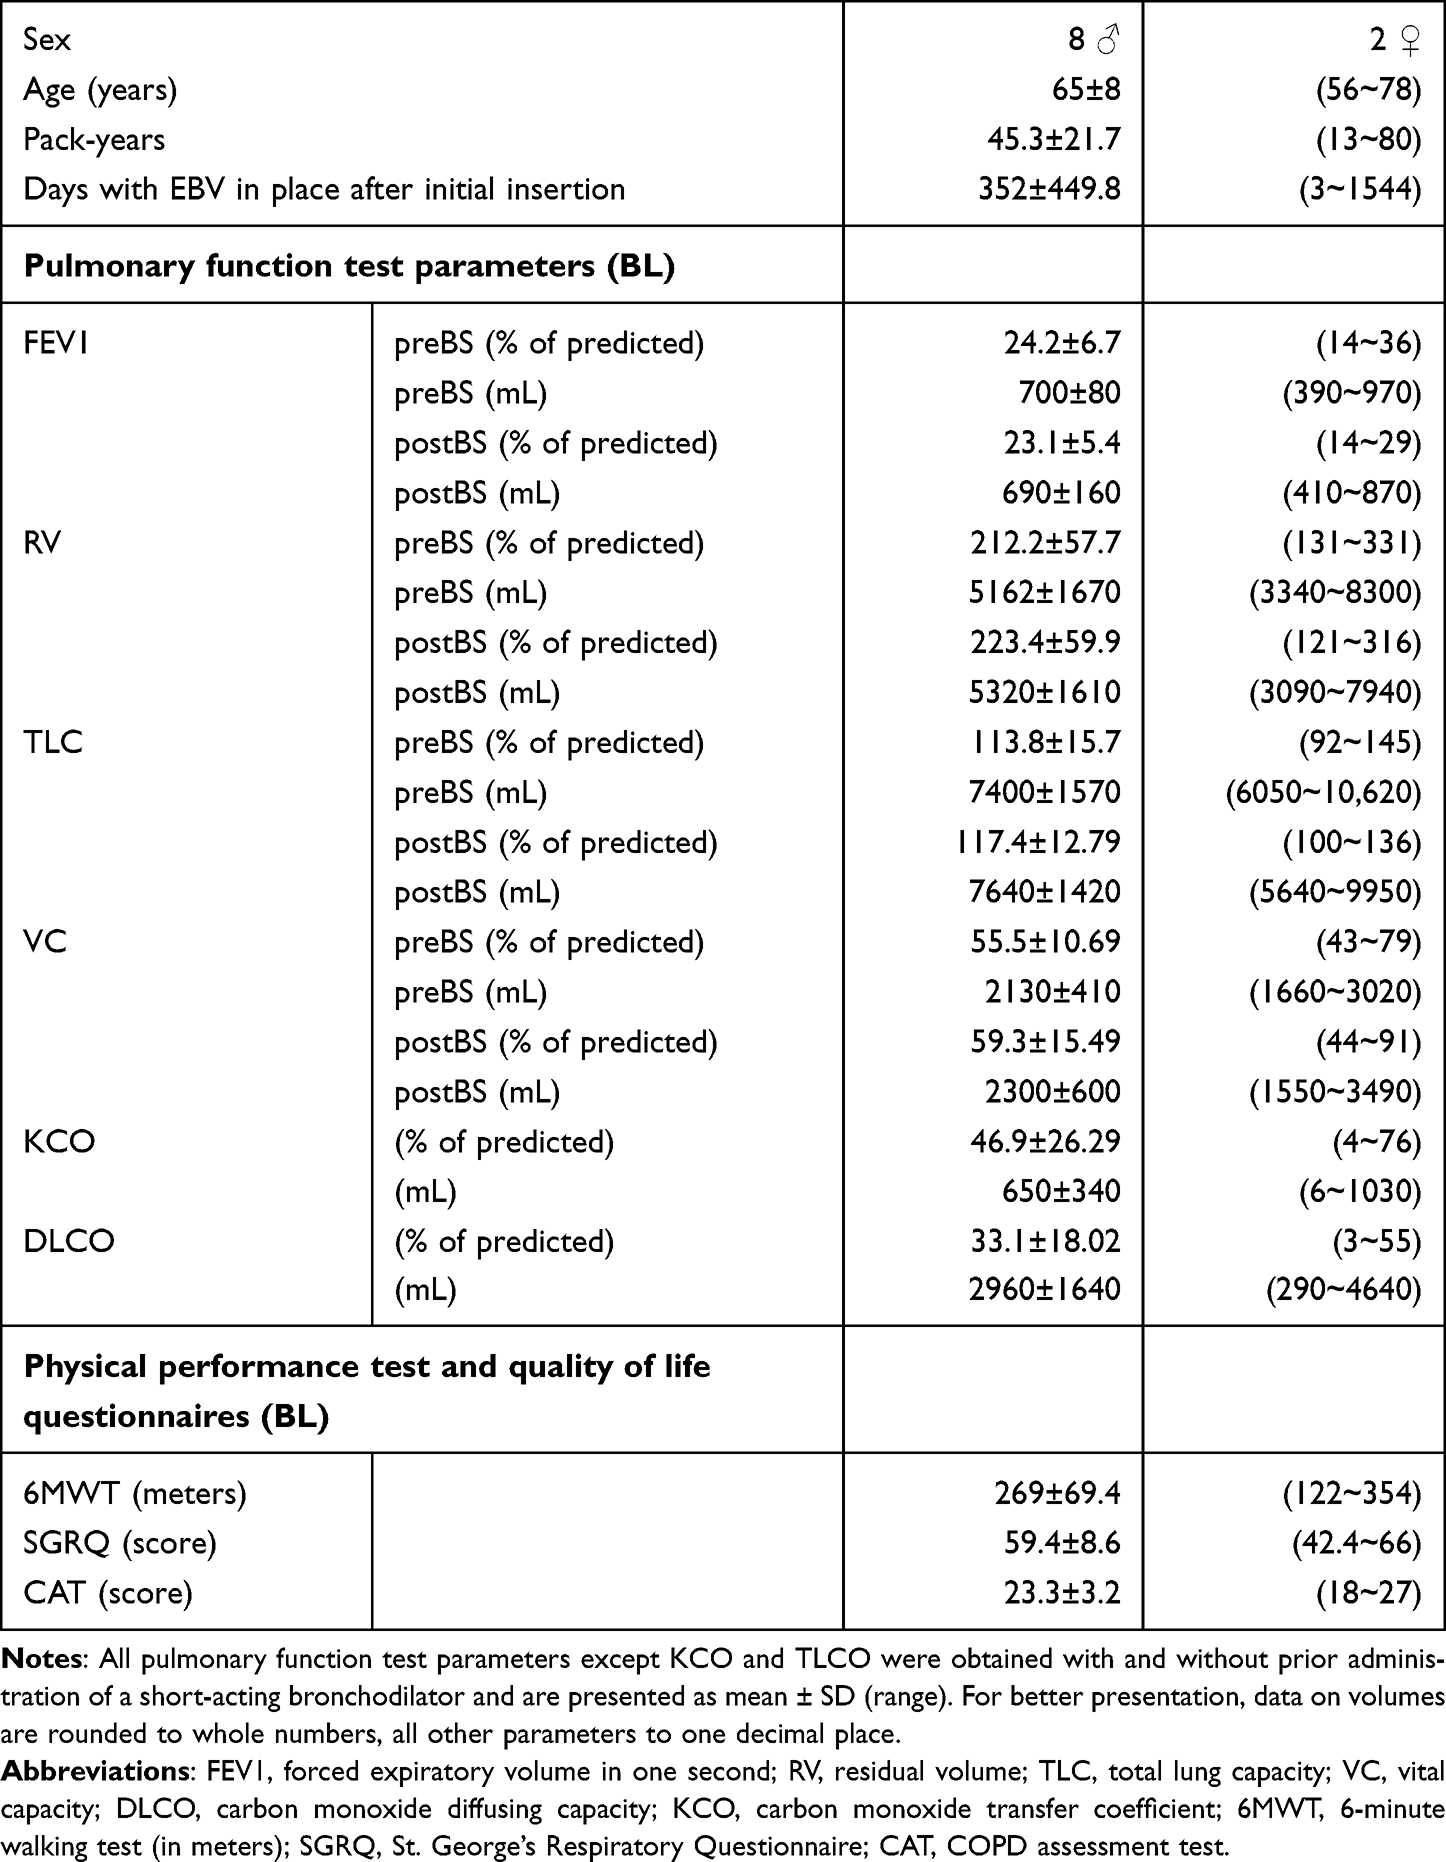 |
Table 1 Demographics, Smoking History at BL and EBV-Therapy Duration of Our Selection of Patients |
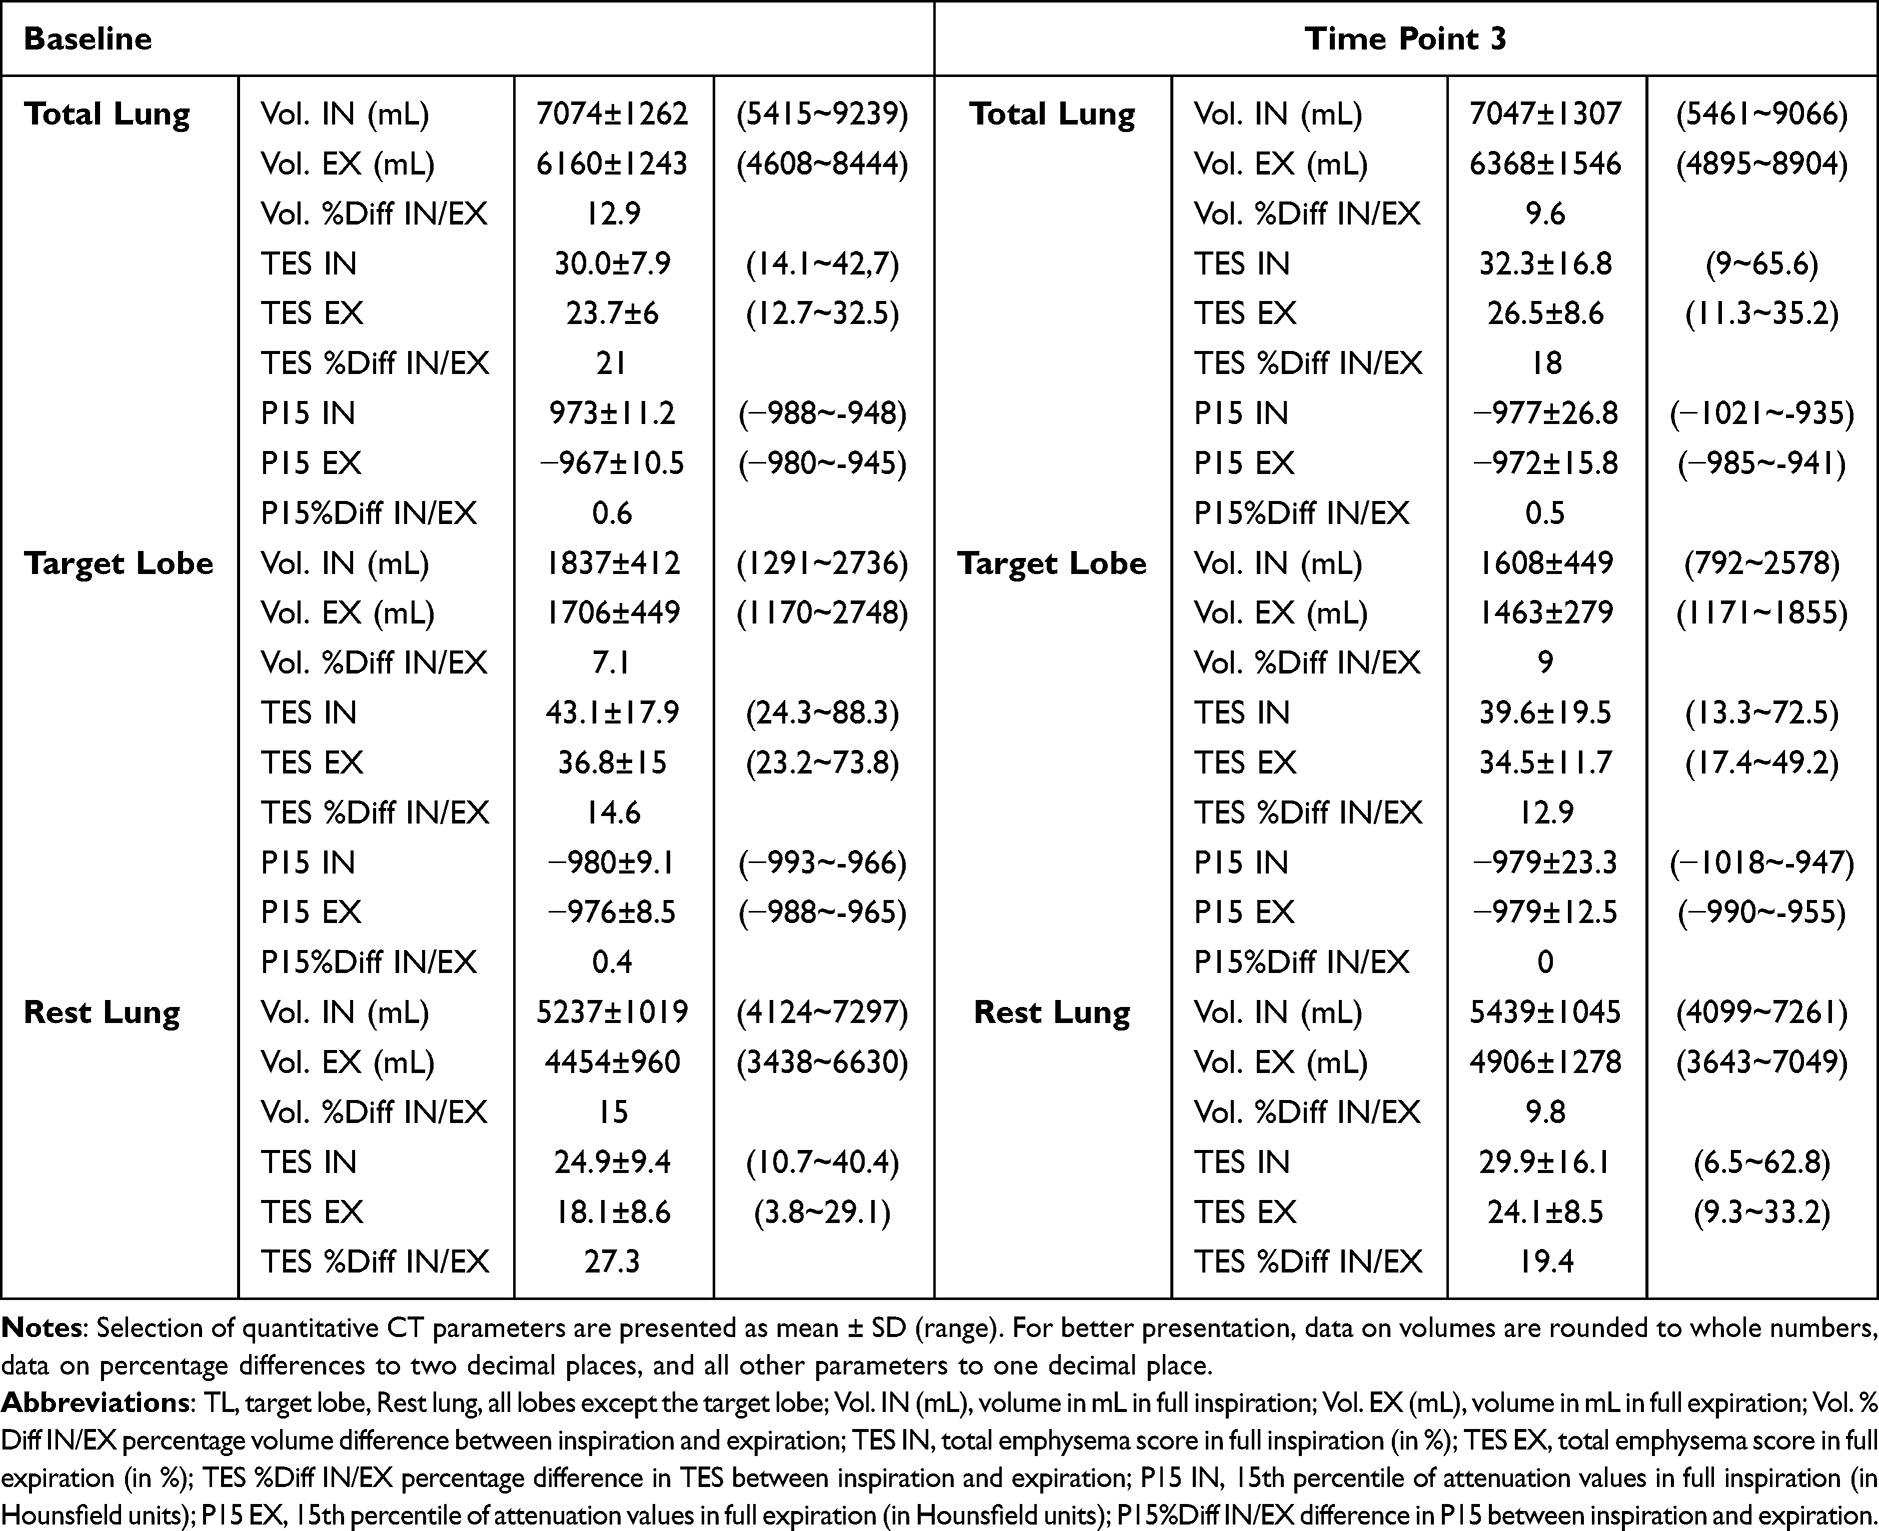 |
Table 2 Selection of Quantitative CT Parameters of Our Selection of Patients at Baseline (Evaluation for EBV Treatment; BL) and at Time Point 3 (After EBV Explantation) |
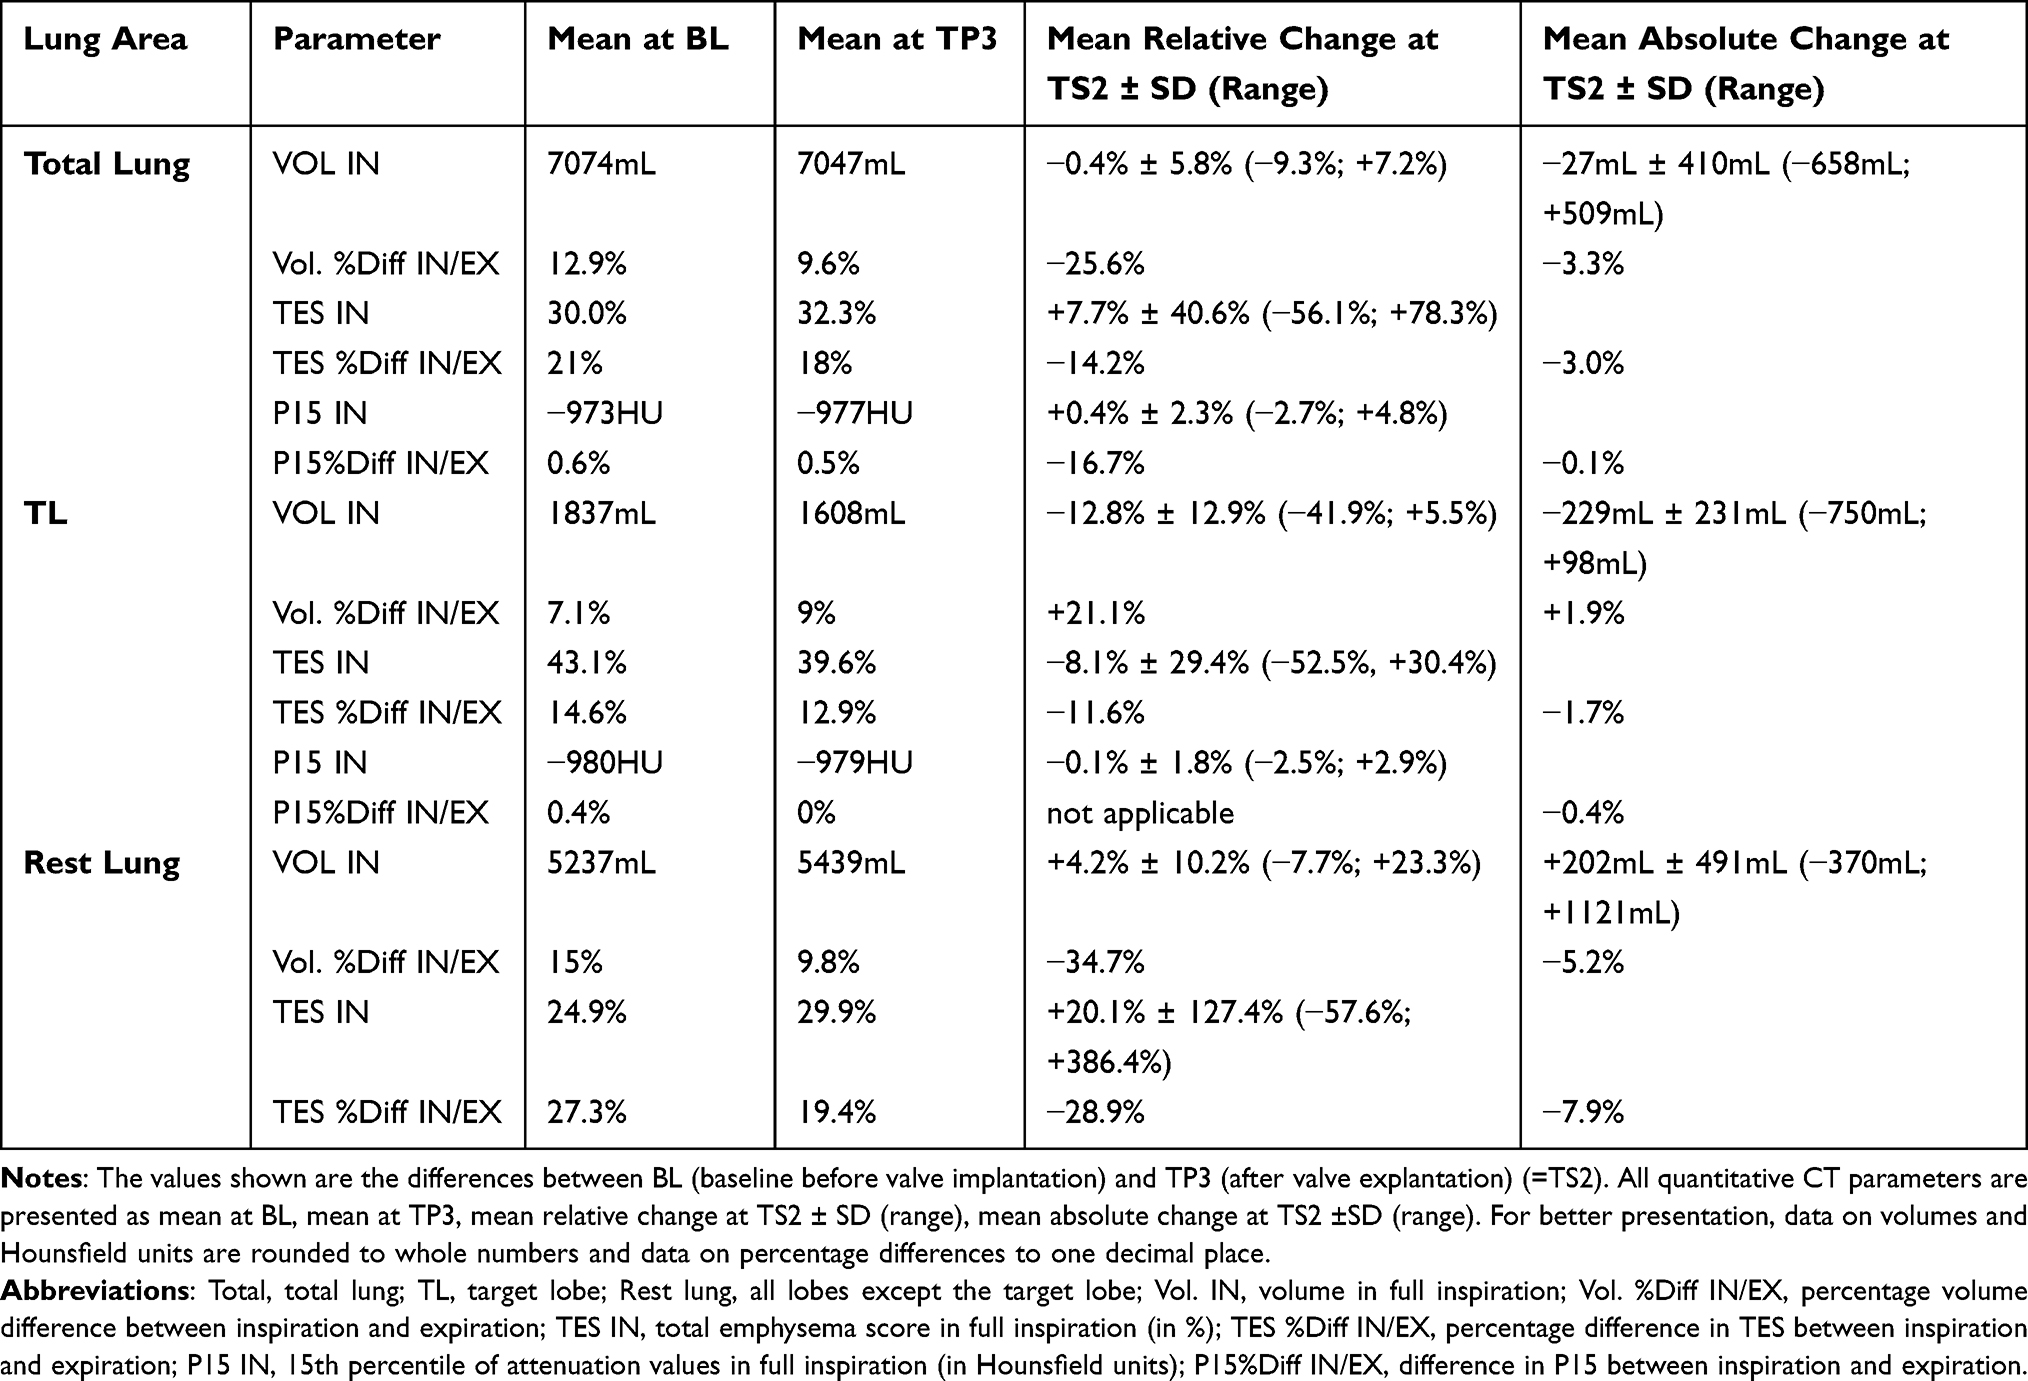 |
Table 3 Temporal Changes of QCT Parameters During Time Span 2 (TS2) (ie, Comparison of Baseline and Time Point 3, After EBV Explantation) |
Time Points and Time Spans
The subgroup of 10 patients included in our analysis (Table 1) underwent PFT and QCT in our hospital at three different time points: baseline (BL), postinterventional evaluation (time point 2; TP2), and re-evaluation after EBV explantation (time point 3; TP3). To calculate changes of the three time points, we defined three time spans: TS1 (=time span 1: between BL and TP2), TS2 (=time span 2: between BL and TP3) and TS3 (=time span 3: between TP2 and TP3) (see Figure 1).
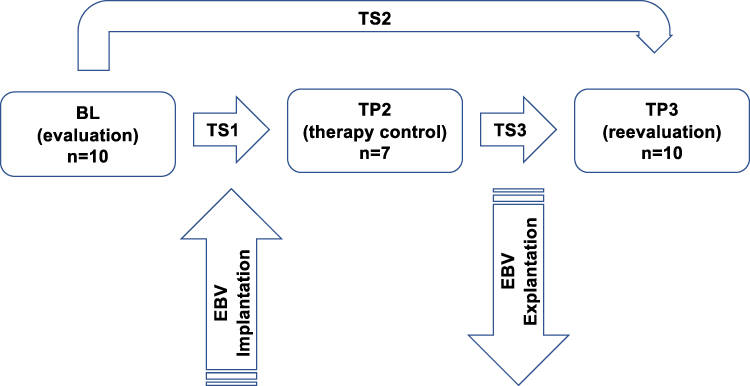 |
Figure 1 Study design: BL (preinterventional baseline), TP2 (postinterventional evaluation), TP3 (re-evaluation), TS1 (time span 1), TS3 (time span 3), EBV (endobronchial valve). |
Preinterventional Evaluation
All patients included in this retrospective analysis underwent preinterventional assessment at Charité Universitätsmedizin, Berlin, Germany. While all subjects had a history of tobacco smoking, smoking cessation was a prerequisite for study evaluation to be considered for EBV treatment. All subjects were free of other active lung disease than COPD (eg, no signs of tumor, infection, fibrosis, pleural effusion) at the times of preinterventional and postinterventional evaluation. The standardized evaluation consisted of a medical examination, QCT, PFT, 6-min walking distance test (6MWTD), and quality-of-life questionnaires.
Pulmonary Function Testing
Pulmonary function testing (PFT) (ie, spirometry) was performed according to clinical practice in Germany and reflecting international standards set by a task force of the American Thoracic Society/European Respiratory Society.11,21 A Ganshorn PowerCube (Ganshorn Medizin Electronic GmbH, Niederlauer, Germany) was used to obtain dynamic (eg, FEV1) and static (eg, TLC) pulmonary function parameters. PFT was conducted before and 15 min after inhalation of a short-acting ß2-agonist (salbutamol) at a therapeutic dose of 400 µg, as common practice in COPD management. Additional parameters such as the diffusing capacity of the lungs for carbon monoxide (DLCO) and the transfer coefficient for carbon monoxide (KCO) were calculated from respiratory carbon monoxide (CO) uptake. All PFT parameters except FEV1/FVC ratio and RV/TLC ratio were expressed as absolute values and as percentages of the predicted value. All PFT parameters were separately calculated for the target lobe and the total lung. The PFT baseline values before treatment (BL) are presented in Table 1.
Quantitative Computed Tomography
After prior coaching in breathing techniques, all patients underwent chest CT on the same CT scanner (GE Revolution EVO, GE Healthcare, Chicago, IL, USA) using a standardized emphysema protocol with non-enhanced, thin-slice acquisition in full inspiration and full expiration breath-hold (supine positioning, 0.625 mm or 1.5 mm slice thickness, slice interval equal to slice thickness, 120 kV voltage, 100 mA tube current, standard (soft) kernel). The mean dose length product was 234 mGy*cm per scan per patient.
Post-hoc QCT analysis was performed using the MeVis PULMO3D software (v3.7.1, Fraunhofer, MEVIS, Bremen, Germany) to calculate volumes (TLV), emphysema scores (TES, ie, the emphysema index), and the 15th percentile of attenuation values (P15) for the total lung and each lobe separately and afterwards visually checked for correctness and plausibility.23
In accordance with the literature, TES was defined as the percentage of voxels with attenuation below −950 HU in inspiratory scans and with attenuation below −856 HU in expiratory scans.8,24,25
The results of QCT at baseline (BL) are compiled in Table 2. For illustration, examples of QCT analysis of the lung in two middle-aged males with COPD grade IV and without COPD are presented in Figure 2.
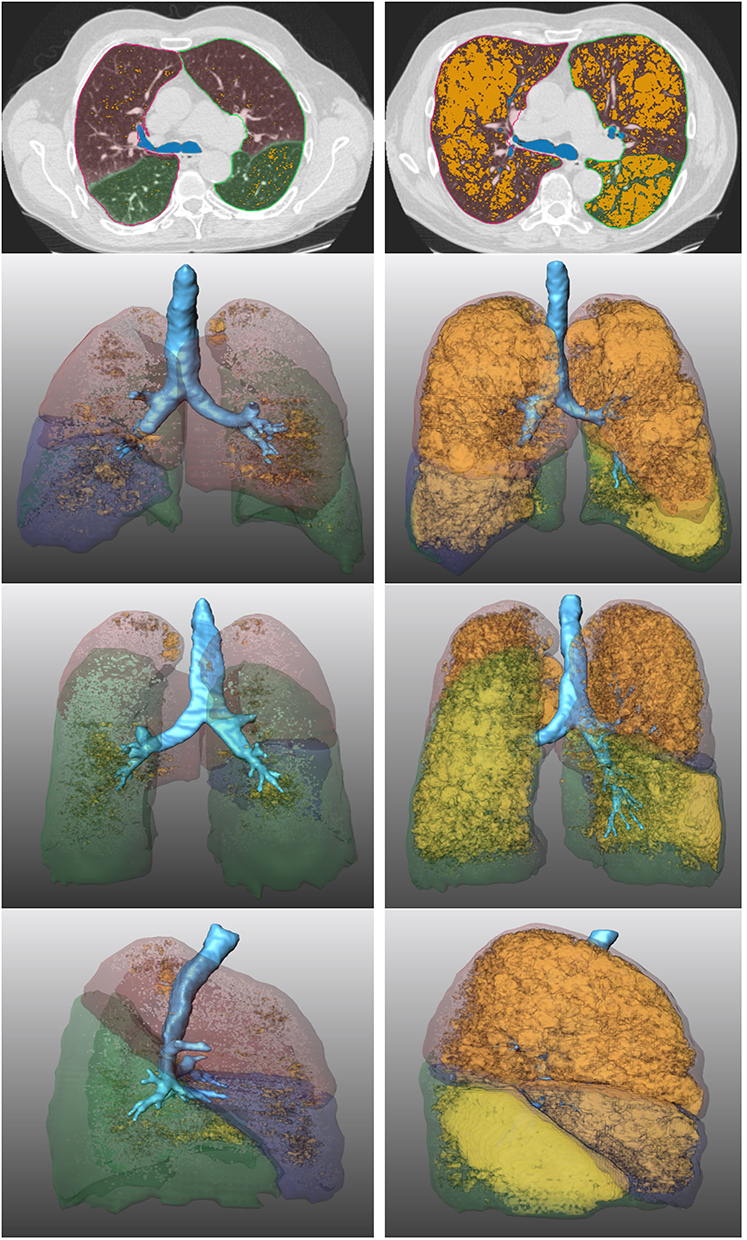 |
Figure 2 2D and 3D illustration of QCT analysis using MeVis PULMO3D: Image reconstructions of a 61-year-old patient without COPD (left column) and a 67-year-old patient with COPD GOLD 4 (right column) are compared. Highlighted in orange and yellow are all lung voxels with a CT density below −950 HU. The percentage of these emphysematous voxels out of all pulmonary voxels is the so-called emphysema score (TES) and was calculated to be 4% on the left and 48% on the right at maximal inspiration. |
Target Lobe Selection, Bronchoscopy and EBV Implantation
The target lobe for endoscopic EBV implantation was selected by an interdisciplinary Emphysema Board, whose decision was mainly based on QCT parameters, visual assessment of the completeness of interlobar fissures, and endoscopy results using the Chartis system (Pulmonx, Redwood City, CA, USA), in order to rule out collateral ventilation.21 In many cases, additional results of ventilation/perfusion scintigraphy were used to make the decision. Subsequently, EBV (one-way silicone Zephyr valves; Pulmonx; Redwood City, USA) were endoscopically inserted into the lobar or segmental bronchi of the selected target lobe to achieve atelectatic or dystelectatic collapse.
Paraclinical Parameters
Furthermore, 6MWDT results and data obtained with questionnaires (St. George’s Respiratory Questionnaire (SGRQ) and COPD Assessment Test (CAT)) were extracted from internal institutional records and helped to obtain information on patients’ activity status and quality of life.10
Statistics
The SPSS Statistics 26 software package (IBM Corporation, Armonk, NY, USA) was used for all statistical analyses. In the tables, continuous variables with normal distribution, such as FEV1, are presented as mean ± SD (range), continuous variables with nonnormal distribution, such as DLCO, are presented as median ± interquartile interval (interquartile range), whereas categorical variables, such as sex, are expressed as frequencies (percentages). Spearman’s rank correlation analysis was performed to compare quantitative CT parameters with clinical and paraclinical data.
All statistical analyses were conducted by a specialist medical statistician of our institution.
Results
Descriptive statistics of our study cohort of 10 patients are shown in Table 1. Table 2 and Figures 3–5display an overview about the most important QCT measurements at baseline (BL) and after valve explantation (TP3).
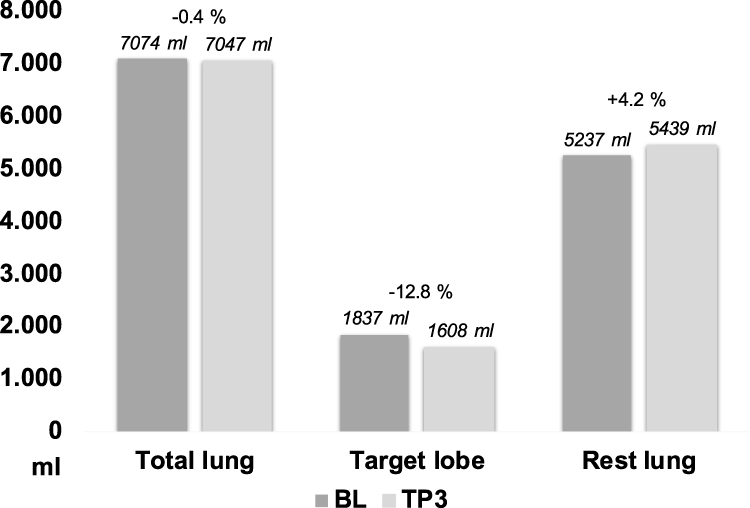 |
Figure 3 Illustration of the volume change of total and partial lung volumes in the period of TS2 between the timepoints baseline (BL) and time point 3 (TP3). In the TS2 there was a decrease of 0.4% of total lung volume (BL: 7074mL / TP3: 7047mL), a decrease of 12.8% of target lobe volume (BL: 1837mL / TP3: 1608mL) and an increase of 4.2% of the rest lung (BL: 5237mL / TP3: 5439mL). Above the columns, the respective volume (in mL) is shown for the corresponding lung volumes or partial volumes at timepoint BL and TP3, respectively. |
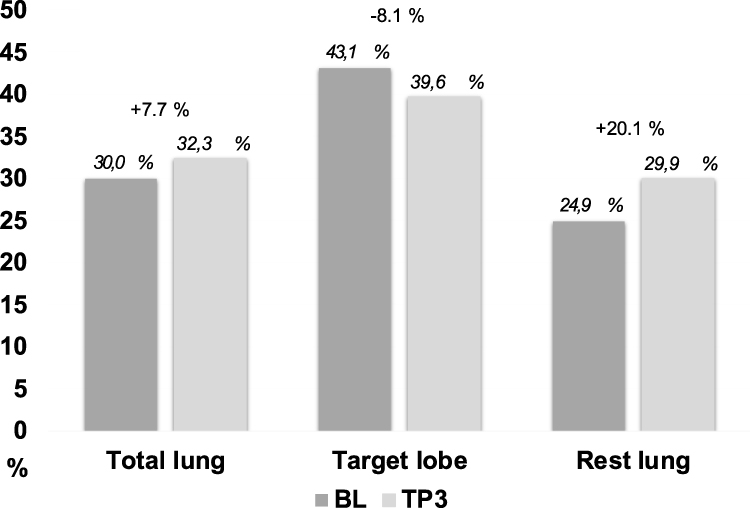 |
Figure 4 Illustration of the change of TES IN (%) of total and partial lung volumes in the period of TS2 between the timepoints baseline (BL) and time point 3 (TP3). In the TS2 there was an increase of 7.7% of total lung TES IN (%) (BL: 30.0% / TP3: 32.3%), a decrease of target lobe TES IN (%) (BL: 43.1% / TP3: 39.6%) and an increase of 20.1% of rest lung TES IN (%) (BL: 24.9% / TP3: 29.9%). Above the columns, the respective TES IN (%) is shown for the corresponding lung volumes or partial volumes at timepoint BL and TP3, respectively. |
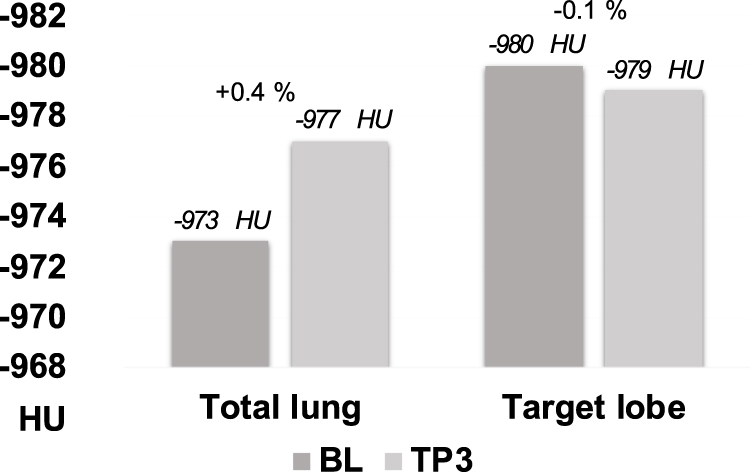 |
Figure 5 Illustration of the change of P15 IN (HU) of total and partial lung volumes in the period of TS2 between the timepoints baseline (BL) and time point 3 (TP3). In the TS2 there was an increase of 0.4% of total lung P15 IN (BL: 973 HU / TP3: 977 HU) and a decrease of 0.1% of target lobe P15 IN (BL: 980 HU / TP3: 979 HU). For the rest lung P15 was not calculable. Above the columns, the respective P15 IN (HU) is shown for the corresponding lung volumes or partial volumes at timepoint BL and TP3, respectively. |
Because of the very specific patient selection criteria, our sample size is so small that changes between time points BL, TP2, and TP3 are reported only as absolute values and percent differences. Statistical tests are not presented because significance levels could not be reached. When comparing baseline (BL) and reevaluation after valve explantation (TP3) (ie, the interval we named time span 2 (TS2)), we found persistent reduction of volume (mean −229 mL; −12.8%) and TES IN (mean −8,1%) of the target lobe (Table 3 and Figures 3–5).
The compensatory effect in TS2 was a hyperinflation of the rest of the lung with a subsequent increase in TES IN (mean +39.5%) and volume (mean +202 mL; +12.8%). (Table 3 and Figures 3–5)
As a result of these two divergent effects, the volume of the total lung in TS2 remained rather constant (mean −27 mL; −0.4%).
Furthermore, there was a slight deterioration of the over-all emphysema score in TS2 (TES IN total lung; mean +7,7%), which was primarily driven by the rest lung (mean +20,1%), whereas the TES IN of the target lobe – initially addressed by valves – persistently improved to a medium degree (mean −8.1%). (Table 3 and Figures 3–5)
It is important to mention in this regard that a relatively large interindividual range emerged in TS2 both with respect to the total lung volume (−9.3% to +7.2%) and the TL (−41.9% to +5.5%). Similarly, there is a large interindividual variability of the TES IN of the TL (−52.5% to +30.4%). (Table 3 and Figures 3–5)
In contrast, P15 values remained largely constant in TS2 both in the whole lung (mean +0.4%) and in the TL (mean −0.1%). (Table 3 and Figures 3–5)
Due to fewer values of pulmonary spirometry at TP3, no conclusions could be drawn regarding their dynamics in TS2. Furthermore, we performed correlation analyses between the BL baseline values of PFT, QCT, paraclinical parameters and the deltas TS1–TS3 but had to acknowledge that larger numbers are necessary to obtain scientifically meaningful results (results not shown). We were unable to identify predictive factors that could predict subsequent EBV failure, nor could we identify a clear cause that could explain clinical or radiological deterioration in some COPD patients after valve explantation.
Discussion
At the outset, it is essential to note that to date, to the best of our knowledge, no similar studies re-evaluating EBV treated patients after valve explantation exist worldwide, which means that our results cannot be directly compared with published data.
The most important findings of our study can be summarized as follows: we observed a persistent therapy effect on the target lobe even after EBV explantation. The compensatory hyperinflation of the rest lung is not very surprising, because of the enlarged space recruitable due to partial atelectasis of the target lobe. The mean total lung volume in full inspiration (total lung Vol. IN) remained almost constant across the three time points investigated in our patients (BL: 7074mL; TP2: 7243mL; TP3: 7047mL). On closer inspection, the large interindividual difference with regard to the persistence of the therapeutic effect of the target lobe is particularly exciting, so that a certain “all-or-nothing effect” could be inferred. Note the large interindividual differences in measurable changes of the target lobe during our observation period TS2, which ranged from −41.9% to +5.5% for target lobe volume and from −52.5% to +30.4% for TES IN of the target lobe.
Nevertheless, the constancy of the P15 values at TS2 remains exciting, which impress quite robustly in the whole lung as well as in the target lobe – possibly the explanation lies in the shift of the extreme values on both sides of the spectrum, ie, above as well as below the 15th percentile, which consecutively hardly affects the P15 value.
To get to the bottom of this question, one could, for example, perform a spectral analysis of the Hounsfield units in a follow-up study or look at additional percentiles.
For example, total emphysema scores in full inspiration showed some kind of rebound after valve explantation, increasing by a mean of 7.7% (total TES IN; BL: 30.0%; TP2: 26.9%; TP3: 32.3%). This means that the emphysema score reduced under inserted valves increased above baseline levels after valve removal. In contrast, such a development was not found for lung volumes.
In the target lobe, mean emphysema score TES IN stayed decreased after valve explantation (mean change during TS2 −8.1%, means at BL: 43.1; TP2: 24.9; TP3: 39.6), whereas TES IN in the remaining lobes of the lung increased (mean change during TS2 +20.1%, means at BL: 24.9; TP2: 25.5; TP3: 29.9) (Tables 2–3). The increase in TES IN in the untreated lung lobes was to be expected, but the persistent decrease of emphysema score and volume of the target lobe after EBV explantation compared to baseline is quite interesting.
In the interventionally addressed lobe, it might have been a partially persistent therapeutic effect, which might have been lost in the further course beyond the period investigated here. In the total lung, there was rather a worsening tendency, although it can only be speculated whether this was an exacerbation within the normal course of the disease or whether the course was possibly even worse than it would have been without therapy as a simple “watch-and-wait” (or with another therapeutic option). This causality question cannot be resolved by the data of our study.
The correlation analyses, which were statistically inconclusive due to the small sample size, could prove to be quite exciting in the case of study replication with a larger sample size, as they could possibly provide indications as to which baseline values predict subsequent therapy success or failure. This could have a decisive value in future therapy planning and control.
In summary, we can postulate that this study follows a path that has not been trodden before. As mentioned above, to our knowledge, the combination of quantitative CT data, pulmonary function testing data, quality of life questionnaires and clinical data at this very specific time point after EBV explantation has never been studied before.
Of particular interest in this context is a possible future clinical application. It is conceivable, for example, that after larger replication studies, predetermining factors could be crystallized which, for example, could predict the success rate or the complication rate with a certain degree of probability, possibly also with the aid of artificial intelligence. Also, to name just a few examples, the chances of success of re-implantation, the target lobe selection for primary and secondary implantation, and strategies for complicated courses could be analyzed a priori and influenced in the sense of a better therapy outcome.
Nevertheless, this study has limitations. Of course, this special data collection period and the overall very rare subgroup, ie, a subgroup that is re-evaluated for a new EBV therapy after valve explantation, is also the major weakness of this study - the challenge to filter subjects for these analyses results in a very small sample size – however, to give a positive spin-off, the fact that despite this small sample size, exciting results were obtained, which offer an even larger approach for future replication studies or thematically related, larger studies, is very promising.
Valve reimplantation is a rather rare phenomenon overall. The selection of the very specific subgroup results in a selection bias in the present study, which is unavoidable but represents a certain limitation.
A weakness of our CT data collection is the different but thin CT slice thickness in the primary reconstruction (0.625mm and 1.5mm, respectively), which unfortunately could not be changed retrospectively during the analysis process. The slice thickness, together with other data collection variables such as scanner type, kernel type or choice of cut-off value in Hounsfield units, has an impact on the collected parameters such as lung volume, P15 or emphysema index.
However, apart from this limitation in the protocol, we used the exact same CT scanner (GE Revolution EVO, GE Healthcare, Chicago, IL, USA), the same respiratory position, and the same soft kernel and reconstruction methodology for all studies and therefore consider, following the existing literature, the overall effect of variable slice thickness to be present but rather small in magnitude in an otherwise very robust CT protocol and consequently consider the parameters collected to be sufficiently valid.32,33
Another weakness of this study is certainly the incompleteness of the data collection. Unfortunately, various parameters (in particular pulmonary function testing data, but also clinical data) were missing, especially at TP2, which were hard to do without, particularly in the small sample, and made correlation analyses, in particular, less conclusive. This is certainly due to the non-uniformity of patient management, especially in the special case of EBV explantation.
Desirable for the future in this context would be an international guideline across centers, to which every emphysema center could orientate itself and which in conclusion would create uniformity not only in patient care but also in data collection for future studies.
In a larger cohort or follow-up studies, it would also be desirable to distinguish precisely between explants due to early complications and explants due to treatment failure. The definition of treatment success or treatment failure is certainly not trivial and rather multiparametric. For example, there are approaches that consider a defined lung volume reduction as successful treatment (eg, −200 mL of target lobe volume). On the other hand, an improvement in pulmonary function testing, walking distance (6MWDT) or scoring in questionnaires is certainly also considered a success despite possibly not or not completely achieved volumetric reduction, which would not lead to EBV explantation.
The actual aim of CT data collection in two breathing positions (IN and EX) was the assumption that valve implantation changes the breathing mechanics in such a way that especially the volume differences between maximum inspiration and maximum expiration increase. We found only small volume differences as a result of valve therapy, but no pervasive change in respiratory mechanics was found.
As an outlook, it sounds very interesting to us what happens to patients who actually get a second EBV therapy. Does a previously treated lobe then overinflate again? If the effects we observed are really maintained in the long term, sequential EBV treatment of several lobes one after the other could be a promising approach.
In the future, factor analyses on baseline parameters would also be exciting; here, multiple exciting questions would arise: What is the effect of smoking cessation for a given number of pack years? How long does smoking abstinence have to last before the start of therapy? What is the effect of physical training to improve the 6-min walking distance test (6MWTD) before starting therapy? What is the role of socioeconomic factors? Which interventions before, during or after the start of therapy have a favorable effect on the course? How could pharmacological or cognitive interventions be combined with occupational therapy or physiotherapy?
Conclusion
Within a small but unique cohort of patients with severe emphysema who provided PFT and QCT data before and after endobronchial EBV implantation and explantation, we had the valuable opportunity to find evidence of potentially persistent treatment success with transient valve implantation.
It is hoped that a possible replication study with a larger sample size in the future could allow conclusions to be drawn regarding possible predictors of treatment success or failure, thereby significantly improving treatment planning for individual patients. For a future replication study, it would also be exciting to establish a comparison group that did not receive valve therapy in order to analyze how the relevant parameters (volumes or emphysema scores) develop over time and in comparison.
Ultimately, in this study, no final conclusions could be drawn by our results, but only indications that should be confirmed by larger replication studies. Optionally, a multi-center study could be aimed for an extended patient acquisition.
Established centers should develop standard procedures on how to follow up patients who have had EBV removed. Retrospectively, we should have re-evaluated our patients without therapeutic success at defined time points. To understand the pathophysiology of pulmonary emphysema and the effect of EBV therapy, it is essential to better investigate the permanent effects of temporary EBV therapy.
Abbreviations
6MWTD, 6-min walking distance; CAT, COPD Assessment Test; COPD, Chronic obstructive pulmonary disease; DLCO, Diffusing capacity of the lungs for carbon monoxide; EBV, Endobronchial valve; ELVR, Endoscopic lung volume reduction; FEV1, Forced expiratory volume in 1s; FVC, Forced vital capacity; GOLD, Global initiative for chronic obstructive lung disease; HU, Hounsfield unit; KCO, Transfer coefficient for carbon monoxide; P15, 15th percentile of lung attenuation; P15 IN, 15th percentile of lung attenuation in full inspiration; P15%Diff IN/EX, Percentage difference in P15 between inspiration and expiration; PDE, Phosphodiesterase; PFT, Pulmonary function test; PreBS, Before bronchodilator inhalation; QCT, Quantitative computed tomography analysis; Rest lung, All lobes except the target lobe; RV, Residual volume; SGRQ, St. George’s Respiratory Questionnaire; BL, Baseline before EBV implantation; TP2, Time point 2 after EBV implantation; TP3, Time point 3 after EBV explantation; TS1, Time span 1 between BL and TP2; TS2, Time span 2 between BL and TP3; TS3, Time span 3 between TP2 and TP3; TES, Total emphysema score, ie, the emphysema index; TES IN, Total emphysema score, ie, the emphysema index in full inspiration; TES %Diff IN/EX, Percentage difference in TES between inspiration and expiration; TL, Target lobe; TLC, Total lung capacity; TLCO, Transfer factor for carbon monoxide; TLV, Total lung volume; VC, Vital capacity; Vol. IN (mL), Volume in mL in full inspiration; Vol. %Diff IN/EX, Percentage difference between inspiration and expiration.
Disclosure
Dr Ralf H Hubner reports personal fees from Pulmonx, personal fees from Olympus, during the conduct of the study; personal fees from Olympus, outside the submitted work; and Head and founder of Lungenemphysem Register e.V. The authors declared no other conflicts of interest with respect to the research, authorship, and/or publication of this article.
References
1. Halpin DMG, Criner GJ, Papi A., et al. Global initiative for the diagnosis, management, and prevention of Chronic Obstructive Lung Disease. The 2020 GOLD science committee report on COVID-19 and Chronic Obstructive Pulmonary Disease. Am J Respir Crit Care Med. 2021;203(1):24–36. doi:10.1164/rccm.202009-3533SO
2. Lopez-Campos JL, Soler-Cataluna JJ, Miravitlles M. Global strategy for the diagnosis, management, and prevention of Chronic Obstructive Lung Disease 2019 report: future challenges. Arch Bronconeumol. 2020;56(2):65–67. doi:10.1016/j.arbres.2019.06.001
3. Singh D, Agusti A, Anzueto A, et al. Global strategy for the diagnosis, management, and prevention of Chronic Obstructive Lung Disease: the GOLD science committee report 2019. Eur Respir J. 2019;53(5):1900164. doi:10.1183/13993003.00164-2019
4. Jarad N. Clinical review: endobronchial valve treatment for emphysema. Chron Respir Dis. 2016;13(2):173–188. doi:10.1177/1479972316631139
5. Aggelou K, Siafakas N. Medical lung volume reduction for severe emphysema: a review. Respir Med. 2017;131:141–147. doi:10.1016/j.rmed.2017.08.009
6. Gevenois PA, de Maertelaer V, De Vuyst P, et al. Comparison of computed density and macroscopic morphometry in pulmonary emphysema. Am J Respir Crit Care Med. 1995;152:653.
7. Li K, Gao Y, Pan Z, et al. Influence of emphysema and air trapping heterogeneity on pulmonary function in patients with COPD. Int J Chron Obstruct Pulmon Dis. 2019;14:2863–2872. doi:10.2147/copd.S221684
8. Lynch DA, Al-Qaisi MA. Quantitative computed tomography in chronic obstructive pulmonary disease. J Thorac Imaging. 2013;28(5):284–290. doi:10.1097/RTI.0b013e318298733c
9. Oh SY, Lee M, Seo JB, et al. Size variation and collapse of emphysema holes at inspiration and expiration CT scan: evaluation with modified length scale method and image co-registration. Int J Chron Obstruct Pulmon Dis. 2017;12:2043–2057. doi:10.2147/copd.S130081
10. Song L, Leppig JA, Hubner RH, et al. Quantitative CT analysis in patients with pulmonary emphysema: do calculated differences between full inspiration and expiration correlate with lung function? Int J Chron Obstruct Pulmon Dis. 2020;15:1877–1886. doi:10.2147/COPD.S253602
11. Theilig DC, Huebner RH, Neumann K, Poellinger A, Doellinger F. Selecting patients for lobar lung volume reduction therapy: what quantitative computed tomography parameters matter? [Selektionskriterien fur die Lungenvolumenreduktionstherapie: welche Parameter der quantitativen Computertomografie sind relevant?]. Rofo. 2019;191(1):40–47. doi:10.1055/a-0638-0058
12. Martini K, Frauenfelder T. Emphysema and lung volume reduction: the role of radiology. J Thorac Dis. 2018;10(Suppl 23):S2719–S2731. doi:10.21037/jtd.2018.05.117
13. Amaza IP, O’Shea AMJ, Fortis S, Comellas AP. Discordant quantitative and visual CT assessments in the diagnosis of emphysema. Int J Chron Obstruct Pulmon Dis. 2021;16:1231–1242. doi:10.2147/COPD.S284477
14. Cetti EJ, Moore AJ, Geddes DM. Collateral ventilation. Thorax. 2006;61(5):371–373. doi:10.1136/thx.2006.060509
15. Criner GJ, Sue R, Wright S, et al. A multicenter randomized controlled trial of Zephyr endobronchial valve treatment in heterogeneous emphysema (LIBERATE). Am J Respir Crit Care Med. 2018;198(9):1151–1164. doi:10.1164/rccm.201803-0590OC
16. Gompelmann D, Eberhardt R, Michaud G, Ernst A, Herth FJ. Predicting atelectasis by assessment of collateral ventilation prior to endobronchial lung volume reduction: a feasibility study. Respiration. 2010;80(5):419–425. doi:10.1159/000319441
17. Gompelmann D, Eberhardt R, Slebos DJ, et al. Diagnostic performance comparison of the Chartis System and high-resolution computerized tomography fissure analysis for planning endoscopic lung volume reduction. Respirology. 2014;19(4):524–530. doi:10.1111/resp.12253
18. Herth FJ, Eberhardt R, Gompelmann D, et al. Radiological and clinical outcomes of using Chartis™ to plan endobronchial valve treatment. Eur Respir J. 2013;41(2):302–308. doi:10.1183/09031936.00015312
19. Klooster K, ten Hacken NH, Hartman JE, Kerstjens HA, van Rikxoort EM, Slebos DJ. Endobronchial valves for emphysema without interlobar collateral ventilation. N Engl J Med. 2015;373(24):2325–2335. doi:10.1056/NEJMoa1507807
20. Klooster K, Slebos DJ. Endobronchial valves for the treatment of advanced emphysema. Chest. 2020;159(5):1833–1842. doi:10.1016/j.chest.2020.12.007
21. Koster TD, Slebos DJ. The fissure: interlobar collateral ventilation and implications for endoscopic therapy in emphysema. Int J Chron Obstruct Pulmon Dis. 2016;11:765–773. doi:10.2147/copd.S103807
22. Labarca G, Uribe JP, Pacheco C, et al. Bronchoscopic lung volume reduction with endobronchial zephyr valves for severe emphysema: a systematic review and meta-analysis. Respiration. 2019;98(3):268–278. doi:10.1159/000499508
23. Sciurba FC, Ernst A, Herth FJ, et al. A randomized study of endobronchial valves for advanced emphysema. N Engl J Med. 2010;363(13):1233–1244. doi:10.1056/NEJMoa0900928
24. Valipour A, Burghuber OC. An update on the efficacy of endobronchial valve therapy in the management of hyperinflation in patients with chronic obstructive pulmonary disease. Ther Adv Respir Dis. 2015;9(6):294–301. doi:10.1177/1753465815599693
25. Koegelenberg CF, Theron J, Bruwer JW, et al. Endoscopic lung volume reduction in severe emphysema. S Afr Med J. 2015;105(9):721–723. doi:10.7196/SAMJnew.8144
26. Park TS, Hong Y, Lee JS, et al. Efficacy of bronchoscopic lung volume reduction by endobronchial valves in patients with heterogeneous emphysema: report on the first Asian cases. J Korean Med Sci. 2014;29(10):1404–1410. doi:10.3346/jkms.2014.29.10.1404
27. Park TS, Hong Y, Lee JS, et al. Bronchoscopic lung volume reduction by endobronchial valve in advanced emphysema: the first Asian report. Int J Chron Obstruct Pulmon Dis. 2015;10:1501–1511. doi:10.2147/COPD.S85744
28. Roodenburg SA, Klooster K, Hartman JE, et al. Revision bronchoscopy after endobronchial valve treatment for emphysema: indications, findings and outcomes. Int J Chron Obstruct Pulmon Dis. 2021;16:1127–1136. doi:10.2147/COPD.S302662
29. Herzog D, Poellinger A, Doellinger F, et al. Modifying post-operative medical care after EBV implant may reduce pneumothorax incidence. PLoS One. 2015;10(5):e0128097. doi:10.1371/journal.pone.0128097
30. Gompelmann D, Herth FJ, Slebos DJ, et al. Pneumothorax following endobronchial valve therapy and its impact on clinical outcomes in severe emphysema. Respiration. 2014;87(6):485–491. PMID: 24800814. doi:10.1159/000360641
31. Valipour A, Slebos DJ, de Oliveira HG, et al. Expert statement:pneumothorax associated with endoscopic valve therapy for emphysema—potential mechanisms, treatment algorithm, and case examples. Respiration. 2014;87:513–521. PMID: 24777292. doi:10.1159/000360642
32. Xu Y, Yamashiro T, Moriya H, Muramatsu S, Murayama S. Quantitative emphysema measurement on ultra-high-resolution CT scans. Int J Chron Obstruct Pulmon Dis. 2019;14:2283–2290. PMID: 31631998; PMCID: PMC6790117. doi:10.2147/COPD.S223605.
33. Gierada DS, Bierhals AJ, Choong CK, et al. Effects of CT section thickness and reconstruction kernel on emphysema quantification relationship to the magnitude of the CT emphysema index. Acad Radiol. 2010;17(2):146–156. PMID: 19931472; PMCID: PMC2818169. doi:10.1016/j.acra.2009.08.007.
 © 2022 The Author(s). This work is published and licensed by Dove Medical Press Limited. The full terms of this license are available at https://www.dovepress.com/terms.php and incorporate the Creative Commons Attribution - Non Commercial (unported, v3.0) License.
By accessing the work you hereby accept the Terms. Non-commercial uses of the work are permitted without any further permission from Dove Medical Press Limited, provided the work is properly attributed. For permission for commercial use of this work, please see paragraphs 4.2 and 5 of our Terms.
© 2022 The Author(s). This work is published and licensed by Dove Medical Press Limited. The full terms of this license are available at https://www.dovepress.com/terms.php and incorporate the Creative Commons Attribution - Non Commercial (unported, v3.0) License.
By accessing the work you hereby accept the Terms. Non-commercial uses of the work are permitted without any further permission from Dove Medical Press Limited, provided the work is properly attributed. For permission for commercial use of this work, please see paragraphs 4.2 and 5 of our Terms.