")
Back to Journals » Neuropsychiatric Disease and Treatment » Volume 16
Weighted Gene Coexpression Network Analysis Identifies Specific Modules and Hub Genes Related to Major Depression
Authors Zhang G , Xu S, Yuan Z, Shen L
Received 2 January 2020
Accepted for publication 27 February 2020
Published 12 March 2020 Volume 2020:16 Pages 703—713
DOI https://doi.org/10.2147/NDT.S244452
Checked for plagiarism Yes
Review by Single anonymous peer review
Peer reviewer comments 3
Editor who approved publication: Dr Yuping Ning
Guangyin Zhang, 1 Shixin Xu, 2 Zhuo Yuan, 1 Li Shen 1
1Department of Psychosomatic Medicine, First Teaching Hospital of Tianjin University of Traditional Chinese Medicine, Tianjin, People’s Republic of China; 2Tianjin Key Laboratory of Traditional Research of TCM Prescription and Syndrome; Medical Experiment Center, First Teaching Hospital of Tianjin University of Traditional Chinese Medicine, Tianjin, People’s Republic of China
Correspondence: Guangyin Zhang
Department of Psychosomatic Medicine, First Teaching Hospital of Tianjin University of Traditional Chinese Medicine, No. 88, Chang Ling Road, Li Qi Zhuang Jie, Xi Qing District, Tianjin 300381, People’s Republic of China
Tel/Fax +86 2227986673
Email [email protected]
Purpose: Despite advances in characterizing the neurobiology of emotional disorders, there is still a significant lack of scientific understanding of the pathophysiological mechanisms governing major depressive disorder (MDD). This study attempted to elucidate the molecular circuitry of MDD and to identify more potential genes associated with the pathogenesis of the disease.
Patients and Methods: Microarray data from the GSE98793 dataset were downloaded from the NCBI Gene Expression Omnibus (GEO) database, including 128 patients with MDD and 64 healthy controls. Weighted gene coexpression network analysis (WGCNA) was performed to find modules of differentially expressed genes (DEGs) with high correlations followed by Gene Ontology (GO) and Kyoto Encyclopedia of Genes and Genomes (KEGG) pathway enrichment analyses to obtain further biological insight into the top three key modules. The protein-protein interaction (PPI) network, the modules from the PPI network, and the gene annotation enrichment of modules were analyzed, as well.
Results: We filtered 3276 genes that were considered significant DEGs for further WGCNA analysis. By performing WGCNA, we found that the turquoise, blue and brown functional modules were all strongly correlated with MDD development, including immune response, neutrophil degranulation, ribosome biogenesis, T cell activation, glycosaminoglycan biosynthetic process, and protein serine/threonine kinase activator activity. Hub genes were identified in the key functional modules that might have a role in the progression of MDD. Functional annotation showed that these modules primarily enriched such KEGG pathways as the TNF signaling pathway, T cell receptor signaling pathway, primary immunodeficiency, Th1, Th2 and Th17 cell differentiation, autophagy and RNA degradation and oxidative phosphorylation. These results suggest that these genes are closely related to autophagy and cellular immune function.
Conclusion: The results of this study may help to elucidate the pathophysiology of MDD development at the molecular level and explore the potential molecular mechanisms for new interventional strategies.
Keywords: major depressive disorder, bioinformatic analysis, differentially expressed genes, immune response, autophagy
Introduction
Major depressive disorder (MDD) is one of the most common forms of mental disease and includes a wide range of symptoms, such as prolonged episodes of low mood, lack of motivation, retraction from social interaction, altered patterns of sleep and appetite, cognitive difficulties and, at its worst, suicidal tendency.1,2 Therefore, depression is associated with serious consequences, including excessive mortality, disability, secondary morbidity, and contributors to the global burden of disease.3 According to the World Health Organization (WHO), an estimated 350 million people of all ages suffer from depression disorder globally.4 Despite the significant social burden that stems from this disease, there is still a significant lack of scientific understanding of the pathophysiological mechanisms governing depression. Furthermore, the current diagnostic systems do not adequately reflect the relevant neurobiological alterations that drive the modified behavioral patterns found in patients.5 To date, the microarray technique has increasingly been used for life science research purposes, and bioinformatic data‑mining of the gene has widely been used for differential expression analysis to identify novel diagnostic and therapeutic biomarkers of diseases.6,7
Extensive research efforts investigating depression have been performed in past decades, and potential new therapeutic targets are being identified, including oxidative stress, immune system effects8 and neuroinflammation9 in the central nervous system (CNS), through cytokines, which regulate brain activities and emotions. In particular, a recognition that immune system actions profoundly impact mood regulation10 has been particularly well established for inflammatory signals from the innate immune system linked to depression in human and rodent studies. As such, it was important to identify the critical genes and key-related pathways that may be related to innate immunity and neuroinflammation and thus can further understand the pathophysiological mechanisms of depression.11,12 Recent genome-wide association studies (GWAS) and many studies on common variants increase our understanding of MDD; however, the underlying genetic basis remains largely unknown.13–15 The weighted gene coexpression network analysis (WGCNA) algorithm can group genes into modules based on the gene coexpression similarities across the samples, resulting in a cluster of genes with similar functions, for relating modules to one another and external sample traits, and then the correlation networks can be used to identify tissue-specific biomarkers and pathophysiological-related pathways.16,17
To this end, within the current study, we constructed correlation networks using gene expression data from publicly accessible resources. Based on a microarray dataset GSE98793 from Gene Expression Omnibus (GEO), the study was designed to construct a gene coexpression network to predict clusters of candidate genes involved in the pathogenesis of MDD. The DEGs were screened, and the WGCNA algorithm was employed to construct a coexpression network. Then, the gene modules related to MDD were identified. We conducted Gene Ontology (GO) and Kyoto Encyclopedia of Genes and Genomes (KEGG) pathway enrichment analyses to obtain further biological insight into the highly correlated module, and the modules of the protein-protein interaction (PPI) network in MDD were screened, as well. In our research, all the possible genes were analyzed, and our results would be more complete and more reliable. The results of this study may help to elucidate the pathophysiology of MDD development at the molecular level and explore the potential molecular targets for new interventional strategies.
Materials and Methods
Microarray Data
The mRNA microarray expression profile dataset GSE98793 from whole blood samples for 128 patients with MDD and 64 healthy controls provided by Leday et al18 (https://www.ncbi.nlm.nih.gov/geo/query/acc.cgi?acc=GSE98793) was downloaded from the Gene Expression Omnibus database, which is a public functional genomics data repository of high-throughput gene expression data, chips, and microarrays. The GSE98793 dataset was based on the GPL570 [HG-U133_Plus_2] platform using the Affymetrix Human Genome U133 Plus 2.0 Array (Affymetrix, Inc., Santa Clara, CA). We downloaded the raw CEL file and the probe annotation file. The probes were converted into the corresponding gene symbol according to the annotation information on the platform. All of the data were freely available online, and this study did not involve any experiments on humans or animals performed by any of the authors.
Data Preprocessing and DEG Screening
After the raw data in CEL format were downloaded, the Affymetrix package19 (http://www.bioconductor.org/packages/release/bioc/html/affy.html) in R software (version 3.5.2, https://www.r-project.org/) was used for data preprocessing and then obtained after removing the batch differences and performing data background correction, normalization and summarization to create a robust multiarray average (RMA).
The series matrix files of the dataset were normalized log-expression values available for further analysis. To characterize DEGs, the control group and the MDD group were analyzed using the LIMMA (linear models for microarray data) package20 in the R/Bioconductor platform. Benjamini–Hochberg’s method was used to control the false discovery rate, and P-values < 0.05 were defined as the DEGs, which were used to screen gene modules with similar expression profiles for the subsequent coexpression network construction.
Construction of Weighted Gene Coexpression Networks
As a systems biology method, the construction of gene coexpression networks and the identification of gene clusters or modules is especially useful in identifying transcriptional alterations in multigene diseases, where the phenotypic state emerges from the convergence of numerous small changes, rather than from isolated single-gene effects.21,22 In the present study, the Weighted Gene Co-expression Network Analysis (WGCNA) package (Version 1.68, https://cran.rstudio.com/web/packages/WGCNA/index.html) within R software was used to construct groups of strongly coexpressed genes into coexpression networks according to the DEG expression matrix, which included 3276 selected genes. The gene network was visualized with selected DEGs, and visualization in the gene network of module eigengenes was also undertaken.
The selection of the soft-thresholding power is an important step when constructing a WGCNA.16 In this study, the soft thresholding power was screened out by analysis of network topology when the degree of scale independence was set as β=5 (scale-free R2=0.88). When the degree of scale independence was set as β=5, the summary connectivity measures decline steeply with increasing soft-thresholding power, it is advantageous to choose the lowest power that satisfies the approximate scale-free topology criterion. Then, gene coexpression module similarity and adjacency matrices were successively constructed using the power values obtained by the WGCNA algorithm. During module selection by cluster analysis, the adjacency matrix was used to calculate the topological overlap measure (TOM) and measure the connection strength between all gene pairs.23,24 Modules of coexpressed genes were generated by hierarchical clustering dendrograms with different colors, and the module structure was visualized by topological overlap matrix plots. Finally, the minimum number of genes was set at 100 to ensure the reliability of the result in each module, after which we performed further analysis and validation as the candidates on gene modules to characterize modules related to MDD.
Functional Enrichment Analysis of Genes in Three Key Modules
The genes inside coexpression modules have high connectivity, and the genes within the same module may play similar roles. The top 3 modules with more than 100 genes that are significantly associated with MDD were selected. To further analyze the cellular component (CC), molecular function (MF), and potential biological process (BP), functional enrichment analysis was performed to identify and interpret complex biological functions based on the GO terms and KEGG pathway annotation in the coexpression modules. The genes of each selected module were submitted to the online Database of Enrichr (http://amp.pharm.mssm.edu/Enrichr/) to conduct functional and pathway enrichment analysis in this study. Enrichr is a useful online tool for annotating genes,25–27 which provides the functionality to perform simultaneous GO and KEGG pathway analysis. P-values < 0.01 were considered to indicate significant differences.
Integration of Genetics and Highly Connected Hubs in Modules
The top-ranked genes in the modules are thought to be hub genes. To systematically analyze the hub genes from each module and the module eigengene, the genes obtained from each module previously were mapped into the online search tool STRING database28 (STRING, V11.0; https://string-db.org/), which could play a critical role in the protein-protein network (PPI). A combined score ≥ 0.4 of PPI pairs was considered significant. Then, the CytoHubba plugin based on Cytoscape software29 (http://www.cytoscape.org/, version 3.7.1; Institute for Systems Biology, Seattle, WA, USA) was used to construct and visualize the transcriptional regulatory network of each module, and the highest degree connectivity was identified as the hub genes.
Results
Identification of DEGs Associated with Normal and MDD Samples
A total of 192 tissue sample raw files (. CEL format) were downloaded from the Gene Expression Omnibus (GEO) database. There were a total of 54,675 probes on the integrated dataset GSE98793 after batch normalization by the sva and limma packages in R, and 22,484 gene expressions were extracted. Furthermore, P-values < 0.05 with 3276 gene expressions were considered to be significant as the DEGs for further WGCNA analysis.
Weighted Coexpression Network Construction and Key Module Identification
To explore the potential functions and mechanisms of these RNAs in the progression of major depression in patients, the WGCNA package in R software was used to construct a gene coexpression network to identify biologically meaningful gene modules. After screening the 3276 DEGs, we analyzed the data with WGCNA to identify the modules containing highly correlated genes, and the soft‐threshold power 5 was optimized based on the criterion of approximate scale-free topology (Figure 1A and B). We set MEDissThres as 0.25 to merge similar modules, and 9 modules were generated (Figure 2A). There were 491 genes in the turquoise module, 348 genes in the blue module, 144 genes in the brown module, 50 genes in the black module, 64 genes in the green module, 34 genes in the magenta module, 41 genes in the pink module, 63 genes in the red module and 71 genes in the yellow module. The 296 genes that could not be included in any modules were put into the gray module, which was reserved for genes identified as not coexpressed.
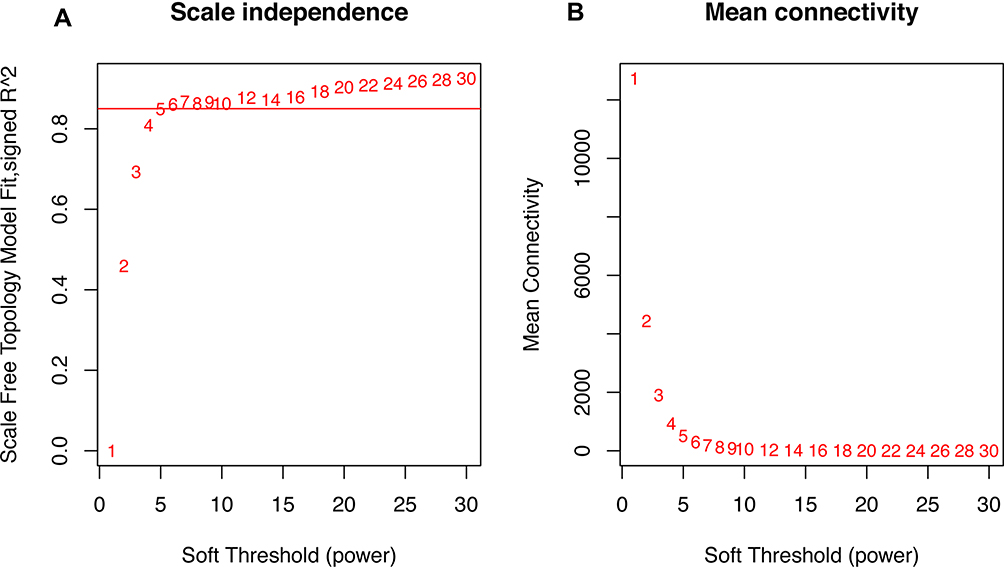 |
Figure 1 Clustering of samples and determination of soft-thresholding power. Notes: (A) Analysis of the scale-free fit index for various soft-thresholding powers (β). The red line represents the merging threshold. (B) Analysis of the mean connectivity for various soft-thresholding powers. In all, 5 was the most fit power value. |
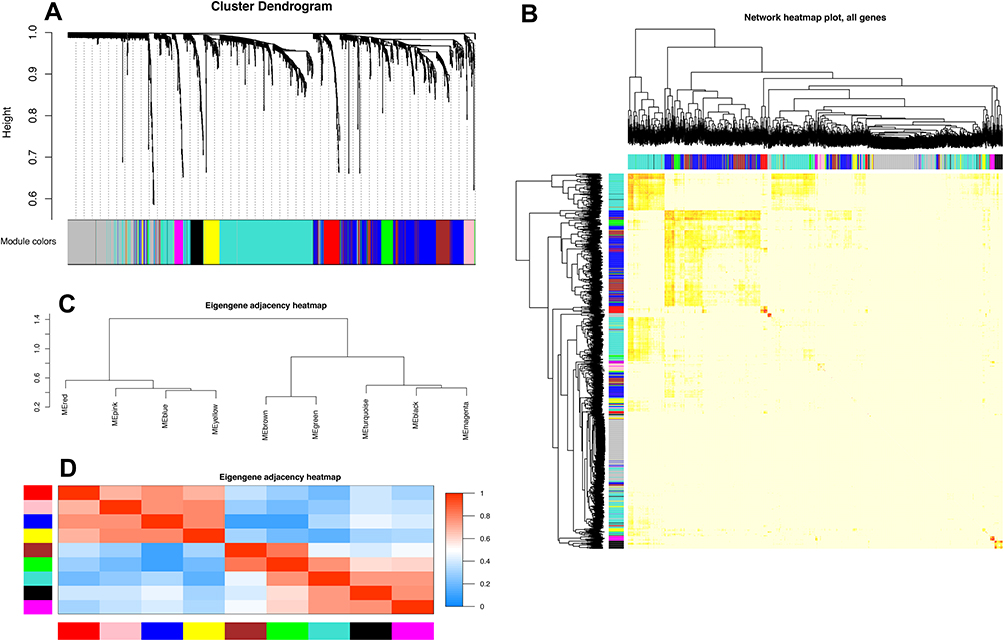 |
Figure 2 Construction of coexpression modules by the WGCNA package in r. Notes: (A) The cluster dendrogram of genes in GSE98793. Branches of the cluster dendrogram of the most connected genes gave rise to nine gene coexpression modules. Genes that could not be clustered into one of these modules were assigned to the gray module. Every gene represents a line in the hierarchical cluster. The distance between two genes is shown as the height on the y-axis. (B) Interaction relationship analysis of coexpressed genes. Different colors of the horizontal axis and vertical axis represent different modules. The brightness of yellow in the middle represents the degree of connectivity of different modules. There was no significant difference in interactions among different modules, indicating a high degree of independence among these modules. (C) Hierarchical clustering of module hub genes that summarize the modules yielded in the clustering analysis. (D) Heatmap plot of the adjacencies in the hub gene network. Abbreviation: WGCNA, weighted gene coexpression network analysis. |
Correlation Between Modules and Identification of Key Modules
Interactions between the nine coexpression modules were analyzed, and all genes were identified for the network heatmap (Figure 2B). Interestingly, the results revealed that some of these gene modules were independently validated, especially the turquoise, blue, brown and magenta modules, which demonstrated a high level of independence among the modules and relative independence of genes expressed in each module. To determine the connections and interactions among these nine coexpressed modules, we analyzed the connectivity of eigengenes. Combined with Figure 2C, we observed that these nine modules were classified into two main clusters: one included five modules (turquoise, black, brown, magenta and green modules), while the other included four modules (red, pink, yellow and blue modules). Furthermore, the results were demonstrated by the heatmap plotted according to the connectivity of eigengenes (Figure 2D). We found that the three pairs of modules had higher adjacencies, and they were the yellow and blue, brown and green, and black and magenta modules, respectively.
Functional Enrichment Analysis of Genes in Modules of Interest
Because the turquoise, blue and brown module modules were all highly correlated with MDD development, GO and KEGG enrichment analyses were performed to obtain further biological insight for the genes in the three constructed modules. As shown in Figure 3A, the genes in the turquoise module were mainly enriched in neutrophil activation involved in the immune response, neutrophil degranulation, neutrophil-mediated immunity and cAMP-dependent protein kinase activity (cAPK). Genes in the blue module (Figure 3B) were enriched in ribosome biogenesis, ncRNA and rRNA metabolic processes, T cell activation and DNA helicase activity. Genes in the brown module (Figure 3C) were primarily involved in mRNA 5ʹ-splice site recognition, glycosaminoglycan biosynthetic process, protein serine/threonine kinase activator activity and cellular response to caffeine. KEGG pathway analysis (Figure 3D) showed that the top enriched terms were the T cell receptor signaling pathway, primary immunodeficiency, the TNF signaling pathway, T-helper type 1 (Th1), T-helper type 2 (Th2) and T-helper type 17 (Th17) cell differentiation, autophagy and RNA degradation and oxidative phosphorylation. These results suggest that these genes are closely related to autophagy and cellular immune function.
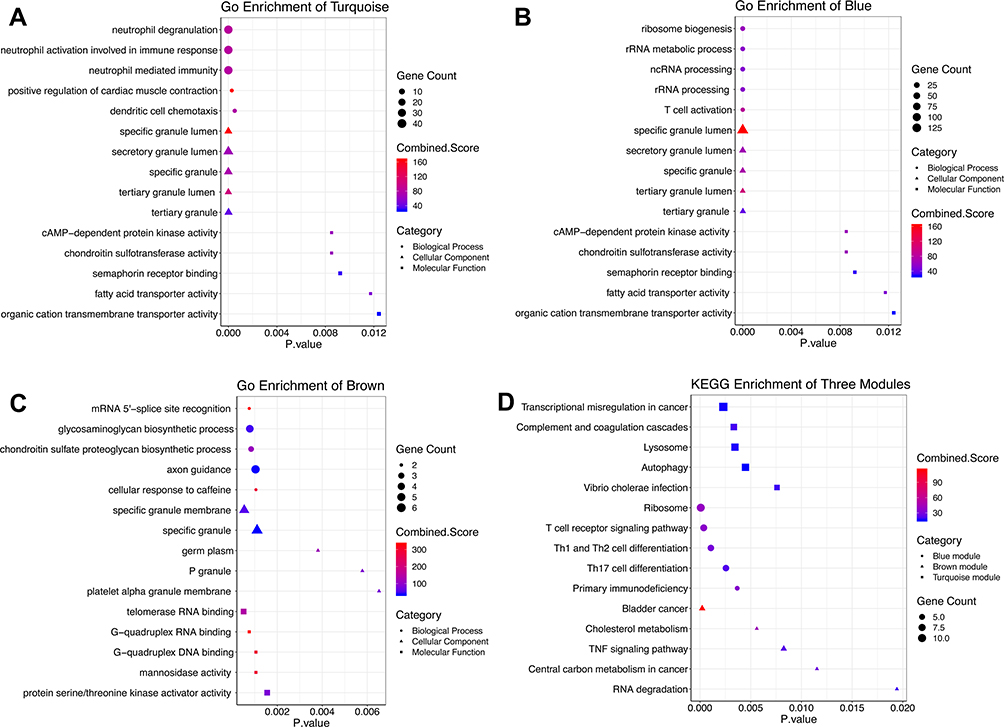 |
Figure 3 Top 5 GO analysis and KEGG pathway enrichment results for genes in three modules. Notes: (A) turquoise module, (B) blue module, and (C) brown module. The size of the bubble shows the enrichment significance, while colors indicate the enrichment score. Bubble nodes represent BP, triangular nodes represent CC, and square nodes represent MF. (D) KEGG pathway enrichment results. Bubble nodes represent the blue module, triangular nodes represent the brown module, and square nodes represent the turquoise module. Abbreviations: GO, Gene Ontology; KEGG, Kyoto Encyclopedia of Genes and Genomes; BP, biological process; MF, molecular function; CC, cellular component. |
PPI Network Construction and Analysis of Selected Modules
The protein-protein interaction (PPI) network of top-ranked genes for three selected modules was constructed based on the STRING database, including the turquoise, blue, and brown modules. All the modules were visualized by Cytoscape software as shown in Figure 4. The high degree of connectivity was calculated as the hub genes of the selected module by the cytoHubba plugin. Mitogen-activated protein kinase 3(MAPK3), resistin (RETN), matrix metallopeptidase 9 (MMP9), cathepsin D (CTSD) and cyclic adenosine monophosphate (cAMP) were identified in the turquoise module (Figure 4A and Table 1), which was enriched in neutrophil degranulation and activation involved in an immune response. Fibrillarin (FBL), ribosomal protein L11 (RPL11), ribosomal protein S18 (RPS18), NOP56 ribonucleoprotein (NOP56), ribosomal protein S5 (RPS5), ribosomal protein S14 (RPS14), MRT4 homolog (MRTO4), ribosomal protein L18a (RPL18A), ribosomal protein L35 (RPL35) and RNA polymerase I and III subunit C (POLR1C) were identified in the blue modules (Figure 4B and Table 2), which were enriched in ribosome biogenesis. Solute Carrier organic anion transporter family member 4C1 (SLCO4C1), vascular endothelial growth factor A (VEGFA) and serine and arginine rich splicing factor 1 (SRSF1) were identified in the brown module (Figure 4C and Table 3), which was enriched in mRNA 5ʹ-splice site recognition and glycosaminoglycan biosynthetic process.
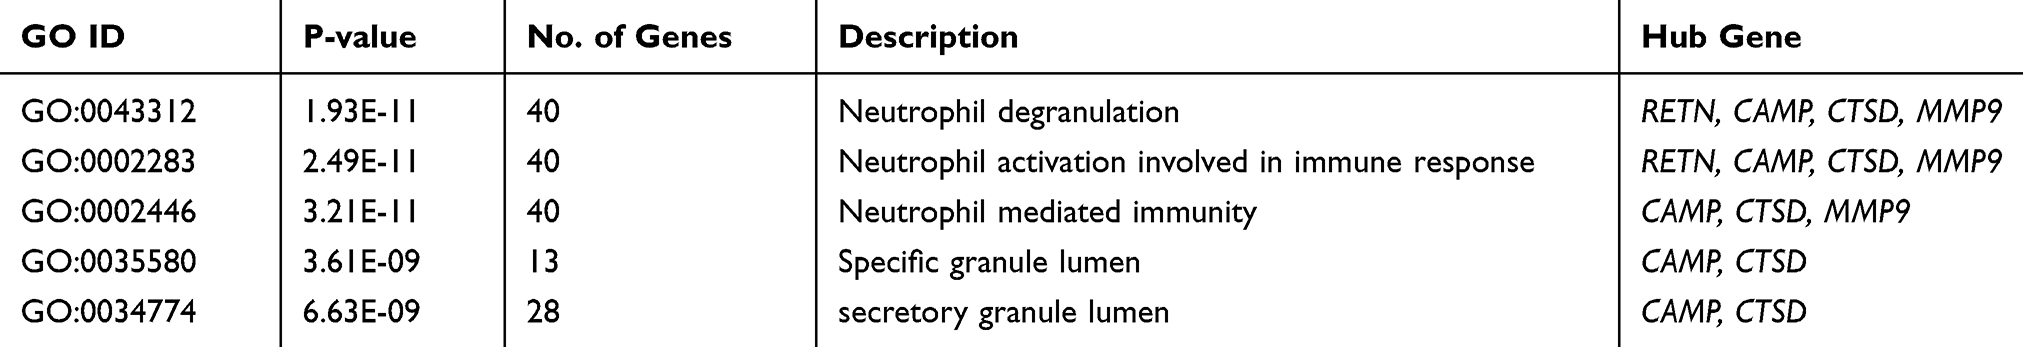 |
Table 1 Most Significant GO Terms of the Turquoise Module |
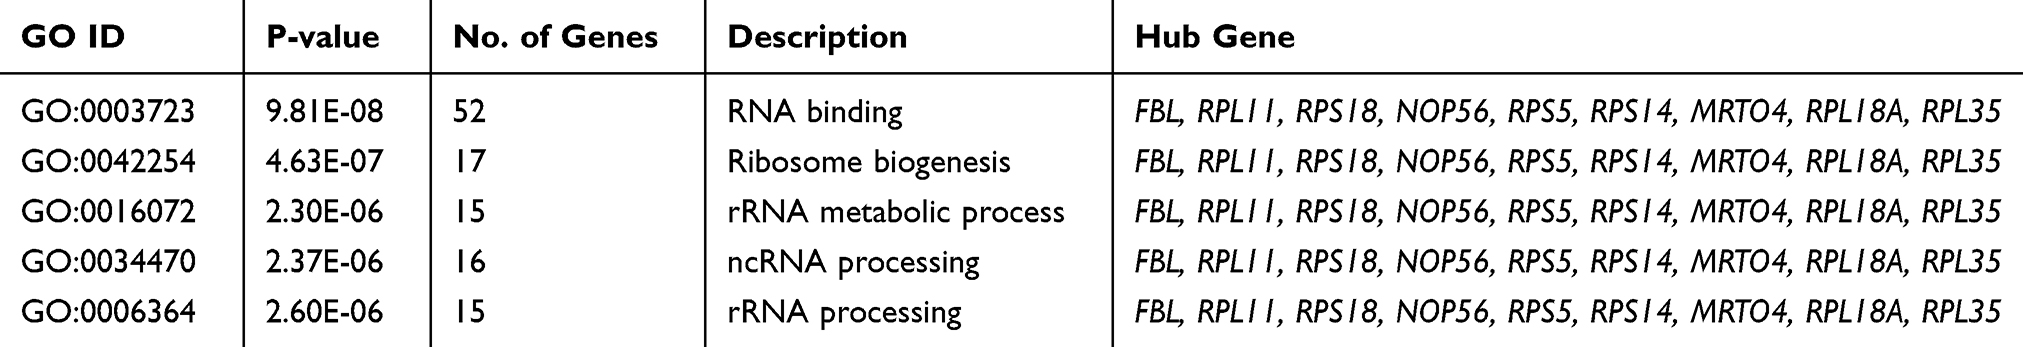 |
Table 2 Most Significant GO Terms of the Blue Module |
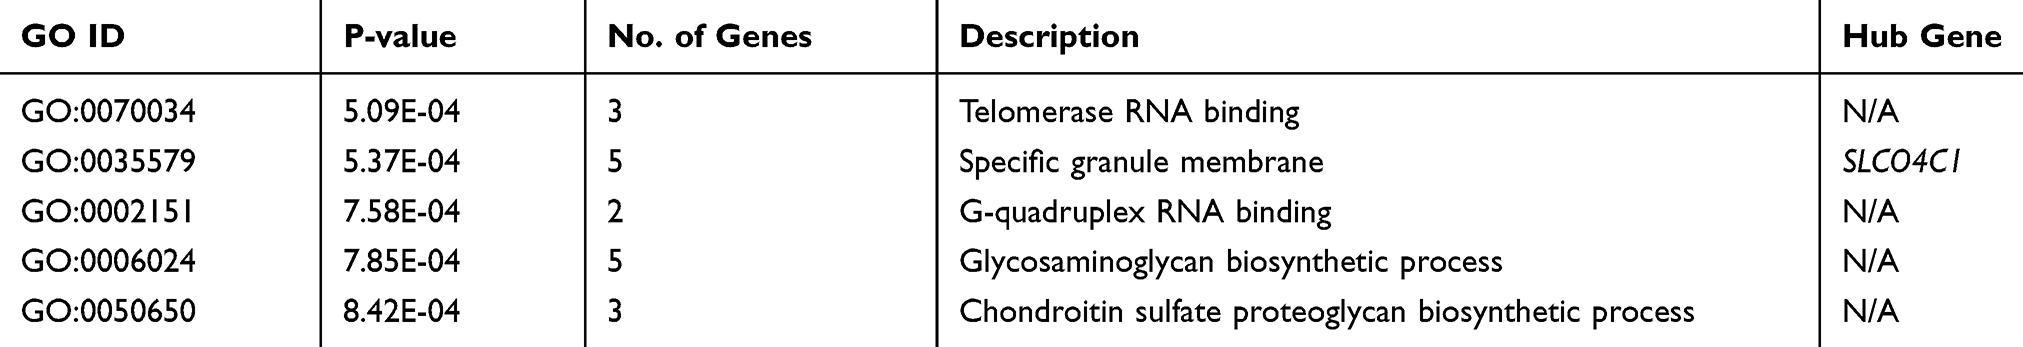 |
Table 3 Most Significant GO Terms of the Brown Module |
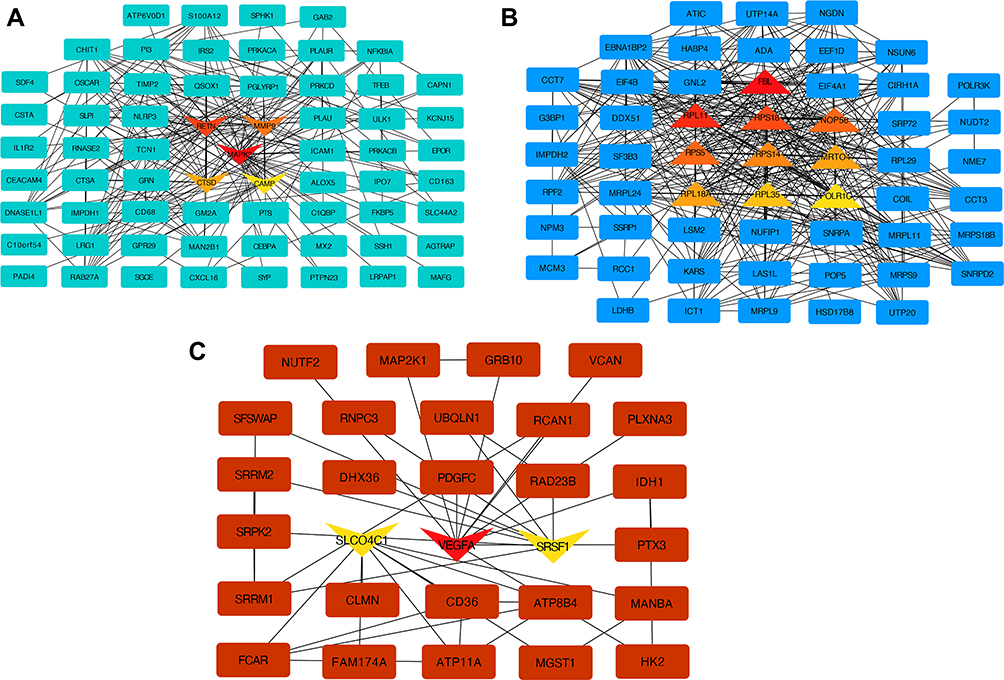 |
Figure 4 PPI network of hub genes in three modules. Notes: (A) turquoise module, with 65 nodes and 248 edges, (B) blue module, with 55 nodes and 387 edges, and (C) brown module, with 29 nodes and 42 edges. Triangular nodes represent hub genes; up nodes represent upregulated genes; down nodes represent downregulated genes. Abbreviation: PPI, Protein-protein interaction. |
Discussion
Depression is a major human disease that has become a pervasive public health problem.30,31 Despite advances in understanding the neurobiology of MDD, further research is warranted to determine the distinctive pathophysiology of MDD in contrast to many other brain disorders. Microarray technology has become a popular technology in recent years and is commonly used to obtain data regarding genetic alterations during the pathological process of disease.32 The GSE98793 dataset may be critical in the identification of pathophysiology and biomarkers in MDD. Several researchers have previously analyzed the dataset. Leday et al, who provided the original data for GSE98793, demonstrated that MDD was significantly enriched for an immune response to infection coupled with relative inactivation of the adaptive immune system, indicating the potential of transcriptional biomarkers for immunological stratification of patients with depression. Wang et al divided randomly into two nonoverlapping groups for cross-validation and found that MDD is mainly enriched in such pathways as ribonucleoprotein complex biogenesis, the Toll-like receptor signaling pathway, the apoptosis pathway, and the structural constituent of ribosomes.33 Unlike the previous studies mentioned in this report, the present study applied a new approach, based on WGCNA, to investigate the molecular mechanisms underlying MDD samples compared with control samples. A total of 3276 DEGs were used to build coexpression networks and identify groups of highly coexpressed genes. Moreover, we identified nine distinct coexpression modules based on the DEGs, and three highly correlated modules (turquoise, blue and brown modules) were obtained after the functions of the module’s analysis based on the coexpression network.
Over the last two decades, the hypothesis emerged that inflammatory processes and neural-immune interactions are involved in the pathogenesis of major depression.34–36 Many studies have shown that patients with MDD exhibit higher neutrophil and monocyte counts and an increased neutrophil to lymphocyte ratio (NLR) than controls. From our research, the turquoise module identified by WGCNA was the most significantly related module to MDD status. Genes in the turquoise module were mainly enriched in neutrophil degranulation, neutrophil-mediated immunity and neutrophil activation involved in the immune response, suggesting that genes in the turquoise module might play important roles in immune functions during MDD. According to the PPI network analysis from the turquoise module, RETN, cAMP, CTSD and MMP9 were identified as the high degree genes. Mutations in CTSD play a causal role in neuronal ceroid lipofuscinosis-10 and may be involved in the pathogenesis of several devastating neurodegenerative diseases. CTSD-deficient mice manifest depressive-like behavior, including anhedonia, behavioral despair, and enhanced learned helplessness. RETN also plays an important role in the pathophysiology of MDD, and resistin serum levels were lower in MDD individuals than in healthy controls.37 cAMP is a multifaceted modulator of immune synapse assembly and the inflammatory response. It has been reported that 5-HT7R not only stimulates cAMP production38 but also forms heterooligomers with 5-HT1AR,39 which are important for the pathogenesis of MDD. MMP-9 (also known as C1562T) has been confirmed to participate in the development of depression.40 Changes in MMP expression may be a common element in, or perhaps even a marker for, recurrent depressive disorders.41
Pathway enrichment analysis indicated that genes in the turquoise module were enriched in lysosomes and autophagy. Autophagy has been recognized as a pivotal process to ensure homeostasis of cells through lysosomal degradation of damaged macromolecules and organelles, which is linked to several diseases.42 Recently, autophagy has also been linked to depression, mainly through its involvement in the action of antidepressants. There are several publications that report that antidepressants impact autophagy, as has been reported very recently.43,44 One finding supporting the role of antidepressants in autophagy was that fluoxetine (10 μM), a selective serotonin reuptake inhibitor (SSRI), could promote unblocked autophagic flux by enhancing the fusion of autophagosomes with lysosomes in primary astrocytes.45 The tricyclic antidepressant amitriptyline was found to increase autophagy in primary neurons and astrocytes, similar to the selective serotonin reuptake inhibitor fluoxetine. A further expanded study found that amitriptyline and fluoxetine lead to the gradual accumulation of sphingomyelin in lysosomes, which stimulates autophagy via protein phosphatase 2A, ULK, Beclin, and LC3B.46,47 Although the molecular mechanism of the autophagy-modulating function of antidepressants is described in detail in several excellent reviews, it remains a major challenge that scientists have largely not explored.
The blue module was enriched in RNA binding, ncRNA processing, rRNA metabolic process and ribosome biogenesis. According to the network analysis of the blue module, FBL, RPL11, RPS18, NOP56, RPS5, RPS14, MRTO4, RPL18A and RPL35 were identified as high degree hub genes. The gene FBL is a component of a nucleolar small nuclear ribonucleoprotein (snRNP) particle thought to participate in the first step in processing pre-ribosomal RNA.48 NOP56 is required for assembly of the 60S ribosomal subunit and is involved in pre-rRNA processing.49 MRTO4 appears to be involved in mRNA turnover and ribosome assembly.50 The RPL11, RPS18, RPS5, RPS14, RPL18A and RPL35 genes encode ribosomal proteins. Each of the proteins belongs to the family of ribosomal proteins. All of the proteins are located in the cytoplasm.
Many cytokines with vital roles in the regulation of the immune system have been investigated in the pathology of MDD. Pathway enrichment analysis indicated that genes in the blue module were enriched in primary immunodeficiency, the T cell receptor signaling pathway, and Th1, Th2 and Th17 cell differentiation. Several studies have established that Th17 cells may contribute to the development of depression-like behavior.10,51,52 Th17 cells are a new T cell lineage CD4+ T helper cell. In addition to the traditional Th1 and Th2 subsets, Th1 cells may be derived from Th17 cells.53,54 Th17 cells are critical mediators of the cellular immune system that are characterized by the production of the inflammatory cytokines interleukin (IL)-17, IL-21 and IL-22. Th1 and Th2 cells may also play a regulatory role, as Th1 increased in mouse brains after depression-inducing stimuli. One study observed Th1 and Th2 cytokine imbalance in the subpopulation of depressed patients. Th2 cells can stimulate their own growth by producing IL-4,55 which is a cytokine. As the major Th2-type cytokine, IL-4 might be protective against depression due to its ability to counter regulate inflammation and to inhibit serotonin transporter activity. A recent study discovered that IL-4 was a critical participant in the regulation of depressive-like behavior in an untreated baseline condition,56 and the increase in depressive-like behavior during inflammation in wild-type mice might be mediated to some extent by a reduction in IL-4 signaling.
We acknowledge there were some limitations and shortcomings in this study. First, this study was mainly focused on data mining and data analysis, which were based on methodology and the results were not validated by experiments. Second, the samples from peripheral blood cells of patients, so the associated analysis of mRNAs in the brain regions with depression-related dysfunction may validate the data and strengthen the conclusion. Third, the results of this study should be interpreted within the context of important limitations.
Conclusion
Our study adopted a systems biology-based WGCNA method and identified numerous useful molecular targets for future investigation of the mechanisms and selection of biomarkers for MDD. Some important biological processes and pathways, including neutrophil activation involved in the immune response, T cell receptor signaling pathway, Th1, Th2 and Th17 cell differentiation and the hub genes functioning in these processes, may help to elucidate the development and progression of MDD. Furthermore, the potential molecular mechanisms that have been identified simultaneously include ribosome biogenesis, lysosomes, and autophagy. Our findings may help to elucidate the pathophysiology and progression of MDD. In addition, further molecular biological experiments will be performed by our team to confirm the function of the identified genes in MDD.
Acknowledgments
The authors thank all the participants in this study for their support.
Funding
This study was supported by grants from the Scientific Research Project of Integrated Traditional Chinese and Western Medicine of Tianjin Municipal Health and Health Committee (No. 2017114) and Tianjin Municipal Science and Technology Project (No. 17ZXMFSY00100).
Disclosure
The authors report no conflicts of interest in this work.
References
1. Chirita AL, Gheorman V, Bondari D, et al. Current understanding of the neurobiology of major depressive disorder. Rom J Morphol Embryol. 2015;56(2 Suppl):651–658.
2. Kennis M, Gerritsen L, van Dalen M, et al. Prospective biomarkers of major depressive disorder: a systematic review and meta-analysis. Mol Psychiatry. 2019;25:321–338.
3. Rehm J, Shield KD. Global burden of disease and the impact of mental and addictive disorders. Curr Psychiatry Rep. 2019;21(2):10. doi:10.1007/s11920-019-0997-0
4. Busch Y, Menke A. Blood-based biomarkers predicting response to antidepressants. J Neural Transmission. 2019;126(1):47–63. doi:10.1007/s00702-018-1844-x
5. Kaufmann FN, Costa AP, Ghisleni G, et al. NLRP3 inflammasome-driven pathways in depression: clinical and preclinical findings. Brain Behav Immun. 2017;64:367–383. doi:10.1016/j.bbi.2017.03.002
6. Ferrua CP, Giorgi R, da Rosa LC, et al. MicroRNAs expressed in depression and their associated pathways: a systematic review and a bioinformatics analysis. J Chem Neuroanat. 2019;100:101650. doi:10.1016/j.jchemneu.2019.101650
7. Takahashi M, Lim PJ, Tsubosaka M, et al. Effects of increased daily physical activity on mental health and depression biomarkers in postmenopausal women. J Phys Ther Sci. 2019;31(4):408–413. doi:10.1589/jpts.31.408
8. Herron JW, Nerurkar L, Cavanagh J. Neuroimmune biomarkers in mental illness. Curr Top Behav Neurosci. 2018;40:45–78.
9. Liu CS, Adibfar A, Herrmann N, et al. Evidence for inflammation-associated depression. Curr Top Behav Neurosci. 2017;31:3–30.
10. Kowalczyk M, Szemraj J, Blizniewska K, et al. An immune gate of depression - Early neuroimmune development in the formation of the underlying depressive disorder. Pharmacol Rep. 2019;71(6):1299–1307. doi:10.1016/j.pharep.2019.05.022
11. Dudek KA, Dion-albert L, Kaufmann FN, et al. Neurobiology of resilience in depression: immune and vascular insights from human and animal studies. Eur J Neurosci. 2019. doi:10.1111/ejn.14547
12. Duda W, Curzytek K, Kubera M, et al. Interaction of the immune-inflammatory and the kynurenine pathways in rats resistant to antidepressant treatment in model of depression. Int Immunopharmacol. 2019;73:527–538. doi:10.1016/j.intimp.2019.05.039
13. Wray NR, Ripke S, Mattheisen M, et al. Genome-wide association analyses identify 44 risk variants and refine the genetic architecture of major depression. Nat Genet. 2018;50(5):668–681. doi:10.1038/s41588-018-0090-3
14. Yu C, Arcos-burgos M, Baune BT, et al. Low-frequency and rare variants may contribute to elucidate the genetics of major depressive disorder. Transl Psychiatry. 2018;8(1):70. doi:10.1038/s41398-018-0117-7
15. Amin N, Jovanova O, Adams HH, et al. Exome-sequencing in a large population-based study reveals a rare Asn396Ser variant in the LIPG gene associated with depressive symptoms. Mol Psychiatry. 2017;22(4):634.
16. Zhao W, Langfelder P, Fuller T, et al. Weighted gene coexpression network analysis: state of the art. J Biopharm Stat. 2010;20(2):281–300. doi:10.1080/10543400903572753
17. Liu W, Li L, Ye H, et al. Weighted gene co-expression network analysis in biomedicine research. Sheng Wu Gong Cheng Xue Bao. 2017;33(11):1791–1801. doi:10.13345/j.cjb.170006
18. Leday GGR, Vertes PE, Richardson S, et al. Replicable and coupled changes in innate and adaptive immune gene expression in two case-control studies of blood microarrays in major depressive disorder. Biol Psychiatry. 2018;83(1):70–80. doi:10.1016/j.biopsych.2017.01.021
19. Tusher VG, Tibshirani R, Chu G. Significance analysis of microarrays applied to the ionizing radiation response. Proc Natl Acad Sci U S A. 2001;98(9):5116–5121. doi:10.1073/pnas.091062498
20. Ritchie ME, Phipson B, Wu D, et al. limma powers differential expression analyses for RNA-sequencing and microarray studies. Nucleic Acids Res. 2015;43(7):e47. doi:10.1093/nar/gkv007
21. Gaiteri C, Ding Y, French B, et al. Beyond modules and hubs: the potential of gene coexpression networks for investigating molecular mechanisms of complex brain disorders. Genes Brain Behav. 2014;13(1):13–24. doi:10.1111/gbb.12106
22. Bagot RC, Cates HM, Purushothaman I, et al. Circuit-wide transcriptional profiling reveals brain region-specific gene networks regulating depression susceptibility. Neuron. 2016;90(5):969–983. doi:10.1016/j.neuron.2016.04.015
23. Kogelman LJ, Falkenberg K, Halldorsson GH, et al. Comparing migraine with and without aura to healthy controls using RNA sequencing. Cephalalgia. 2019;39(11):1435–1444. doi:10.1177/0333102419851812
24. Langfelder P, Horvath S. WGCNA: an R package for weighted correlation network analysis. BMC Bioinformatics. 2008;9(1):559. doi:10.1186/1471-2105-9-559
25. Chen EY, Tan CM, Kou Y, et al. Enrichr: interactive and collaborative HTML5 gene list enrichment analysis tool. BMC Bioinformatics. 2013;14:128. doi:10.1186/1471-2105-14-128
26. Kuleshov MV, Jones MR, Rouillard AD, et al. Enrichr: a comprehensive gene set enrichment analysis web server 2016 update. Nucleic Acids Res. 2016;44(W1):W90–W97. doi:10.1093/nar/gkw377
27. Gonzalez-castro TB, Tovilla-zarate CA, Genis-mendoza AD, et al. Identification of gene ontology and pathways implicated in suicide behavior: systematic review and enrichment analysis of GWAS studies. Am J Med Genet B Neuropsychiatr Genet. 2019;180(5):320–329. doi:10.1002/ajmg.b.32731
28. Szklarczyk D, Morris JH, Cook H, et al. The STRING database in 2017: quality-controlled protein-protein association networks, made broadly accessible. Nucleic Acids Res. 2017;45(D1):D362–D368. doi:10.1093/nar/gkw937
29. Shannon P, Markiel A, Ozier O, et al. Cytoscape: a software environment for integrated models of biomolecular interaction networks. Genome Res. 2003;13(11):2498–2504. doi:10.1101/gr.1239303
30. Smith K. Mental health: a world of depression. Nature. 2014;515(7526):181. doi:10.1038/515180a
31. Rotenstein LS, Ramos MA, Torre M, et al. Prevalence of depression, depressive symptoms, and suicidal ideation among medical students: a systematic review and meta-analysis. JAMA. 2016;316(21):2214–2236. doi:10.1001/jama.2016.17324
32. Bian Y, Yang L, Zhao M, et al. Identification of key genes and pathways in post-traumatic stress disorder using microarray analysis. Front Psychol. 2019;10:302. doi:10.3389/fpsyg.2019.00302
33. Wang H, Zhang M, Xie Q, et al. Identification of diagnostic markers for major depressive disorder by cross-validation of data from whole blood samples. Peer J. 2019;7:e7171. doi:10.7717/peerj.7171
34. Jentsch MC, Van Buel EM, Bosker FJ, et al. Biomarker approaches in major depressive disorder evaluated in the context of current hypotheses. Biomark Med. 2015;9(3):277–297. doi:10.2217/bmm.14.114
35. Kohler O, Krogh J, Mors O, et al. Inflammation in depression and the potential for anti-inflammatory treatment. Curr Neuropharmacol. 2016;14(7):732–742. doi:10.2174/1570159X14666151208113700
36. Schmidt FM, Kirkby KC, Lichtblau N. Inflammation and Immune regulation as potential drug targets in antidepressant treatment. Curr Neuropharmacol. 2016;14(7):674–687. doi:10.2174/1570159X14666160115130414
37. Carvalho AF, Fountoulakis KN, McIntyre RS. Editorial: cognitive dysfunction in major depressive disorder - pathophysiology, clinical implications and treatment opportunities). CNS Neurol Disord Drug Targets. 2014;13(10):1637–1639. doi:10.2174/1871527314666141226122612
38. Prasad S, Ponimaskin E, Zeug A. Serotonin receptor oligomerization regulates cAMP-based signaling. J Cell Sci. 2019;132(16):jcs230334. doi:10.1242/jcs.230334
39. Wang XL, Gao J, Wang XY, et al. Treatment with Shuyu capsule increases 5-HT1AR level and activation of cAMP-PKA-CREB pathway in hippocampal neurons treated with serum from a rat model of depression. Mol Med Rep. 2018;17(3):3575–3582. doi:10.3892/mmr.2017.8339
40. Bobinska K, Szemraj J, Czarny P, et al. Role of MMP-2, MMP-7, MMP-9 and TIMP-2 in the development of recurrent depressive disorder. J Affect Disord. 2016;205:119–129. doi:10.1016/j.jad.2016.03.068
41. Beroun A, Mitra S, Michaluk P, et al. MMPs in learning and memory and neuropsychiatric disorders. Cell Mol Life Sci. 2019;76(16):3207–3228.
42. Gassen NC, Rein T. Is there a role of autophagy in depression and antidepressant action? Front Psychiatry. 2019;10:337. doi:10.3389/fpsyt.2019.00337
43. Song X, Liu B, Cui L, et al. Silibinin ameliorates anxiety/depression-like behaviors in amyloid beta-treated rats by upregulating BDNF/TrkB pathway and attenuating autophagy in hippocampus. Physiol Behav. 2017;179:487–493. doi:10.1016/j.physbeh.2017.07.023
44. Rein T. Is autophagy involved in the diverse effects of antidepressants? Cells. 2019;8:1. doi:10.3390/cells8010044
45. Shu X, Sun Y, Sun X, et al. The effect of fluoxetine on astrocyte autophagy flux and injured mitochondria clearance in a mouse model of depression. Cell Death Dis. 2019;10(8):577. doi:10.1038/s41419-019-1813-9
46. Gulbins A, Schumacher F, Becker KA, et al. Antidepressants act by inducing autophagy controlled by sphingomyelin-ceramide. Mol Psychiatry. 2018;23(12):2324–2346. doi:10.1038/s41380-018-0090-9
47. Zhou Y, Tao X, Wang Z, et al. Hippocampus metabolic disturbance and autophagy deficiency in olfactory bulbectomized rats and the modulatory effect of fluoxetine. Int J Mol Sci. 2019;20(17):4282. doi:10.3390/ijms20174282
48. Shubina MY, Musinova YR, Sheval EV. Nucleolar methyltransferase fibrillarin: evolution of structure and functions. Biochemistry (Mosc). 2016;81(9):941–950. doi:10.1134/S0006297916090030
49. Lykke-andersen S, Ardal BK, Hollensen AK, et al. Box C/D snoRNP autoregulation by a cis-acting snoRNA in the NOP56 pre-mRNA. Mol Cell. 2018;72(1):99–111.e115. doi:10.1016/j.molcel.2018.08.017
50. Michalec-wawiorka B, Wawiorka L, Derylo K, et al. Molecular behavior of human Mrt4 protein, MRTO4, in stress conditions is regulated by its C-terminal region. Int J Biochem Cell Biol. 2015;69:233–240. doi:10.1016/j.biocel.2015.10.018
51. Beurel E, Lowell JA. Th17 cells in depression. Brain Behav Immun. 2018;69:28–34. doi:10.1016/j.bbi.2017.08.001
52. Osborne LM, Brar A, Klein SL. The role of Th17 cells in the pathophysiology of pregnancy and perinatal mood and anxiety disorders. Brain Behav Immun. 2019;76:7–16. doi:10.1016/j.bbi.2018.11.015
53. Beurel E, Lowell JA, Jope RS. Distinct characteristics of hippocampal pathogenic TH17 cells in a mouse model of depression. Brain Behav Immun. 2018;73:180–191. doi:10.1016/j.bbi.2018.04.012
54. Becking K, Haarman BCM, Grosse L, et al. The circulating levels of CD4+ t helper cells are higher in bipolar disorder as compared to major depressive disorder. J Neuroimmunol. 2018;319:28–36. doi:10.1016/j.jneuroim.2018.03.004
55. Wachholz S, Knorr A, Mengert L, et al. Interleukin-4 is a participant in the regulation of depressive-like behavior. Behav Brain Res. 2017;326:165–172. doi:10.1016/j.bbr.2017.03.020
56. Schulke S. Induction of interleukin-10 producing dendritic cells as a tool to suppress allergen-specific T helper 2 responses. Front Immunol. 2018;9:455. doi:10.3389/fimmu.2018.00455
 © 2020 The Author(s). This work is published and licensed by Dove Medical Press Limited. The full terms of this license are available at https://www.dovepress.com/terms.php and incorporate the Creative Commons Attribution - Non Commercial (unported, v3.0) License.
By accessing the work you hereby accept the Terms. Non-commercial uses of the work are permitted without any further permission from Dove Medical Press Limited, provided the work is properly attributed. For permission for commercial use of this work, please see paragraphs 4.2 and 5 of our Terms.
© 2020 The Author(s). This work is published and licensed by Dove Medical Press Limited. The full terms of this license are available at https://www.dovepress.com/terms.php and incorporate the Creative Commons Attribution - Non Commercial (unported, v3.0) License.
By accessing the work you hereby accept the Terms. Non-commercial uses of the work are permitted without any further permission from Dove Medical Press Limited, provided the work is properly attributed. For permission for commercial use of this work, please see paragraphs 4.2 and 5 of our Terms.