")
Back to Journals » OncoTargets and Therapy » Volume 12
Weighted Gene Co-Expression Network Analysis Identified Cancer Cell Proliferation as a Common Phenomenon During Perineural Invasion
Authors Huang T , Wang Y , Wang Z , Cui Y , Sun X , Wang Y
Received 4 September 2019
Accepted for publication 15 November 2019
Published 28 November 2019 Volume 2019:12 Pages 10361—10374
DOI https://doi.org/10.2147/OTT.S229852
Checked for plagiarism Yes
Review by Single anonymous peer review
Peer reviewer comments 2
Editor who approved publication: Dr Leo Jen-Liang Su
Ting Huang,1 Yiwei Wang,1 Zhihua Wang,1 Yunxia Cui,1 Xiao Sun,2 Yudong Wang3
1Department of Gynecology, International Peace Maternity and Child Health Hospital, Shanghai Jiao Tong University School of Medicine, Shanghai, People’s Republic of China; 2Department of Gynecology, International Peace Maternity and Child Health Hospital, Shanghai Jiao Tong University School of Medicine, Shanghai, People’s Republic of China, Shanghai Key Laboratory of Embryo Original Disease, Shanghai, People’s Republic of China, Shanghai Municipal Key Clinical Specialty, Shanghai, People’s Republic of China; 3Department of Gynecology, International Peace Maternity and Child Health Hospital, Shanghai Jiao Tong University School of Medicine, Shanghai, People’s Republic of China, Shanghai Public Health Clinical Center, Female Tumor Reproductive Specialty, Shanghai, People’s Republic of China
Correspondence: Yudong Wang; Xiao Sun
Department of Gynecology, International Peace Maternity and Child Health Hospital, Shanghai Jiao Tong University School of Medicine, No. 145 Guanyuan Road, Shanghai 200060, People’s Republic of China
Tel +86-18817819137; +86-18721201446
Email [email protected]; [email protected]
Purpose: Perineural invasion (PNI) is the neoplastic invasion of nerves by cancer cells, a process that may prove to be another metastatic route besides direct invasion, lymphatic spread, and vascular dissemination. Given the increasing incidence and association with poor prognosis, revealing the pathogenesis of perineural invasion is of great importance.
Materials and methods: Four datasets related to PNI were downloaded from the Gene Expression Omnibus database and used to construct weighted gene co-expression network analysis (WGCNA). The intersection of potential pathways obtained from further correlation and enrichment analyses of different datasets was validated by the coculture model of Schwann cells (SCs), flow cytometry and immunohistochemistry (IHC).
Results: GSE7055 and GSE86544 datasets were brought into the analysis for there were some significant modules related to PNI, while GSE103479 and GSE102238 datasets were excluded for insignificant differences. In total, 13,841 genes from GSE86544 and 10,809 genes from GSE7055 were used for WGCNA. As a consequence, 19 and 26 modules were generated, respectively. The purple module of GSE86544 and the dark gray module of GSE7055 were positively correlated with perineural invasion. Further correlation and enrichment analyses of genes from the two modules suggested that these genes were mainly enriched in cell cycle processes; especially, the terms S/G2/M phase were enriched. Three kinds of cells grew vigorously after coculture with SCs ex vivo. The Ki67 staining of the cervical cancer samples revealed that the Ki67 index of cancer cells surrounding nerves was higher than of those distant ones.
Conclusion: Our work has identified cancer cell proliferation as a common response to neural cancerous microenvironments, proving a foundation for cancer cell colonization and metastasis.
Keywords: WGCNA, perineural invasion, proliferation, nerve, cancer
Introduction
PNI is an active crosstalk between nerve and cancer, involving many molecules, resulting in neuronal outgrowth and fueling tumor progression.1–3 PNI is regarded as a common histological feature among many malignancies, including those of the head and neck,1 colon and rectum,4 prostate,5 biliary tract,6 stomach,7 uterus,8 and pancreas.9 Moreover, PNI is also an indicator of aggressive tumor behavior and poor prognosis of these malignancies. The highest incidence of PNI is observed in pancreatic ductal adenocarcinoma (80–100% of the cases).10 Due to the improvement of PNI detection technology and its clinical significance, increasing attention is being paid to investigating its pathogenesis.
Weighted gene co-expression network analysis (WGCNA), a systematic biological strategy, could be used for calculating the strength of a relationship using a weighted power.11–13 The distinct advantage of this method is that it can identify highly synergistically altered gene sets and further figure out those most relevant to phenotypes of interest.12 In the analysis of many diseases, such as breast cancer,14 osteosarcoma,15 and coronary artery disease,16 WGCNA has successfully been applied to survival analysis and the identification of candidate biomarker genes or pathways based on the association between gene sets and phenotypes.
As a major component of the peripheral nerves, Schwann cells (SCs) play a crucial role in promoting axon regeneration after nerve repair.17 SCs were reported to arrive at the site of cancer cells before the onset of cancer invasion and then induce cell movement towards nerves.18 CXCL1219 and L1CAM20,21 secreted from SCs induced pancreatic cancer cell migration and movement towards nerve. In this study, we constructed a nerve-cancer cell model by co-cultivating SCs and cancer cells in 6-well transwell plates.
In the neural cancerous microenvironment, different factors were secreted and put effect on cancer cells and nerves by different kinds of cancers.22 Here, we aimed to explore a common factor or a family of factors involved in PNI in different kinds of cancers. WGCNA was utilized to perform this analysis using the transcriptome datasets of cancers prone to nerve infiltration. The correlations between the synergistically altered gene modules and PNI were analyzed. Pathways were enriched and validated by abovementioned nerve-cancer cell model in a wider range of tumor samples. These findings may reveal universal pathways applicable to many malignancies associated with PNI, which may further help decipher the relationship between cancer cells and nerves.
Methods
Data Source and Processing
The study design was created in the form of a flow diagram (Figure 1). All genomic and clinical data were obtained from the GEO (Gene Expression Omnibus) database. We obtained four RNA sequence datasets with the keywords “perineural invasion” and “tumor” (GSE103479, GSE86544, GSE102238, and GSE7055) and their MINiML formatted family files were downloaded. The detail sample information of these datasets is listed in Table 1. The downloaded platform and MINiML files were transformed by R language software 3.6.1. The array probes were mapped to their respective gene IDs using corresponding array annotations and probes matching multiple genes were removed from the dataset. We calculated the average expression values of genes measured by multiple probes. Then, four datasets were standardized by quantiles. A total of 27,052 genes from GSE103479, 13,515 genes from GSE102238, 25,526 genes from GSE7055, and 34,602 genes from GSE86544 were left after the probe annotation. Since non-varying genes are usually regarded as background noise, we kept genes with both median absolute deviation (MAD) values and variances in the first 75% of GSE103479, GSE7055, and GSE86544.23 All genes of GSE102238 were chosen for WGCNA.
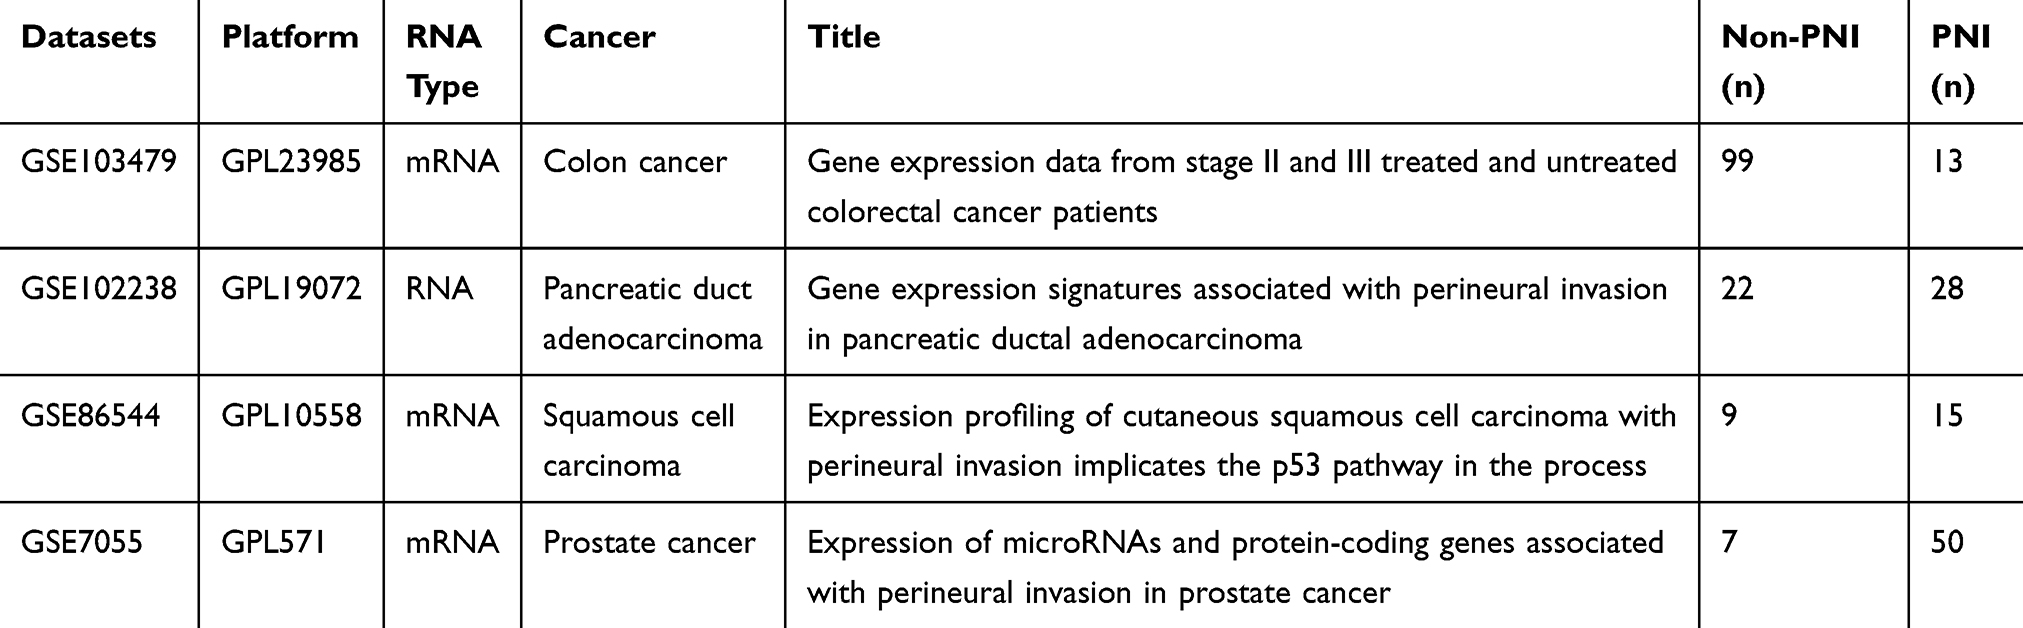 |
Table 1 The Details of Datasets That Downloaded from GEO and Used in Present Study |
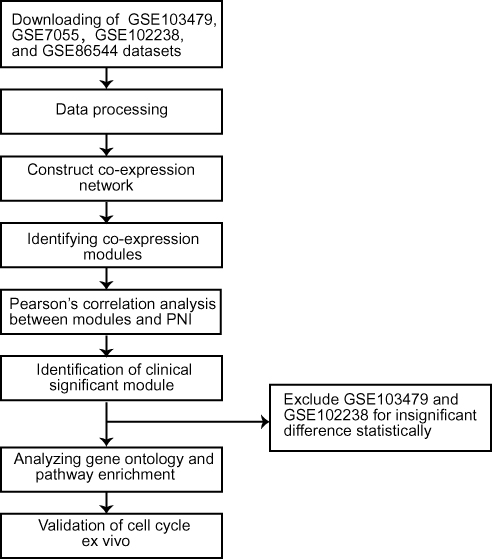 |
Figure 1 Flow diagram of the study approach. Notes: Four datasets (GSE103479, GSE86544, GSE102238, and GSE7055) were downloaded from the GEO database for further processing. After the pre-processing, network analyses of gene expression in all four datasets identified different modules of co-expression genes, respectively. Afterwards, the relevance between each module and PNI was tested through calculating the relevance between the feature vectors of modules and phenotypes including PNI. GSE103479 and GSE102238 were excluded for insufficient significant difference statistically. The modules most positively or negatively relevant to PNI in the remaining two datasets were selected for GO and enrichment analyses. Validation of cell cycle was performed via PI staining and IHC ex vivo.Abbreviations: PNI, perineural invasion; GO, gene ontology; PI, propidium iodide; IHC, immunohistochemistry. |
Due to insignificant differences, the GSE103479 (p-value of module−trait relationships > 0.05) and GSE102238 (p-value of module−trait relationships > 0.05) datasets were excluded from the analysis.
Analysis of Co-Expression Module Construction
WGCNA was performed on these filtered genes using the R “WGCNA” package. When constructing the co-expression modules, several parameters were filtered by the power law algorithm.12 Given that WGCNA is determined by the weighted co-expression, we tested the soft thresholding power to maintain a more robust stability. The mean connectivity of genes was then defined. According to the specific soft threshold and expression profiles, we converted the adjacency matrix into a distance matrix, which was then calculated to produce a hierarchical clustering tree. Modules were further clustered at a certain height, which is set as 30 genes in our research. In addition, a clustering tree on colorful modules and gray module (genes not clustered in any category) was built. Two modules were merged, as their Pearson’s correlation > 0.75.
Construction of Module–Trait Relationships
Module–trait associations between the module eigengenes (first principal component of the gene expression profile) and the phenotypes (clinical traits) were evaluated using the Pearson’s correlation. For gene significance (GS), the value of the correlation between each expression profile and each phenotype was calculated.24
Protein–Protein Interaction (PPI) Network Establishment and Hub Gene Identification
The PPI networks were constructed by the Search Tool for the Retrieval of Interacting Genes (STRING, http://string.embl.de/)25 and Cytoscape software (Version 3.6.1). Extracting from the most significant module, genes were mapped to STRING to evaluate the interactive relationships and visualized by Cytoscape.26 The Molecular Complex Detection (MCODE), a plug-in for the Cytoscape software, was used to screen modules of the PPI network with degree cut-off = 2, node score cut-off = 0.2, k-core = 2, and maximum depth = 100. The hub genes were identified by the cytoHubba plug-in.27 The top 30 nodes were considered as notable hub genes and displayed in Table 2 according to node degree.
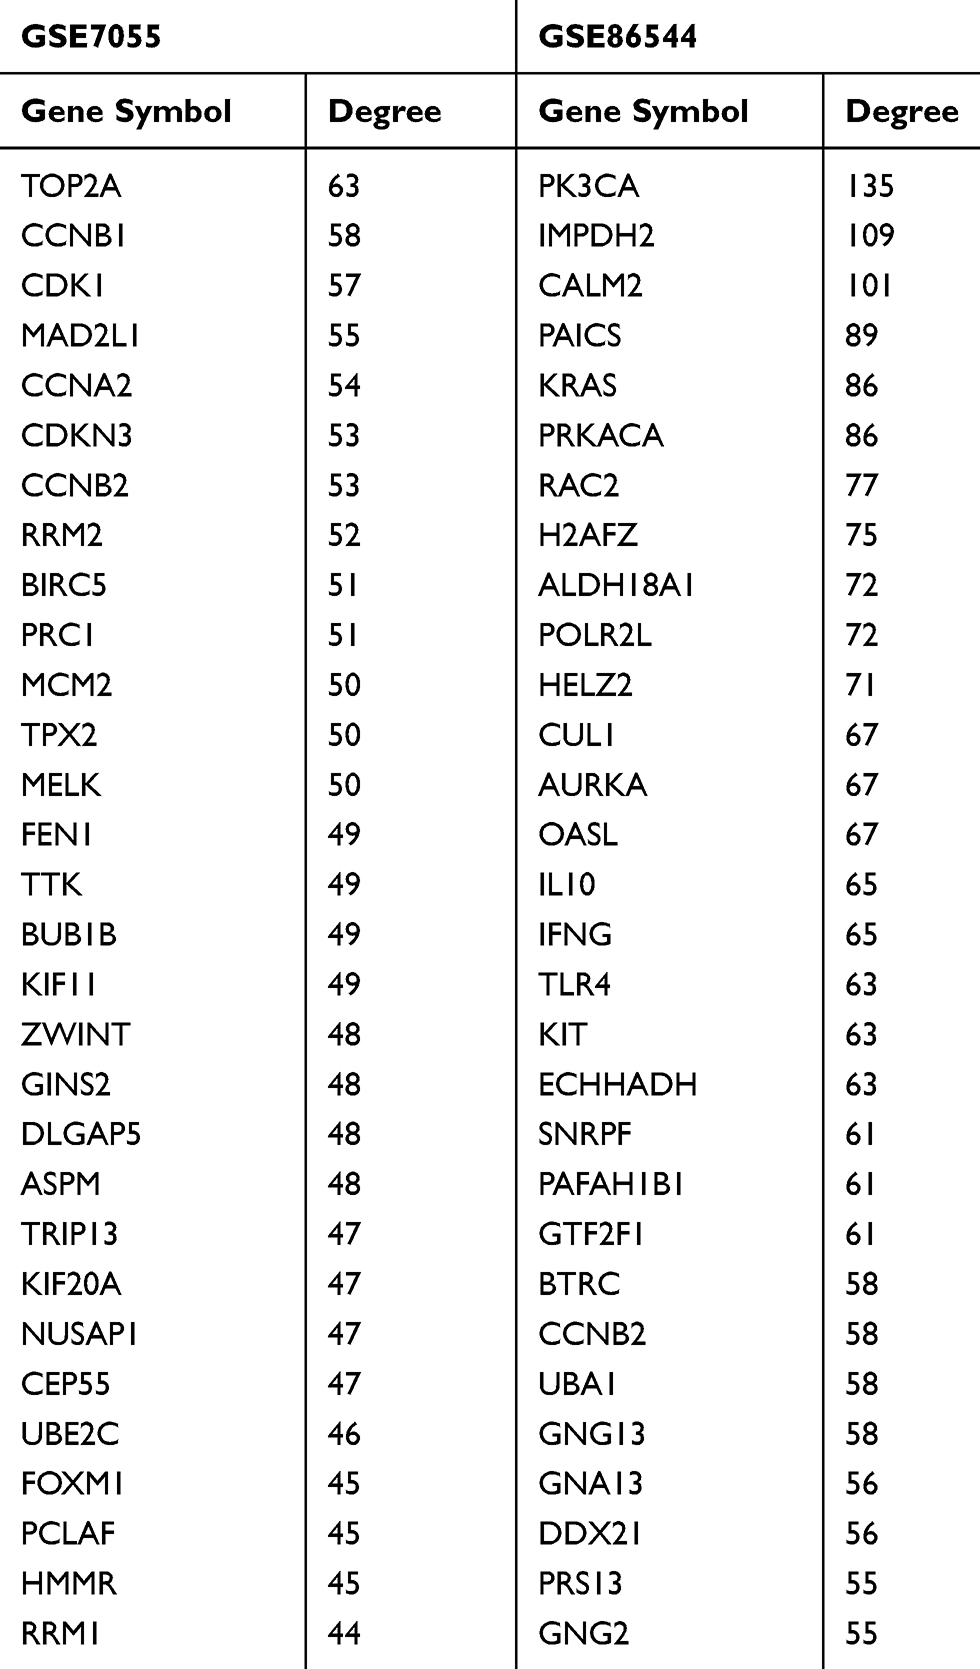 |
Table 2 Top 30 Hub Genes Identified by CytoHubba |
GO and KEGG Pathway Analyses of Co-Expression Modules
Metascape (http://metascape.org/) was selected for GO and KEGG pathway enrichment analyses. Genes obtained from cytoHubba in the most significant modules of the GSE86544 and GSE7055 datasets were imported into Metascape for further analysis. The cut-off criterion set was a P-value < 0.05 after correction. The network is visualized using Cytoscape. We identified the common pathways by comparing the results of both datasets.
Cell Culture
Human pancreatic (BxPC3 and PANC), cervical (ME-180), and colon (SW480) cancer cell lines were obtained from the American Type Culture Collection (Manassas, VA, USA). Rat Schwann cell lines were purchased from the Cell Bank of the Chinese Academy of Sciences (Shanghai, China). Cells were cultured in Dulbecco’s modified Eagle’s medium supplemented with 10% fetal bovine serum.
Immunohistochemistry
Ten cervical cancer patients with PNI and 10 non-PNI tissue samples were collected from the International Peace Maternity and Child Health Hospital. All patients had provided written informed consent, which was conducted in accordance with the Declaration of Helsinki and approved by the Institutional Ethics Committee of the IPMCH. The paraffin-embedded blocks were serially sectioned. For immunohistochemical (IHC) analysis, the samples were incubated with mouse monoclonal anti-Ki67 antibodies (CST-9449T, Cell Signaling Technology) at 4°C overnight and washed with PBS for 3 times. Sections were incubated with the secondary antibody for 30 mins, stained with diaminobenzidine, and counterstained with hematoxylin successively. The images were obtained by microscopy (Leica, Germany). The Ki67 index is calculated by the mean percentage of Ki67-positive cells under five independent high-power fields (200×).
Flow Cytometry
Cells from four tumor cell lines (SW480, PANC-1, BxPC-3, and ME-180) were seeded into 6-well plates at 2 × 10⁵ cells per well and cultured in serum-free DMEM medium for 12 hrs. A total of 1 × 10⁵ SCs were seeded into the upper chamber of a 6-well transwell filter (0.4 μm, Corning Inc., Glendale, AZ, USA) and cocultured for 36 hrs, with cancer cells at the bottom of the plate; non-cocultured samples of these cells were also maintained as control groups. All cancer cells were harvested and fixed in 70% ethanol overnight; then, they were incubated with RNase at the concentration of 50 μg/mL for 30 mins. Next, propidium iodide (PI; P4170, Sigma) was added into these tubes for another 30 mins. Analyses of PI-positive cells were used on BD FACS Canto II, and Modfit software (Verity Software, Topsham, ME, USA) was chosen for subsequent data processing.
Statistical Analysis
Statistical analyses were performed using GraphPad Prism 7. Data are presented as mean ± SEM. P-values ≤ 0.05 were considered statistically significant.
Results
Gene Expression Values of Four GEO Datasets Associated with PNI
We downloaded four datasets associated with PNI from GEO in order to further construct gene co-expression networks. The GSE86544 data set comprised 15 head and neck cancer cases with PNI and 9 normal persons. There were 57 cases of prostate cancer totally included in GSE7055, with 50 prostate adenocarcinomas with PNI and 7 without it. The other two datasets, GSE102238 and GSE103479, containing 50 and 156 samples, including 28 and 13 cases with PNI, respectively. The four datasets were standardized and the results are shown in Supplementary Figure 1. Finally, we obtained 10,821 genes from GSE103479, 13,515 genes from GSE102238, 10,809 genes from GSE7055, and 13,841 genes from GSE86544 for WCGNA after performing probe match and MAD screen.
These genes were used for cluster analysis to detect outliers using the flashclust tools of the WGCNA package. The process for the analysis (Supplementary Figure 2) of four datasets was similar. We have displayed the cluster analysis images for GSE86544 and GSE7055 as representative results. No abnormal sample from GSE86544 was excluded (Figure 2A), but four prostate cancer samples from GSE7055 were excluded (Figure 3A).
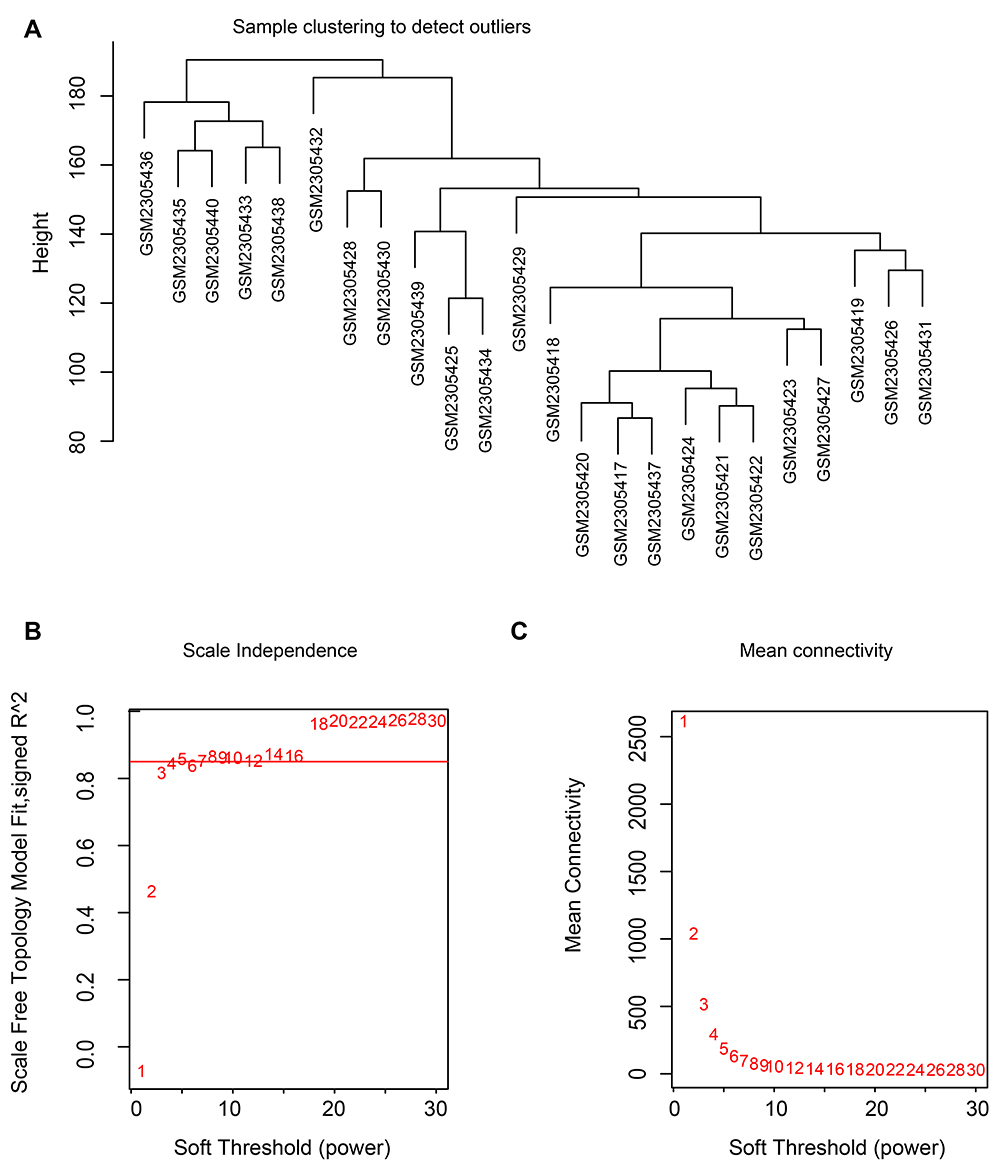 |
Figure 2 Clustering of samples and determination of soft-thresholding power in GSE86544. Notes: (A) The clustering was based on the expression data of GSE86544, which contained 15 PNI and 9 non-PNI samples. No samples in GSE86544 were excluded. (B) Analysis of the scale-free fit index for various soft-thresholding powers in GSE86544. (C) Analysis of the mean connectivity for various soft-thresholding powers. In all, 5 was the most fit power value for GSE86544.Abbreviation: PNI, perineural invasion. |
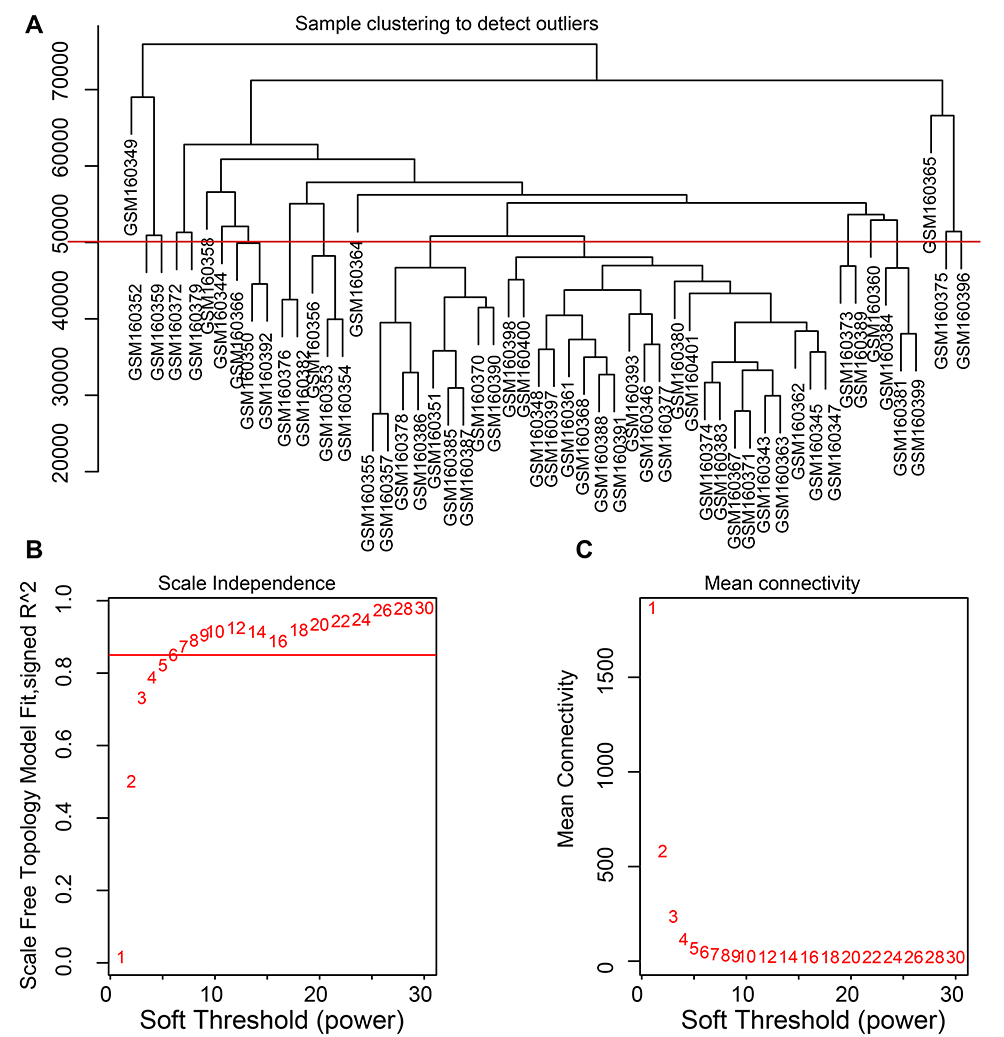 |
Figure 3 Clustering of samples and determination of soft-thresholding power in GSE7055. Notes: (A) The clustering was based on the expression data of GSE7055, which contained 50 PNI and 7 non-PNI samples. Four samples in GSE7055 were excluded. (B) Analysis of the scale-free fit index for various soft-thresholding powers in GSE7055. (C) Analysis of the mean connectivity for various soft-thresholding powers. In all, 6 was the most fit power value for GSE7055.Abbreviation: PNI, perineural invasion. |
Construction of Co-Expression Modules
The soft thresholding power was one of the critical parameters in WGCNA, making the constructed network more in line with the scale-free network characteristics. When the power value equaled 5, the degree of independence reached 0.85 and the average connectivity degree was appropriate (Figure 2B and C). Hence, a power value of 5 was set for producing a clustering dendrogram of the 13,814 genes in GSE86544 (Figure 4A). Nineteen modules were generated. There were 4934 genes contained in the largest module and 72 genes in the smallest one. The same operation was performed for the genes from GSE7055. The most appropriate power value was 6 and 26 modules were generated (Figure 3B and C).
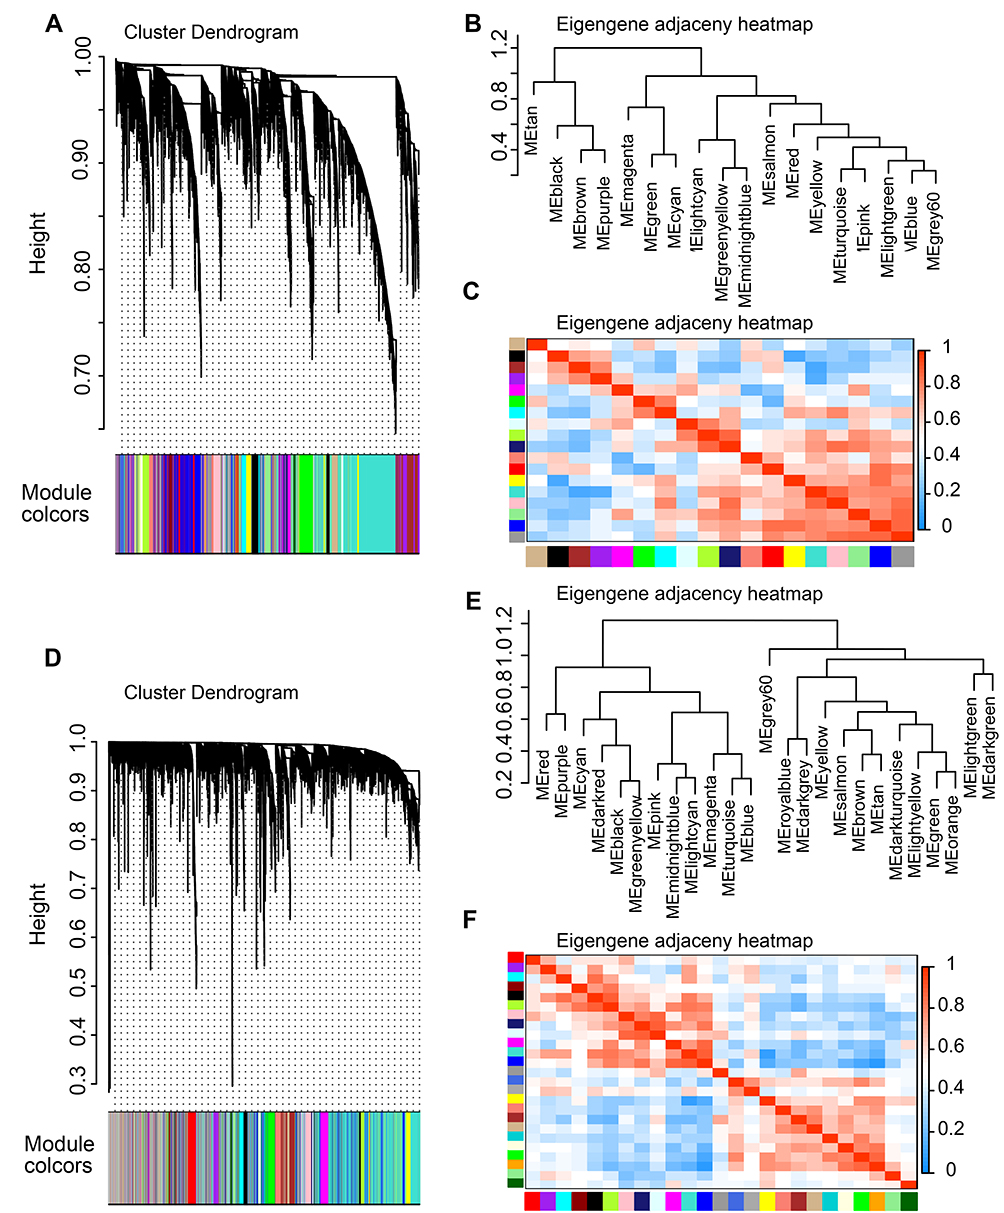 |
Figure 4 Construction of co-expression modules by WGCNA package. Notes: (A) The cluster dendrogram of genes in GSE86544. Each branch in the figure represents one gene, and every color below represents one co-expression module. (B) Hierarchical clustering of module hub genes of GSE86544 that summarizes the modules yielded in the clustering analysis. (C) Heatmap plot of the adjacencies in the hub gene network of GSE86544. (D) The cluster dendrogram of genes in GSE7055. A total of 26 modules were generated. (E) Hierarchical clustering of module hub genes of GSE7055 that summarize the modules yielded in the clustering analysis. (F) Heatmap plot of the adjacencies in the hub gene network of GSE7055.Abbreviation: WGCNA, weighted gene co-expression network analysis. |
Identification of Gene Co-Expression Modules Corresponding to Clinical Traits
To explore relationships across all modules, we quantified the module similarity according to the eigengene correlation and clustered them (Figure 4). Furthermore, the expression data from different genes within each calculated module were used to determine the module eigengenes in the four co-expression networks, respectively. The eigengenes were then correlated with clinical traits of interest, especially PNI. Thus, modules highly correlated with PNI could be selected and the most significant associations could also be identified. GSE103479 and GSE102238 were excluded, as they did not contain any module that was significantly related to PNI (Supplementary Figure 2). However, several modules from GSE7055 and GSE86544 were significantly correlated with PNI. P-value of 10 modules in case of the GSE86544 dataset showed significant difference including 4 modules (light cyan, green, purple, and brown) that were positively associated with PNI (Figure 5A). There were 2 modules (dark gray and purple) positively correlated with PNI in the GSE7055 dataset (Figure 5B). The purple module of GSE86544 and the dark gray module of GSE7055 were chosen for further analysis because of their minimum P-value of modules with positive association with PNI.
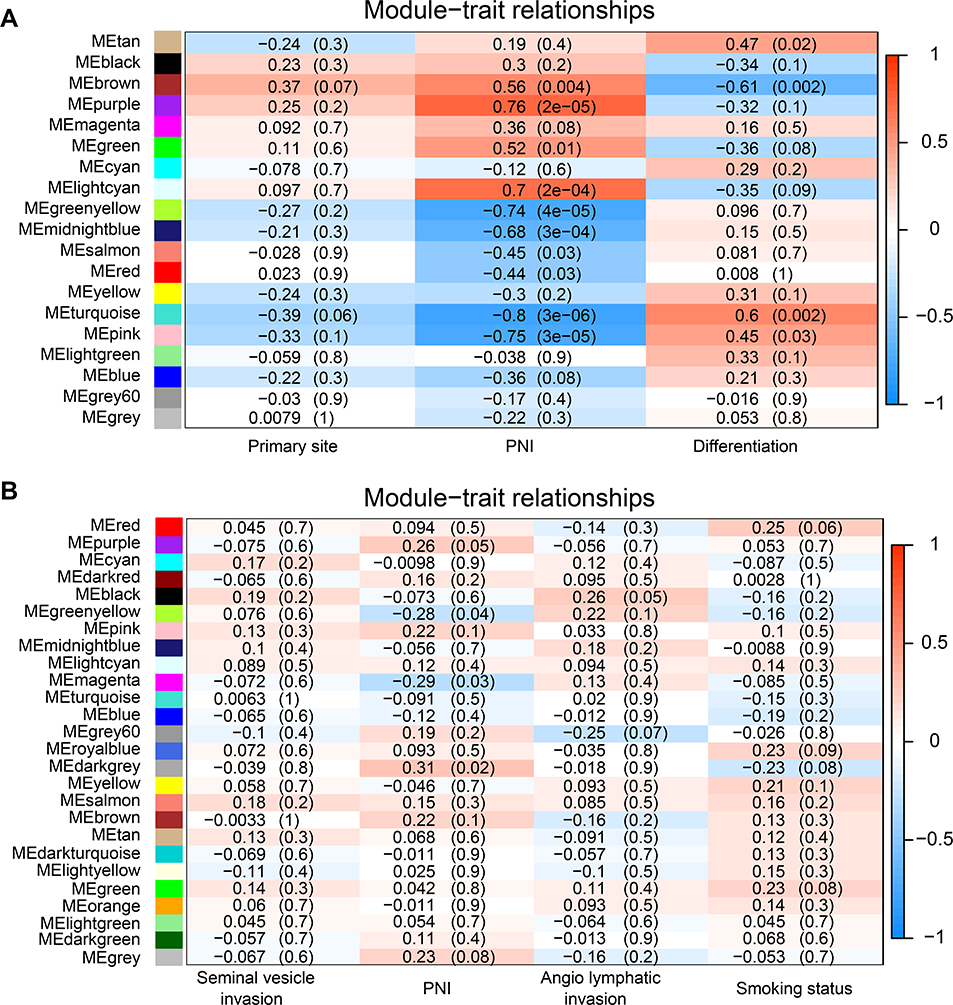 |
Figure 5 Correlation between module eigengenes and clinical traits especially PNI. Notes: (A and B) Module–trait relationships in GSE86544 and GSE7055. The correlation coefficients and corresponding P-values in the brackets are contained in each cell. The table is color-coded by correlation between eigengenes and traits according to the color legend on the right side. The modules with the most significant differences are displayed in brackets.Abbreviation: PNI, perineural invasion. |
PPI Network and Hub Gene Identification
The PPI networks were constructed using genes from the purple module of GSE86544 and the dark gray module of GSE7055. Then, 1263 genes of GSE86544 and 92 genes of GSE7055 were mapped to cytoscape to carry out topological algorithms. The top 30 genes of Degree topological algorithm are listed in Table 2 and considered as hub genes. Most hub genes of GSE7055 were related to cell mitosis and cell cycle. Genes directly regulating cell cycle include cyclin B1 (CCNB1), cyclin-dependent kinase 1 (CDK1), cyclin-dependent kinase inhibitor 3 (CDKN3), cyclin B2 (CCNB2), and ribonucleotide reductase regulatory subunit M2 (RRM2).
DNA topoisomerase II alpha (TOP2A), mitotic arrest deficiency protein 2 (MAD2L1) and minichromosome maintenance protein 2 (MCM2), Polycomb-repressive complex (PRC), TTK protein kinase (TTK), BUB1 mitotic checkpoint serine/threonine kinase B (BUB1B), kinesin family member 11 (KIF11), abnormal spindle microtubule assembly (ASPM), nucleolar and spindle associated protein 1 (NUSAP1), and PCNA clamp associated factor (PCLAF) involve in the DNA replication and cell mitosis. CCNB2 and aurora kinase A (AURKA) in GSE86544 are associated with cell cycle. There was no statistical difference of CCNB2 expression between non-PNI group and PNI group in colon cancer (GSE103479) and pancreatic cancer (GSE102238) (Supplementary Figure 3). The functions of genes were further explored in enrichment analysis.
Functional Annotation and Pathway Analysis of Genes Highly Associated with PNI
GO and KEGG enrichment analyses were performed by Metascape. The top 20 pathways were listed as below and the results revealed that genes of GSE86544 were mainly enriched in cytokine production (GO0001816), cytokine related-mediated signal pathway (GO0019221), and regulation of mitotic cell cycle (GO0007346) (Figure 6A and B, Supplementary Tables 1 and 2). The majority of the GO terms of GSE7055 were associated with cell adhesion (GO0007156), cell cycle (GO0045787), and DNA replication (GO0006260). For the GSE7055 dataset, the Reactome pathway analysis revealed that significant genes were enriched at the G2/M DNA replication checkpoint (hsa69478) (Figure 6C and D).
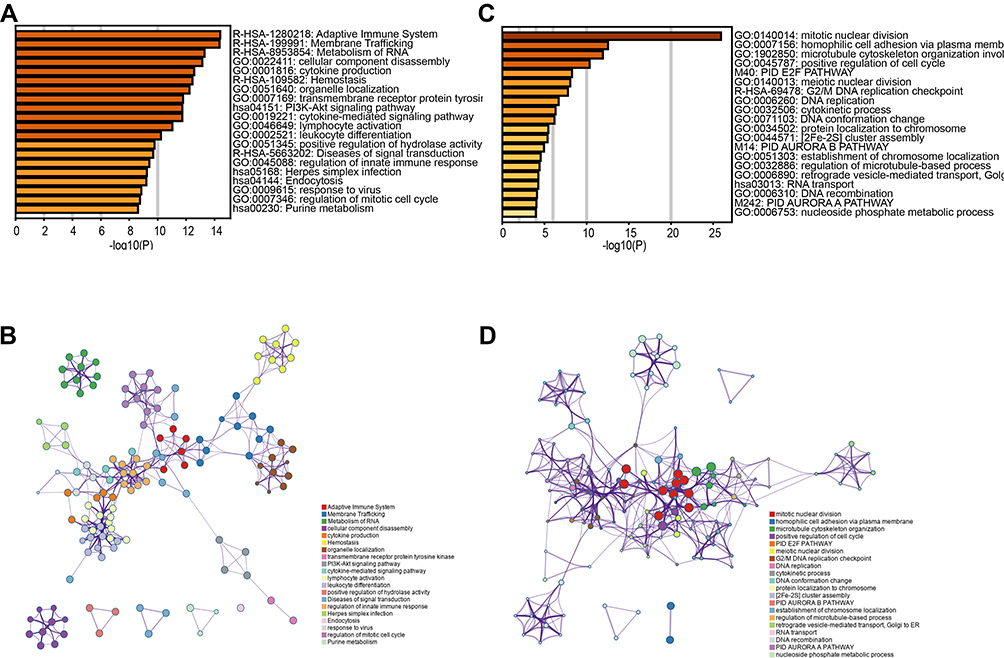 |
Figure 6 GO and KEGG pathway enrichment analyses in co-expression modules. Notes: To further get into the relationship among terms, the top 20 enriched terms were selected to build a network plot by Metascape. Each node represents an enriched term. (A and C) Boxplot of enriched terms across input gene lists from GSE86544 and GSE7055, respectively, colored by P-values. (B and D) Network of enriched terms, colored by P-value. Terms containing more genes tend to have a more significant P-value.Abbreviations: KEGG, Kyoto Encyclopedia of Genes and Genomes; GO, gene ontology. |
The intersection of the top 20 pathways showed that only the cell cycle pathway was both enriched in two datasets. Genes involved in this process were different between the two datasets. Combined with the top 30 hub genes mentioned earlier, we aim to explore the effects of nerves on tumor cell cycle.
Nerves Promote the Proliferation of Several Cancer Cells
Cells from four cancer cell lines, including two kinds of pancreatic cancer cell lines (BxPC-3 and PANC-1), one cervical cancer cell line (ME-180), and one colon cancer cell line (SW480), were used to analyze the effect of co-culture with SCs on cancer cell progression. The co-culture model was constructed by cancer cells and SCs (Figure 7A). After co-culturing PANC-1, ME-180, and SW480 cells with SCs, the proportion of cells in the S or G2/M phase increased, accompanied by a decrease in the proportion of cells in the G1 phase. However, there was no difference between cell proportions in different phases before and after co-culturing BxPC-3 (a human orthotopic pancreatic adenocarcinoma cell line) with SCs (Figure 7B and C). These results indicated that SCs promote the proliferation of cancer cells prone to PNI as a response to nerve-derived signals.
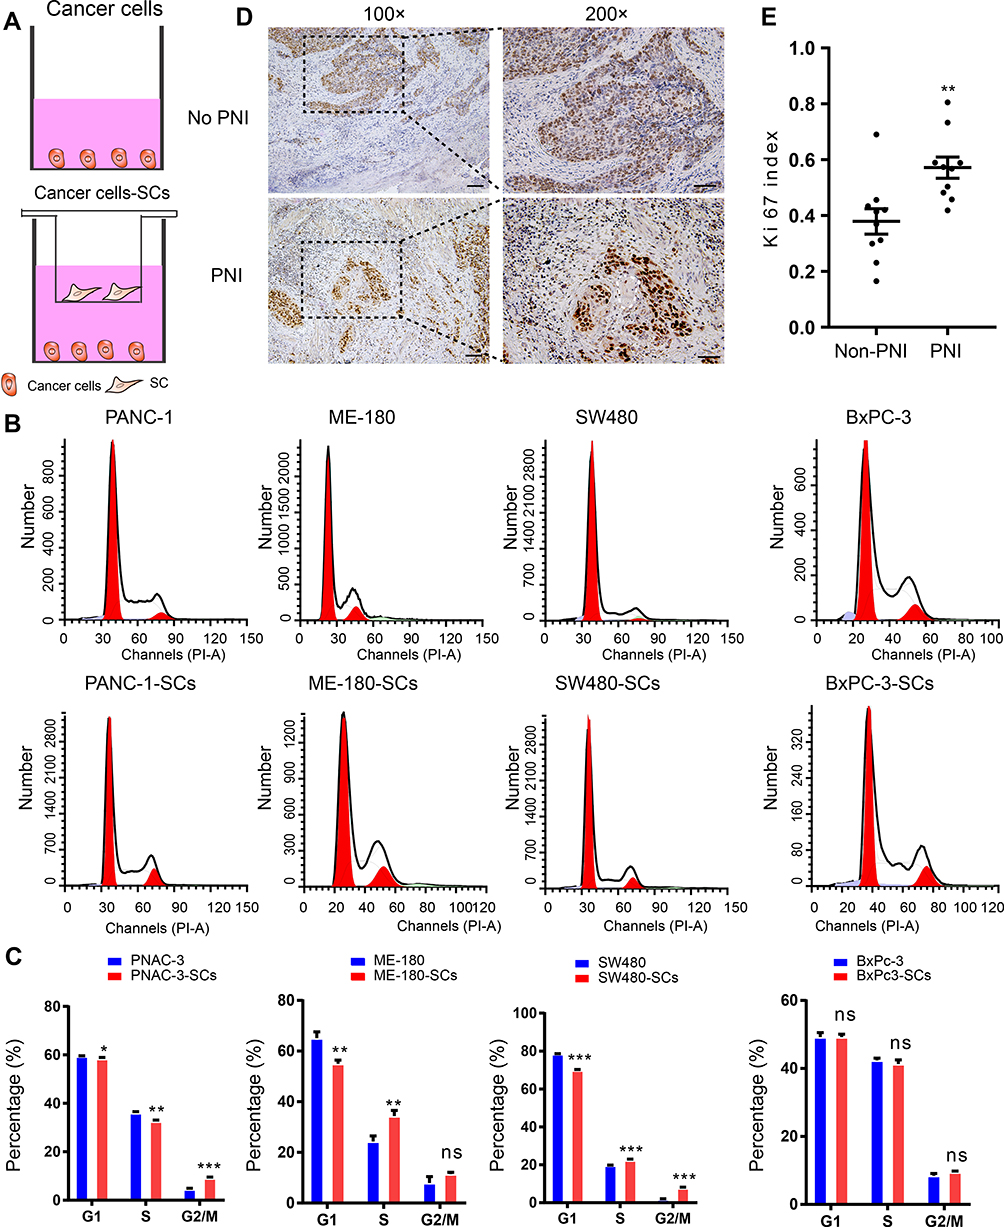 |
Figure 7 SCs promote proliferation of PANC-3, ME-180, and SW480 cells which are prone to PNI, while the proliferation of BxPC-3 is not affected. Notes: (A) Schematic illustration of the coculture model. (B and C) Flow cytometry was used to asses cell cycle after 36 hrs of several cancer cell lines (PANC-3, ME-180, SW480, and BxPC-3) co-culturing or not with SCs. (D) Ki67 staining of cervical cancer samples (Left image, 100× magnification, scale bar, 100 μm; Right image, 200× magnification, scale bar, 50 μm). White dotted lines indicate the nerve. (E) The statistical results show the comparison of the Ki67 index between two groups. The data presented are the mean ± SEM (*P < 0.05, **P < 0.01 and ***P < 0.001 compared to the control group. ns, not significant).Abbreviations: SCs, Schwann cells; SEM, Standard Error of Mean. |
In order to perform further validation, cervical cancer samples diagnosed as PNI and non-PNI were stained using anti-Ki67 antibodies. IHC analysis of the Ki67-stained samples revealed that cervical cancer cells surrounding nerves had a stronger staining intensity than those distant ones (Figure 7D). These results indicated that cancer cells infiltrating nerves grew more vigorously than those at their primary site and that the neural cancerous microenvironment contributes to cancer progression.
Discussion
Given the yearly improvements and awareness of PNI-detection technologies, it is important to unravel the mechanisms underlying PNI and disrupt it in cancer.28 WGCNA has advantages over unweighted network especially in the aspect of high sensitivity to low abundance and low information loss.29 As a recently developed method, WGCNA is usually used to analyze gene expression data and further explore potential therapeutic targets or diagnostic biomarkers.30 Considering the reliability of the results, at least 20 samples were required for WGCNA.31 In this study, we explored potential pathways underlying PNI using RNA omics data from the GEO database. Four datasets were obtained and processed using R “WGCNA” package. A total of 19 modules from GSE 86544 and 26 modules from GSE7055 were generated and meanwhile relationships between these modules and PNI were constructed. The most relevant module in each dataset was selected for further analysis. Through the enrichment analyses, we found that cell cycle was the only enriched pathway involved in PNI for head and neck cancer and prostate cancer simultaneously. Subsequently, samples of several other cancers including pancreatic cancer, colon cancer and cervical cancer that are liable to PNI were subjected for further experimental verification. Our results demonstrated that nerves facilitated the growth of several kinds of cancer cells; this might be a common result as a response to peripheral environment applicable to all cancers prone to PNI.
Several reports have shown that different factors including chemokines, transmitters, neurotrophic factors, and adhesion factors participate in the mutual interaction between nerve and cancer cells;19,21,32,33 most of them laid particular emphasis on the ability of migration, invasion, and metastasis of cancer cells towards nerves. In this study, we detected the cell cycle of several cell lines of cancers inclined to PNI and found their proliferation increased upon being co-cultured with SCs. It is rational that cancer cells proliferate responding to the same molecules associated with nerve regeneration.34 The nerve microenvironment is abundant in neurotrophic factors which have been reported to favor cancer proliferation.35,36
In our study, several hub genes were identified. Some of them, such as cyclins and cyclin-dependent kinases, directly participate in cycle regulation, while some genes influence cell cycle through other factors. MCM2 appears to be an attractive alternative to Ki 67 and expresses in actively proliferating cells.37 Baculoviral IAP repeat containing 5 (BIRC5), also called Survivin, has been reported to influence cell division and proliferation and inhibit apoptosis.38 Different genes involving cell cycle were enriched between the GSE7055 and GSE86544, which suggested that the factors or pathways affecting cell cycle differed in prostate and head and neck cancer.
It is worth mentioning that chemokines and adhesion factors support the perineural invasion. CXCL12 was reported to promote the mitosis and proliferation of vascular endothelial cells, and tumor cells in salivary adenoid cystic carcinoma.39 CX3CL1 could promote prostate cancer cell growth and metastasis through a steroid receptor coactivator or focal adhesion kinase pathway.40 These results indicated that chemokines and adhesion factors were involved in PNI and some of them could promote the proliferation of cancer cells. Despite their absence from the overlapped pathway of the two modules, chemokines and adhesion factors might still be the upstream factors regulating the cell cycle and needed to be further investigated.
Tumor metastasis and proliferation often occur simultaneously. Due to the heterogeneity of tumors, the signals mediating PNI in various cancers are different. However, a sufficient number of cancer cells is essential for their colonization and spread along nerves. Disrupting the expression of the neurotrophic factors and their receptors could result in tumor growth inhibition, specifically in breast cancer, prostatic, and pancreatic carcinomas.41,42 Magnon et al43 and Zhao et al44 have performed targeted therapy for blocking nerves in prostate cancer and gastric cancer, respectively, and the results have demonstrated that the removal of innervation could inhibit the growth and invasion of tumors. There are very few reports showing that nerves directly promote tumor cell proliferation; our study fills this gap in literature. However, further studies are required to further explore the signals promoting cancer growth which might play potential roles in mediating PNI.
Conclusion
In summary, our work has identified the proliferation of cancer cells as a common response to neural cancerous microenvironment, proving foundation for cancer cells colonization and spread away. Next, we would like to explore signals regulating cancer cell growth and hope to interrupt the nerve–cancer cell interaction and, thus, block the cancer cell metastasis.
Ethics Statement
The ethical approval for this study was obtained from the Institutional Ethics Committee of the International Peace Maternity and Child Health Hospital (IPMCH), number: [GKLW] 2017-125. We confirm that all patients provided written informed consent, in compliance with the Declaration of Helsinki.
Acknowledgments
This study was supported by the National Natural Science Foundation of China (No. 81172477 and 81402135), the Project of the Science and Technology Commission of Shanghai Municipality (No. 17441907400) and Shanghai Jiao Tong University Medicine-Engineering Fund (No. YG2017MS41). All authors thank the contributors of GEO for sharing the data on open access.
Disclosure
The authors declare that there are no conflicts of interest in this work.
References
1. Gil Z, Cavel O, Kelly K, et al. Paracrine regulation of pancreatic cancer cell invasion by peripheral nerves. J Natl Cancer Inst. 2010;102:107–118. doi:10.1093/jnci/djp456
2. Jobling P, Pundavela J, Oliveira SMR, et al. Nerve-cancer cell cross-talk: a novel promoter of tumor progression. Cancer Res. 2015;75:1777–1781. doi:10.1158/0008-5472.CAN-14-3180
3. Scanlon CS, Banerjee R, Inglehart RC, et al. Galanin modulates the neural niche to favour perineural invasion in head and neck cancer. Nat Commun. 2015;6:6885. doi:10.1038/ncomms7885
4. Knijn N, Mogk SC, Teerenstra S, Simmer F, Nagtegaal ID. Perineural invasion is a strong prognostic factor in colorectal cancer: a systematic review. Am J Surg Pathol. 2016;40:103–112. doi:10.1097/PAS.0000000000000518
5. Beard CJ, Chen MH, Cote K, et al. Perineural invasion is associated with increased relapse after external beam radiotherapy for men with low-risk prostate cancer and may be a marker for occult, high-grade cancer. Int J Radiat Oncol Biol Phys. 2004;58:19–24. doi:10.1016/S0360-3016(03)01433-0
6. Su C-H, Tsay S-H, Wu -C-C, et al. Factors influencing postoperative morbidity, mortality, and survival after resection for hilar cholangiocarcinoma. Ann Surg. 1996;223:384–394. doi:10.1097/00000658-199604000-00007
7. Duraker N, Sişman S, Can G. The significance of perineural invasion as a prognostic factor in patients with gastric carcinoma. Surg Today. 2003;33:95–100. doi:10.1007/s005950300020
8. Tang M, Liu Q, Yang X, et al. Perineural invasion as a prognostic risk factor in patients with early cervical cancer. Oncol Lett. 2019;17:1101–1107. doi:10.3892/ol.2018.9674
9. Feng FY, Qian Y, Stenmark MH, et al. Perineural invasion predicts increased recurrence, metastasis, and death from prostate cancer following treatment with dose-escalated radiation therapy. Int J Radiat Oncol Biol Phys. 2011;81:e361–e367. doi:10.1016/j.ijrobp.2011.04.048
10. Shimada K, Nara S, Esaki M, et al. Intrapancreatic nerve invasion as a predictor for recurrence after pancreaticoduodenectomy in patients with invasive ductal carcinoma of the pancreas. Pancreas. 2011;40:464–468. doi:10.1097/MPA.0b013e31820b5d37
11. Zhang B, Horvath S. A general framework for weighted gene co-expression network analysis. Stat Appl Genet Mol Biol. 2005;4:Article17. doi:10.2202/1544-6115.1128
12. Langfelder P, Horvath S. WGCNA: an R package for weighted correlation network analysis. BMC Bioinformatics. 2008;9:559. doi:10.1186/1471-2105-9-559
13. Zhao W, Langfelder P, Fuller T, et al. Weighted gene coexpression network analysis: state of the art. J Biopharm Stat. 2010;20:281–300. doi:10.1080/10543400903572753
14. Clarke C, Madden SF, Doolan P, et al. Correlating transcriptional networks to breast cancer survival: a large-scale coexpression analysis. Carcinogenesis. 2013;34:2300–2308. doi:10.1093/carcin/bgt208
15. Liu X, Hu AX, Zhao JL, Chen FL. Identification of key gene modules in human osteosarcoma by co-expression analysis Weighted Gene Co-Expression Network Analysis (WGCNA). J Cell Biochem. 2017;118:3953–3959. doi:10.1002/jcb.26050
16. Peng XY, Wang Y, Hu H, Zhang XJ, Li Q. Identification of the molecular subgroups in coronary artery disease by gene expression profiles. J Cell Physiol. 2019. doi:10.1002/jcp.28324
17. Jessen KR, Mirsky R, Lloyd AC. Schwann cells: development and role in nerve repair. Cold Spring Harb Perspect Biol. 2015;7:a020487. doi:10.1101/cshperspect.a020487
18. Demir IE, Boldis A, Pfitzinger PL. et al. Investigation of Schwann cells at neoplastic cell sites before the onset of cancer invasion. J Natl Cancer Inst. 2014;106.
19. Xu Q, Wang Z, Chen X, et al. Stromal-derived factor-1α/CXCL12-CXCR4 chemotactic pathway promotes perineural invasion in pancreatic cancer. Oncotarget. 2015;6:4717–4732. doi:10.18632/oncotarget.3069
20. Ben Q-W, Wang J-C, Liu J, et al. Positive expression of L1-CAM is associated with perineural invasion and poor outcome in pancreatic ductal adenocarcinoma. Ann Surg Oncol. 2010;17:2213–2221. doi:10.1245/s10434-010-0955-x
21. Na’ara S, Amit M, Gil Z. L1CAM induces perineural invasion of pancreas cancer cells by upregulation of metalloproteinase expression. Oncogene. 2019;38:596–608. doi:10.1038/s41388-018-0458-y
22. Saloman JL, Albers KM, Rhim AD, Davis BM. Can stopping nerves, stop cancer. Trends Neurosci. 2016;39:880–889. doi:10.1016/j.tins.2016.10.002
23. Huang J, Li Y, Lu Z, et al. Analysis of functional hub genes identifies CDC45 as an oncogene in non-small cell lung cancer - a short report. Cell Oncol (Dordr). 2019;42(4):571–578. doi:10.1007/s13402-019-00438-y
24. Shi K, Bing Z-T, Cao G-Q, et al. Identify the signature genes for diagnose of uveal melanoma by weight gene co-expression network analysis. Int J Ophthalmol. 2015;8:269–274. doi:10.3980/j.issn.2222-3959.2015.02.10
25. von Mering C, Huynen M, Jaeggi D, Schmidt S, Bork P, Snel B. STRING: a database of predicted functional associations between proteins. Nucleic Acids Res. 2003;31(1):258–261. doi:10.1093/nar/gkg034
26. Shannon P, Markiel A, Ozier O, et al. Cytoscape: a software environment for integrated models of biomolecular interaction networks. Genome Res. 2003;13(11):2498–2504. doi:10.1101/gr.1239303
27. Chin CH, Chen SH, Wu HH, Ho CW, Ko MT, Lin CY. cytoHubba: identifying hub objects and sub-networks from complex interactome. BMC Syst Biol. 2014;8(Suppl 4):S11. doi:10.1186/1752-0509-8-S4-S11
28. Donaldson MR, Weber A. Dual immunostaining with SOX10 and AE1/AE3 to confirm perineural invasion on mohs sections. J Drugs Dermatol. 2019;18:262–264.
29. Langfelder P, Zhang B, Horvath S. Defining clusters from a hierarchical cluster tree: the dynamic tree cut package for R. Bioinformatics. 2008;24:719–720. doi:10.1093/bioinformatics/btm563
30. Giulietti M, Occhipinti G, Righetti A, et al. Emerging biomarkers in bladder cancer identified by network analysis of transcriptomic data. Front Oncol. 2018;8:450. doi:10.3389/fonc.2018.00450
31. Deng SP, Zhu L, Huang DS. Mining the bladder cancer-associated genes by an integrated strategy for the construction and analysis of differential co-expression networks. BMC Genomics. 2015;16(Suppl 3):S4. doi:10.1186/1471-2164-16-S3-S4
32. Cavel O, Shomron O, Shabtay A, et al. Endoneurial macrophages induce perineural invasion of pancreatic cancer cells by secretion of GDNF and activation of RET tyrosine kinase receptor. Cancer Res. 2012;72:5733–5743. doi:10.1158/0008-5472.CAN-12-0764
33. Ban K, Feng S, Shao L, Ittmann M. RET signaling in prostate cancer. Clin Cancer Res. 2017;23:4885–4896. doi:10.1158/1078-0432.CCR-17-0528
34. Amit M, Na’ara S, Gil Z. Mechanisms of cancer dissemination along nerves. Nat Rev Cancer. 2016;16:399–408. doi:10.1038/nrc.2016.38
35. Fielder GC, Yang TW, Razdan M, et al. The GDNF family: a role in cancer. Neoplasia. 2018;20:99–117. doi:10.1016/j.neo.2017.10.010
36. Song Z, Yang F, Du H, et al. Role of artemin in non-small cell lung cancer. Thorac Cancer. 2018;9:555–562. doi:10.1111/1759-7714.12615
37. Yousef EM, Furrer D, Laperriere DL, et al. MCM2: an alternative to Ki-67 for measuring breast cancer cell proliferation. Mod Pathol. 2017;30(5):682–697. doi:10.1038/modpathol.2016.231
38. Yamamoto H, Ngan CY, Monden M. Cancer cells survive with survivin. Cancer Sci. 2008;99(9):1709–1714. doi:10.1111/j.1349-7006.2008.00870.x
39. Li X, Ma Q, Xu Q, et al. SDF-1/CXCR4 signaling induces pancreatic cancer cell invasion and epithelial-mesenchymal transition in vitro through non-canonical activation of Hedgehog pathway. Cancer Lett. 2012;322:169–176. doi:10.1016/j.canlet.2012.02.035
40. Liu P, Liang Y, Jiang L, et al. CX3CL1/fractalkine enhances prostate cancer spinal metastasis by activating the Src/FAK pathway. Int J Oncol. 2018;53:1544–1556. doi:10.3892/ijo.2018.4487
41. Miknyoczki SJ, Wan W, Chang H, et al. The neurotrophin-trk receptor axes are critical for the growth and progression of human prostatic carcinoma and pancreatic ductal adenocarcinoma xenografts in nude mice. Clin Cancer Res. 2002;8:1924–1931.
42. Adriaenssens E, Vanhecke E, Saule P, et al. Nerve growth factor is a potential therapeutic target in breast cancer. Cancer Res. 2008;68:346–351. doi:10.1158/0008-5472.CAN-07-1183
43. Magnon C, Hall SJ, Lin J, et al. Autonomic nerve development contributes to prostate cancer progression. Science. 2013;341:1236361. doi:10.1126/science.1236361
44. Zhao C-M, Hayakawa Y, Kodama Y, et al. Denervation suppresses gastric tumorigenesis. Sci Transl Med. 2014;6:250ra115. doi:10.1126/scitranslmed.3009569
 © 2019 The Author(s). This work is published and licensed by Dove Medical Press Limited. The full terms of this license are available at https://www.dovepress.com/terms.php and incorporate the Creative Commons Attribution - Non Commercial (unported, v3.0) License.
By accessing the work you hereby accept the Terms. Non-commercial uses of the work are permitted without any further permission from Dove Medical Press Limited, provided the work is properly attributed. For permission for commercial use of this work, please see paragraphs 4.2 and 5 of our Terms.
© 2019 The Author(s). This work is published and licensed by Dove Medical Press Limited. The full terms of this license are available at https://www.dovepress.com/terms.php and incorporate the Creative Commons Attribution - Non Commercial (unported, v3.0) License.
By accessing the work you hereby accept the Terms. Non-commercial uses of the work are permitted without any further permission from Dove Medical Press Limited, provided the work is properly attributed. For permission for commercial use of this work, please see paragraphs 4.2 and 5 of our Terms.