")
Back to Journals » Diabetes, Metabolic Syndrome and Obesity » Volume 13
Visceral Adiposity Index and Chronic Kidney Disease in a Non-Diabetic Population: A Cross-Sectional Study
Authors Xiao H, Xiong C, Shao X, Gao P, Chen H, Ning J , Chen Y, Zou Z, Hong G, Li X, You X, Sheng J, Wu F, Wang X, Zou H
Received 28 September 2019
Accepted for publication 15 January 2020
Published 4 February 2020 Volume 2020:13 Pages 257—265
DOI https://doi.org/10.2147/DMSO.S231656
Checked for plagiarism Yes
Review by Single anonymous peer review
Peer reviewer comments 2
Editor who approved publication: Prof. Dr. Antonio Brunetti
Hua Xiao,* Chongxiang Xiong,* Xiaofei Shao,* Peichun Gao, Haishan Chen, Jing Ning, Yunying Chen, Ziliang Zou, Guobao Hong, Xiaolin Li, Xu You, Jieli Sheng, Fan Wu, Xin Wang, Hequn Zou
Department of Nephrology, The Third Affiliated Hospital, Southern Medical University, Guangzhou 510630, People’s Republic of China
*These authors contributed equally to this work
Correspondence: Hequn Zou
Department of Nephrology, The Third Affiliated Hospital, Southern Medical University, 183, Zhongshan West Avenue, Tianhe District, Guangzhou 510630, People’s Republic of China
Tel +86 20 6278 4391
Email [email protected]
Purpose: To investigate the correlation between visceral obesity and pathogenesis of chronic kidney disease (CKD) among non-diabetic individuals, and to evaluate the potential of visceral adiposity index (VAI) as a predictor of CKD.
Patients and Methods: From December 2017 to March 2018, 1877 non-diabetic participants (male n=699, female n=1208) in southern China were recruited for a cross-sectional survey. Males and females were divided into four groups according to gender-specific quartiles of VAI scores. A logistic regression model was established to analyze the correlation between visceral adiposity index and CKD.
Results: Visceral adiposity index was positively correlated with CKD and was negatively associated with estimated glomerular filtration rate (eGFR). Using group one as the control, odds ratios (ORs) were calculated to determine the risk of developing CKD as VAI increased (male: group four 2.73 [P< 0.005]; female: Group three 1.76 [P< 0.05], Group four 2.88 [P< 0.005]). When related factors such as history of hypertension, smoking, alcohol use, and physical inactivity were normalized in the logistic model before calculation, ORs became 2.73 (male: P< 0.05), and 2.18 (female: P< 0.05), respectively. The results differed after normalizing further for systolic blood pressure (SBP), diastolic blood pressure (DBP), hypersensitive c-reactive protein (hsCRP), interleukin-6 (IL-6), homocysteine (Hcy), superoxide dismutase (SOD), and retinol-binding protein (RBP). There were no significant differences in ORs among the female groups.
Conclusion: Visceral adiposity index was significantly associated with CKD in non-diabetic individuals. It may be a good predictor of the pathogenesis of CKD and was dependent on hsCRP, IL-6, Hcy, SOD, RBP, and blood pressure levels in females and males with VAI scores of 1.41 and higher. Visceral adiposity index may be used to predict CKD in males with VAI less than 0.983.
Keywords: visceral adiposity index, chronic kidney disease, non-diabetic population
Introduction
Chronic kidney disease (CKD) is a worldwide public health problem,1–5 and the incidence and prevalence of end-stage renal disease (ESRD) have increased in China. A recent study showed that the prevalence of CKD in China was 16.4%.6 This increased prevalence has led in increased risk of all-cause mortality and cardiovascular diseases. Furthermore, obesity is also a common risk factor for cardiovascular diseases and metabolic syndrome.6 Some studies have reported that obesity and renal function were associated according to anthropometric indices to evaluate obesity.7–9 Body mass index (BMI) is a commonly used index for clinical diagnosis of obesity, but recent studies have found that BMI in patients with CKD does not accurately reflect fat distribution. Visceral adipose tissue has been shown to be significantly associated with decreased renal function and was associated with increased risk of CKD.7 Visceral adiposity index (VAI) is a surrogate of visceral adipose tissue accumulation and dysfunction10,11 and is comprised of the common anthropometric measures BMI and waist circumference (WC), and triglycerides (TG) and high-density lipoprotein cholesterol (HDL-C). Previous studies have shown that increased VAI positively correlated with renal function decline in the population aged 40 years and above in southern China.12 However, little attention has been paid to the effects of elevated VAI on renal function in adults in non-diabetic populations. The aim of the study was to investigate the correlation between VAI and CKD in non-diabetic population through an epidemiological survey of residents in southern China, and observe the differences among males and females.
Subjects and Methods
Participants
From December 2017 to March 2018, a total of 2303 individuals who had resided in six communities of Wanzhai Town, Zhuhai city, in southern China were initially screened. For the cross-sectional analysis, participants with fasting plasma glucose (FPG) less than 6.1 mmol/L were initially screened. Those with missing laboratory data, and those with a history of diabetes were excluded. A total of 1877 participants were included in the final analysis (Figure 1). The study was approved by the Ethics Committee of the Third Affiliated Hospital of Southern Medical University, Guangzhou. All participants provided written informed consent. The study was performed in accordance with the principles stated in the Declaration of Helsinki.
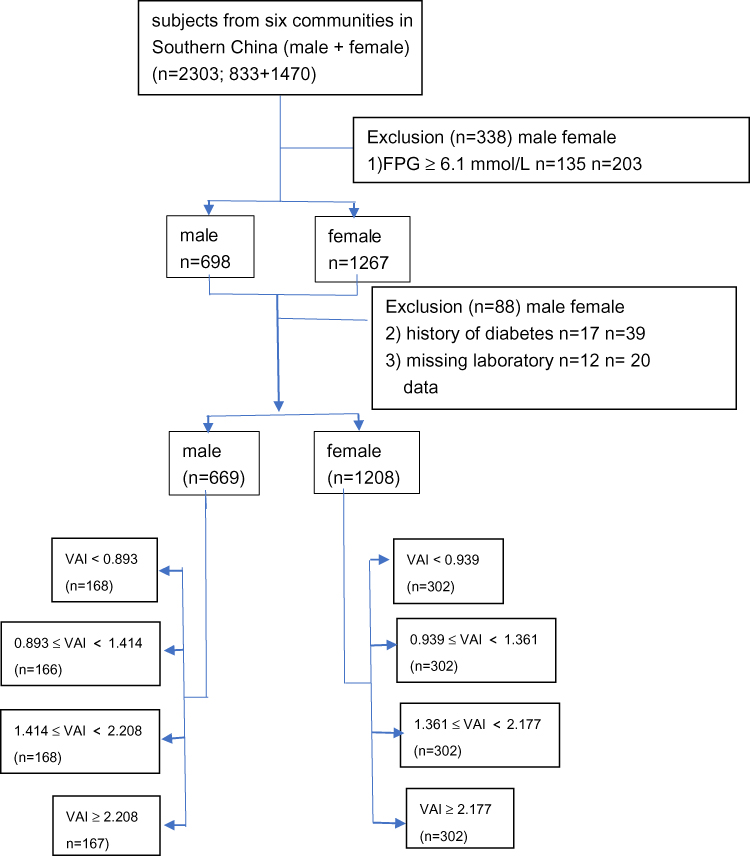 |
Figure 1 Study participants were grouped according to VAI. |
Clinical and Laboratory Indicators
Body Mass Index and Socio-Demographic Characteristics
The participants were interviewed, and responses were recorded by medical professionals. Data collected included gender, age, medical history, smoking history, alcohol use history, and physical inactivity. Residents who completed the initial interview then underwent physical examination and blood collection. Height, body mass, WC, hip circumference, and blood pressure were measured on the day of physical examination. Body mass index was calculated as follows: body mass (kg)/height (m) 2, WHpR (waist-to-hip ratio) was defined as follows: WC (cm)/hip circumference (cm), waist-height-ratio was defined as WC (cm)/height (cm). Blood pressure was measured twice by a trained nurse using a mercury desk-top sphygmomanometer (Model XJ300/40-1, Shanghai, China), after the participants had been seated for at least 5 min. The first and fourth Korotkoff sounds represented SBP and DBP. The average value of these two points was recorded. All participants were divided into two groups based on gender, and each group was divided into four groups based on VAI quartile.
Laboratory Examination
After 12 hrs of fasting, blood samples were collected from the anterior cubital vein between 8 a.m. and 10 a.m., and morning urine was collected. All blood and urine samples were analyzed in the laboratory of the Third Affiliated Hospital of Southern Medical University and their quality was strictly controlled. Urine albumin (Audit Diagnostics, Cork, Ireland; immunoturbidimetric tests) and urine creatinine (Audit Diagnostics, Cork, Ireland; Jaffe’s kinetic method) were measured, and the ratio of albumin to creatinine (ACR) was calculated. Fasting plasma glucose (Hitachi 7170, Hitachi, Tokyo, Japan; hexokinase enzyme reference method), serum creatinine (SCR) (Hitachi 7170, Hitachi, Tokyo, Japan; enzymatic method), and serum HDL-C were determined enzymatically using commercially available reagents (Shanghai Gensource Co., Ltd, Shanghai, China). Serum low-density lipoprotein cholesterol (LDL-C) was measured using the Friedewald formula. Serum total cholesterol (TC) and serum TG levels were determined enzymatically using commercially available reagents (Roche Diagnostics, Mannheim, Germany). Serum uric acid (UA) (colorimetric method; Roche Diagnostics, Mannheim, Germany), serum interleukin 6 (IL-6) (IL-6 ELISA kit, Shanghai yinggong biology co. LTD), plasma homocysteine (Hcy) (Homocysteine automatic analysis detector), serum superoxide dismutase (SOD) (Shanghai Xinyu Biotechnology co., LTD, SOD ELISA kit), serum retinol-binding protein (RBP) (Ningbo ruiyuan biotechnology co. LTD, Turbidimetric immunoassay method; Reebio reagent), serum hypersensitive c-reactive Protein (hsCRP) (enzymatic Turbidimetric immunoassay method; Orion Diagnostica Oy, Espoo, Finland) were also measured.
Definition of CKD
The diagnostic criteria for CKD were estimated glomerular filtration rate (eGFR) <60 mL/(min x 1.73 m2) or ACR≥30 mg/g.13 Estimated GFR was calculated according to Chronic Kidney Disease Epidemiology Collaboration (CKDEPI) equation in the American KDIGO guide.14 We defined eGFR as:
eGFR(female)=144X(SCR/0.7)−0.329 X0.993Age (if Serum creatine≤0.7 mg/dL or 62 μmol/L)
eGFR(female)=144X(SCR/0.7)−1.209 X0.993Age (if Serum creatine>0.7 mg/dL or 62 μmol/L)
eGFR(male)=141X(SCR/0.9)−0.411 X0.993Age (if Serum creatine≤0.9 mg/dL or 80 μmol/L)
eGFR(male)=141X(SCR/0.9)−1.209 X0.993Age (if Serum creatine>0.9 mg/dL or 80 μmol/L)
Definition of Visceral Adiposity Index
Visceral adiposity index was defined as follows according to Amato et al:11
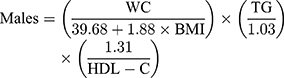
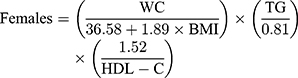
Triglycerides and HDL-C were expressed in mmol/L. Participants were divided into two groups based on gender, and each group was divided into four groups based on VAI quartile.
Definition of Hypertension and Diabetes
Hypertension was defined as SBP ≥ 140 mmHg or diastolic BP ≥ 90 mmHg, currently receiving treatment for hypertension, or diagnosed with hypertension. Diabetes was defined as fasting glucose ≥ 7.0 mmol/L, receiving treatment for diabetes, or previously diagnosed with diabetes.
Health Behavior Factors
Alcohol consumption was evaluated based on the frequency of alcohol intake communicated on the health interview questionnaire. We divided the residents into four groups: (1) never drink; (2) less than twice per week; (3) more than 3 times per week; and (4) every day. For physical exercise, the participants were divided into the following two groups: (1) no physical activity; and (2) physically active (more than 30 mins per time). For smoking, the patients were divided into three groups: (1) non-smoking; (2) current smokers; (3) quit smoking prior to the survey.
Statistical Analyses
All statistical analyses were performed using Statistical Analysis System statistical software version 9.3 (SAS Institute, Cary, NC, USA). Normally distributed continuous variables were expressed as means ± standard deviations. Continuous variables that were not normally distributed were presented as the median and the interquartile range (IQR). Categorical variables were expressed as absolute values and relative values (%). Analysis of variance was used to compare continuous variables. Chi-squared test was used for comparisons among groups. A multiple logistic regression model was generated to determine the association between CKD and VAI, and the odds ratio (OR) and 95% CI were determined. Three multivariate logistic regression models were generated: model one, unadjusted; model two, adjusted for history of hypertension, smoking, alcohol use, and physical inactivity; model three, adjusted for history of hypertension, smoking, alcohol use, and physical inactivity, SBP, DBP, hsCRP, IL-6, Hcy, SOD, and RBP. A two-sided test with a significance level of α = 0.05 (P < 0.05) was used.
Results
Prevalence of CKD in Males and Females
A total of 1877 participants were included in this study. The average age was 54.28 ± 13.30 years old, and 699 (35.6%) were males and 1208 (64.4%) were females. The quartiles for VAI in males were as follows: Q1, <0.893; Q2, 0.893–1.414; Q 3, 1.414–2.208; Q4, >2.208. The prevalence of CKD in each group was 9.7%, 14.0%, 16.1%, and 22.6%, respectively. The quartiles for VAI in females were as follows: Q1, <0.939; Q2, 0.939–1.361; Q3, 1.361–2.177; Q4, >2.177. The prevalence of CKD in each group was 10.3%, 9.9%, 16.8%, and 24.8%, respectively. The difference in the prevalence of CKD between males and females was statistically significant (P<0.05).
Relationship Between VAI and Anthropometric and Laboratory Indicators
For every quartile increase in VAI among males, DBP, body weight, WC, hip circumference, BMI, waist-to-height ratio, waist-to-hip ratio, LDL-C, TC, TG, UA, blood glucose, hsCRP, smoking, and history of hypertension were increased (P<0.05). Levels of HDL-C levels were decreased, and age, SBP, height, SCR, eGFR, alcohol consumption, and physical inactivity did not differ between the groups (P>0.05). The highest VAI quartile was associated with higher prevalence of CKD (P<0.05).
Increasing VAI quartiles in females were associated with increased age, alcohol consumption, history of hypertension, SBP, DBP, body weight, WC, hip circumference, BMI, waist-to-height ratio, waist-to-hip ratio, LDL-C, TC, TG, hsCRP, SCR, UA, and blood glucose levels. Levels of HDL-C and eGFR decreased with increasing VAI quartiles (P<0.05). There were no significant differences in height, SCR, smoking, or physical inactivity among VAI quartiles (P>0.05). The highest VAI quartile was associated with the highest prevalence of CKD (P<0.05).
Gender Differences in the Relationship Between VAI and CKD
In the multivariate logistic regression model, CKD was the dependent variable, and VAI quartile was the independent variable (Tables 1 and 2). In the unadjusted model generated with data from males, compared with the lowest quartile group 1, the highest VAI quartile OR was 2.73 (P=0.002). After adjusting for history of hypertension, alcohol use, smoking, and physical inactivity, the OR (2.73) _in the highest quartile was higher than that in the lowest quartile (P=0.004). After adjusting for SBP, DBP, hsCRP, IL-6, Hcy, SOD, and RBP, the prevalence of CKD in group two model three increased (OR 2.46, P=0.027), and VAI was independently related to CKD in males.
 |
Table 1 Association Between VAI and CKD in the Male Subjects |
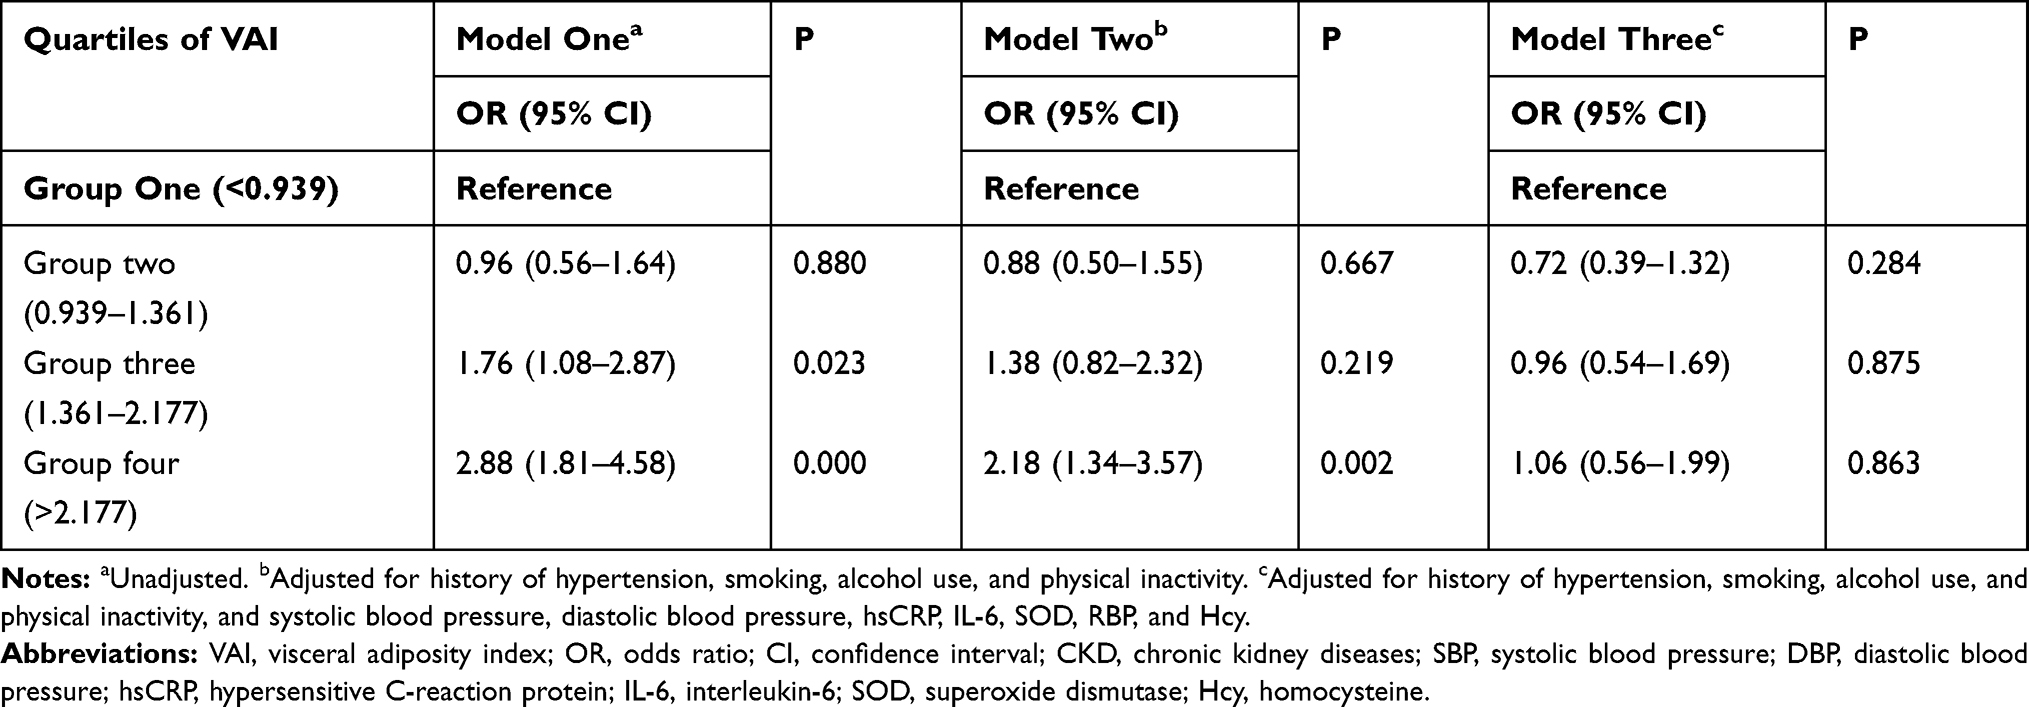 |
Table 2 Association Between VAI and CKD in Female Subjects |
In the female unadjusted model, the prevalence of CKD in groups 3 and 4 was significantly higher than that in Q1 (OR 1.76, P=0.023; OR 2.88, P<0.001). After adjusting for history of hypertension, alcohol use, smoking, and physical inactivity, the OR of the highest quartile was significantly different (p=0.002) than that of lowest quartile. After adjusting for SBP, DBP, IL −6, Hcy, SOD, and RBP, no significant differences were observed in Q2, Q3, or Q4 compared with the lowest VAI quartile.
Discussion
Visceral obesity is closely associated with impaired metabolism and incidence of CKD. Computed tomography (CT) and magnetic resonance imaging (MRI)7,15,16 provide accurate measurements of visceral obesity, but these imaging tests are expensive and may expose patients to radiation. Therefore, these techniques are rarely available in daily practice. Several recent studies suggested that VAI may be an alternative marker of visceral obesity.12,17,18 A 4-year prospective study showed that VAI level was an independent risk factor for nonalcoholic fatty liver disease (NAFLD), and there was a dose-dependent relationship between VAI level and risk of NAFLD.19 Visceral adiposity index has been proposed as a marker of fatty tissue dysfunction and has been associated with several metabolic diseases, including type 2 diabetes, hypertension, prehypertension, hyper uric acid, cardiovascular disease, and dementia.18,20–24 Recent epidemiological studies have shown that obesity and CKD have increased in parallel worldwide.5,6,25–28 However, the mechanisms by which obesity contributes to CKD have not been characterized. Studies have shown that a diet-containing sugar is associated with increased risk of CKD, and balanced and vegetarian diets have been associated with reduced risk of CKD.29,30 Chronic inflammation is a pathological consequence of obesity.28 Adipose tissue is an endocrine organ and can produce adipocytokines. In obesity, excessive accumulation of fat leads to excessive production of pro-inflammatory cytokines by fat cells, such as tumor necrosis factor-alpha (TNF-α) and interleukin (IL)-6, and reduced production of anti-inflammatory adipokines such as adiponectin. Increased visceral adipose tissue volume results in increased free fatty acids increased secretion of IL-6. This signaling cascade results in increased production of macrophage chemotactic factors, which leads to macrophage infiltration and excessive production of TNF-α. Increased macrophage infiltration and TNF-α production can lead to chronic inflammation, and subsequent kidney damage.28,31,32 Adipocytes play important roles in energy metabolism, insulin sensitivity, and vascular disease. Recently, a novel adipokine, C1q tumor necrosis factor-related protein 1 (CTRP1), was shown to play roles in a variety of vascular and metabolic functions, and was shown to contribute to obesity-related vascular disease. In addition, CTRP1 levels may be associated with CKD progression.33 However, few studies have evaluated the ability of VAI to predict CKD in non-diabetic individuals. Our study showed that VAI could be used as a potential index to predict CKD in individuals who do not have diabetes.
Our results showed that that eGFR was negatively correlated with VAI (Tables 3 and 4).
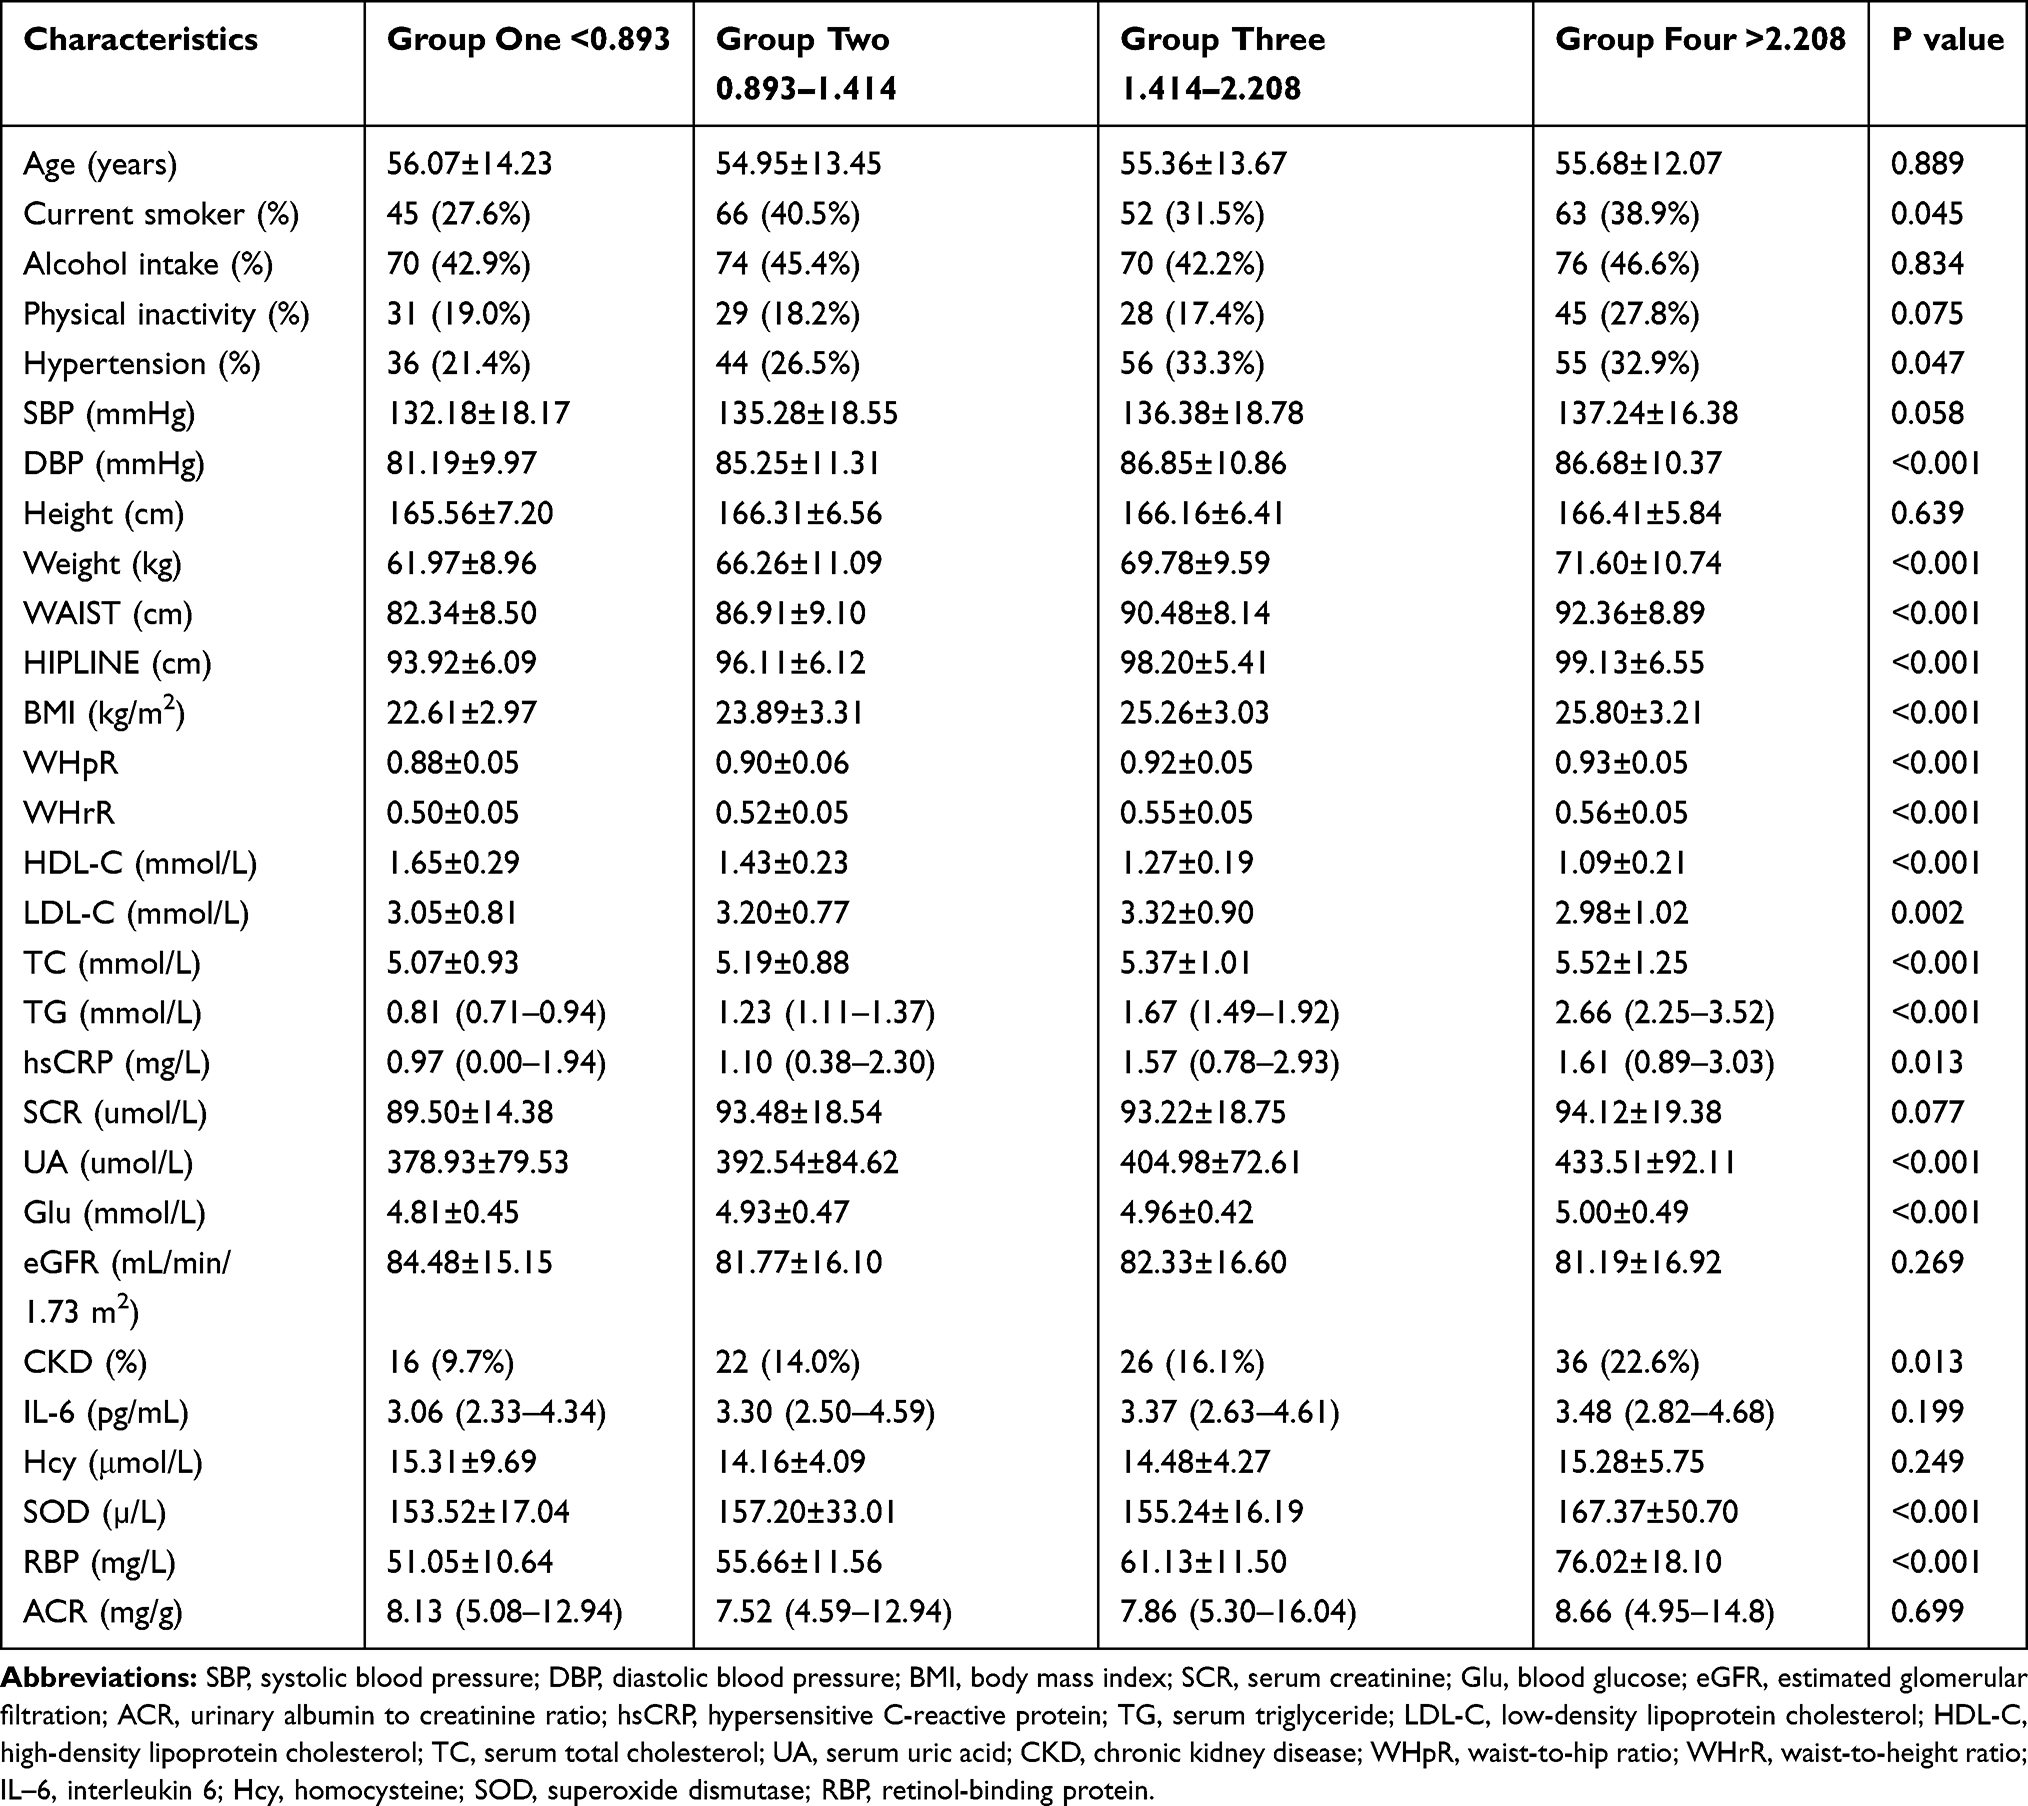 |
Table 3 Baseline Characteristics of the Male Subjects According to VAI Quartiles |
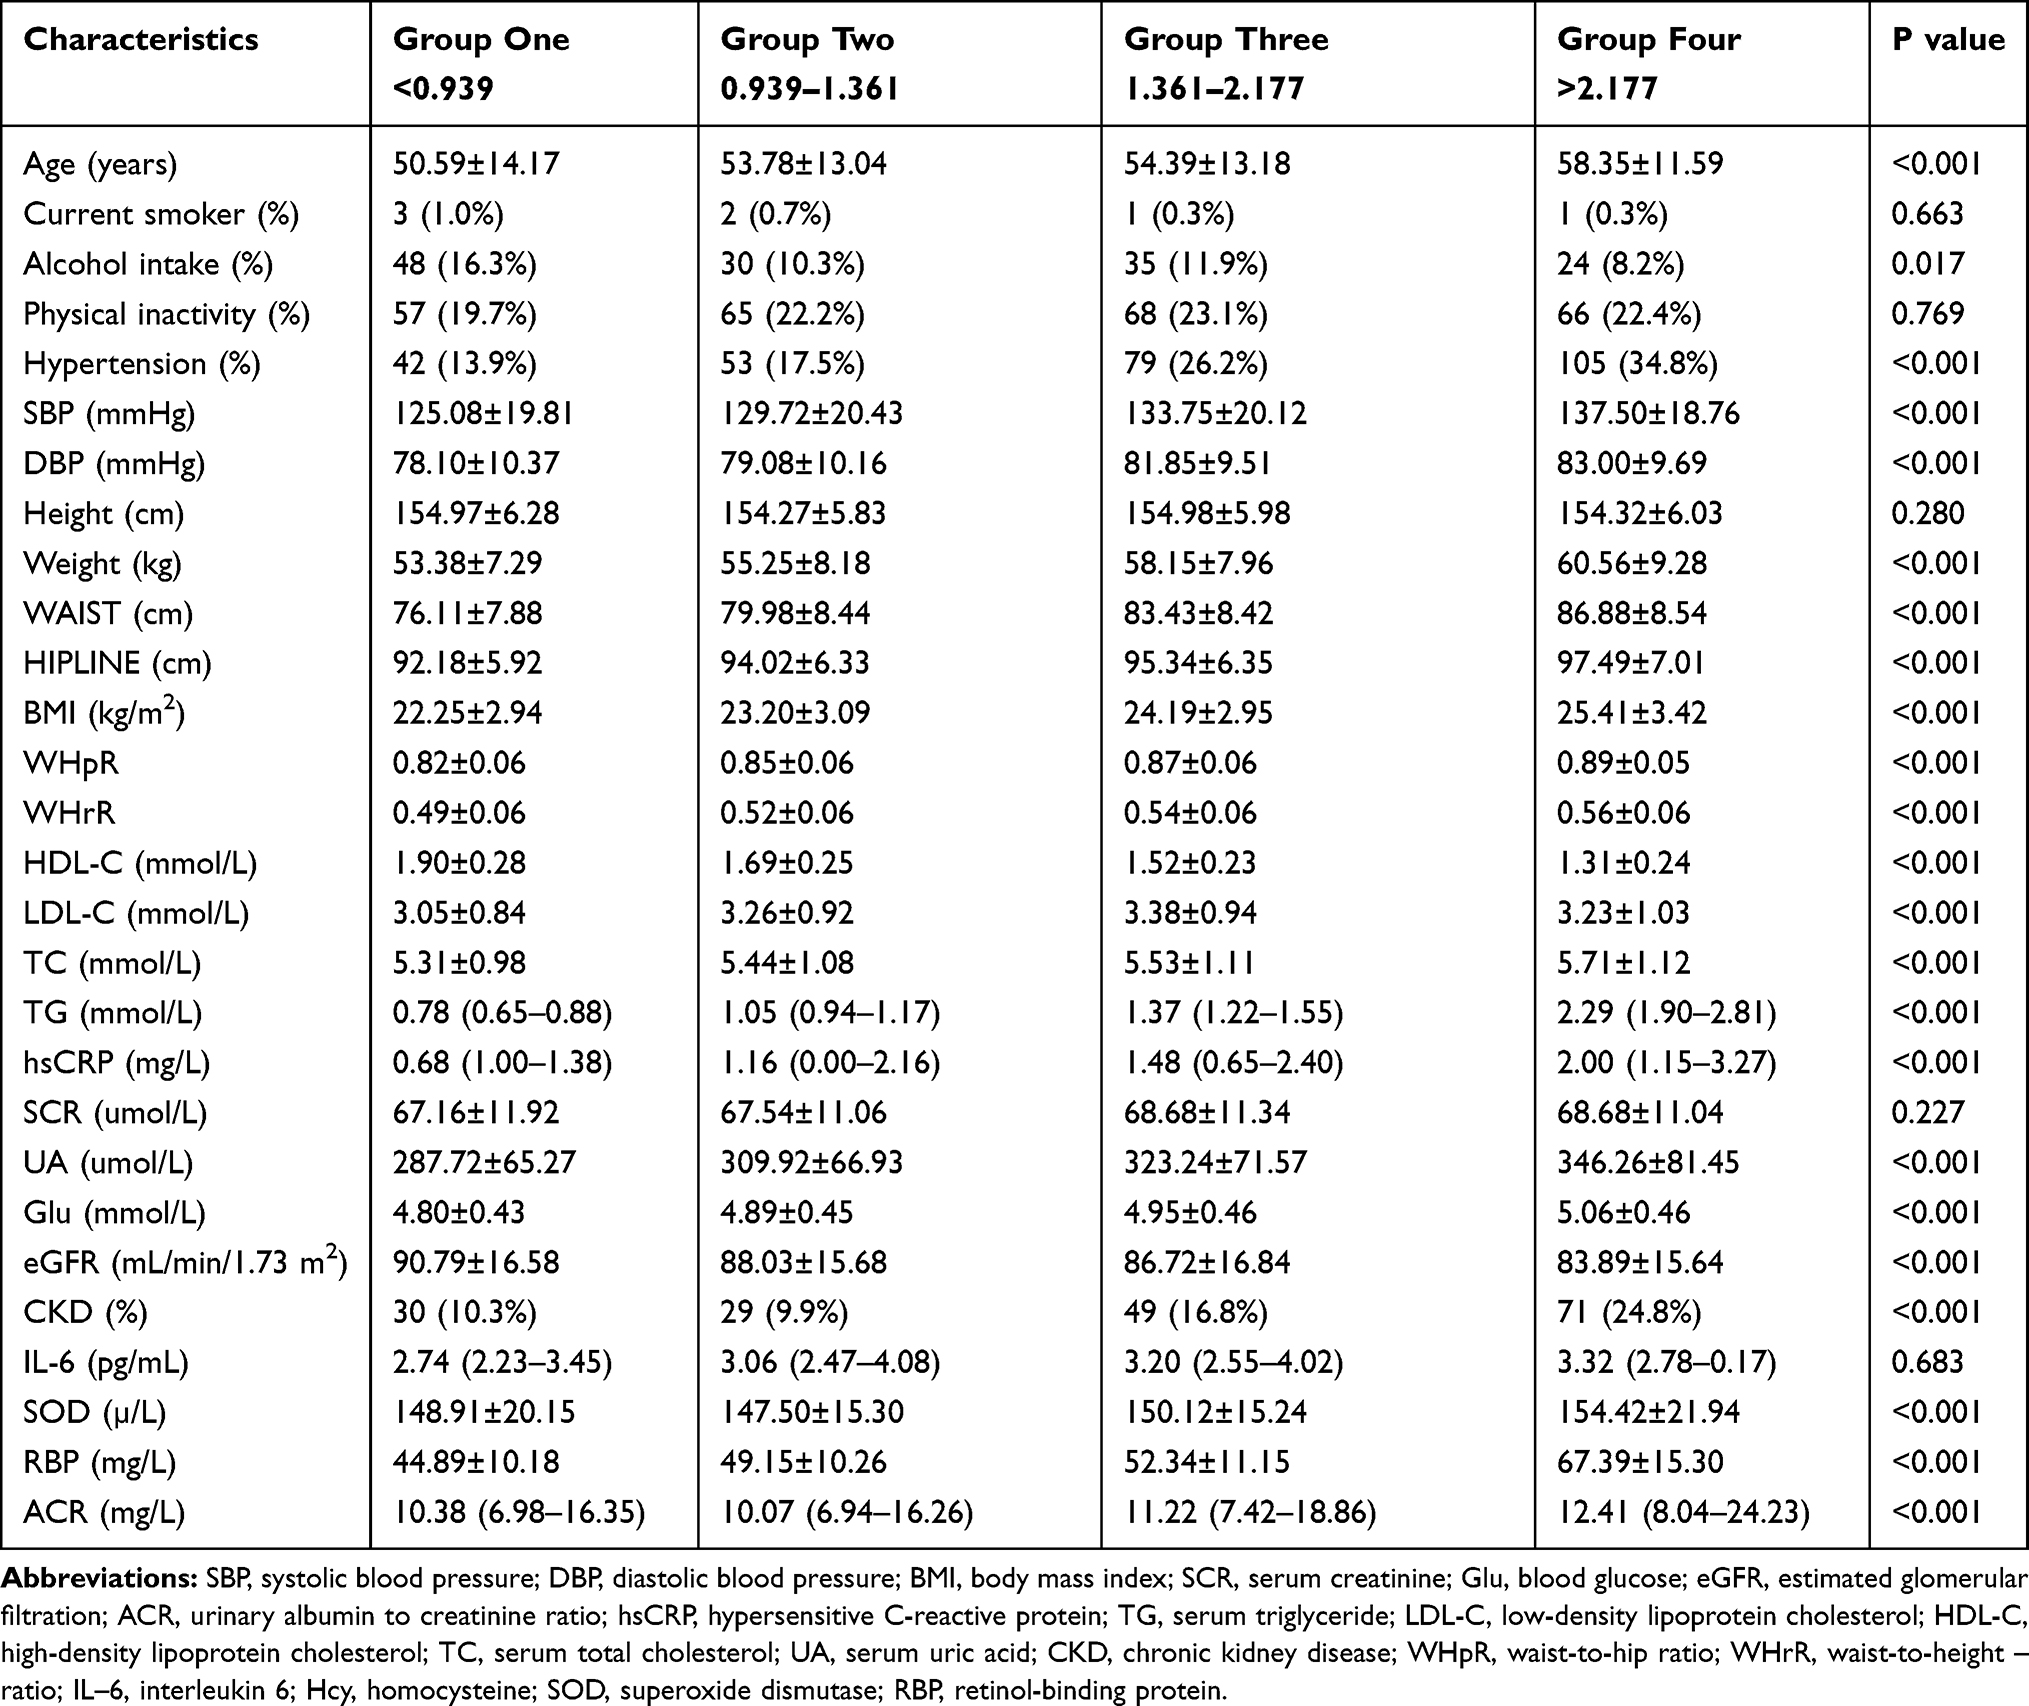 |
Table 4 Baseline Characteristics of the Female Subjects According to VAI Quartiles |
When VAI 2.208 and above, logistic regression analysis showed that the prevalence of CKD among male residents correlated independently with VAI (p<0.05) in model one and model two. The correlation between CKD and VAI was not observed following normalization based on SBP, DBP, hsCRP, IL-6, Hcy, SOD, and RBP in group four. These results suggested that VAI was a predictive index for occurrence of CKD, and was highly dependent on SBP, DBP, hsCRP, IL-6, Hcy, SOD, and RBP. Furthermore, the cutoff value for VAI maybe 2.208 for men. However, in group two (1.414>VAI≥0.893) model three, the OR was 2.46 (P=0.027) after normalization for SBP, DBP, hsCRP, IL-6, Hcy, SOD, and RBP. In model three the P-value was less than 0.05, correlated with VAI independently, the group four may be a special value which need further study. The prevalence of CKD among male residents in group 4 (VAI≥2.177) using models one and two was significantly associated with VAI (P<0.05). This association was not significant (P>0.05) after normalization using SBP, DBP, hsCRP, IL-6, Hcy, SOD, and RBP (model three). These results suggested that VAI may be a good predictor of CKD, and is highly dependent on SBP, DBP, hsCRP, IL-6, Hcy, SOD, and RBP. Furthermore, the VAI cutoff value should be 2.177 for women. From an epidemiological perspective, this study provided evidence that further study of the relationship between VAI and CKD in males and females should be performed. Additional study would enrich the data regarding VAI as a predictor of CKD in the Asian population, and may provide guidance for prevention and treatment of chronic diseases and government decision-making. Patients should receive lifestyle education, including meal plans, exercise plans, and other methods34,35 weight loss, to intervene kidney disease.
This study suffered from several limitations. First, this was a cross-sectional investigation, and the sample size was small. The sample was not randomly selected, and selection bias may have been an issue. For example, only 37% of the individuals in this study were men, and the average age was high (average age of men: 55.52 ± 13.36 years of age; female: 54.28 ± 13.30 years of age). Therefore, it is necessary to conduct long-term prospective studies to further characterize the ability of VAI to predict chronic kidney disease (CKD). Second, CKD indicators (eGFR and ACR) were measured only once in this epidemiological survey and were not repeated. Third, the medical personal filled out the questionnaires. This may have led to inaccurate reporting of smoking, alcohol, and physical activity.
Conclusion
In conclusion, our study found a correlation between VAI and CKD in Chinese individuals without diabetes. This association was particularly strong among males and was independent of history of hypertension, smoking, alcohol consumption, physical inactivity, systolic, and DBP. Visceral adiposity index can be easily determined in primary medical care settings, and individuals with high VAI should receive additional screening and preventive interventions for chronic kidney disease.
Disclosure
The authors report no conflicts of interest in this work.
References
1. Lin B, Shao L, Luo Q, et al. Prevalence of chronic kidney disease and its association with metabolic diseases: a cross-sectional survey in Zhejiang province, Eastern China. BMC Nephrol. 2014;15:36. doi:10.1186/1471-2369-15-36
2. Zhang L, Wang F, Wang L, et al. Prevalence of chronic kidney disease in China: a cross-sectional survey. Lancet. 2012;379(9818):815–822. doi:10.1016/S0140-6736(12)60033-6
3. Xu H, Kuja-Halkola R, Chen X, Magnusson PKE, Svensson P, Carrero JJ. Higher body mass index is associated with incident diabetes and chronic kidney disease independent of genetic confounding. Kidney Int. 2019;95(5):1225–1233. doi:10.1016/j.kint.2018.12.019
4. Zelnick LR, Weiss NS, Kestenbaum BR, et al. Diabetes and CKD in the United States Population, 2009-2014. Clin J Am Soc Nephrol. 2017;12(12):1984–1990. doi:10.2215/CJN.03700417
5. Glassock RJ, Warnock DG, Delanaye P. The global burden of chronic kidney disease: estimates, variability and pitfalls. Nat Rev Nephrol. 2017;13(2):104–114. doi:10.1038/nrneph.2016.163
6. Duan J, Wang C, Liu D, et al. Prevalence and risk factors of chronic kidney disease and diabetic kidney disease in Chinese rural residents: a cross-sectional survey. Sci Rep. 2019;9(1):10408. doi:10.1038/s41598-019-46857-7
7. Madero M, Katz R, Murphy R, et al. Comparison between different measures of body fat with kidney function decline and incident CKD. Clin J Am Soc Nephrol. 2017;12(6):893–903. doi:10.2215/CJN.07010716
8. Biyik Z, Guney I. Lipid accumulation product and visceral adiposity index: two new indices to predict metabolic syndrome in chronic kidney disease. Eur Rev Med Pharmacol Sci. 2019;23(5):2167–2173. doi:10.26355/eurrev_201903_17262
9. Dong Y, Wang Z, Chen Z, et al. Comparison of visceral, body fat indices and anthropometric measures in relation to chronic kidney disease among Chinese adults from a large scale cross-sectional study. BMC Nephrol. 2018;19(1):40. doi:10.1186/s12882-018-0837-1
10. Mohammadreza B, Farzad H, Davoud K, Fereidoun Prof AF. Prognostic significance of the complex “Visceral Adiposity Index” vs. simple anthropometric measures: tehran lipid and glucose study. Cardiovasc Diabetol. 2012;11:20. doi:10.1186/1475-2840-11-20
11. Amato MC, Giordano C, Galia M, et al. Visceral Adiposity Index: a reliable indicator of visceral fat function associated with cardiometabolic risk. Diabetes Care. 2010;33(4):920–922. doi:10.2337/dc09-1825
12. Xu X, Zhao Y, Zhao Z, et al. Correlation of visceral adiposity index with chronic kidney disease in the People’s Republic of China: to rediscover the new clinical potential of an old indicator for visceral obesity. Ther Clin Risk Manag. 2016;12:489–494. doi:10.2147/TCRM.S96340
13. Eknoyan G, Levin NW. K/DOQI clinical practice guidelines for chronic kidney disease: evaluation, classification, and stratification. Am J Kidney Dis. 2002;39(2 Suppl 1):S1–266.
14. Kumar BV, Mohan T. Retrospective comparison of estimated GFR using 2006 MDRD, 2009 CKD-EPI and cockcroft-gault with 24 hour urine creatinine clearance. J Clin Diagn Res. 2017;11(5):Bc09–bc12.
15. Contreras-Rodriguez O, Cano M, Vilar-Lopez R, et al. Visceral adiposity and insular networks: associations with food craving. Int J Obes (Lond). 2019;43(3):503–511. doi:10.1038/s41366-018-0173-3
16. Graffy PM, Pickhardt PJ. Quantification of hepatic and visceral fat by CT and MR imaging: relevance to the obesity epidemic, metabolic syndrome and NAFLD. Br J Radiol. 2016;89(1062):20151024. doi:10.1259/bjr.20151024
17. Kang YM, Jung CH, Cho YK, et al. Visceral adiposity index predicts the conversion of metabolically healthy obesity to an unhealthy phenotype. PLoS One. 2017;12(6):e0179635. doi:10.1371/journal.pone.0179635
18. Zhang M, Zheng L, Li P, et al. 4-year trajectory of visceral adiposity index in the development of type 2 diabetes: a prospective cohort study. Ann Nutr Metab. 2016;69(2):142–149. doi:10.1159/000450657
19. Xu C, Ma Z, Wang Y, et al. Visceral adiposity index as a predictor of NAFLD: a prospective study with 4-year follow-up. Liver Int. 2018;38(12):2294–2300. doi:10.1111/liv.2018.38.issue-12
20. Fiorentino TV. Visceral adiposity index (VAI), a powerful predictor of incident hypertension in prehypertensives. Intern Emerg Med. 2018;13(4):471–473. doi:10.1007/s11739-018-1849-3
21. Yang Y, Feng Y, Ma X, et al. Visceral adiposity index and insulin secretion and action in first-degree relatives of subjects with type 2 diabetes. Diabetes Metab Res Rev. 2015;31(3):315–321. doi:10.1002/dmrr.v31.3
22. Gu D, Ding Y, Zhao Y, Miao S, Qu Q. Positively increased visceral adiposity index in hyperuricemia free of metabolic syndrome. Lipids Health Dis. 2018;17(1):101. doi:10.1186/s12944-018-0761-1
23. Singh-Manoux A, Dugravot A, Shipley M, et al. Obesity trajectories and risk of dementia: 28 years of follow-up in the Whitehall II Study. Alzheimers Dement. 2018;14(2):178–186. doi:10.1016/j.jalz.2017.06.2637
24. Amato MC, Giordano C, Pitrone M, Galluzzo A. Cut-off points of the visceral adiposity index (VAI) identifying a visceral adipose dysfunction associated with cardiometabolic risk in a caucasian sicilian population. Lipids Health Dis. 2011;10:183. doi:10.1186/1476-511X-10-183
25. Kovesdy CP, Furth S, Zoccali C. Obesity and kidney disease: hidden consequences of the epidemic. Saudi J Kidney Dis Transpl. 2017;28(2):241–252. doi:10.4103/1319-2442.202776
26. Engin A. The definition and prevalence of obesity and metabolic syndrome. Adv Exp Med Biol. 2017;960:1–17.
27. Zobel EH, Hansen TW, Rossing P, von Scholten BJ. Global changes in food supply and the obesity epidemic. Curr Obes Rep. 2016;5(4):449–455. doi:10.1007/s13679-016-0233-8
28. Wahba IM, Mak RH. Obesity and obesity-initiated metabolic syndrome: mechanistic links to chronic kidney disease. Clin J Am Soc Nephrol. 2007;2(3):550–562. doi:10.2215/CJN.04071206
29. Rebholz CM, Young BA, Katz R, et al. Patterns of beverages consumed and risk of incident kidney disease. Clin J Am Soc Nephrol. 2019;14(1):49–56. doi:10.2215/CJN.06380518
30. Kim H, Caulfield LE, Garcia-Larsen V, et al. Plant-based diets and incident CKD and kidney function. Clin J Am Soc Nephrol. 2019;14(5):682–691. doi:10.2215/CJN.12391018
31. Bagby SP. Obesity-initiated metabolic syndrome and the kidney: a recipe for chronic kidney disease? J Am Soc Nephrol. 2004;15(11):2775–2791. doi:10.1097/01.ASN.0000141965.28037.EE
32. Schelling JR, Sedor JR. The metabolic syndrome as a risk factor for chronic kidney disease: more than a fat chance? J Am Soc Nephrol. 2004;15(11):2773–2774. doi:10.1097/01.ASN.0000141964.68839.BB
33. Barbieri D, Goicoechea M, Sanchez-Nino MD, et al. Obesity and chronic kidney disease progression-the role of a new adipocytokine: C1q/tumour necrosis factor-related protein-1. Clin Kidney J. 2019;12(3):420–426. doi:10.1093/ckj/sfy095
34. Bellini MI, Paoletti F, Herbert PE. Obesity and bariatric intervention in patients with chronic renal disease. J Int Med Res. 2019;47(6):2326–2341. doi:10.1177/0300060519843755
35. Dombrowski SU, Knittle K, Avenell A, Araujo-Soares V, Sniehotta FF. Long term maintenance of weight loss with non-surgical interventions in obese adults: systematic review and meta-analyses of randomised controlled trials. BMJ. 2014;348:g2646. doi:10.1136/bmj.g2646
 © 2020 The Author(s). This work is published and licensed by Dove Medical Press Limited. The full terms of this license are available at https://www.dovepress.com/terms.php and incorporate the Creative Commons Attribution - Non Commercial (unported, v3.0) License.
By accessing the work you hereby accept the Terms. Non-commercial uses of the work are permitted without any further permission from Dove Medical Press Limited, provided the work is properly attributed. For permission for commercial use of this work, please see paragraphs 4.2 and 5 of our Terms.
© 2020 The Author(s). This work is published and licensed by Dove Medical Press Limited. The full terms of this license are available at https://www.dovepress.com/terms.php and incorporate the Creative Commons Attribution - Non Commercial (unported, v3.0) License.
By accessing the work you hereby accept the Terms. Non-commercial uses of the work are permitted without any further permission from Dove Medical Press Limited, provided the work is properly attributed. For permission for commercial use of this work, please see paragraphs 4.2 and 5 of our Terms.