")
Back to Journals » International Journal of General Medicine » Volume 14
Vector Flow Mapping Application in Local Cardiac Function in Hypertension Assessment
Authors Zuo X, Yuan M, Jia H, Zhang M, Zhang C, Zhi G
Received 16 April 2021
Accepted for publication 13 July 2021
Published 24 August 2021 Volume 2021:14 Pages 4793—4801
DOI https://doi.org/10.2147/IJGM.S315806
Checked for plagiarism Yes
Review by Single anonymous peer review
Peer reviewer comments 2
Editor who approved publication: Dr Scott Fraser
Xiaowen Zuo,1,2,* Manli Yuan,2,* Huaping Jia,2 Mingming Zhang,2 Can Zhang,2 Guang Zhi3
1Medical School of Chinese PLA, Beijing, People’s Republic of China; 2Department of Ultrasound Medicine, PLA Strategic Support Force Characteristic Medical Center, Beijing, People’s Republic of China; 3Department of Cardiology, The Sixth Medical Center of Chinese PLA General Hospital, Beijing, People’s Republic of China
*These authors contributed equally to this work
Correspondence: Guang Zhi
Department of Cardiology, The Sixth Medical Center of Chinese PLA General Hospital, No. 28 of Fuxing Road, Haidian District, Beijing, 100101, People’s Republic of China
Tel +86-13910994856
Email [email protected]
Objective: This study aims to investigate the clinical significance of vector flow mapping (VFM) by observing and quantifying energy loss (EL) during different phases and in different left ventricle (LV) segments.
Methods: 42 healthy physical examination subjects and 89 patients with hypertension (HTN) were enrolled in the present study. The patients with HTN were divided into two groups: the left ventricular hypertrophy group (LVH) (n = 51) and the non-left ventricular hypertrophy group (NLVH) (n = 38), while the healthy patients were control group. VFM analysis software DSA-RS1 was used to calculate EL during the rapid filling phase (P1), slow filling phase (P2), atrial contraction phase (P3), and rapid ejection phase (P4). The energy loss of basal segment (EL-B), middle segment (EL-M) and apical segment (EL-A) of left ventricle in different phases was calculated and compared among the three groups.
Results: In controls, segmental EL showed a gradual increase from the apex to the base during diastole; however, the regularity was not found in the HTN patients. During both P1 and P2 EL-B, EL-M and EL-A were significantly higher in the NLVH group and the LVH group compared with the control group (P < 0.05). EL in LVH group was the highest among the three groups (P < 0.05). During P3, EL-B, EL-M and EL-A were increased in the NLVH group and LVH group compared with the control group. However, EL-M and EL-A in LVH group were significantly lower than the NLVH group (P < 0.05). During P4, EL of all segments was significantly higher in the NLVH group and LVH group compared with the control group (P < 0.05).
Conclusion: VFM can visually quantify hydrodynamic LV changes in healthy subjects. The EL levels in the different LV segments during different phases were significantly higher in the patients with HTN compared with the healthy subjects.
Keywords: hypertension, ultrasound, vector flow mapping, energy loss
Background
Hypertension (HTN) is a major risk factor contributing to the global burden of disease. In 2013, the European Society of Hypertension/European Society of Cardiology suggested a HTN prevalence of 30–45% in the general European population.1 The Japanese guidelines for HTN management state that in people aged >30, the HTN prevalence is 60% in men and 45% in women.2 Hypertension is the most prevalent chronic disease and the leading cause of cardiovascular death.3 Left ventricular hypertrophy (LVH) contributes to the reduced coronary reserve and increased left ventricular filling pressure, known as the strong risk factor of cardiovascular events and heart failure (HF) and plays an important role in the development of left ventricular diastolic dysfunction (LVDD).4,5 At present, most studies were focused on the wall motion movement using tissue Doppler imaging or speckle-tracking imaging techniques.6,7 The vortex of the left ventricle is an essential factor of physiology and is closely related to ventricular structure. However, the understanding between pathophysiology and hydrodynamics is still limited.
Vector flow mapping (VFM) is a novel two-dimensional speckle-tracking technique that provides an advanced visual quantitative description of the cardiac flow field. The left ventricle diastolic energy loss (EL) can be obtained by this new technique, which is a novel hemodynamic index.8,9 The energy loss is accurate and convenient assessment to reveal the long-term impact of blood flow on ventricular wall motion under different pathophysiological circumstances.10,11 In the present study, the VFM technique was applied to quantitatively evaluate in patients with HTN and investigate its clinical significance.
Materials and Methods
Study Subjects
Patients with a HTN diagnosis confirmed in accordance with the 2017 United States guidelines for HTN management with ≥140/90 mmHg systolic blood pressure (SBP) and/or ≥90 mmHg diastolic blood pressure (DBP) who visited our hospital between January 2019 and October 2019 were enrolled in the present study.12 The patients were divided into two groups: the left ventricular hypertrophy (LVH) group (n = 51) and the non-left ventricular hypertrophy (NLVH) group (n = 38). This division was made according to the patients’ (1) left ventricular mass index (LVMI), with the left ventricular mass (LVM) calculated using the end-diastolic left ventricular internal diameter (LVEDD), end-diastolic left ventricular septal thickness (IVSTd), and the end-diastolic posterior left ventricular wall thickness (PWTd) values as (g) = 0.8×1.04 x [(LVEDD + IVSTd + PWTd3) − LVEDD3]; and (2) LVMI = LVM (g)/body surface area (m2).13
Male patients with an LVMI of ≥115 g/m2 and female patients with an LVMI of ≥95g/m2 were assigned to the LVH group. The normal LVMI reference range in the NVLH group was 50–102 g/m2 in male patients and 44–88 g/m2 in female patients.
42 healthy volunteers were selected from our outpatient clinic during the same period and assigned to the control group; there were no significant differences in average age and gender compared with the observation groups. The subjects in the control group had normal electrocardiogram (ECG) and echocardiography results, and patients with cardiopulmonary disease, severe hepatic and renal insufficiency, and other serious systemic diseases, along with patients with unclear images, were excluded from the study. The study protocol was reviewed and approved by the ethics committee of our hospital, and all subjects signed an informed consent form.
Exclusion criteria: (1) patients with cardiac arrhythmia, combined heart valve disease, pulmonary heart disease, congenital heart disease, cardiomyopathy, severe hepatic and renal insufficiency, secondary hypertension, or an ultrasound-determined ejection fraction of <50%; (2) patients with a definite diagnosis of coronary artery disease and myocardial infarction; (3) patients with pericardial effusion; and (4) patients with poorly defined ultrasound images.
Apparatus and Methods
Routine echocardiography: the Prosound F75 color Doppler ultrasound diagnostic instrument, produced by Aloka, with a UST-52102 phased-array probe and a frame rate of ≥20 fps was adopted for the examination. The subjects were placed in the left lateral position. The heart rate (HR), parasternal left ventricular long-axis view, left atrial anteroposterior diameter (LAD), LVEDD, IVSTd, left ventricular PWTd, and body mass index (BMI) were recorded and the LVMI calculated. The two-plane Simpson method was used for left ventricular ejection fraction measurement. In the pulsed wave tissue Doppler imaging mode, the standard apical four-chamber view was assumed, the orifice early diastolic peak flow velocity (E), late diastolic peak flow velocity (A) of the mitral valve, and the ventricular septal mitral valve annulus velocity (e’) were recorded, and the average value was calculated.
VFM: three complete cardiac cycles of standard apical real-time four-chamber heart color multispectral images were obtained with a blood flow direction–sound beam angle of <20° while the patient was holding his/her breath. The endocardial LV boundary was displayed, ensuring that the color blood flow filled the LV cavity at a frame rate of ≥20 while avoiding color blending. The data were stored in a Digital Imaging and Communications in Medicine format. The images were imported into an offline VFM workstation (DAS-RSI, Aloka, Japan) for offline data analysis. The endocardium was manually traced and the myocardial motion of the LV dynamically tracked. The sample line was placed on the LV base of the heart cavity (about 2cm of mitral annulus) to acquire the time-flow curve (T-F). The vertical coordinate was the flow rate (cm2/s), and the horizontal coordinate was the time (s). Based on the ECG and T-F curve results, the time phase was divided into the fast filling phase (P1), slow filling phase (P2), atrial contraction phase (P3), and fast ejection phase (P4). Furthermore, the LV was divided into the basal segment (B), middle segment (M), and apical segment (A). In each segment, EL was recorded separately [J/(s·m3)] during the different phases.
Statistical Analysis
The Statistical Package for the Social Sciences 19.0 was adopted for statistical data analysis. The measurement data that conformed with the normal distribution were expressed as mean ± standard deviation ( ±SD), and analysis of variance was used for the means comparison among the three groups. The Kruskal–Wallis rank-sum test was used if measurement data did not conform to the normal distribution. The χ2 test was adopted for analyzing countable data. A p-value of <0.05 was considered statistically significant.
Repeatability Test
Ten study subjects were randomly selected, and repeatable mean diastolic EL and mean systolic EL measurements were conducted. On day 1 and day 10, the inter-observer repeatability tests were measured by the same observer on the same study subject. The intra-observer repeatability test was performed by two physicians following the same method and measuring the above-listed parameters in each study subject separately. Repeatability was measured using the correlation coefficient.
Results
General Characteristics and Conventional Echocardiographic Parameters Among Different Groups Comparison (Tables 1 and 2)
- ) General information and serum index: The DBP, SBP, and BMI were higher in the NLVH group and LVH group than in the control group (P< 0.05). There were no statistically significant differences in age, gender distribution, heart rate, fasting blood glucose, total cholesterol, triglycerides, high-density lipoprotein and low-density lipoprotein (P>0.05).
- ) Two-dimensional echocardiography: IVSTd and PWTd in NLVH were higher than those in controls (P<0.05); IVSTd, PWTd, LAD, EDV, ESV and LVMI in LVH were higher than those in controls and NLVH (P<0.05).
- ) Pulse Doppler echocardiography: e’ in LVH was the lowest in three groups (P<0.05). e’ in NLVH was lower than that in controls (P<0.05). E/e’ in LVH and NLVH was significantly higher than that in controls (P<0.05), while there was no difference in LVH and NLVH (P>0.05). There was no significant difference in E, A, and E/A among the groups (P>0.05).
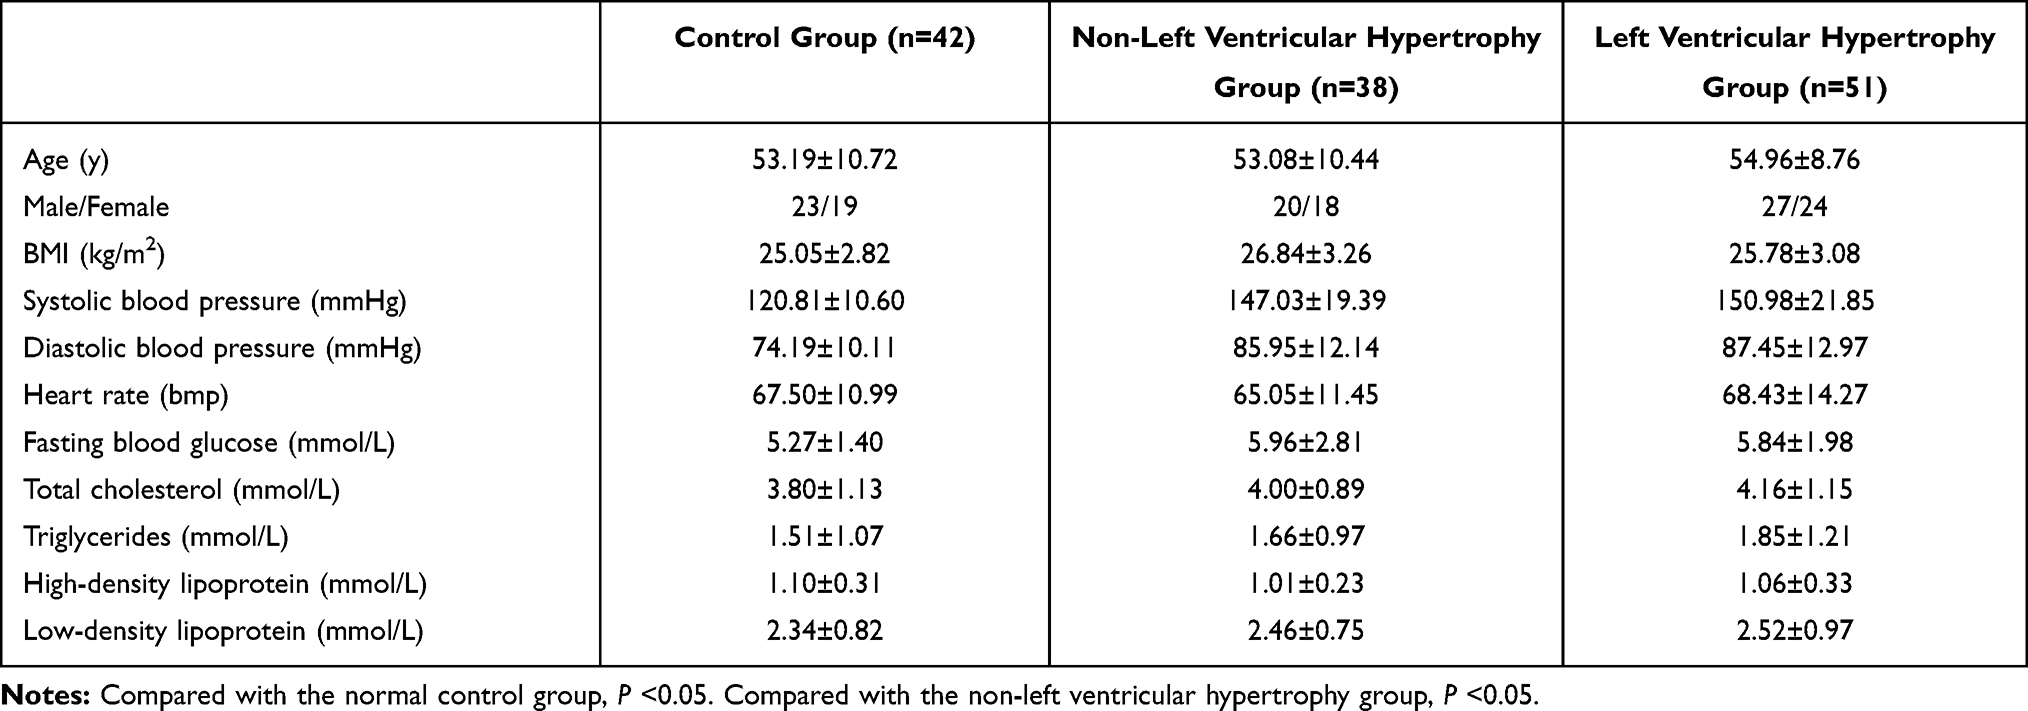 |
Table 1 The General Characteristics and Serum Index |
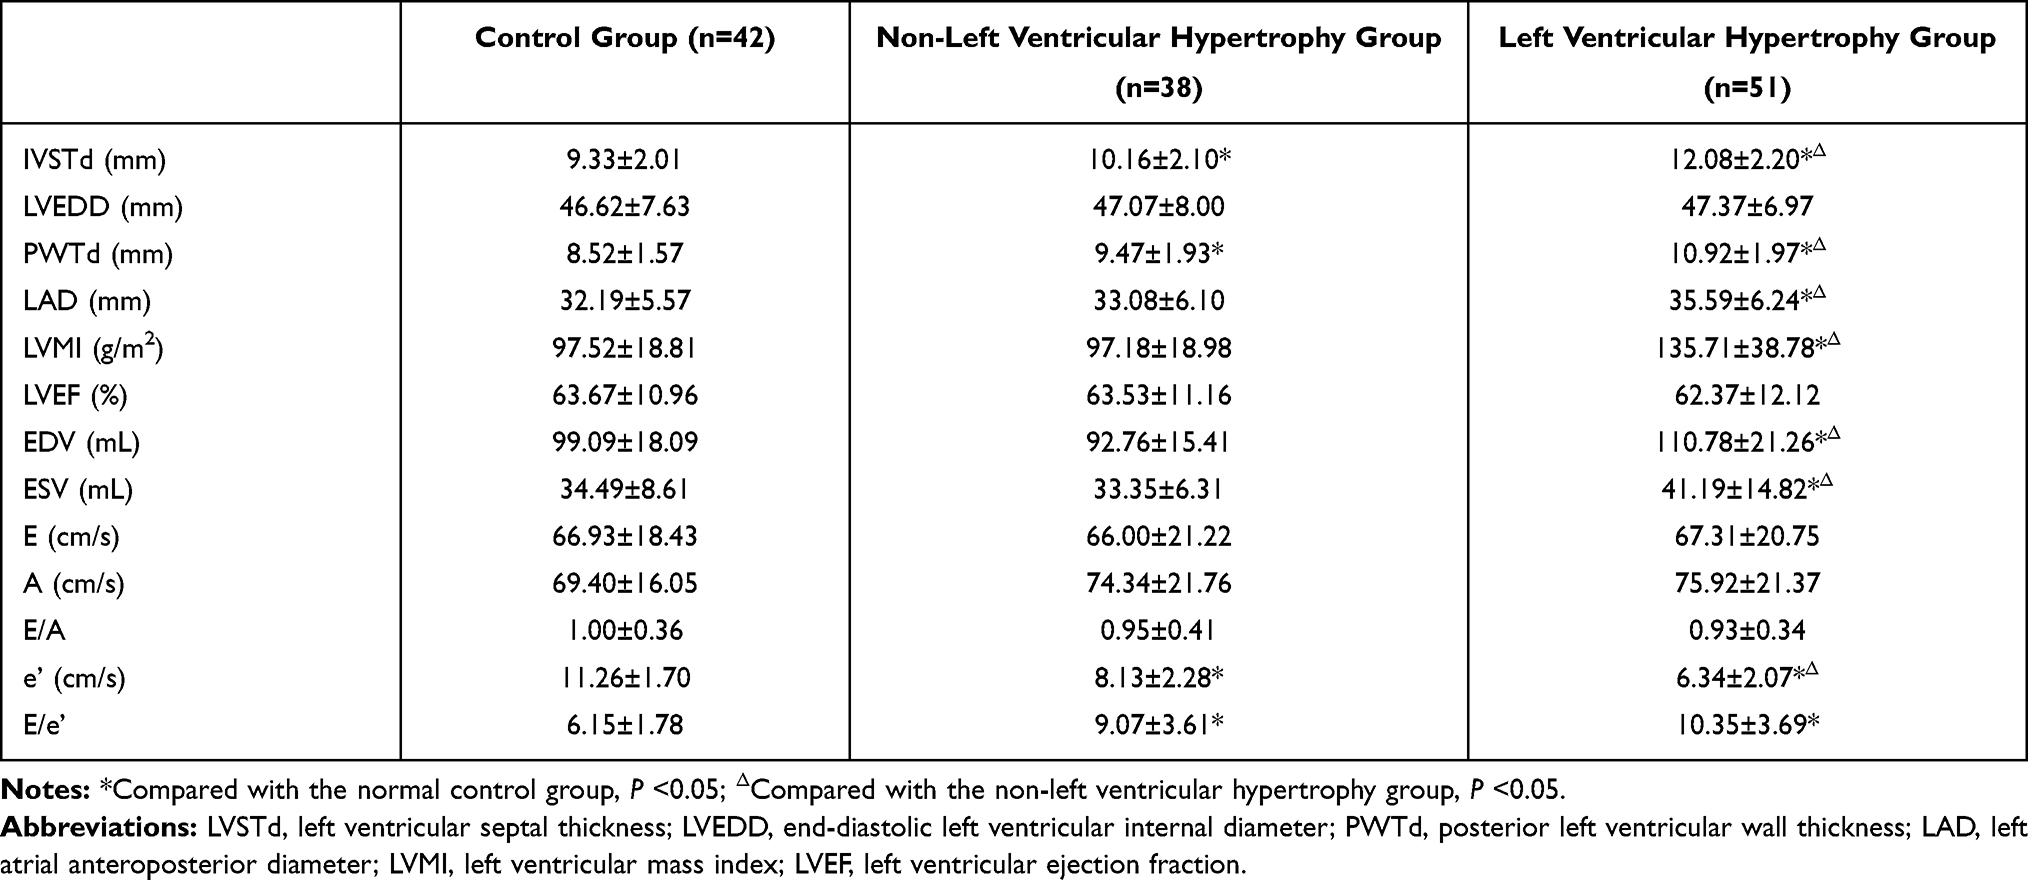 |
Table 2 The Ultrasonographic Parameters |
EL Changes During Different Phases Among Different Groups (Tables 3–6, Figure 1, Tables 4, Tables 5)
P1
- ) EL-B were significantly higher in the NLVH group and the LVH group compared with the control group (P<0.05). EL-B was higher in the LVH group than in the NLVH group; the difference was statistically significant (P<0.05).
- ) EL-M were significantly higher in the NLVH group and the LVH group compared with the control group (P<0.05). EL-M was higher in the LVH group than in the NLVH group; the difference was statistically significant (P<0.05).
- ) EL-A were significantly higher in the NLVH group and the LVH group compared with the control group (P<0.05). Although EL-A was higher in the LVH group than in the NLVH group, the difference was not statistically significant (P> 0.05).
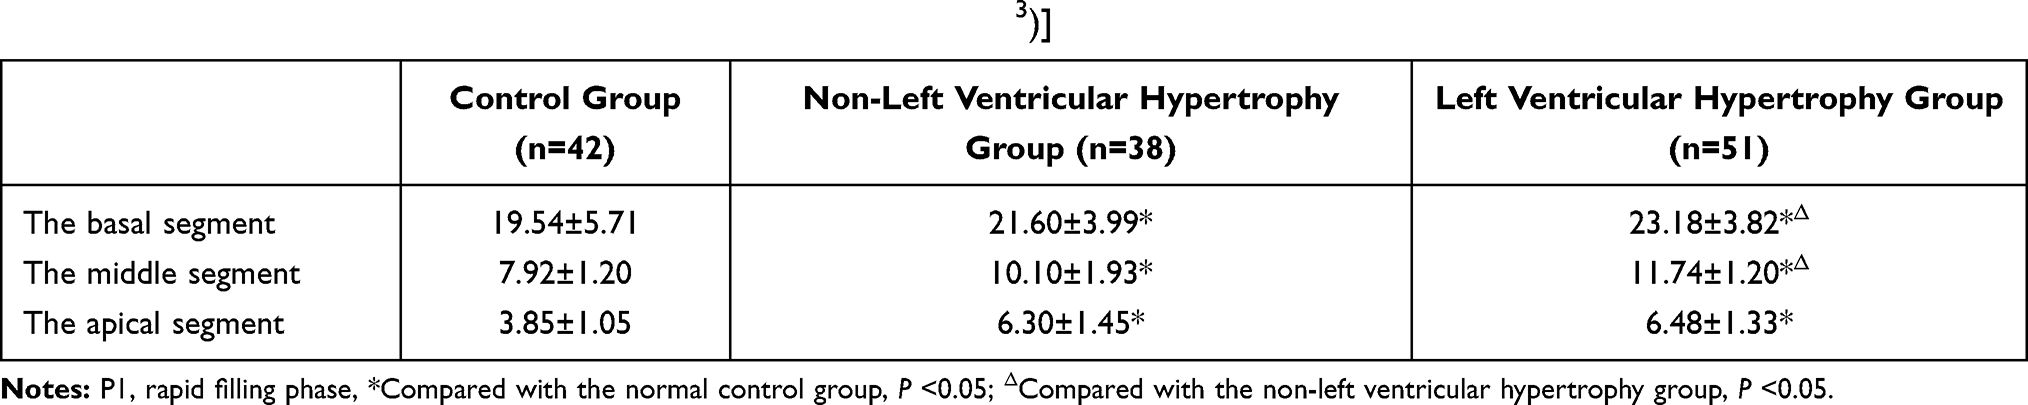 |
Table 3 Local Energy Loss in the Left Ventricle During P1 [J/(S·m3)] |
 |
Table 4 Local Energy Loss in the Left Ventricle During P2 [J/(S·m3)] |
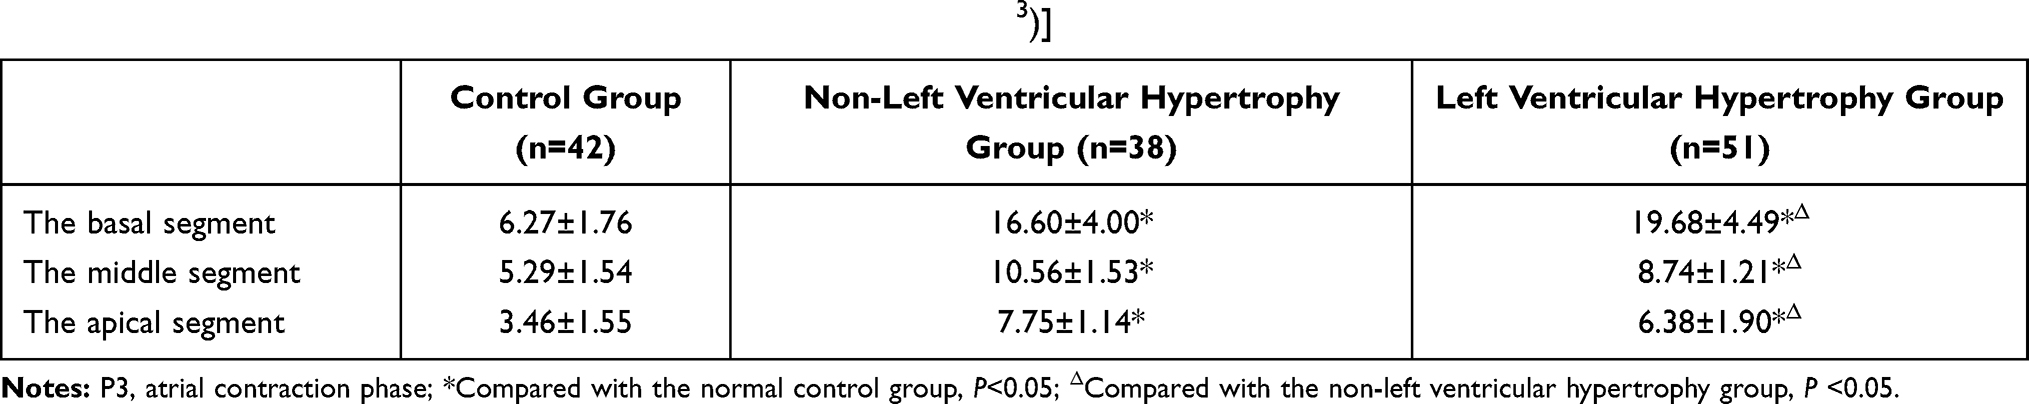 |
Table 5 Local Energy Loss in the Left Ventricle During P3 [J/(S·m3)] |
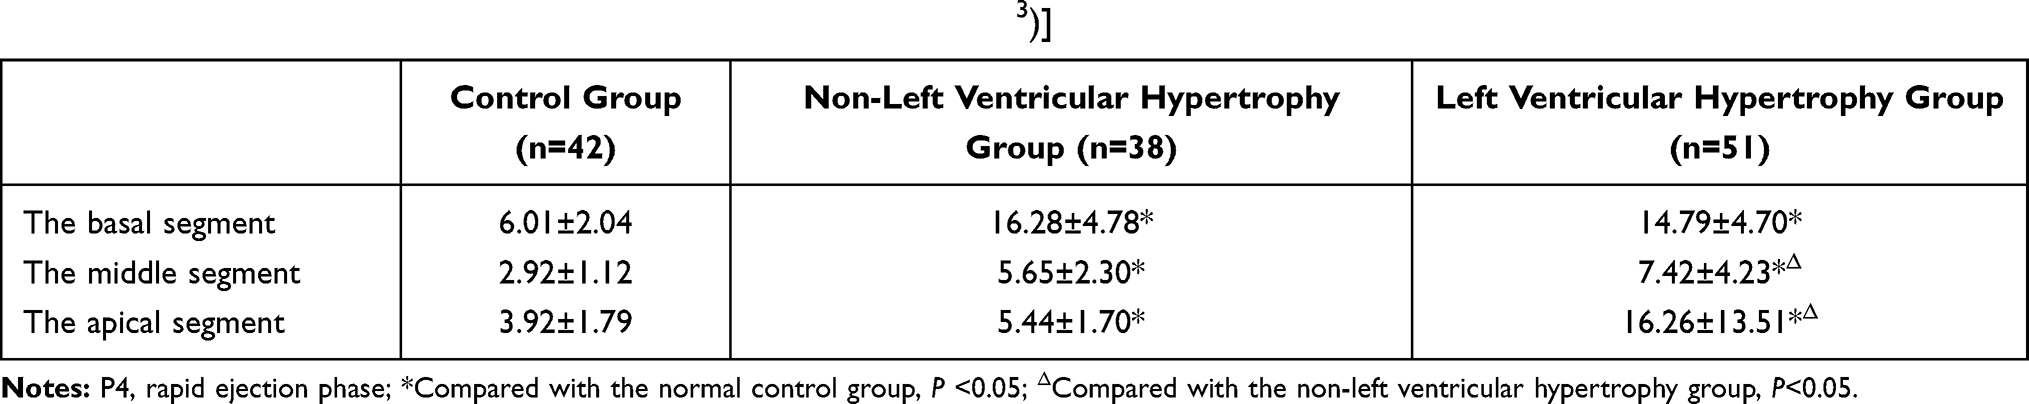 |
Table 6 Local Energy Loss in the Left Ventricle During P4 [J/(S m3)] |
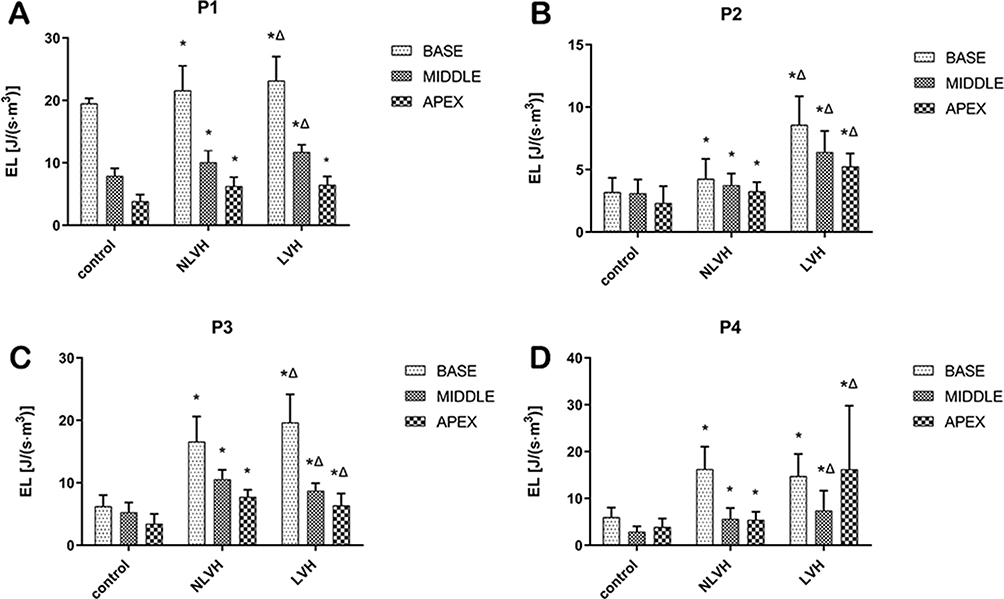 |
Figure 1 Comparison of changes among three groups during the same phase at different segments of the left ventricle. (A) Rapid filling phase (P1); (B) slow filling phase (P2); (C) atrial contraction phase (P3); (D) rapid ejection phase (P4); base: the base segment; middle: the middle segment; apex: the apical segment. Notes: *Compared with the normal control group, P < 0.05; ΔCompared with the non-left ventricular hypertrophy group, P < 0.05. |
P2
- ) EL-B were significantly higher in the NLVH group and the LVH group compared with the control group (P<0.05). EL-B was higher in the LVH group than in the NLVH group; the difference was statistically significant (P<0.05).
- ) EL-M were significantly higher in the NLVH group and the LVH group compared with the control group (P<0.05). EL-M was higher in the LVH group than in the NLVH group; the difference was statistically significant (P<0.05).
- ) EL-A were significantly higher in the NLVH group and the LVH group compared with the control group (P<0.05). EL-A was higher in the LVH group than in the NLVH group; the difference was statistically significant (P<0.05).
P3
- ) EL-B were significantly higher in the NLVH group and the LVH group compared with the control group (P<0.05). EL-B was higher in the LVH group than in the NLVH group; the difference was statistically significant (P<0.05).
- ) EL-M were significantly higher in the NLVH group and the LVH group compared with the control group (P<0.05). However, EL-M was lower in the LVH group than in the NLVH group; the difference was statistically significant (P<0.05).
- ) EL-A were significantly higher in the NLVH group and the LVH group compared with the control group (P<0.05). However, EL-A was lower in the LVH group than in the NLVH group; the difference was statistically significant (P<0.05).
P4
- ) EL-B were significantly higher in the NLVH group and the LVH group compared with the control group (P<0.05). However, EL-B was slightly lower in the LVH group than in the NLVH group; the difference was not statistically significant (P> 0.05).
- ) EL-M were significantly higher in the NLVH group and the LVH group compared with the control group (P<0.05). EL-M was higher in the LVH group than in the NLVH group; the difference was statistically significant (P<0.05).
- ) EL-A were significantly higher in the NLVH group and the LVH group compared with the control group (P<0.05). EL-A was higher in the LVH group than in the NLVH group; the difference was statistically significant (P<0.05).
Repeatability Test (Figure 2)
- ) The correlation coefficients of the inter-observer diastolic phase EL (ELdia) and systolic phase EL (ELsys) were 0.9745 and 0.9887, respectively.
- ) The correlation coefficients of the intra-observer ELdia and ELsys were 0.9585 and 0.9413, respectively. The inter-observer and intra-observer measurement consistency limits were both acceptable and had good repeatability.
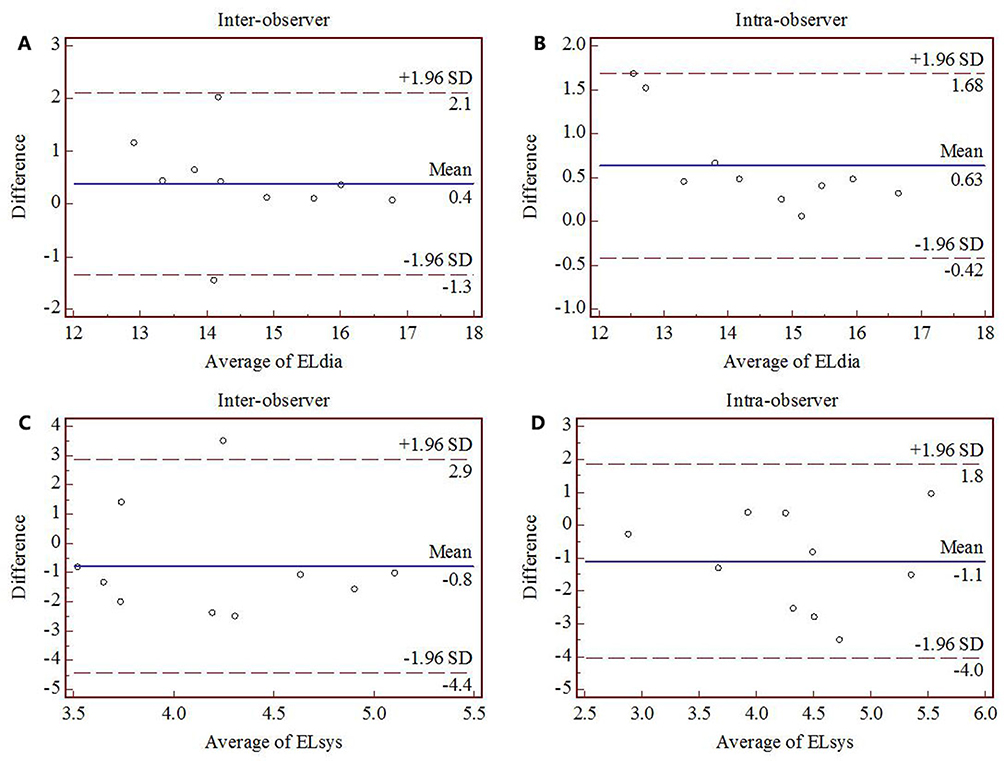 |
Figure 2 Repeatability test for the diastolic and systolic energy loss of the left ventricle in normal subjects; (A and C) the inter-observer repeatability test, with the correlation coefficient of 0.9745 and 0.9887, respectively; (B and D) the intra-observer repeatability test, with the correlation coefficient of 0.9585 and 0.9413, respectively. |
Discussion
Intra-cardiac blood flow state laminar and vortex flow fields exist during different cardiac cycle phases. The myocardial band mechanics, the blood flow ejecting into the LV, and the mutual motion of the ventricular wall and mitral valve are the bases for cardiac chamber vortice creation. Vortex flow stability is essential for maintaining the equilibrium relationship between the circulating blood and myocardial tissue. Although the vortex may increase the shear stress in the ventricular wall, it keeps the state of blood flow stable, prevents flow beam divergence, and reduces kinetic EL.14,15 Under physiological conditions, a lower EL allows for ideal kinetic energy reserve, accumulation, and transport during the ventricular systolic pre-ejection phase. The physiological diastolic vortex is a form of energy reserve and transfer, and proper blood flow order helps avoid turbulence formation and plays an important role in keeping EL within the normal range.
The myocardial band theory suggests that the ventricular muscle is composed of a longitudinal myocardium spiral. The coordinated motion between the basal segment and the apical segment, including the longitudinal, radial, and rotational motion, is the anatomical and mechanical basis for securing the ejection and filling of the heart during the cardiac cycle. During diastole, the reverse movement of the base and apex of the left ventricle forms negative pressure in the left ventricular cavity and produces effective filling. The myocardium is composed of three myocardial fiber layers, and subendocardial myocardial ischemia is more likely to cause the involvement of the longitudinal systolic function.
The normal hemodynamic vortex couples with the left ventricular filling and emptying. The elastic potential energy stored in the LV at the end of systole produces an intracardiac pressure difference with a lower apical pressure than basal pressure, drawing blood into the LV during the early diastole. The pressure gradient in the cardiac cavity gradually reverses; the pressure in the apex was greater than in the base, and the blood flow decelerated and moved to the middle of the LV in the form of a vortex. During the late diastole, blood is shifted from apex to base, and the ejection process is accelerated by the compression from apex to base. Goliasch et al found that in patients treated with cardiac resynchronization, pacemaker closure caused immediate changes in the vortex formation and duration in the absence of structural changes.16 This suggests that minor changes in surrounding structures could lead to huge hydrodynamic changes and cause an imbalance between the heart and the circulation. Therefore, EL would be a sensitive indicator for abnormal cardiac function detection in patients with HTN.
The myocardium of patients with HTN is under long-term volume and pressure load, with an extracellular matrix synthesis and degradation imbalance, increased extracellular fibrosis, interstitial collagen deposition, and various collagen-type ratio imbalances, all of which impede the normal contractile and diastolic functions of cardiac myocytes.17,18 Previous studies have found that early cardiac functional impairment is most common in the middle and base, with reduced early diastolic longitudinal strain rates in the NLVH group (first involving the subendocardial myocardium) and normal function in the middle and outer layers.19,20 The volume overload is significantly higher than normal.21 In the present study, it was found that EL-B, EL-M and EL-A during the P1, P2 and P3 were significantly higher in the NLVH group than in the control group. Before LVH formation in patients with HTN, the LV has an increased extracellular matrix, reduced elasticity and active relaxation capacity, increased diastolic pressure in the cardiac chambers, increased pressure load on the inner myocardium compared with the outer myocardium, weakened longitudinal contraction, and uncoordinated contraction of the inner and outer myocardium, causing the abnormal formation of cardiac chamber blood flow vortex. The morphological disturbance of the vortex leads to increased blood flow dispersion and instability, causing inflow tract deflection and lateral force generation and resulting in a higher energy consumption in order to promote flow in the longitudinal direction of the fluid. Even if the disease is at an early stage and without structural changes, the fluid dynamics have changed significantly. The finding suggested that when the pathological changes occurred without significant anatomical abnormalities, the vortex flow can change immediately and significantly. Moreover, in the early LV filling was more dependent on the contraction and higher pressure of the left atrium. In our previous study, global EL in NLVH group during P3 was found the highest among three groups. In this study, EL-B, EL-M and EL-A during the P3 were significantly increased in the NLVH group compared with the control group, and EL-M and EL-A were even higher compared with the LVH group. During P3, the pump function of atrial increases as a compensation at the first stage of the disease, leading the significant turbulence of the vortex with atrial contraction. Meanwhile, apex in the NLVH group showed an increased counter-clockwise rotation during the diastole, resulting in an enhanced compensatory effect in the apex. This may also be the cause of the EL increase in the apex during the P3 in the NLVH group.
Blood pressure is the most important factor leading to LVH, which is usually a compensation mechanism in response to increased hemodynamic load, resulting in cardiomyocyte hypertrophy and extracellular matrix remodeling. The pathogenesis involves hemodynamic overload caused by pressure and volume overload, and significant changes in the stress and shear force of the vortex on the ventricular wall. Mechanical stretching of the ventricular wall activates neurohumoral factors, cardiovascular paracrine and autocrine factors. With the increase of left ventricular weight, oxygen demand increases, myocardial cell compensation increases, and microvascular dysfunction occurs. Aggravate myocardial fibrosis and endothelial cell dysfunction. In this study, it was found that the EL of each segment in the LVH group was higher than that in the normal control group at each diastolic phase. On the one hand, under long-term pressure load, the action potential of cardiomyocytes increased unsteadily, the mechanism of myocardial excitation-contraction coupling was maladjusted, the synchronization of each segment decreased, and the myocardial movement was not coordinated. Delayed contraction in endocardium and between endocardium and myocardium is associated with early detection of subclinical impairment of myocardial function.22 As a result, the local pressure difference in the cardiac cavity was produced, and the vector direction of blood flow in the ventricular cavity was more disordered, which hindered the formation of effective asymmetric vortices in the cardiac cavity and increased EL. On the other hand, myocardial fibrosis intensified, ventricular compliance decreased, stiffness increased, and the pressure gradient between normal basal segment and apical segment deflected, resulting in increased wall stress, prolonged diastolic time and increased ventricular filling pressure. Slow blood filling hinders the formation of normal vortices. The formation of irregular vortex increased, which caused local cardiomyocyte hypertrophy and ventricular wall stiffness, further hindered the production of normal vortex, and caused the increase of transverse intracardiac pressure gradient, aggravated cardiomyocyte hypertrophy and abnormal accumulation of intercellular matrix, and aggravated the wall stress and mechanical tension of muscle cells, resulting in further imbalance between blood and myocardial movement. According to the equation,23 with the dissipation of energy and the ineffective formation of vortex, the increased EL resulted in the decrease of left ventricular pumping and transport efficiency. The potential energy reserve in the left ventricle is transported through unstable vortices and dynamically reflects the change of wall motion abnormalities in the left ventricle.
Conclusions
Left ventricular diastolic and systolic EL can be measured in real time by flow vector imaging, which is related to the parameters of diastolic function. EL provides a new parameter for evaluating abnormal diastolic function in the early stage. In patients with essential hypertension, the segmental EL increased significantly in each phase of the cardiac cycle with the progression of the disease. The increase of EL in NLVH during atrial contraction is the most significant, which may be related to the compensatory enhancement of left atrial function.
Ethics Approval
This study was conducted with approval from the Ethics Committee of PLA Strategic Support Force Characteristic Medical Center. This study was conducted in accordance with the declaration of Helsinki. Written informed consent was obtained from all participants.
Funding
This study was funded by the Capital Characteristic Clinic Project (Z181100001718015). The funding body had no role in the design of the study and collection, analysis, and interpretation of data and in writing the manuscript.
Disclosure
The authors report no conflicts of interest in this work.
References
1. Mancia G, Fagard R, Narkiewicz K, et al. 2013 ESH/ESC guidelines for the management of arterial hypertension: the task force for the management of arterial hypertension of the European Society of Hypertension (ESH) and of the European Society of Cardiology (ESC). Eur Heart J. 2013;34(28):2159–2219.
2. Umemura S, Arima H, Arima S, et al. The Japanese Society of Hypertension guidelines for the management of hypertension (JSH 2019). Hypertens Res. 2019;42(9):1235–1481.
3. Forouzanfar MH, Liu P, Roth GA, et al. Global burden of hypertension and systolic blood pressure of at least 110 to 115 mm Hg, 1990–2015. JAMA. 2017;317(2):165. doi:10.1001/jama.2016.19043
4. Uijl A, Veenis JF, Brunner-la RH, et al. Clinical profile and contemporary management of patients with heart failure with preserved ejection fraction: results from the CHECK-HF registry. Neth Heart J. 2021;29(7–8):370–376. doi:10.1007/s12471-020-01534-7
5. Santos AB, Gupta DK, Bello NA, et al. Prehypertension is associated with abnormalities of cardiac structure and function in the atherosclerosis risk in communities study. Am J Hypertens. 2016;29(5):568–574. doi:10.1093/ajh/hpv156
6. Imbalzano E, Zito C, Carerj S, et al. Left ventricular function in hypertension: new insight by speckle tracking echocardiography. Echocardiography. 2011;28(6):649–657. doi:10.1111/j.1540-8175.2011.01410.x
7. Tadic M, Majstorovic A, Pencic B, et al. The impact of high-normal blood pressure on left ventricular mechanics: a three-dimensional and speckle tracking echocardiography study. Int J Cardiovasc Imaging. 2014;30(4):699–711. doi:10.1007/s10554-014-0382-3
8. Hayashi T, Itatani K, Inuzuka R, et al. Dissipative energy loss within the left ventricle detected by vector flow mapping in children: normal values and effects of age and heart rate. J Cardiol. 2015;66(5):403–410. doi:10.1016/j.jjcc.2014.12.012
9. Pedrizzetti G, Sengupta PP. Vortex imaging: new information gain from tracking cardiac energy loss. Eur Heart J Cardiovasc Imaging. 2015;16(7):719–720. doi:10.1093/ehjci/jev070
10. Stugaard M, Koriyama H, Katsuki K, et al. Energy loss in the left ventricle obtained by vector flow mapping as a new quantitative measure of severity of aortic regurgitation: a combined experimental and clinical study. Eur Heart J Cardiovasc Imaging. 2015;16(7):723–730. doi:10.1093/ehjci/jev035
11. Kakizaki R, Nabeta T, Ishii S, et al. Cardiac resynchronization therapy reduces left ventricular energy loss. Int J Cardiol. 2016;221:546–548. doi:10.1016/j.ijcard.2016.07.098
12. Brook RD, Rajagopalan S. 2017 ACC/AHA/AAPA/ABC/ACPM/AGS/ APhA/ ASH/ASPC/NMA/PCNA guideline for the prevention, detection, evaluation, and management of high blood pressure in adults. A report of the American College of Cardiology/American Heart Association task force on clinical practice guidelines. J Am Soc Hypertens. 2018;12(3):238.
13. Marwick TH, Gillebert TC, Aurigemma G, et al. Recommendations on the use of echocardiography in adult hypertension: a report from the European Association of Cardiovascular Imaging (EACVI) and the American Society of Echocardiography (ASE). J Am Soc Echocardiogr. 2015;28(7):727–754. doi:10.1016/j.echo.2015.05.002
14. Sengupta PP, Khandheria BK, Korinek J, et al. Biphasic tissue Doppler waveforms during isovolumic phases are associated with asynchronous deformation of subendocardial and subepicardial layers. J Appl Physiol (1985). 2005;99(3):1104–1111. doi:10.1152/japplphysiol.00191.2005
15. Kheradvar A, Rickers C, Morisawa D, et al. Diagnostic and prognostic significance of cardiovascular vortex formation. J Cardiol. 2019;74(5):403–411. doi:10.1016/j.jjcc.2019.05.005
16. Goliasch G, Goscinska-Bis K, Caracciolo G, et al. CRT improves LV filling dynamics: insights from echocardiographic particle imaging velocimetry. JACC Cardiovasc Imaging. 2013;6(6):704–713. doi:10.1016/j.jcmg.2013.04.004
17. Weber KT, Brilla CG, Janicki JS. Myocardial fibrosis: functional significance and regulatory factors. Cardiovasc Res. 1993;27(3):341–348. doi:10.1093/cvr/27.3.341
18. Verdecchia P, Angeli F, Achilli P, et al. Echocardiographic left ventricular hypertrophy in hypertension: marker for future events or mediator of events? Curr Opin Cardiol. 2007;22(4):329–334. doi:10.1097/HCO.0b013e3280ebb413
19. Enomoto M, Ishizu T, Seo Y, et al. Subendocardial systolic dysfunction in asymptomatic normotensive diabetic patients. Circ J. 2015;79(8):1749–1755. doi:10.1253/circj.CJ-15-0012
20. Saeki M, Sato N, Kawasaki M, et al. Left ventricular layer function in hypertension assessed by myocardial strain rate using novel one-beat real-time three-dimensional speckle tracking echocardiography with high volume rates. Hypertens Res. 2015;38(8):551–559. doi:10.1038/hr.2015.47
21. Yalcin F, Kucukler N, Cingolani O, et al. Evolution of ventricular hypertrophy and myocardial mechanics in physiological and pathological hypertrophy. J Appl Physiol (1985). 2019;126(2):354–362. doi:10.1152/japplphysiol.00199.2016
22. Kim SA, Kim MN, Shim WJ, et al. Layer-specific dyssynchrony and its relationship to the change of left ventricular function in hypertensive patients. Heart Vessels. 2016;31(4):528–534. doi:10.1007/s00380-014-0626-0
23. Itatani K, Okada T, Uejima T, et al. Intraventricular flow velocity vector visualization based on the continuity equation and measurements of vorticity and wall shear stress. Jpn J Appl Phys. 2013;52(7Issue2):1044–1055.
 © 2021 The Author(s). This work is published and licensed by Dove Medical Press Limited. The full terms of this license are available at https://www.dovepress.com/terms.php and incorporate the Creative Commons Attribution - Non Commercial (unported, v3.0) License.
By accessing the work you hereby accept the Terms. Non-commercial uses of the work are permitted without any further permission from Dove Medical Press Limited, provided the work is properly attributed. For permission for commercial use of this work, please see paragraphs 4.2 and 5 of our Terms.
© 2021 The Author(s). This work is published and licensed by Dove Medical Press Limited. The full terms of this license are available at https://www.dovepress.com/terms.php and incorporate the Creative Commons Attribution - Non Commercial (unported, v3.0) License.
By accessing the work you hereby accept the Terms. Non-commercial uses of the work are permitted without any further permission from Dove Medical Press Limited, provided the work is properly attributed. For permission for commercial use of this work, please see paragraphs 4.2 and 5 of our Terms.