")
Back to Journals » Diabetes, Metabolic Syndrome and Obesity » Volume 7
Variability in Zucker diabetic fatty rats: differences in disease progression in hyperglycemic and normoglycemic animals
Authors Wang X, DuBois DC, Sukumaran S, Ayyar V, Jusko WJ, Almon R
Received 24 June 2014
Accepted for publication 23 July 2014
Published 11 November 2014 Volume 2014:7 Pages 531—541
DOI https://doi.org/10.2147/DMSO.S69891
Checked for plagiarism Yes
Review by Single anonymous peer review
Peer reviewer comments 5
Editor who approved publication: Professor Ming-Hui Zou
Xi Wang,1 Debra C DuBois,1,2 Siddharth Sukumaran,2 Vivaswath Ayyar,1 William J Jusko,2,3 Richard R Almon1–3
1Department of Biological Sciences, 2Department of Pharmaceutical Sciences, State University of New York at Buffalo, Buffalo, NY, USA; 3New York State Center of Excellence in Bioinformatics and Life Sciences, Buffalo, NY, USA
Abstract: Both obesity and chronic inflammation are often associated with insulin resistance and type 2 diabetes. The Zucker diabetic fatty (ZDF) rat (fa/fa) is an obese animal model frequently used in type 2 diabetes research. The current study determines whether chronic administration (from 5 weeks of age through 24 weeks of age) of salsalate, a salicylate with anti-inflammatory properties, would be effective in mitigating diabetes disease progression in ZDF rats. Although a trend existed for lower blood glucose in the salsalate-treated group, significant differences were obscured by high animal-level variability. However, even in the non-drug-treated group, not all ZDF rats became diabetic as expected. Therefore, animals were parsed into two groups, regardless of drug treatment: normoglycemic ZDF rats, which maintained blood glucose profiles identical to nondiabetic Zucker lean rats (ZLRs), and hyperglycemic ZDF rats, which exhibited progressive elevation in blood glucose. To ascertain the differences between ZDF rats that became hyperglycemic and those that did not, relevant physiological indices and expression levels of adiponectin, tumor necrosis factor-α, interleukin-6, and glucocorticoid-induced leucine zipper messenger RNAs in adipose tissue were measured at sacrifice. Plasma C-reactive protein concentrations and expression levels of cytokine and glucocorticoid-induced leucine zipper messenger RNAs suggested more prevalent chronic inflammation in hyperglycemic animals. Early elevation of the insulin-sensitizing adipokine, adiponectin, was present in both ZDF groups, with the rate of its age-related decline faster in hyperglycemic animals. The most marked difference between the two groups of ZDF animals was in insulin output. Although the two ZDF populations had very similar elevated plasma insulin concentrations for the first 10 weeks, after that time, plasma insulin decreased markedly in the animals that became hyperglycemic, whereas it remained high in the normoglycemic ZDF rats. Thus, hyperglycemic ZDF animals exhibit both insulin resistance and progressive beta cell failure, whereas normoglycemic ZDF rats exhibit a lesser degree of insulin resistance that does not progress to beta cell failure. In these respects, the normoglycemic ZDF rats appear to revert back to a phenotype that strongly resembles that of nondiabetic Zucker fatty rats from which they were derived.
Keywords: type 2 diabetes, ZDF rats, animal models
Introduction
Type 2 diabetes mellitus (T2DM) in humans is a disturbance of metabolic homeostasis, with highly variable etiology and progression. Obesity is a major risk factor for developing T2DM, especially in the West.1,2 Considerable evidence exists supporting the hypothesis that the link between T2DM and obesity is chronic inflammation caused by macrophage infiltration of enlarged adipose depots.2–5 However, obesity does not necessarily cause T2DM because all obese individuals do not develop the disease and many individuals with T2DM are not obese. For example, in Asia, the majority of individuals with T2DM are not overweight.6 In addition, the incidence of T2DM is increased in other conditions associated with chronic inflammation such as periodontal disease, asthma, and hepatitis C infections.7–10 However, as with obesity, all individuals with chronic inflammatory diseases do not develop T2DM, indicating that genetics – and perhaps epigenetics – plays an important role in determining whether chronic inflammation will progress to T2DM.11 What does seem to be clear is that inflammation can disturb metabolic balance sufficiently to interfere with insulin-directed glucose disposal. Whether or not a disruption in glucose disposal progresses from a prediabetic condition to overt diabetes seems to depend on the ability of beta islet cells to compensate and, to a large degree, progression to T2DM is based on beta cell failure.
Animal models can be a useful substitute for humans in studies of both etiology of disease and therapeutic interventions. Two inbred rat strains frequently used for studies on T2DM include the nonobese Goto–Kakizaki (GK) rat and the obese Zucker fatty diabetic (ZDF) rat. As these two strains differ markedly in body fat phenotype, their comparison can provide information concerning the variability in different subtypes of diabetes. Previously, our laboratory conducted an extensive disease progression study using lean GK rats. In addition to extensive physiological measurements, gene array analyses were run on liver, skeletal muscle, and adipose tissues.12–14 Heightened natural immunity was found in all three tissues. Based on those results, a study was designed to test the hypothesis that salsalate, an inhibitor of nuclear factor kappa-light-chain-enhancer of activated B cells (NF-κB) activation, may be efficacious in treating diabetes in the GK model.15 Salsalate ameliorated the hyperglycemia that develops in these nonobese diabetic animals. A natural extension of that study was to test the hypothesis that salsalate would also be effective in the obese diabetic ZDF rat. Due to extremely high interanimal variabilities, no significant glucose-modulating effects were evident in this study. However, the development of hyperglycemia was variable even in the non-drug-treated group. Both physiological measurements and selective gene expression analyses were used to investigate the differences among these groups. The results suggest that the development of beta cell failure can explain these differences.
Methods
Animals
This study consisted of nine male ZDF rats (fa/fa) and ten male Zucker lean rats (ZLRs) (fa/+). (Nine ZDF rats were used because one animal died 1 week after arrival in our facility). Animals were received from the Charles River Laboratories (Wilmington, MA, USA) at 4 weeks of age and were single caged to allow for individual measurements of food consumption. Animals were fed Purina 5008 rat chow (protein =23%, carbohydrate =58.5%, fat =6.5%, fiber =4%, and ash =8% by weight), with five ZDF rats and five ZLRs receiving that same chow with 0.1% salsalate incorporated. Salsalate was custom formulated in rat chow pellets by TestDiet Inc (Richmond, IN, USA). Body weights and food intake were measured every 2 days, and blood glucose once weekly. Animals were fed ad libitum from 4 weeks until 24 weeks of age. All rats were maintained under stringent environmental conditions that included strict adherence to 12 hour:12 hour light:dark cycles. All animal manipulations and care procedures were carried out between 1.5 hours and 3.5 hours after lights on. All animals were sacrificed at 24 weeks of age by aortic exsanguination using ethylenediaminetetraacetic acid (4 mM final concentration) as anticoagulant. Plasma was prepared by centrifugation (2,000× g, 4°C, 15 minutes), aliquoted, and stored at −80°C. Tissues harvested included liver, abdominal fat, and gastrocnemius muscles. All tissues were rapidly frozen in liquid nitrogen and stored at −80°C. All protocols adhered to the “Guide for the Care and Use of Laboratory Animals”16 and were approved by our institution’s Institutional Animal Care and Use Committee.
Blood and plasma measurements
Blood glucose was measured weekly using a BD Logic blood glucose meter (BD Medical, Franklin Lakes, NJ, USA). Insulin was measured in plasma samples obtained every week (Ultra Sensitive Rat Insulin enzyme-linked immunosorbent assay [ELISA] Kit; Crystal Chem Inc, Downers Grove, IL, USA). The same plasma samples that were collected weekly were also used for measurement of adiponectin (Adiponectin Rat ELISA; ALPCO Diagnostics, Salem, NH, USA). Selected samples taken throughout the study were used for determination of C-reactive protein (CRP) (Rat C-reactive protein ELISA Kit; BD Biosciences, San Jose, CA, USA). C-peptide was measured by ELISA in plasma harvested at sacrifice (Rat C-peptide ELISA; ALPCO). All assays were carried out according to manufacturer’s directions but with experimental samples run in triplicate.
RNA preparation
Abdominal adipose tissue samples from each animal were ground into a fine powder in a mortar cooled by liquid nitrogen, and 100 mg was added to 1 mL of prechilled QIAZOL reagent (Qiagen, Valencia, CA, USA). Total RNA extractions were carried out according to manufacturer’s directions and the samples were further purified using RNeasy mini columns (Qiagen). Final RNA preparations were eluted in RNase-free water and stored at −80°C. The RNAs were quantified on a Nanodrop spectrophotometer, and their purity and integrity were assessed by formaldehyde-agarose gel electrophoresis. All samples exhibited 260/280 absorbance ratios of approximately 2.0, and all showed intact ribosomal 28S and 18S RNA bands in an approximate ratio of 2:1 as visualized by ethidium bromide staining.
Construction of complementary RNA standards used in reverse transcription polymerase chain reaction assays
Reference sequences for specific genes chosen for quantitative reverse transcription polymerase chain reaction (qRT-PCR) analysis were searched from National Center for Biotechnology Information GeneBank (http://www.ncbi.nlm.nih.gov/genbank/). Primers were designed by the online software Primer3 (http://simgene.com/Primer3). Conventional RT-PCR followed by TOPO cloning (TOPO TA Cloning Kit; Invitrogen, Grand Island, NY, USA) was carried out in order to construct plasmids containing these gene-specific sequences, which were verified by automated Sanger sequencing performed at the Roswell Park Memorial Institute DNA Facility (Buffalo, NY, USA). These plasmids were used to produce in vitro-transcribed complementary RNAs (cRNAs) specific for each gene of interest (T7 Megascript Kit; Ambion, Austin, TX, USA) for use as standards in quantitative kinetic-based RT-PCR analyses. Size, purity, and integrity of the cRNAs were assessed by formaldehyde-agarose gel electrophoresis and spectrophotometry.
Development of qRT-PCR assays
TaqMan-based real-time qRT-PCR assays were developed and validated according to the guidelines of the Minimum Information for Publication of Quantitative Real-Time PCR Experiments17 for each gene of interest. Primer sets and labeled probes were designed using RealTime Design software (Biosearch Technologies Inc, Novato, CA, USA) and were custom synthesized by that company. The qRT-PCR was performed using a Stratagene MX3005P real-time cycler. Assays used Stratagene Brilliant II RT-PCR One-Step Core Reagent Kits (Agilent Technologies, Cedar Creek, TX, USA). Final assay volumes were 25 μL, and included 2.5 μL total RNA as template at an initial concentration of 25 ng/μL. TaqMan-based probe–primer pairs were designed for each assay to quantitatively measure the messenger RNA (mRNA) expression levels of specific genes. Other assay conditions including MgCl2 concentration, forward primer, reverse primer, and probe concentrations were optimized for each probe–primer set using total RNA. The qRT-PCR conditions for each assay are listed in Table 1. Each standard curve consisting of seven concentrations of gene-specific cRNA was run in each assay; the R2 values were in all cases greater than 0.99. Efficiencies of all runs were greater than 95%. Experimental samples were run in triplicate; intra- and interassay variabilities were less than 15%. Parallel tubes were run for every sample without reverse transcription (no-RT controls) to ensure absence of genomic contamination. In addition, quality controls consisting of tissue samples from a single rat were included in every qRT-PCR run to ensure equivalency between individual assay runs.
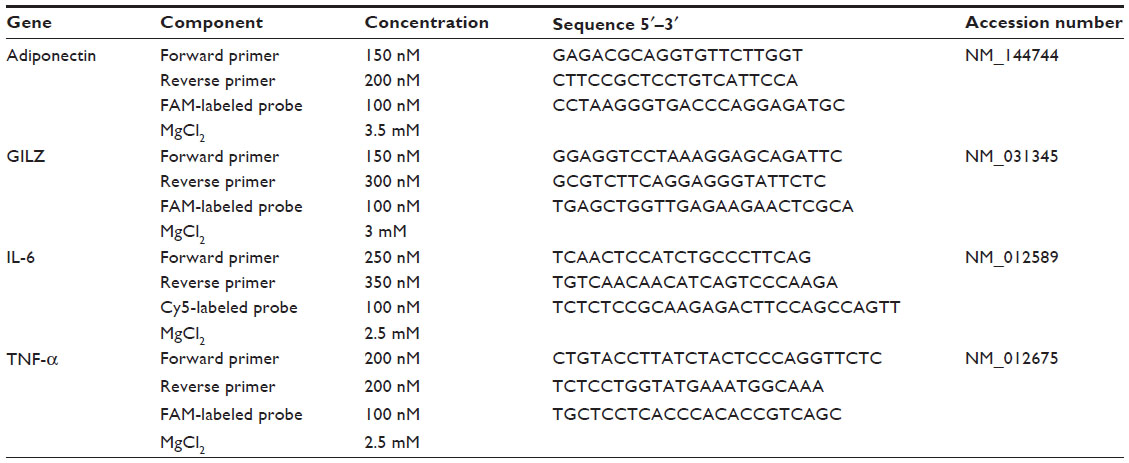 | Table 1 qRT-PCR analytical conditions |
Statistical analysis
Interassay variations of quality controls were less than 15% for all assays. For statistical comparisons, one-way (end-point analyses) or two-way analyses of variance (time-course analyses) were carried out using SigmaStat 3.5 software (Systat Software, Point Richmond, CA, USA) with Student–Newman–Keuls and Holm–Sidak post hoc tests.
Results
Salsalate treatment
Figure 1 presents the blood glucose profiles in salsalate and non-salsalate-treated ZDF animals and ZLRs. Although there was a trend for lower blood glucose in salsalate-treated diabetic animals, the extremely high variability in ZDF animals precluded interpretation of any potential effects of drug treatment.
 | Figure 1 Profiles of blood glucose with salsalate treatment. |
Hyperglycemic and normoglycemic ZDF animals
It was evident from examining the glucose profiles in each animal that the high variability in blood glucose was a result of differences in disease progression in individual ZDF rats independent of drug treatment. Therefore, animals were parsed into hyperglycemic (two animals from the control group and three from the salsalate-treated group) and normoglycemic (two animals from both control and salsalate-treated groups) based on their individual glucose profiles over time. Blood glucose profiles in normoglycemic and hyperglycemic ZDF rats, as well as nondiabetic ZLRs, are presented in Figure 2. Animals designated as normoglycemic were not different from nondiabetic ZLR controls at any age, whereas hyperglycemic rats were significantly different from both normoglycemic ZDF rats and ZLRs from the age of 9 weeks.
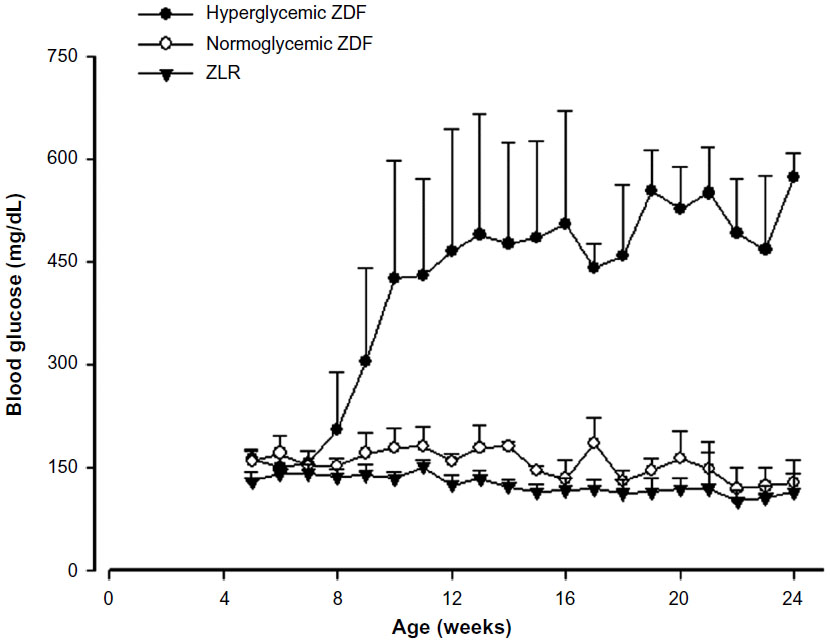 | Figure 2 Profiles of blood glucose in hyperglycemic and normoglycemic ZDF animals. |
Plasma insulin and C-peptide in ZDF animals
Figure 3A illustrates that a major difference between the normoglycemic ZDF rats and the hyperglycemic ZDF rats involves plasma insulin concentrations. Specifically, animals that became hyperglycemic were transiently hyperinsulinemic up until about 10 weeks of age, following which time insulin concentrations dropped dramatically. By contrast, those that did not become hyperglycemic maintained very high insulin throughout the experiment. This conclusion is reinforced by measurement of plasma C-peptide, a more stable index of insulin output, conducted at the end of the experiment (Figure 3B). Hyperglycemic ZDF rats and ZLRs had similar plasma C-peptide concentrations at 24 weeks, whereas the C-peptide concentration in normoglycemic ZDF rats was approximately five times higher.
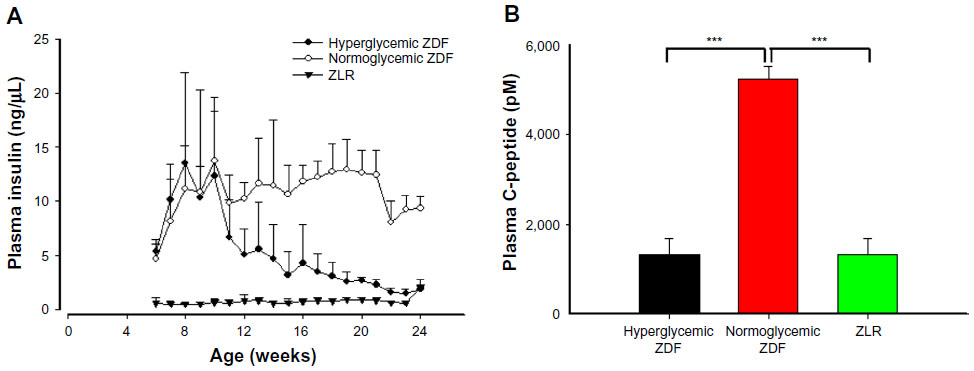 | Figure 3 Plasma insulin with C-peptide. |
Body weights and food consumption patterns in ZDF animals
Figure 4A shows that both ZDF rats that developed hyperglycemia and those that did not increased body weights at the same rate up to 80 days, but after that time, the weights of those animals that developed hyperglycemia plateaued, whereas those that did not continued to increase. Both groups of ZDF animals consumed more food than ZLR controls (Figure 4B), with hyperglycemic animals consuming more food than normoglycemic ZDF rats at later ages. When food intake was normalized to body weight (Figure 4C), hyperglycemic animals consumed proportionately more food throughout the study. Therefore, the lower body weights in hyperglycemic ZDF animals were not due to decreased appetite/food consumption. Salsalate had no significant effects on body weights or food consumption in either ZDF rats or ZLRs (data not shown).
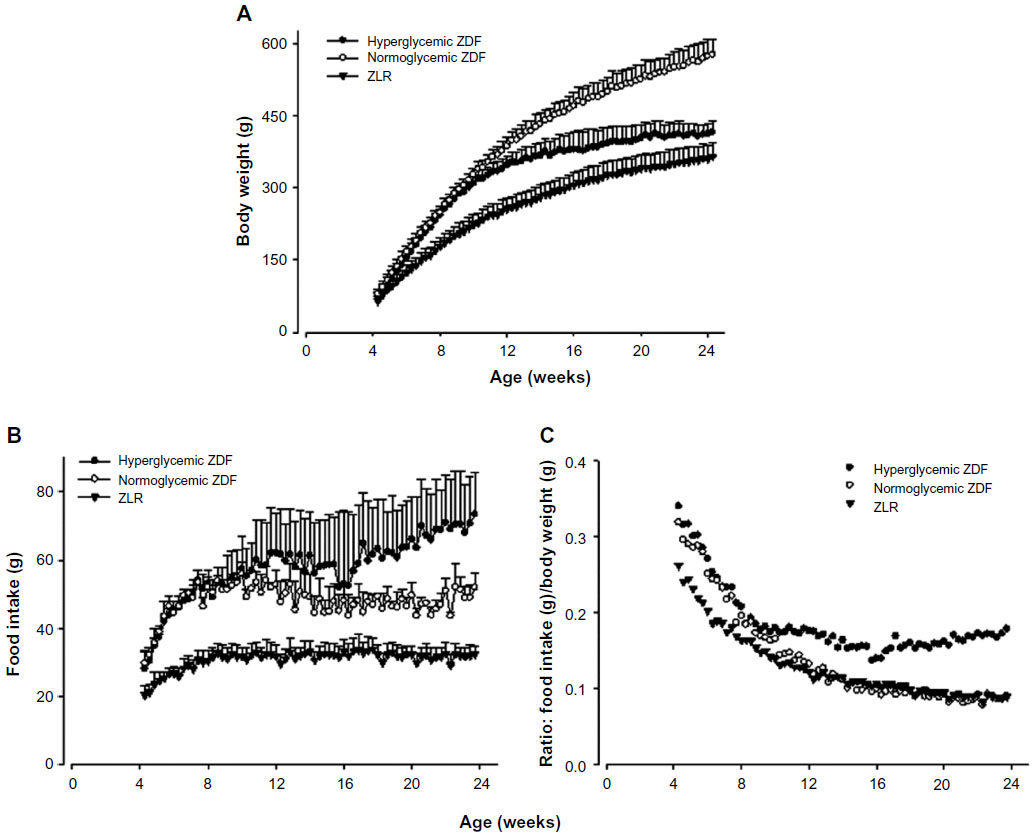 | Figure 4 Body weight and food intake. |
Plasma adiponectin and adiponectin mRNA
Adiponectin is a protein hormone produced by the adipose tissue, with plasma concentrations inversely proportional to the mass of body adipose tissue.18 Plasma adiponectin was measured throughout the experiment, and adiponectin mRNA was assessed in tissues harvested at sacrifice. Figure 5A shows that initially there was no difference in plasma adiponectin in ZDF rats that would become hyperglycemic and those that would not and that both were higher than ZLRs. However, as time progressed, the plasma adiponectin in ZDF rats that became hyperglycemic declined such that by 13 weeks, they were no different than ZLRs. By contrast, the plasma adiponectin in normoglycemic ZDF rats, while also declining with age, still remained higher almost up to the end of the experiment. As a consequence, plasma adiponectin in normoglycemic ZDF animals was significantly higher than that in hyperglycemic ZDF rats from week 12 to week 16 (P<0.05). Adiponectin mRNA level in adipose tissue harvested at the time of sacrifice is presented in Figure 5B. Interestingly, the adiponectin mRNA level in ZLRs was significantly higher compared with that in both ZDF groups, although at that time, there was no difference in the plasma hormone concentration.
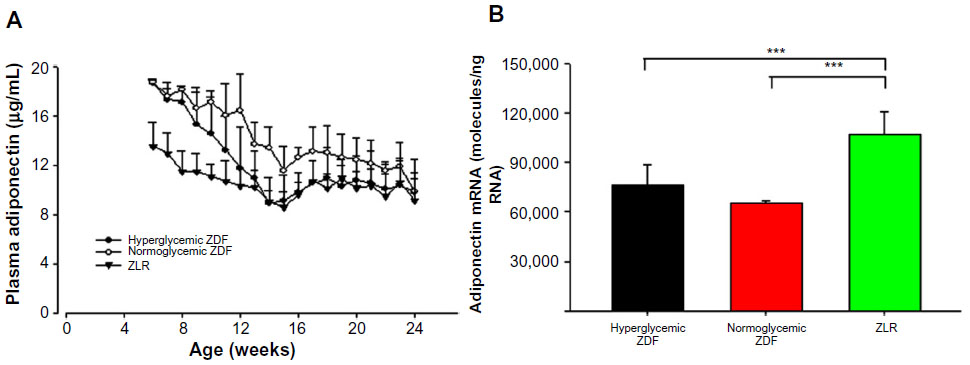 | Figure 5 Plasma adiponectin and adiponectin mRNA. |
Indexes of inflammation
Plasma CRP profiles are presented in Figure 6. CRP, an acute-phase reaction protein, is considered to be a general marker for systemic inflammation.19 There was a clear trend for elevated CRP concentrations in hyperglycemic ZDF animals. The mRNA content for other proteins related to inflammation in adipose tissue harvested at sacrifice was also measured (Figure 7). Figure 7A shows that the mRNA level for tumor necrosis factor (TNF)-α in adipose tissue was significantly higher in hyperglycemic ZDF rats compared with the same in ZLRs, but it exhibited intermediate level of expression in the tissue from normoglycemic ZDF rats. There was no difference in TNF-α mRNA between all three groups in either liver or skeletal muscle (data not shown). In addition, the mRNA level for interleukin (IL)-6 was higher in adipose tissue of both ZDF groups than in the ZLR group. However, unlike TNF-α, IL-6 mRNA level was slightly higher in nonhyperglycemic ZDF rats than in hyperglycemic ZDF animals (Figure 7B). By contrast, the level of glucocorticoid-induced leucine zipper (GILZ) mRNA, which is associated with suppressed inflammation,20 was higher in adipose tissue from ZLRs compared with that in hyperglycemic ZDF rats, with tissues from normoglycemic ZDF animals showing intermediate values (Figure 7C).
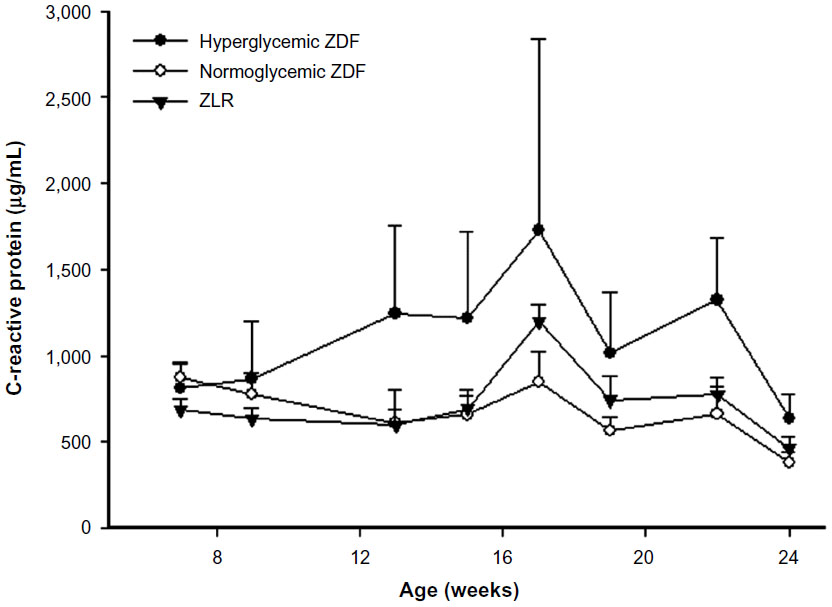 | Figure 6 C-reactive protein. |
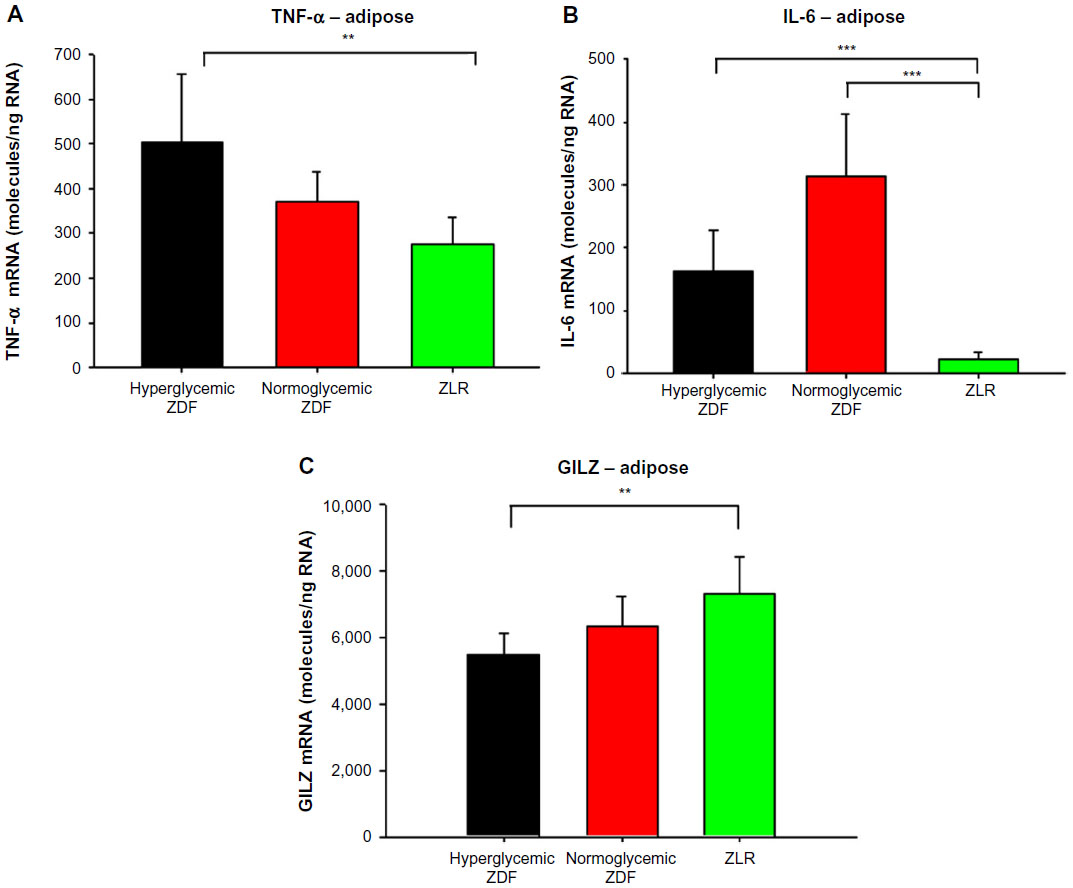 | Figure 7 Expression of genes reflecting inflammation in adipose tissue. |
Discussion
Animal models can be effective tools in elucidating the etiology of and evaluating therapeutic approaches to the treatment of human diseases. However, as with the human disease, these features can vary among different models. The diversity of outcomes in animal models does not abrogate their usefulness in understanding human disease. In many respects, animal models of T2D recapitulate the diversity observed in humans. Understanding the diverse origins and therapeutic outcomes in animal models can help identify commonalities with humans.
A nonobese model, the GK rat, has been widely used as a surrogate in T2DM studies. Originally developed in 1975 at the Tohoku University in Japan from multiple-generation breeding of Wistar rats selected for high population values of glucose intolerance, these rats exhibit a spontaneous polygenetic form of diabetes.21 In contrast to the polygenic lean GK rat model, the male ZDF rat is a diabetic model that carries a defect in the leptin receptor gene and, as a result, is hyperphagic and obese.22 The colony currently available from Charles River originated through many iterations from a colony first developed at Eli Lilly Research Laboratories in Indianapolis in 1974–1975.23 The ZDF rats were developed by selective inbreeding of Zucker fatty (ZF) rats that exhibited high blood glucose.22 Unlike the developed ZDF substrain, the ZF strain from which they were derived maintains normoglycemia despite their obese phenotype, hyperlipidemia, and hyperinsulinemia.
Previous studies in this laboratory and others have provided evidence that, despite their nonobese phenotype, chronic inflammation is a component of the disease in the GK model.12–14,24 Previous work utilizing GK animals evaluated the effect of salsalate, an inhibitor of NF-κB activation, on disease progression. Salsalate did indeed ameliorate the hyperglycemia that developed in these GK animals.15 Likewise, others have reported the efficacy of other immune-modulating agents in GK rats,24 as well as in ZDF animals.25 The hypothesis that salsalate would also be effective in diabetic ZDF rats was thus tested. The salsalate composition of the diet (1%) used in ZDF rats was identical to that found to be effective in GK animals.15 As reported here, the beneficial effects of salsalate on hyperglycemia observed in the GK model did not generalize to the ZDF model. One limitation in this study is that higher doses of drug were not examined. However, any potential effects of the drug may have been obscured by the high variability in disease in these animals (Figure 1).
Charles Rivers (the vendor for these animals) contends that male ZDF animals fed Purina 5008 diet will consistently develop diabetes, as evidenced by hyperglycemia at approximately 10 weeks of age. It should be noted that the fat content of Purina 5008 is 6.5% and, thus, is not a high-fat-containing diet. Although the animals in this study were fed the recommended diet, an unexpected result was that not all ZDF animals, regardless of presence or absence of salsalate treatment, developed hyperglycemia. Examination of the glucose and insulin data from the time series provides a clear explanation for the difference. The ZDF rats that became hyperglycemic exhibited decreased insulin output, suggesting progressive beta cell failure, whereas those that did not become hyperglycemic were able to maintain high plasma insulin. Thus, these normoglycemic ZDF rats appear to have reverted back to a phenotype similar to that of ZF rats, from which the ZDF strain was derived. The time series insulin data are corroborated by the measurement of C-peptide concentrations at the end of the experiment. C-peptide, a more stable measurement of insulin release,26 had concentrations in normoglycemic ZDF rats at sacrifice that were about five times higher than both hyperglycemic ZDF rats and ZLRs.
The severity of diabetes at later ages in the hyperglycemic ZDF animals was also reflected in body weight and food consumption. Despite higher food consumption, the body weights of these animals did not increase past 80 days. This suggests an inability to utilize the calories consumed. Although urine output and glucose were not directly measured, it was observed that urine output was greatly increased, as was water consumption. Both are classic symptoms of uncontrolled diabetes.
Because of their obese phenotype, the concentration of adiponectin, an adipokine linked to insulin sensitivity,18 was examined in these ZDF animals. Adiponectin increases the sensitivity of tissues to insulin through increased adenosine monophosphate kinase phosphorylation. Although not different at the end of 24 weeks, differences in plasma adiponectin among the groups were observed during the time series. Adiponectin, a protein hormone produced by adipose tissue, in general, has a circulating concentration that is inversely proportional to the amount of body fat.27 However, throughout much of the time course, both groups of ZDF animals had higher circulating concentrations of adiponectin than ZLRs despite the former’s higher adipose tissue content (Figure 5). Both ZDF populations had similar plasma adiponectin concentrations at the beginning of the time series, which were significantly higher than that in ZLRs. This elevation may be a compensatory mechanism that, in part, counteracts early insulin resistance. However, in the ZDF rats that became hyperglycemic, the plasma adiponectin concentration dropped precipitously such that it was no different from that in ZLRs at 12 weeks. As a consequence, plasma adiponectin was significantly higher in normoglycemic rats compared with that in hyperglycemic ZDF rats from 12 to 16 weeks of age. Plasma adiponectin did decline in the normoglycemic ZDF rats during the time course, but the decline was much slower. By the end of 24 weeks, there was no difference between the two ZDF groups and the concentration was similar to that in ZLRs. It may be important that the adiponectin mRNA level in adipose tissue at 24 weeks was significantly higher in the adipose tissues of ZLRs even though plasma adiponectin was not different. This result suggests that either the translation of mRNA is different or turnover of the protein is different in ZLRs. It is interesting that Oana et al28 have also reported higher concentrations of plasma adiponectin in ZF rats, despite lower adiponectin mRNA content in adipose tissue compared with that in ZLR controls.
Chronic inflammation has been recently identified as a correlated and possibly causative factor in T2DM in both humans and animal models.4 Therefore, various markers of inflammation were examined. A trend existed for higher concentrations of plasma CRP, a marker of systemic inflammation, in hyperglycemic compared with the concentrations in normoglycemic ZDF rats. The expression of two inflammatory cytokines associated with NF-κB activation, TNF-α and IL-6, was measured by qRT-PCR in the adipose tissue taken at sacrifice. TNF-α mRNA level was significantly higher in the adipose tissue of hyperglycemic ZDF rats compared with the levels in ZLRs. This mRNA was found at intermediate levels in the adipose tissue of normoglycemic ZDF rats. In addition, IL-6 mRNA level was higher in the adipose tissue of both ZDF groups compared with that in ZLRs. However, unlike TNF-α, IL-6 mRNA level was somewhat higher in normoglycemic ZDF animals than in hyperglycemic ZDF rats. By contrast, GILZ mRNA expression was significantly higher in adipose tissue from ZLRs compared with that in hyperglycemic ZDF rats, with nonhyperglycemic ZDF animals exhibiting intermediate values. GILZ, which is constitutively expressed in a variety of tissues and induced by glucocorticoids, shows anti-inflammatory activity by inhibiting NF-κB.20 Together, these results suggest a higher degree of inflammation in hyperglycemic ZDF rats compared with ZDF rats that did not develop overt hyperglycemia.
The most striking difference between ZDF animals that became hyperglycemic and those that did not was the persistence of hyperinsulinemia in the normoglycemic group. Components of T2DM disease progression involve insulin resistance, followed by progressive beta cell failure. This progression is reflected in the hyperglycemic ZDF animals, which initially (4–7 weeks of age) maintain normal blood glucose but with hyperinsulinemia, indicating early insulin resistance. However, insulin resistance at this age was compensated by increased insulin output, resulting in normal blood glucose. From 8 to 11 weeks of age, blood glucose continued to increase along with increased insulin output, indicating progressed severity of insulin resistance. Beginning at about 12 weeks, plasma insulin progressively declined, reaching concentrations equivalent to that in normal ZLRs at the end of the study despite severely elevated blood glucose, consistent with beta cell failure. By contrast, the normoglycemic ZDF group maintained high concentrations of insulin throughout the study. This strongly suggests that beta cell failure in hyperglycemic ZDF rats and lack thereof in normoglycemic ZDF rats explains the difference between the two groups. However, elevated insulin concentrations in the normoglycemic ZDF rats was able to maintain normal blood glucose at all ages, further suggesting that insulin resistance was less profound in normoglycemic ZDF rats compared with hyperglycemic ZDF animals.
Understanding why beta cells fail in one group but not in the other is quite relevant to T2DM in humans as hyperinsulinemia/prediabetes is very common. It is clear that both groups of ZDF animals in this study remained functionally leptin deficient because both groups exhibited hyperphagia and obesity. Although some degree of residual heterozygosity is estimated to exist among inbred strains, these animals were purchased at the same time from the same vendor, and their gene composition is mainly homozygous. In addition, environmental conditions throughout the experiment were rigorously maintained. A central question is why these two groups of animals, which are nearly identical in both their genetics and environmental exposures, exhibit different disease manifestations. An additional possibility may entail epigenetic modifications. Epigenetics, which involves DNA modifications, histone modifications, and/or micro-RNAs, results in the inherited changes in gene function without changes in their coding sequence.11 There is growing evidence suggesting that epigenetic mechanisms are associated with T2DM, and such mechanisms may play a role in the differences observed here.11,29,30 It is interesting to note that the normoglycemic ZDF rats revert to a phenotype very similar to that of the parent ZF strain, from which they were derived, exhibiting obesity and hyperinsulinemia but an absence of hyperglycemia.
Because this study was terminated at 24 weeks of age of the rats, it is not known whether the normoglycemic ZDF animals would have eventually exhibited hyperglycemia at a later age. It is quite possible that the age at which beta cell failure occurs (not if it occurs) is variable. This is an important consideration for studies in ZDF rats wherein disease progression is not monitored. In studies involving animals of a single age, the existence of hyperglycemia at that age does not necessarily reflect the length of time that hyperglycemia was extant, which might be quite important, particularly in studies involving secondary tissue and organ damage.
When animal models are used to study human disease, one must question relevance. However, the causes and development of T2DM in humans are likely as diverse as the disease in animal models. In this regard, the origins and nature of the metabolic disturbances that cause the development of prediabetes are probably quite similar in some humans and some animal models. Similarly, the mechanisms mediating the progression from prediabetes to diabetes are probably quite similar in some humans and in some animal models. In many respects, the diversity of animal models provides an approach to addressing the diversity of the disease in humans. This is particularly important in considering therapeutic approaches. Just as a therapeutic approach such as salsalate treatment may be effective in one animal model and not in another, it is probable that such therapy may only be effective in a subpopulation of humans with the disease. From this point of view, understanding the reason for the differences in animal models may provide the foundations for understanding and identifying subpopulations of humans with T2DM.
Acknowledgment
This work was supported by National Institutes of Health grant GM 24211.
Disclosure
The authors report no conflicts of interest in this work.
References
Cali AM, Caprio S. Prediabetes and type 2 diabetes in youth: an emerging epidemic disease? Curr Opin Endocrinol Diabetes Obes. 2008;15:123–127. | |
Lumeng CN, Saltiel AR. Inflammatory links between obesity and metabolic disease. J Clin Invest. 2011;121:2111–2117. | |
Cipolletta D. Adipose tissue-resident regulatory T cells: phenotypic specialization, functions and therapeutic potential. Immunology. 2014;142(4):517–525. | |
Calle MC, Fernandez ML. Inflammation and type 2 diabetes. Diabetes Metab. 2012;38:183–191. | |
Osborn O, Olefsky JM. The cellular and signaling networks linking the immune system and metabolism in disease. Nat Med. 2012;18:363–374. | |
Brunetti P. The lean patient with type 2 diabetes: characteristics and therapy challenge. Int J Clin Pract Suppl. 2007;(153):3–9. | |
Bahtiyar G, Shin JJ, Aytaman A, Sowers JR, McFarlane SI. Association of diabetes and hepatitis C infection: epidemiologic evidence and pathophysiologic insights. Curr Diab Rep. 2004;4:194–198. | |
Demmer RT, Jacobs DR Jr, Desvarieux M. Periodontal disease and incident type 2 diabetes: results from the First National Health and Nutrition Examination Survey and its epidemiologic follow-up study. Diabetes Care. 2008;31:1373–1379. | |
Rana JS, Mittleman MA, Sheikh J, et al. Chronic obstructive pulmonary disease, asthma, and risk of type 2 diabetes in women. Diabetes Care. 2004;27:2478–2484. | |
Tiengo A, Fadini GP, Avogaro A. The metabolic syndrome, diabetes and lung dysfunction. Diabetes Metab. 2008;34:447–454. | |
Toubal A, Treuter E, Clement K, Venteclef N. Genomic and epigenomic regulation of adipose tissue inflammation in obesity. Trends Endocrinol Metab. 2013;24:625–634. | |
Almon RR, DuBois DC, Lai W, Xue B, Nie J, Jusko WJ. Gene expression analysis of hepatic roles in cause and development of diabetes in Goto-Kakizaki rats. J Endocrinol. 2009;200:331–346. | |
Nie J, Xue B, Sukumaran S, Jusko WJ, DuBois DC, Almon RR. Differential muscle gene expression as a function of disease progression in Goto-Kakizaki diabetic rats. Mol Cell Endocrinol. 2011;338:10–17. | |
Xue B, Sukumaran S, Nie J, Jusko WJ, DuBois DC, Almon RR. Adipose tissue deficiency and chronic inflammation in diabetic Goto-Kakizaki rats. PLoS One. 2011;6:e17386. | |
Cao Y, DuBois DC, Sun H, Almon RR, Jusko WJ. Modeling diabetes disease progression and salsalate intervention in Goto-Kakizaki rats. J Pharmacol Exp Ther. 2011;339:896–904. | |
National Institutes of Health. Guide for the Care and Use of Laboratory Animals. National Institutes of Health publication 85-23. Washington DC: The National Academies Press; 1985. | |
Bustin SA, Benes V, Garson JA, et al. The MIQE guidelines: minimum information for publication of quantitative real-time PCR experiments. Clin Chem. 2009;55:611–622. | |
Lihn AS, Pedersen SB, Richelsen B. Adiponectin: action, regulation and association to insulin sensitivity. Obes Rev. 2005;6:13–21. | |
Nesto R. C-reactive protein, its role in inflammation, Type 2 diabetes and cardiovascular disease, and the effects of insulin-sensitizing treatment with thiazolidinediones. Diabetic Med. 2004;21:810–817. | |
Fan H, Morand EF. Targeting the side effects of steroid therapy in autoimmune diseases: the role of GILZ. Discov Med. 2012;13:123–133. | |
Goto Y, Kakizaki M, Masaki N. Production of spontaneous diabetic rats by repetition of selective breeding. Tohoku J Exp Med. 1976;119:85–90. | |
Peterson RG, Shaw WN, Neel M-A, Little LA, Eichberg J. Zucker Diabetic Fatty rat as a model for non-insulin-dependent diabetes mellitus. ILAR J. 1990;32:3. | |
Clark JB, Palmer CJ, Shaw WN. The diabetic Zucker fatty rat. Proc Soc Exp Biol Med. 1983;173:68–75. | |
Ehses JA, Lacraz G, Giroix MH, et al. IL-1 antagonism reduces hyperglycemia and tissue inflammation in the type 2 diabetic GK rat. Proc Natl Acad Sci U S A. 2009;106:13998–14003. | |
Rees DA, Alcolado JC. Animal models of diabetes mellitus. Diabetic Med. 2005;22:359–370. | |
Shpakov AO, Granstrem AO. C-peptide structure, functions and molecular mechanisms of action. Tsitologiia. 2013;55:16–27. | |
Cheng KK, Lam KS, Wang B, Xu A. Signaling mechanisms underlying the insulin-sensitizing effects of adiponectin. Best Pract Res Clin Endocrinol Metab. 2014;28:3–13. | |
Oana F, Takeda H, Hayakawa K, et al. Physiological difference between obese (fa/fa) Zucker rats and lean Zucker rats concerning adiponectin. Metabolism. 2005;54:995–1001. | |
Xu X, Su S, Barnes VA, et al. A genome-wide methylation study on obesity: differential variability and differential methylation. Epigenetics. 2013;8:522–533. | |
Nilsson E, Jansson PA, Perfilyev A, et al. Altered DNA methylation and differential expression of genes influencing metabolism and inflammation in adipose tissue from subjects with type 2 diabetes. Diabetes. 2014;63(9):2962–2976. |
 © 2014 The Author(s). This work is published and licensed by Dove Medical Press Limited. The full terms of this license are available at https://www.dovepress.com/terms.php and incorporate the Creative Commons Attribution - Non Commercial (unported, v3.0) License.
By accessing the work you hereby accept the Terms. Non-commercial uses of the work are permitted without any further permission from Dove Medical Press Limited, provided the work is properly attributed. For permission for commercial use of this work, please see paragraphs 4.2 and 5 of our Terms.
© 2014 The Author(s). This work is published and licensed by Dove Medical Press Limited. The full terms of this license are available at https://www.dovepress.com/terms.php and incorporate the Creative Commons Attribution - Non Commercial (unported, v3.0) License.
By accessing the work you hereby accept the Terms. Non-commercial uses of the work are permitted without any further permission from Dove Medical Press Limited, provided the work is properly attributed. For permission for commercial use of this work, please see paragraphs 4.2 and 5 of our Terms.