")
Back to Journals » Diabetes, Metabolic Syndrome and Obesity » Volume 14
Variability in Annual Fasting Glucose and the Risk of Peripheral Artery Disease in Patients with Diabetes Mellitus
Authors Chang YS , Lee LY, Lee IT
Received 22 July 2021
Accepted for publication 18 September 2021
Published 24 September 2021 Volume 2021:14 Pages 4109—4119
DOI https://doi.org/10.2147/DMSO.S330606
Checked for plagiarism Yes
Review by Single anonymous peer review
Peer reviewer comments 2
Editor who approved publication: Professor Ming-Hui Zou
Yu-Shan Chang,1,2 Liang-Yi Lee,3 I-Te Lee1,2,4
1Division of Endocrinology and Metabolism, Department of Internal Medicine, Taichung Veterans General Hospital, Taichung City, Taiwan; 2School of Medicine, Chung Shan Medical University, Taichung City, Taiwan; 3Mingdao High School, Taichung City, Taiwan; 4School of Medicine, National Yang Ming Chiao Tung University, Taipei, Taiwan
Correspondence: I-Te Lee
Division of Endocrinology and Metabolism, Department of Internal Medicine, Taichung Veterans General Hospital, 1650, Section 4, Taiwan Boulevard, Taichung City, 40705, Taiwan
Email [email protected]
Purpose: High glucose concentrations and swings are associated with endothelial dysfunction. We examined the effects of variability in fasting plasma glucose on peripheral artery disease (PAD) in patients with diabetes mellitus (DM).
Patients and Methods: In this screening study for the risk factors of PAD, we retrospectively collected data on the ankle-brachial index (ABI) and the percentage of mean arterial pressure (%MAP) at the ankle between August 01, 2016 and July 31, 2017. We defined low ABI ≤ 0.90, high %MAP ≥ 45%, or both as high-risk PAD and others as low-risk PAD. We compared the standard deviation (SD) of the first fasting plasma glucose data available each year after January 01, 2007.
Results: In 2577 patients, a higher SD of annual fasting glucose was observed in those with an ABI ≤ 0.90 than in patients with an ABI > 0.90 (2.6 ± 2.1 vs 2.2 ± 2.3, P = 0.009), and in patients with %MAP ≥ 45% than in those with %MAP < 45% (2.4 ± 2.1 vs 2.2 ± 2.3, P = 0.034). A high-risk PAD was significantly associated with the SD (P = 0.032) but not with the mean (P = 0.338) of annual fasting glucose. The former was an independent risk factor for high-risk PAD (odds ratio = 1.424; 95% CI = 1.118‒1.814; P = 0.004).
Conclusion: Variability but not mean of annual fasting plasma glucose was significantly associated with a high risk of PAD in patients with DM.
Keywords: ankle-brachial index, arterial stiffness, lower extremity arterial disease, percentage of the mean arterial pressure, standard deviation
Introduction
Peripheral artery disease (PAD) of the lower extremities is characterized by arterial occlusion caused by atherosclerosis.1 PAD is associated with disability and mortality,2,3 and carries considerable economic and humanistic burdens worldwide.4,5 Based on the American Heart Association/American College of Cardiology guidelines set in 2016 for the management of patients with lower-extremity PAD, the resting ankle-brachial index (ABI) is the priority diagnostic test.6 According to the definition of ABI ≤ 0.90, the global prevalence of PAD was 5.56% in adults ≥ 25 years of age,7 and the lifetime risk of PAD was 19%‒30% in the USA.8,9
Diabetes mellitus (DM) is a metabolic disorder associated with several chronic complications, including PAD.10 Because the number of people with DM is growing worldwide, DM is a major risk factor that increases PAD prevalence significantly.11 According to a report from the International Diabetes Federation, the global number of patients with DM was 463 million in 2019 and will rise to approximately 700 million by 2045 in the population aged 20–79 years.12,13
Among traditional markers for glycemic control, hemoglobin A1c (HbA1c) level was shown to be more strongly associated with PAD development than the fasting glucose level in patients with established DM in the Atherosclerosis Risk in Communities study.14 However, fasting glucose provided a better contribution to predict cardiovascular events than HbA1c in Taiwanese patients with type 2 DM.15 It was recently reported that normal coronary artery was associated with a higher HbA1c level compared with documented coronary atherosclerosis on coronary computed tomography angiography in patients with type 2 DM.16 Variabilities in HbA1c and fasting glucose have been reported to be associated with cardiovascular disease.17–19 However, in the Multi-Ethnic Study of Atherosclerosis study, mean fasting glucose was the important predictor of cardiovascular events and mortality, and variability of fasting glucose was not significantly associated with cardiovascular events or mortality after adjustment for mean fasting glucose during follow-up.20
Measuring the blood pressure of the ankle was postulated as a screening method for PAD in the 1950s, and brought about ABI development.21 However, the ABI values would unexpectedly increase due to arterial stiffness and reduce the sensitivity of the PAD diagnosis, especially in older people or those with DM and chronic kidney disease (CKD).22–24 It has been reported that the percentage of mean arterial pressure (%MAP) calculated using pulse volume recording at the ankle could enhance the sensitivity for the diagnosis of PAD.25,26 Furthermore, a combination of ABI and %MAP is useful in the prediction of all-cause mortality.27
Recent evidence has shown that HbA1c variability is related to a decrease in ABI and an increase in %MAP in patients with DM.28 However, HbA1c variability is associated with not only changes in plasma glucose, but also several factors influencing the rate of glycation and hemoglobin level.29 There is a lack of investigation to assess the relationship between %MAP and glucose variability. Since a combination of low ABI and high %MAP carries a high mortality risk in patients with DM,30 we hypothesized that glucose variability is associated with ABI and %MAP in patients with DM. Therefore, this screening study investigated whether glucose variability, as estimated by the standard deviation (SD) of annual fasting plasma glucose, is significantly associated with PAD, reflected by either high %MAP or low ABI, in patients with DM.
Patients and Methods
Study Design and Subjects
We conducted this screening study to investigate the risk factors of PAD at Taichung Veterans General Hospital in Taiwan. We retrospectively reviewed the medical information of patients with DM who had undergone assessments of ABI with %MAP between August 01, 2016 and July 31, 2017. We collected anthropometric and biochemical data within 3 months of ABI assessment, as well as the first available data of fasting plasma glucose levels each year before the ABI assessment. Patients were excluded if they (1) did not have complete laboratory data within three months of ABI assessment, (2) had a history of lower-extremity surgery, (3) had end-stage renal disease, (4) had evidence of non-compressible vessels as indicated by ABI values > 1.40 in both lower limbs; and (5) fewer than three data points of annual fasting plasma glucose before ABI assessment. Data collection was performed by reviewing electronic medical records from January 01, 2007.
Biochemistry Assessments
Biochemical data measured in the central laboratory of our hospital were collected, including fasting plasma glucose, HbA1c, total cholesterol, triglycerides, and creatinine. Plasma glucose levels were measured using the oxidase-peroxidase method (Wako Diagnostics, Tokyo, Japan). HbA1c was measured using cation-exchange high-performance liquid chromatography (certified by the NGSP; G8, TOSOH, Tokyo, Japan). Total cholesterol, triglycerides, and creatinine levels were measured using commercial kits (Beckman Coulter, Fullerton, USA). The estimated glomerular filtration rate (eGFR) value was calculated as 186 × [serum creatinine (mg/dL)]−1.154 × [age (years)]−0.203 (× 0.742, if female) according to the Modification of Diet in Renal Disease equation, and an eGFR < 60 mL/min/1.73m2 was defined as CKD.31 The glucose variability was evaluated using the SD of the annual fasting glucose levels.
The Profile of PAD
ABI values were measured using a validated automatic device (VP-1000 Plus; Omron Healthcare Co. Ltd., Kyoto, Japan). The brachial-ankle pulse wave velocity (baPWV) values were calculated as the ratio of the brachial-ankle path to the brachial-ankle pulse transmission time. Only the lower ABI value and higher baPWV value between the lower limbs of the same patient were recorded for analyses. %MAP, which was determined based on the ankle pulse volume waveforms, indicates the height of the mean arterial wave area divided by the peak amplitude. The reproducibility of ABI, %MAP, and baPWV has been shown in a previous study.28 We collected only the data of the last ABI record in patients with repeated ABI assessments during the enrollment period. Abnormal ABI was defined as an ABI value ≤ 0.90 and abnormal %MAP was defined as a %MAP value ≥ 45%. Finally, high-risk PAD was defined as abnormal ABI, abnormal %MAP, or both.
Statistical Analysis
Continuous data are presented as the mean ± SD. Categorical data are presented as numbers (percentages). High fasting glucose was defined as a plasma glucose level ≥ 8 mmol/L which was the average plasma level of fasting glucose detected around the ABI assessment. Hypertension was defined as systolic blood pressure (SBP) ≥ 140 mmHg, diastolic blood pressure (DBP) ≥ 90 mmHg, history of hypertension, or current use of antihypertensive drugs. Statistical analyses were performed using the independent sample t-test to compare the differences in continuous variables between two groups. One-way analysis of variance was conducted to detect the differences in continuous variables among more than two groups. Chi-square tests were used to detect differences in categorical variables. Multivariate logistic regression analysis was carried out to evaluate factors associated with high-risk PAD. Statistical analyses were performed using SPSS 22.0 (IBM., Armonk, NY, USA).
Results
A total of 2861 patients were assessed, and 2577 patients who met the study criteria were enrolled; 2377 were assigned to ABI > 0.90 and 200 to ABI ≤ 0.90. We then divided the patients into four subgroups based on whether %MAP was ≥ 45% or not. Overall, we defined ABI > 0.90 and %MAP < 45% as the low-risk PAD group (n = 2117), and the remaining patients (n = 460) were categorized into the high-risk PAD group (Figure 1).
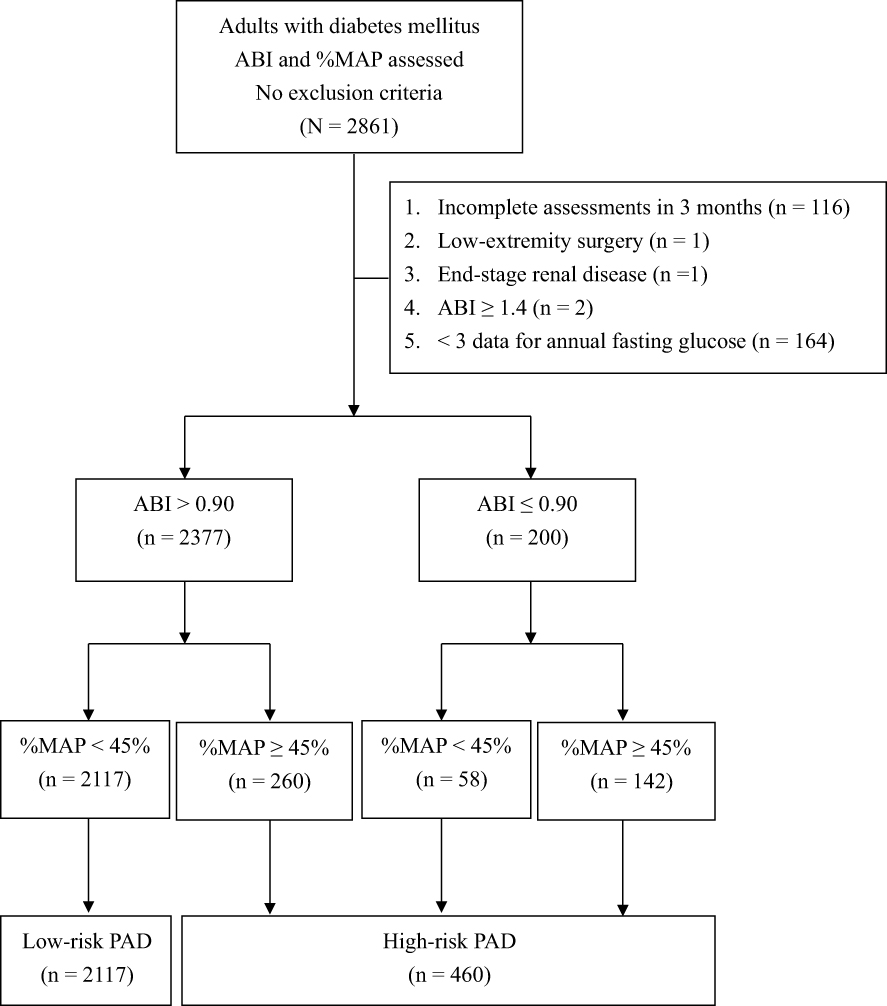 |
Figure 1 Flowchart for the enrollment and evaluation of study participants (%MAP: percentage of the mean arterial pressure; ABI: ankle-brachial index; PAD: peripheral artery disease). |
The demographic and clinical characteristics of the enrolled patients are shown in Table 1. The mean age of the enrolled patients was 66 ± 10 years, and 1364 (52.9%) were male. Patients with an ABI ≤ 0.90 were significantly older than those with an ABI > 0.90 (72 ± 12 vs 65 ± 10 years, P < 0.001). Patients with an ABI ≤ 0.90 had a higher proportion of coronary artery disease (CAD; 31.5% vs 9.0%, P < 0.001), a higher proportion of hypertension (98.5% vs 78.0%, P < 0.001), higher SBP (143 ± 24 vs 136 ± 19 mmHg, P < 0.001), lower DBP (74 ± 12 vs 77 ± 11 mmHg, P < 0.001), higher triglycerides (1.7 ± 1.1 vs 1.5 ± 1.2, P = 0.014), and lower eGFR (61 ± 31 vs 79 ± 27 mL/min/1.73m2, P < 0.001) than those with an ABI > 0.90. Moreover, a higher %MAP (47.1 ± 5.1 vs 40.5 ± 3.8%, P < 0.001) and baPWV (2015 ± 686 vs 1856 ± 437 cm/sec, P < 0.001) were also noted in patients with ABI ≤ 0.90, compared to those with ABI > 0.90.
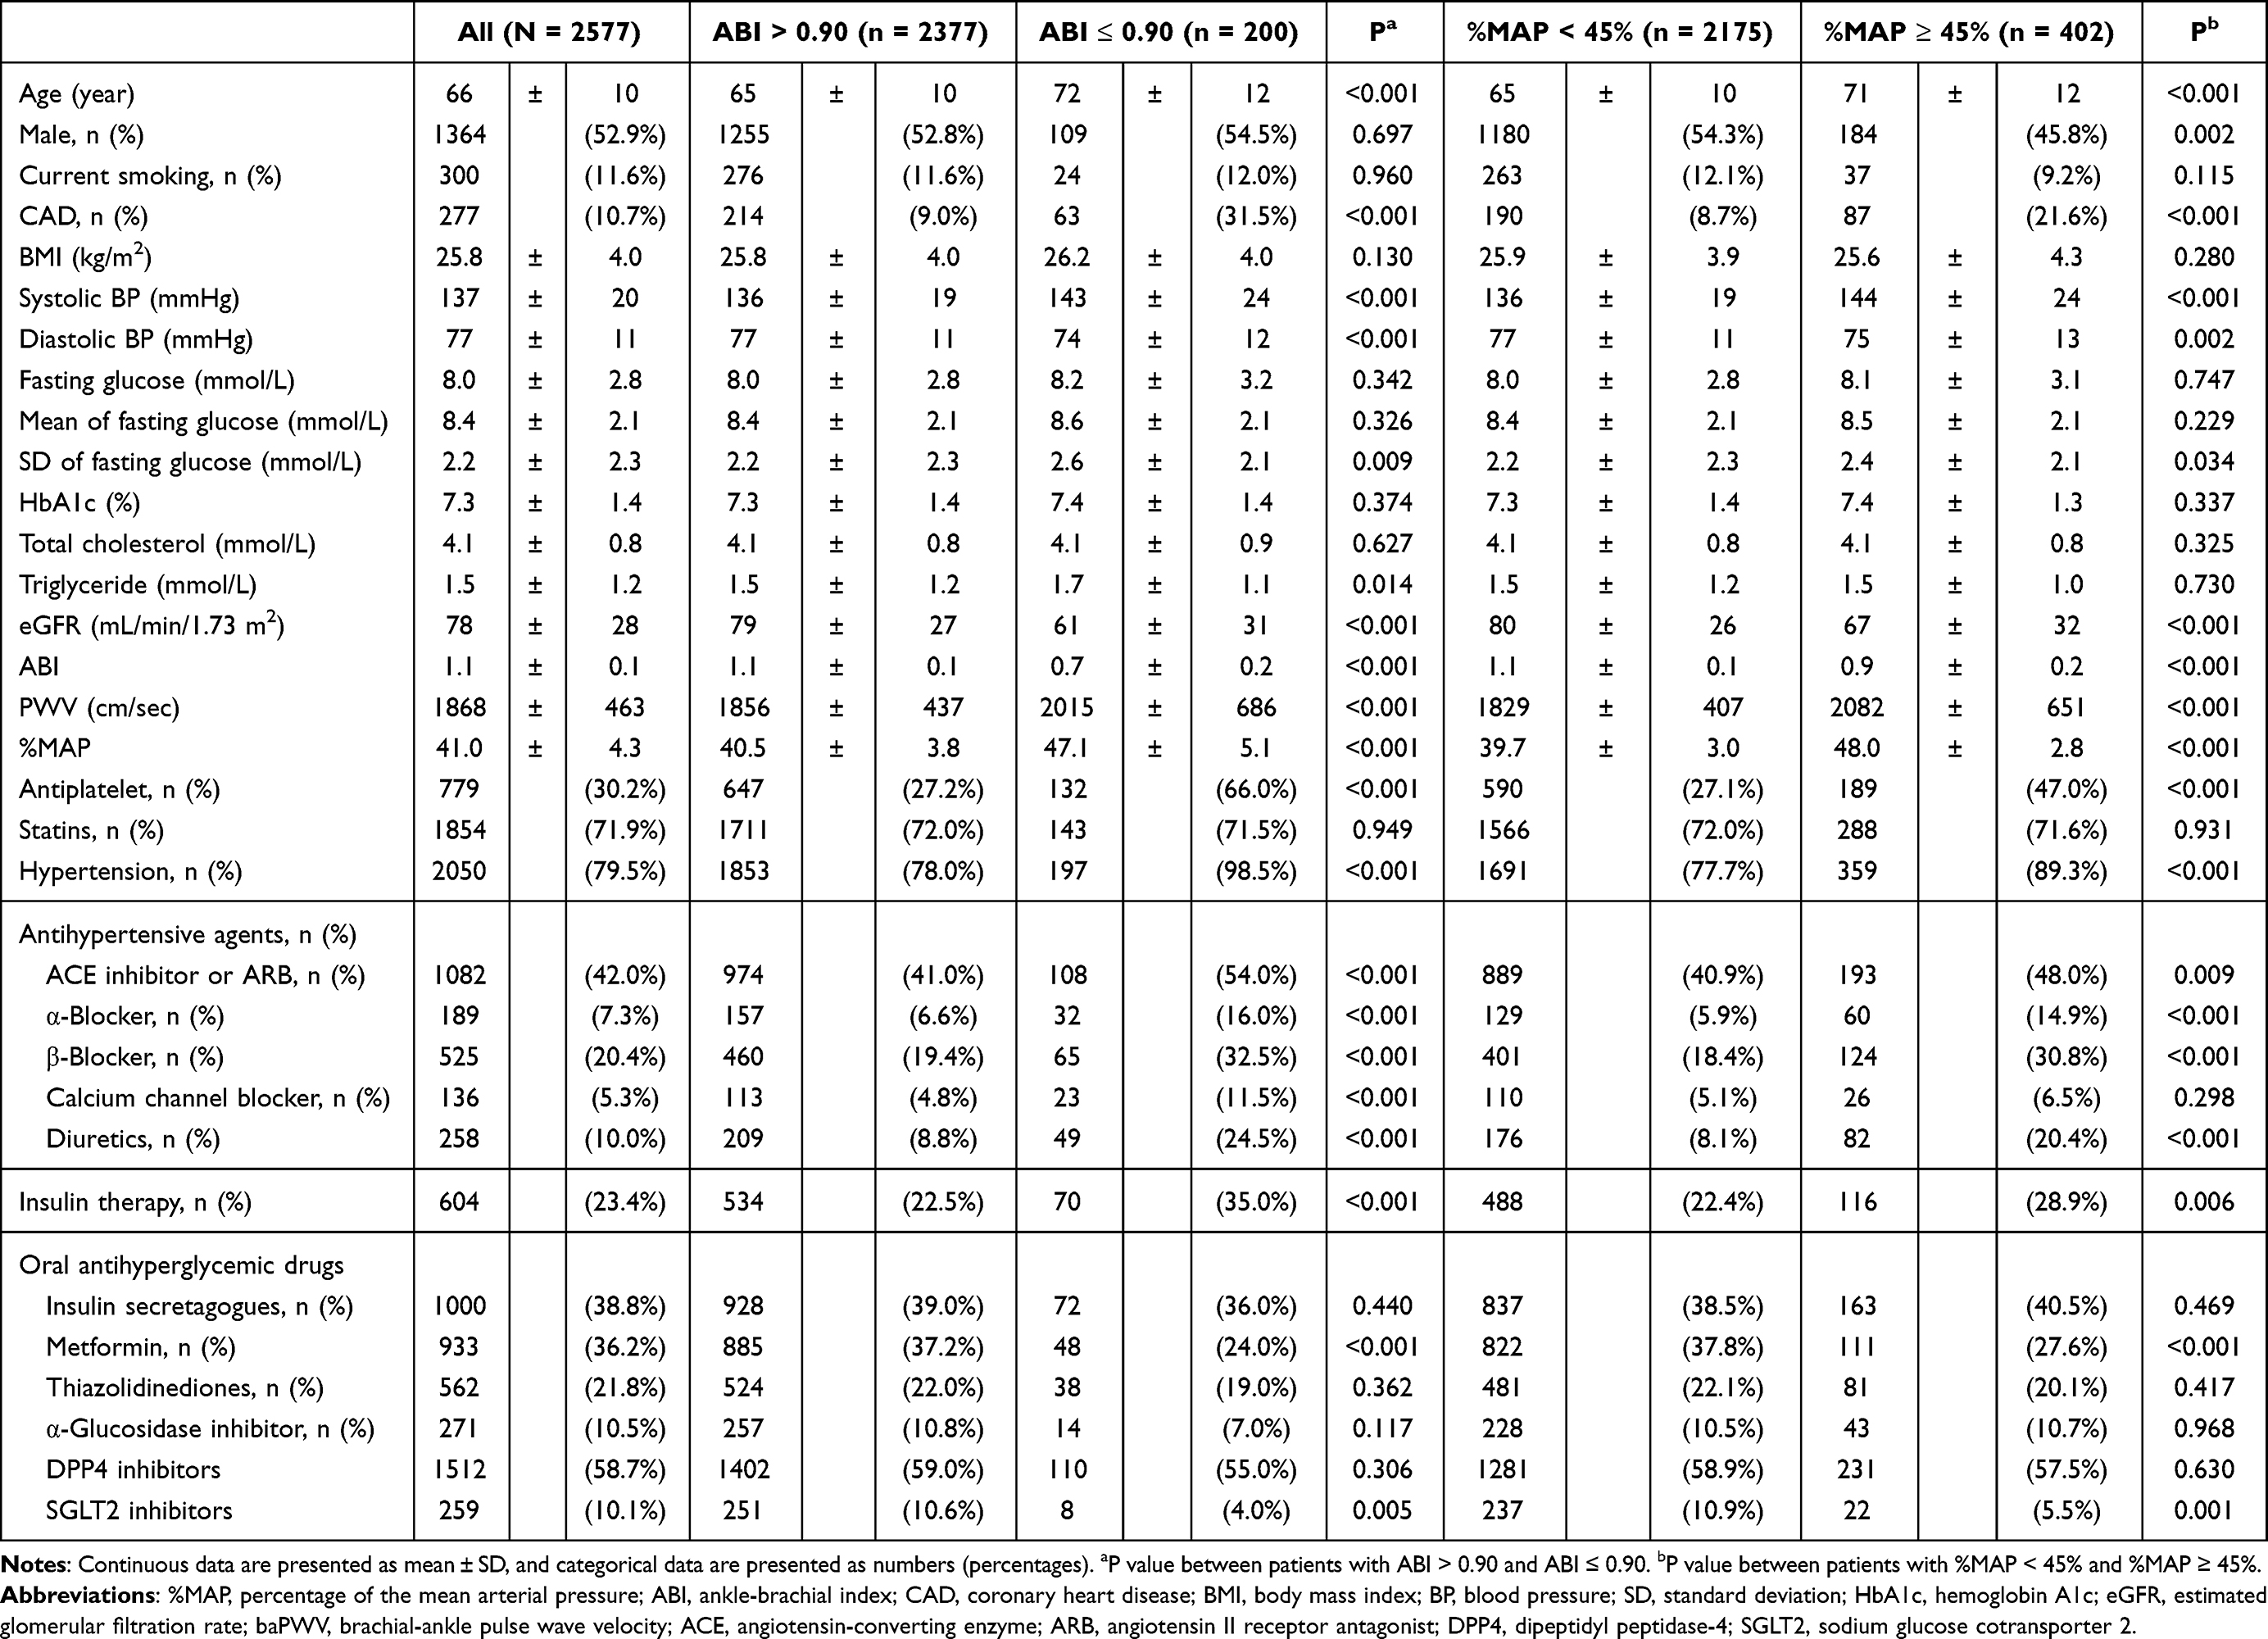 |
Table 1 Characteristics of Enrolled Patients Categorized Based on ABI Value or %MAP Value |
The characteristics of the patients with %MAP ≥ 45% and %MAP < 45% are also shown in Table 1. Patients with %MAP ≥ 45% were older (P < 0.001) and more likely to be female (P = 0.002). Higher SBP and lower DBP (P < 0.001 and P = 0.002, respectively), higher proportion of CAD (P < 0.001) and hypertension (P < 0.001), lower eGFR (P < 0.001), lower ABI (P < 0.001), and higher baPWV (P < 0.001) were observed in patients with %MAP ≥ 45% than in those with %MAP < 45%.
Notably, the SD of annual fasting glucose was significantly higher in patients with ABI ≤ 0.90 than in those with ABI > 0.90 (2.6 ± 2.1 vs 2.2 ± 2.3 mmol/L, P = 0.009). The SD of annual fasting glucose was significantly higher in patients with %MAP ≥ 45% than in those with %MAP < 45% (2.4 ± 2.1 vs 2.2 ± 2.3 mmol/L, P = 0.034). However, the mean level of annual fasting glucose showed no significant difference between patients with ABI ≤ 0.90 and ABI > 0.90 (8.6 ± 2.1 vs 8.4 ± 2.1 mmol/L, P = 0.326) or between patients with %MAP ≥ 45% and %MAP < 45% (8.5 ± 2.1 vs 8.4 ± 2.1 mmol/L, P = 0.229).
Several factors were associated with both ABI < 0.90 and %MAP ≥ 45%. Hence, we divided all patients into four groups: ABI > 0.90 with %MAP < 45%, ABI > 0.90 with %MAP ≥ 45%, ABI ≤ 0.90 with %MAP <45%, and ABI ≤ 0.90 with %MAP ≥ 45%. The characteristics of the patients in these four groups are shown in Table 2. The mean level of annual fasting glucose was not significantly different among these four groups (P for trend = 0.229, Figure 2). However, the SD of annual fasting glucose showed a significantly positive trend from the ABI > 0.90 with %MAP < 45% group to the ABI ≤ 0.90 with %MAP ≥ 45% group (P for trend = 0.005, Figure 2).
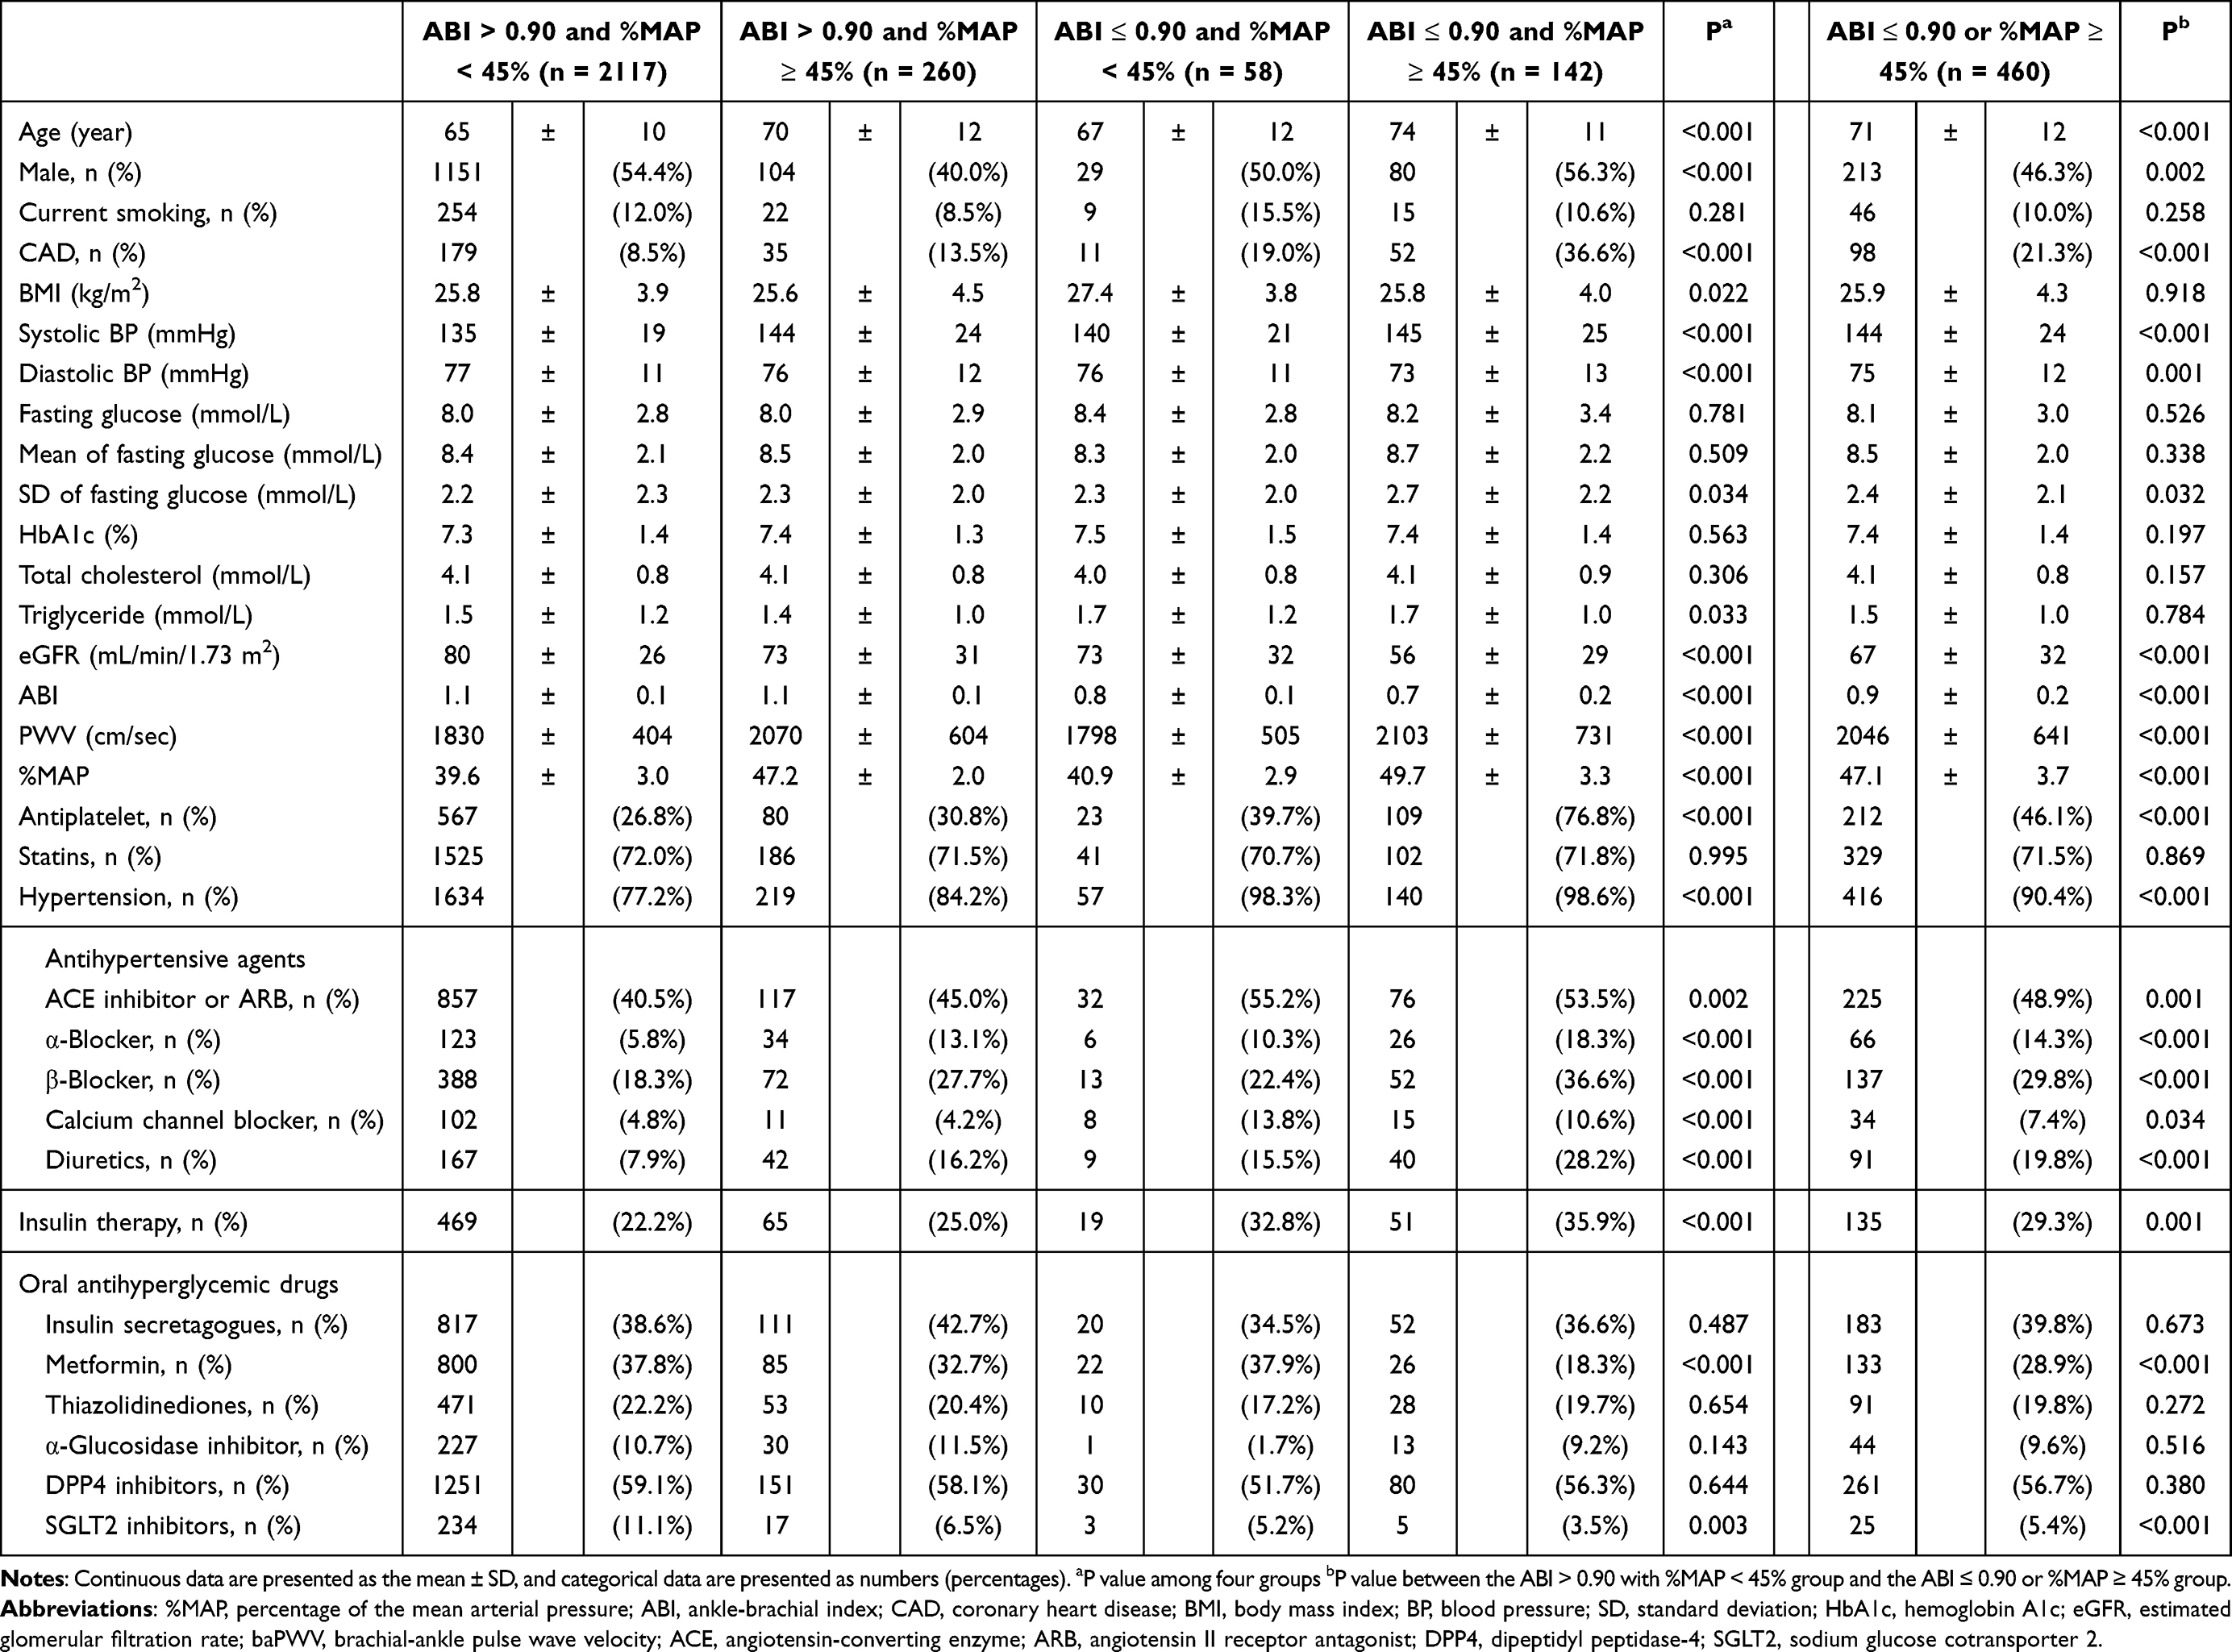 |
Table 2 Characteristics of the Enrolled Patients Categorized Based on a Combination of ABI and %MAP |
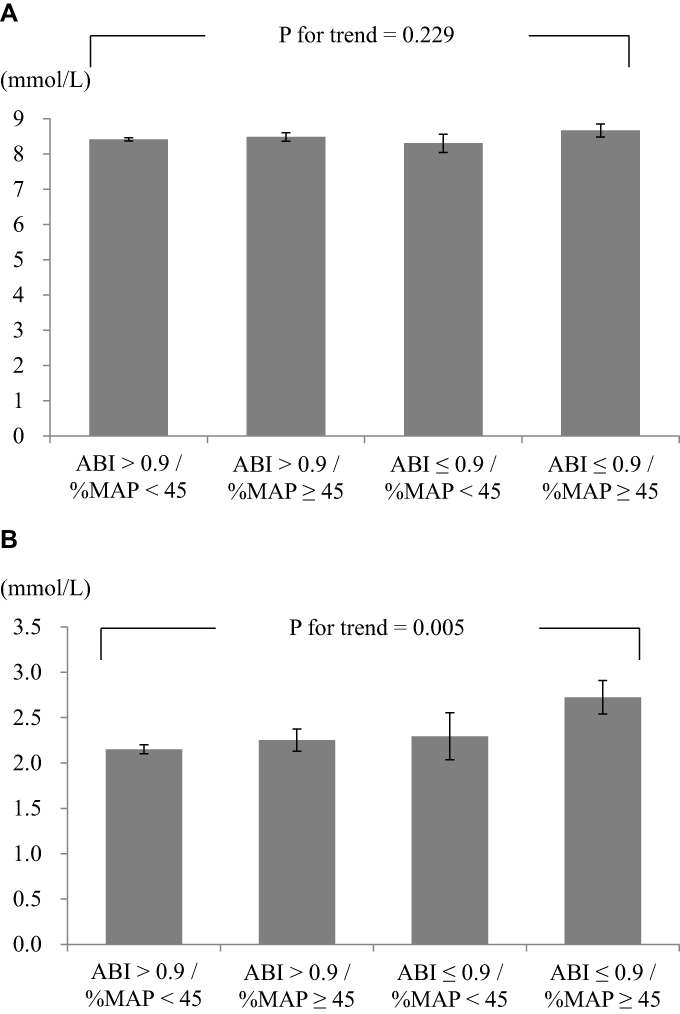 |
Figure 2 (A) Mean and (B) SD of fasting plasma glucose levels among the four groups. |
We defined the ABI > 0.90 with %MAP < 45% group as low-risk PAD and the other three groups, those were the ABI > 0.90 with %MAP ≥ 45%, ABI ≤ 0.90 with %MAP <45%, and ABI ≤ 0.90 with %MAP ≥ 45% groups, as high-risk PAD (Table 2). Patients with high-risk PAD had a higher SD of annual fasting glucose than those with low-risk PAD. Patients with high-risk PAD were older (71 ± 12 vs 65 ± 10 years, P < 0.001), lower proportion of male gender (46.3% vs 54.4%, P = 0.002), higher proportion of CAD (21.3% vs 8.5%, P < 0.001), lower eGFR (67 ± 32 vs 80 ± 26 mL/min/1.73m2, P < 0.001), higher proportions of current using antiplatelet agents (46.1% vs 26.8%, P < 0.001) and insulin (29.3% vs 22.2%, P = 0.001), and lower proportions of current using metformin (28.9% vs 37.8%, P < 0.001) and sodium glucose cotransporter 2 (SGLT2) inhibitors (5.4% vs 11.1%, P < 0.001) than those with low-risk PAD. Patient with high-risk PAD also had higher proportion of hypertension than those with low-risk PAD (90.4% vs 77.2%, P < 0.001).
Since a cutoff value for the SD of annual fasting glucose is not available in clinical practice, we conducted the analyses of receiver operating characteristic curve to differentiate high-risk PAD based on the SD of annual fasting glucose. Using a cut off of 1.274 mmol/L provided a relatively high sensitivity (70.0%) and specificity (41.3%) for differentiating high-risk PAD. An SD of annual fasting glucose ≥ 1.274 mmol/L provided an increased risk with odds ratio (OR) of 1.424 (95% CI = 1.118‒1.814, P = 0.004) for high-risk PAD compared with an SD of annual fasting glucose < 1.274 mmol/L after adjustment for the associated risk factors, selected from Table 2, including age, gender, CAD history, hypertension, fasting glucose level, eGFR, and current use of antiplatelet agents, insulin, metformin, or SGLT2 inhibitors (Table 3).
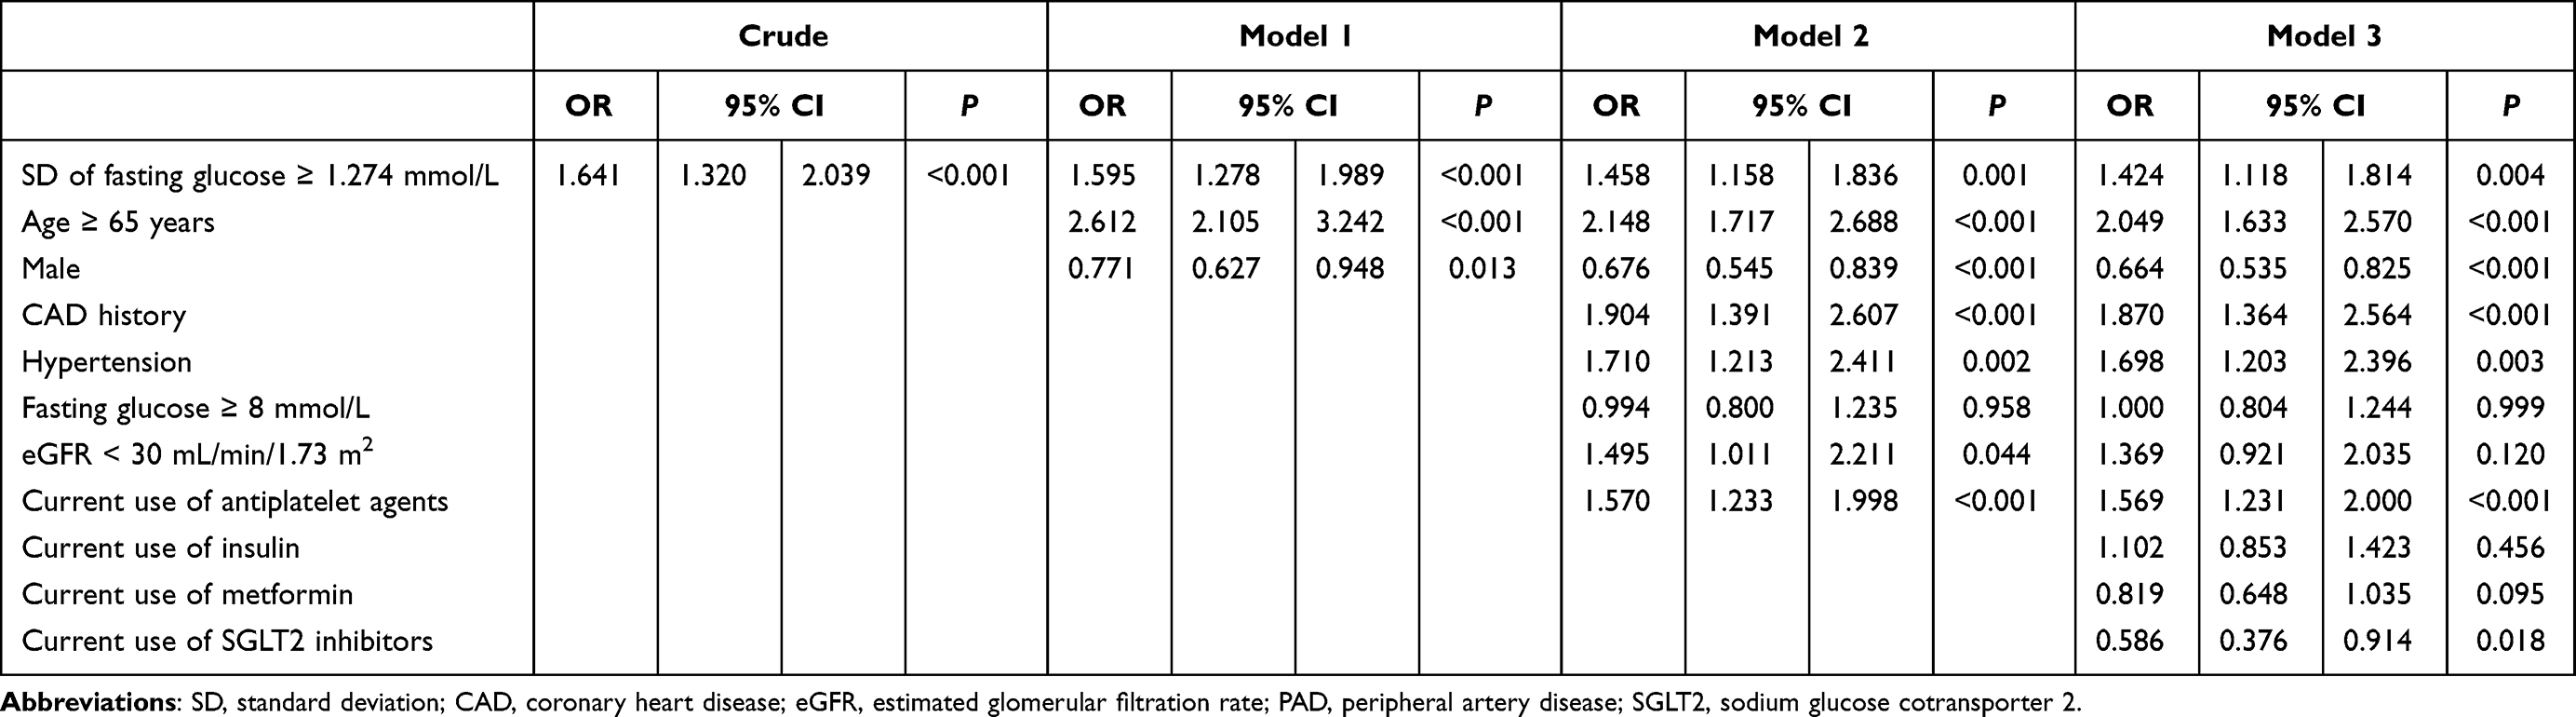 |
Table 3 Logistic Regression Analysis Showing the Factors Associated with High-Risk PAD |
Discussion
The main results of this study were that the SD of annual fasting glucose was significantly associated with a low ABI and a high %MAP in patients with DM. However, the mean annual fasting glucose level was not significantly associated with ABI or %MAP. Glycemic variability plays an important role in vasculopathy, and higher HbA1c variability has been linked to higher risks of microvascular complications, cardiovascular disease, and mortality.32,33 The SD of annual HbA1c has also been reported to be correlated with high-risk PAD in patients with DM.28 HbA1c is clinically used as a glycemic marker to diagnose DM and monitor glucose control in DM.34 The HbA1c level reflects a longer glycemic duration than the fasting glucose level, and several underlying conditions can influence the HbA1c level independent of glucose.35 Therefore, HbA1c variability may result from unstable underlying diseases associated with chronic complications.29,36–39 We used the SD of annual fasting glucose to reflect glucose variability, which has a stronger association with ABI and %MAP than the mean of annual fasting glucose level in the present study.
In accordance with our study, a higher variability in fasting glucose has been reported to be associated with an increased prevalence of lower-extremity PAD in people without DM.40 Several mechanisms might be involved in glucose variability linked to cardiovascular disease such as the activation of inflammatory pathways, increase in oxidative stress, and non-enzymatic glycation.41 Glucose swings might provoke a more specific triggering impact than chronic sustained hyperglycemia on oxidative stress, which could contribute to cardiovascular events.42–44
Yang et al45 reported variability of fasting glucose, estimated by the coefficient of variation, to be significantly associated with PAD which was defined using clinical diagnostic coding instead of ABI in a retrospective cohort study. However, use of administrative data has been reported to be not sensitive for PAD detection.46 Interestingly, we noted that a synergistic effect of low ABI and high %MAP on the association with the SD of annual fasting glucose. Emanuelsson et al47 reported that a higher 1 mmol/L of glucose level was associated with an increased risk ratio of 1.19 for PAD. Mongraw-Chaffin et al20 also reported that mean fasting glucose is a better indicator of cardiovascular disease than the one-off measurement of the fasting glucose and variability in the fasting glucose. However, our study showed that the mean of annual fasting glucose levels was not significantly different between patients with high- and low-risk PAD.
A recent trial on cardiovascular outcome revealed that canagliflozin might be associated with an increased risk of amputation.48 Overall, however, SGLT2 inhibitors do not increase the PAD risk according to meta-analyses.49,50 Notably, current use of SGLT2 inhibitors provided a significantly low risk (OR = 0.586) for high-risk PAD in the present study. SGLT2 inhibitors are considered to have cardiorenal benefits.51 The mechanisms for the cardioprotective benefits of SGLT2 inhibitors include improvement in myocardial metabolism, alteration in adipokines, and reduction in preload and afterload.52
The present study had several limitations. First, we collected only the annual fasting plasma glucose data rather than all available data on glucose. The advantages of using only the annual fasting glucose data were the interval of the data being similar and avoidance of bias resulting from frequent measurements. Second, our findings cannot be applied to patients with ABI > 1.4 since they were excluded because the role of %MAP remains unclear in the high-ABI population. Third, although several risk factors associated with PAD were assessed in the multivariate regression model, some other risk factors were not analyzed in this study.53 In particular, previous studies have indicated that high variability in body mass index, blood pressure, and cholesterol level are predictors of cardiovascular disease.54–60 Fourth, because only a few patients used glucagon like peptide-1 receptor (GLP-1R) agonists, we did not include those data. It has been reported that treatment with GLP-1R agonists might have protective effects against cardiovascular disease.61,62 Finally, we did not collect hypoglycemia data, which is a factor linking high glucose variability and cardiovascular disease.63–65
Conclusions
A high SD of annual fasting glucose is an independent risk factor for high-risk PAD, defined as ABI ≤ 0.90, %MAP ≥ 45%, or both. Our results suggest that a stable fasting plasma glucose level is important for the clinical treatment in patients with DM.
Ethical Approval and Informed Consent
The study complied with the Declaration of Helsinki. The Institutional Review Board of Taichung Veterans General Hospital approved the protocol (ethical approval code: CE17234A) and waived the need for informed consent due to retrospective collection of data. Anonymous medical record data were obtained from the Clinical Informatics Research & Development Center of Taichung Veterans General Hospital after delinking the identification code.
Acknowledgments
This research was funded by the Taichung Veterans General Hospital, Taiwan (grant numbers TCVGH-1103501D and TCVGH-1103502D) and the National Health Research Institute (grant number NHRI-EX110-10927HT). The funders had no role in the decision to publish the results. Statistical analysis was performed by the Biostatistics Task Force of Taichung Veterans General Hospital.
Disclosure
The authors report no conflicts of interest in this work.
References
1. Tsigkou V, Siasos G, Rovos K, et al. Peripheral artery disease and antiplatelet treatment. Curr Opin Pharmacol. 2018;39:43–52. doi:10.1016/j.coph.2018.01.011
2. Hiatt WR, Goldstone J, Smith SC
3. Morley RL, Sharma A, Horsch AD, et al. Peripheral artery disease. BMJ (Clinical Research Ed). 2018;360:j5842. doi:10.1136/bmj.j5842
4. Fowkes FG, Rudan D, Rudan I, et al. Comparison of global estimates of prevalence and risk factors for peripheral artery disease in 2000 and 2010: a systematic review and analysis. Lancet (London, England). 2013;382:1329–1340. doi:10.1016/s0140-6736(13)61249-0
5. Bauersachs R, Zeymer U, Brière JB, et al. Burden of coronary artery disease and peripheral artery disease: a literature review. Cardiovasc Ther. 2019;2019:8295054. doi:10.1155/2019/8295054
6. Gerhard-Herman MD, Gornik HL, Barrett C, et al. AHA/ACC Guideline on the management of patients with lower extremity peripheral artery disease: a report of the American College of Cardiology/American Heart Association Task Force on Clinical Practice Guidelines. Circulation. 2016;2017(135):e726–e779. doi:10.1161/cir.0000000000000471
7. Song P, Rudan D, Zhu Y, et al. Global, regional, and national prevalence and risk factors for peripheral artery disease in 2015: an updated systematic review and analysis. Lancet Glob Health. 2019;7:e1020–e1030. doi:10.1016/S2214-109X(19)30255-4
8. Matsushita K, Sang Y, Ning H, et al. Lifetime risk of lower-extremity peripheral artery disease defined by ankle-brachial index in the United States. J Am Heart Assoc. 2019;8:e012177. doi:10.1161/JAHA.119.012177
9. Virani SS, Alonso A, Aparicio HJ, et al. Heart disease and stroke statistics-2021 update: a report from the American Heart Association. Circulation. 2021;143:e254–e743. doi:10.1161/CIR.0000000000000950
10. Papatheodorou K, Banach M, Bekiari E, et al. Complications of diabetes 2017. J Diabetes Res. 2018;2018:3086167. doi:10.1155/2018/3086167
11. Firnhaber JM, Powell CS. Lower extremity peripheral artery disease: diagnosis and treatment. Am Fam Physician. 2019;99:362–369.
12. Saeedi P, Petersohn I, Salpea P, et al. Global and regional diabetes prevalence estimates for 2019 and projections for 2030 and 2045: results from the International Diabetes Federation Diabetes Atlas, 9th edition. Diabetes Res Clin Pract. 2019;157:107843. doi:10.1016/j.diabres.2019.107843
13. Williams R, Karuranga S, Malanda B, et al. Global and regional estimates and projections of diabetes-related health expenditure: results from the International Diabetes Federation Diabetes Atlas, 9th edition. Diabetes Res Clin Pract. 2020;162:108072. doi:10.1016/j.diabres.2020.108072
14. Ding N, Kwak L, Ballew SH, et al. Traditional and nontraditional glycemic markers and risk of peripheral artery disease: the Atherosclerosis Risk in Communities (ARIC) study. Atherosclerosis. 2018;274:86–93. doi:10.1016/j.atherosclerosis.2018.04.042
15. Su WY, Chen SC, Huang YT, et al. Comparison of the effects of fasting glucose, hemoglobin A(1c), and triglyceride-glucose index on cardiovascular events in type 2 diabetes mellitus. Nutrients. 2019;11:2838. doi:10.3390/nu11112838
16. Birudaraju D, Cherukuri L, Kinninger A, et al. Prevalence of normal coronary arteries by coronary computed tomography angiography (CCTA) in patients with type 2 diabetes mellitus from Semaglutide Treatment on Coronary Plaque Progression (STOP) trial. J Diabetes Comp. 2021;35:107840. doi:10.1016/j.jdiacomp.2020.107840
17. Alatawi Z, Mirghani H. The association between glycemic variability and myocardial infarction: a review and meta-analysis of prospective studies and randomized trials. Cureus. 2020;12:e11556. doi:10.7759/cureus.11556
18. Kim JA, Lee JS, Chung HS, et al. Impact of visit-to-visit fasting plasma glucose variability on the development of type 2 diabetes: a nationwide population-based cohort study. Diabetes Care. 2018;41:2610–2616. doi:10.2337/dc18-0802
19. Gorst C, Kwok CS, Aslam S, et al. Long-term glycemic variability and risk of adverse outcomes: a systematic review and meta-analysis. Diabetes Care. 2015;38:2354–2369. doi:10.2337/dc15-1188
20. Mongraw-Chaffin M, Bertoni AG, Golden SH, et al. Association of low fasting glucose and HBA1c with cardiovascular disease and mortality: the MESA Study. J Endocr Soc. 2019;3:892–901. doi:10.1210/js.2019-00033
21. Winsor T. Influence of arterial disease on the systolic blood pressure gradients of the extremity. Am J Med Sci. 1950;220:117–126. doi:10.1097/00000441-195008000-00001
22. Everhart JE, Pettitt DJ, Knowler WC, et al. Medial arterial calcification and its association with mortality and complications of diabetes. Diabetologia. 1988;31:16–23. doi:10.1007/bf00279127
23. Chue CD, Townend JN, Steeds RP, et al. Arterial stiffness in chronic kidney disease: causes and consequences. Heart (British Cardiac Society). 2010;96:817–823. doi:10.1136/hrt.2009.184879
24. Hyun S, Forbang NI, Allison MA, et al. Ankle-brachial index, toe-brachial index, and cardiovascular mortality in persons with and without diabetes mellitus. J Vasc Surg. 2014;60:390–395. doi:10.1016/j.jvs.2014.02.008
25. Lin HW, Lee IT. Combination of the ankle-brachial index and percentage of mean arterial pressure to improve diagnostic sensitivity for peripheral artery disease: an observational study. Medicine. 2018;97:e12644. doi:10.1097/md.0000000000012644
26. Shirasu T, Hoshina K, Akagi D, et al. Pulse volume recordings to identify falsely elevated ankle brachial index. Asian Cardiovasc Thorac Ann. 2016;24:517–522. doi:10.1177/0218492316651527
27. Li YH, Lin SY, Sheu WH, et al. Relationship between percentage of mean arterial pressure at the ankle and mortality in participants with normal ankle-brachial index: an observational study. BMJ Open. 2016;6:e010540. doi:10.1136/bmjopen-2015-010540
28. Lee IT. Mean and variability of annual haemoglobin A1c are associated with high-risk peripheral artery disease. Diab Vasc Dis Res. 2020;17:1479164120909030. doi:10.1177/1479164120909030
29. Shepard JG, Airee A, Dake AW, et al. Limitations of A1c Interpretation. South Med J. 2015;108:724–729. doi:10.14423/SMJ.0000000000000381
30. Li YH, Sheu WH, Lee IT. Use of the ankle-brachial index combined with the percentage of mean arterial pressure at the ankle to improve prediction of all-cause mortality in type 2 diabetes mellitus: an observational study. Cardiovasc Diabetol. 2020;19:173. doi:10.1186/s12933-020-01149-7
31. Inker LA, Astor BC, Fox CH, et al. KDOQI US commentary on the 2012 KDIGO clinical practice guideline for the evaluation and management of CKD. Am J Kidney Dis. 2014;63:713–735. doi:10.1053/j.ajkd.2014.01.416
32. Li S, Nemeth I, Donnelly L, et al. Visit-to-Visit HbA(1c) variability is associated with cardiovascular disease and microvascular complications in patients with newly diagnosed type 2 diabetes. Diabetes Care. 2020;43:426–432. doi:10.2337/dc19-0823
33. Jang JY, Moon S, Cho S, et al. Visit-to-visit HbA1c and glucose variability and the risks of macrovascular and microvascular events in the general population. Sci Rep. 2019;9:1374. doi:10.1038/s41598-018-37834-7
34. American Diabetes Association 2. Classification and diagnosis of diabetes: standards of medical care in diabetes-2021. Diabetes Care. 2021;44:S15–S33. doi:10.2337/dc21-S002
35. Rathmann W, Bongaerts B, Kostev K. Association of characteristics of people with type 2 diabetes mellitus with discordant values of fasting glucose and HbA1c. J Diabetes. 2018;10:934–941. doi:10.1111/1753-0407.12823
36. International Expert Committee. International Expert Committee report on the role of the A1C assay in the diagnosis of diabetes. Diabetes Care. 2009;32:1327–1334. doi:10.2337/dc09-9033
37. Kutter D, Thoma J. Hereditary spherocytosis and other hemolytic anomalies distort diabetic control by glycated hemoglobin. Clin Lab. 2006;52:477–481.
38. Gujral UP, Prabhakaran D, Pradeepa R, et al. Isolated HbA1c identifies a different subgroup of individuals with type 2 diabetes compared to fasting or post-challenge glucose in Asian Indians: the CARRS and MASALA studies. Diabetes Res Clin Pract. 2019;153:93–102. doi:10.1016/j.diabres.2019.05.026
39. Radin MS. Pitfalls in hemoglobin A1c measurement: when results may be misleading. J Gen Intern Med. 2014;29:388–394. doi:10.1007/s11606-013-2595-x
40. Sun XT, Zeng C, Zhang SZ, et al. Long-term tracking of fasting blood glucose variability and peripheral artery disease in people without diabetes. BMJ Open Diabetes Res Care. 2020;8:e000896. doi:10.1136/bmjdrc-2019-000896
41. Klimontov VV. [Impact of glycemic variability on cardiovascular risk in diabetes]. Kardiologiia. 2018;10:80–87. Esperanto.
42. Monnier L, Mas E, Ginet C, et al. Activation of oxidative stress by acute glucose fluctuations compared with sustained chronic hyperglycemia in patients with type 2 diabetes. JAMA. 2006;295:1681–1687. doi:10.1001/jama.295.14.1681
43. Kattoor AJ, Pothineni NVK, Palagiri D, et al. Oxidative stress in atherosclerosis. Curr Atheroscl Rep. 2017;19:42. doi:10.1007/s11883-017-0678-6
44. Senoner T, Dichtl W. Oxidative stress in cardiovascular diseases: still a therapeutic target? Nutrients. 2019;11:2090. doi:10.3390/nu11092090
45. Yang CP, Lin CC, Li CI, et al. Fasting plasma glucose variability and HbA1c are associated with peripheral artery disease risk in type 2 diabetes. Cardiovasc Diabetol. 2020;19:4. doi:10.1186/s12933-019-0978-y
46. Hong Y, Sebastianski M, Makowsky M, et al. Administrative data are not sensitive for the detection of peripheral artery disease in the community. Vasc Med (London, England). 2016;21:331–336. doi:10.1177/1358863x16631041
47. Emanuelsson F, Marott S, Tybjærg-Hansen A, et al. Impact of glucose level on micro- and macrovascular disease in the general population: a Mendelian randomization study. Diabetes Care. 2020;43:894–902. doi:10.2337/dc19-1850
48. Neal B, Perkovic V, Mahaffey KW, et al. Canagliflozin and cardiovascular and renal events in type 2 diabetes. N Engl J Med. 2017;377:644–657. doi:10.1056/NEJMoa1611925
49. Dicembrini I, Tomberli B, Nreu B, et al. Peripheral artery disease and amputations with sodium-glucose co-transporter-2 (SGLT-2) inhibitors: a meta-analysis of randomized controlled trials. Diabetes Res Clin Pract. 2019;153:138–144. doi:10.1016/j.diabres.2019.05.028
50. Huang CY, Lee JK. Sodium-glucose co-transporter-2 inhibitors and major adverse limb events: a trial-level meta-analysis including 51 713 individuals. Diabetes Obes Metab. 2020;22:2348–2355. doi:10.1111/dom.14159
51. Zelniker TA, Wiviott SD, Raz I, et al. SGLT2 inhibitors for primary and secondary prevention of cardiovascular and renal outcomes in type 2 diabetes: a systematic review and meta-analysis of cardiovascular outcome trials. Lancet. 2019;393:31–39. doi:10.1016/S0140-6736(18)32590-X
52. Verma S, McMurray JJV. SGLT2 inhibitors and mechanisms of cardiovascular benefit: a state-of-the-art review. Diabetologia. 2018;61:2108–2117. doi:10.1007/s00125-018-4670-7
53. Weragoda J, Seneviratne R, Weerasinghe MC, Wijeyaratne SM. Risk factors of peripheral arterial disease: a case control study in Sri Lanka. BMC Res Notes. 2016;9:508. doi:10.1186/s13104-016-2314-x
54. Lee EY, Yang Y, Kim HS, et al. Effect of visit-to-visit LDL-, HDL-, and non-HDL-cholesterol variability on mortality and cardiovascular outcomes after percutaneous coronary intervention. Atherosclerosis. 2018;279:1–9. doi:10.1016/j.atherosclerosis.2018.10.012
55. Boey E, Gay GM, Poh KK, et al. Visit-to-visit variability in LDL- and HDL-cholesterol is associated with adverse events after ST-segment elevation myocardial infarction: a 5-year follow-up study. Atherosclerosis. 2016;244:86–92. doi:10.1016/j.atherosclerosis.2015.10.110
56. Bangalore S, Fayyad R, Laskey R, et al. Body-weight fluctuations and outcomes in coronary disease. New Engl J Med. 2017;376:1332–1340. doi:10.1056/NEJMoa1606148
57. Bangalore S, Fayyad R, DeMicco DA, et al. Body weight variability and cardiovascular outcomes in patients with type 2 diabetes mellitus. Circ Cardiovasc Qual Outcomes. 2018;11:e004724. doi:10.1161/circoutcomes.118.004724
58. Wang J, Shi X, Ma C, et al. Visit-to-visit blood pressure variability is a risk factor for all-cause mortality and cardiovascular disease: a systematic review and meta-analysis. J Hypertens. 2017;35:10–17. doi:10.1097/hjh.0000000000001159
59. Kim MK, Han K, Park YM, et al. Associations of variability in blood pressure, glucose and cholesterol concentrations, and body mass index with mortality and cardiovascular outcomes in the general population. Circulation. 2018;138:2627–2637. doi:10.1161/circulationaha.118.034978
60. Ceriello A, Prattichizzo F. Variability of risk factors and diabetes complications. Cardiovasc Diabetol. 2021;20:101. doi:10.1186/s12933-021-01289-4
61. Marso SP, Bain SC, Consoli A, et al. Semaglutide and cardiovascular outcomes in patients with type 2 diabetes. N Engl J Med. 2016;375:1834–1844. doi:10.1056/NEJMoa1607141
62. Hamal S, Cherukuri L, Shaikh K, et al. Effect of semaglutide on coronary atherosclerosis progression in patients with type II diabetes: rationale and design of the semaglutide treatment on coronary progression trial. Coron Artery Dis. 2020;31:306–314. doi:10.1097/MCA.0000000000000830
63. Lee AK, Warren B, Lee CJ, et al. The association of severe hypoglycemia with incident cardiovascular events and mortality in adults with type 2 diabetes. Diabetes Care. 2018;41:104–111. doi:10.2337/dc17-1669
64. Davis IC, Ahmadizadeh I, Randell J, et al. Understanding the impact of hypoglycemia on the cardiovascular system. Exp Rev Endocrinol Metab. 2017;12:21–33. doi:10.1080/17446651.2017.1275960
65. Bagshaw SM, Bellomo R, Jacka MJ, et al. The impact of early hypoglycemia and blood glucose variability on outcome in critical illness. Crit Care. 2009;13:R91. doi:10.1186/cc7921
 © 2021 The Author(s). This work is published and licensed by Dove Medical Press Limited. The full terms of this license are available at https://www.dovepress.com/terms.php and incorporate the Creative Commons Attribution - Non Commercial (unported, v3.0) License.
By accessing the work you hereby accept the Terms. Non-commercial uses of the work are permitted without any further permission from Dove Medical Press Limited, provided the work is properly attributed. For permission for commercial use of this work, please see paragraphs 4.2 and 5 of our Terms.
© 2021 The Author(s). This work is published and licensed by Dove Medical Press Limited. The full terms of this license are available at https://www.dovepress.com/terms.php and incorporate the Creative Commons Attribution - Non Commercial (unported, v3.0) License.
By accessing the work you hereby accept the Terms. Non-commercial uses of the work are permitted without any further permission from Dove Medical Press Limited, provided the work is properly attributed. For permission for commercial use of this work, please see paragraphs 4.2 and 5 of our Terms.