")
Back to Journals » Journal of Inflammation Research » Volume 15
Vanin 1 Gene Role in Modulation of iNOS/MCP-1/TGF-β1 Signaling Pathway in Obese Diabetic Patients
Authors Mosaad YO , Hussein MA , Ateyya H , Mohamed AH, Ali AA, Ramadan Youssuf A, Wink M , El-Kholy AA
Received 23 August 2022
Accepted for publication 23 November 2022
Published 14 December 2022 Volume 2022:15 Pages 6745—6759
DOI https://doi.org/10.2147/JIR.S386506
Checked for plagiarism Yes
Review by Single anonymous peer review
Peer reviewer comments 2
Editor who approved publication: Professor Ning Quan
Yasser O Mosaad,1 Mohammed Abdalla Hussein,2 Hayam Ateyya,3,4 Ahmed H Mohamed,5 Ali A Ali,6 Alaa Ramadan Youssuf,7 Michael Wink,8 Amal A El-Kholy9
1Department of Pharmacy, Practice & Clinical Pharmacy, Faculty of Pharmacy, Future University, Cairo, Egypt; 2Department of Biotechnology, Faculty of Applied Health Science, October 6th University, October 6th City, Egypt; 3Department of Medical Pharmacology, Faculty of Medicine, Cairo University, Cairo, Egypt; 4Department of Pharmacy Practice and Clinical Pharmacy, Faculty of Pharmacy, Future University, Cairo, Egypt; 5Department of Radiology and Medical Imaging, Faculty of Applied Health Science Technology, October 6th University, October 6th City, Egypt; 6Food Sciences Department, Faculty of Agriculture, Ain Shams University, Cairo, Egypt; 7Consultant and Head of Cardiology Department, AL-AHRAR Teaching Hospital, Zagazig University, Zagazig, Egypt; 8Heidelberg University, Institute of Pharmacy and Molecular Biotechnology, Heidelberg, Germany; 9Department of Clinical Pharmacy, Faculty of Pharmacy, Ain-Shams University, Cairo, Egypt
Correspondence: Mohammed Abdalla Hussein, Faculty of Applied Health Sciences Technology, October 6th University, October 6th City, Egypt, Tel +20 1224832580, Email [email protected]
Introduction: Cysteamine, a powerful endogenous antioxidant, is produced mostly by the vanin-1 with pantetheinase activity. With regard to glycemic, inflammatory, and redox factors, the current study sought to evaluate the association between the expression of the vanin-1 gene, oxidative stress, and inflammatory and iNOS signaling pathway in obese diabetic patients.
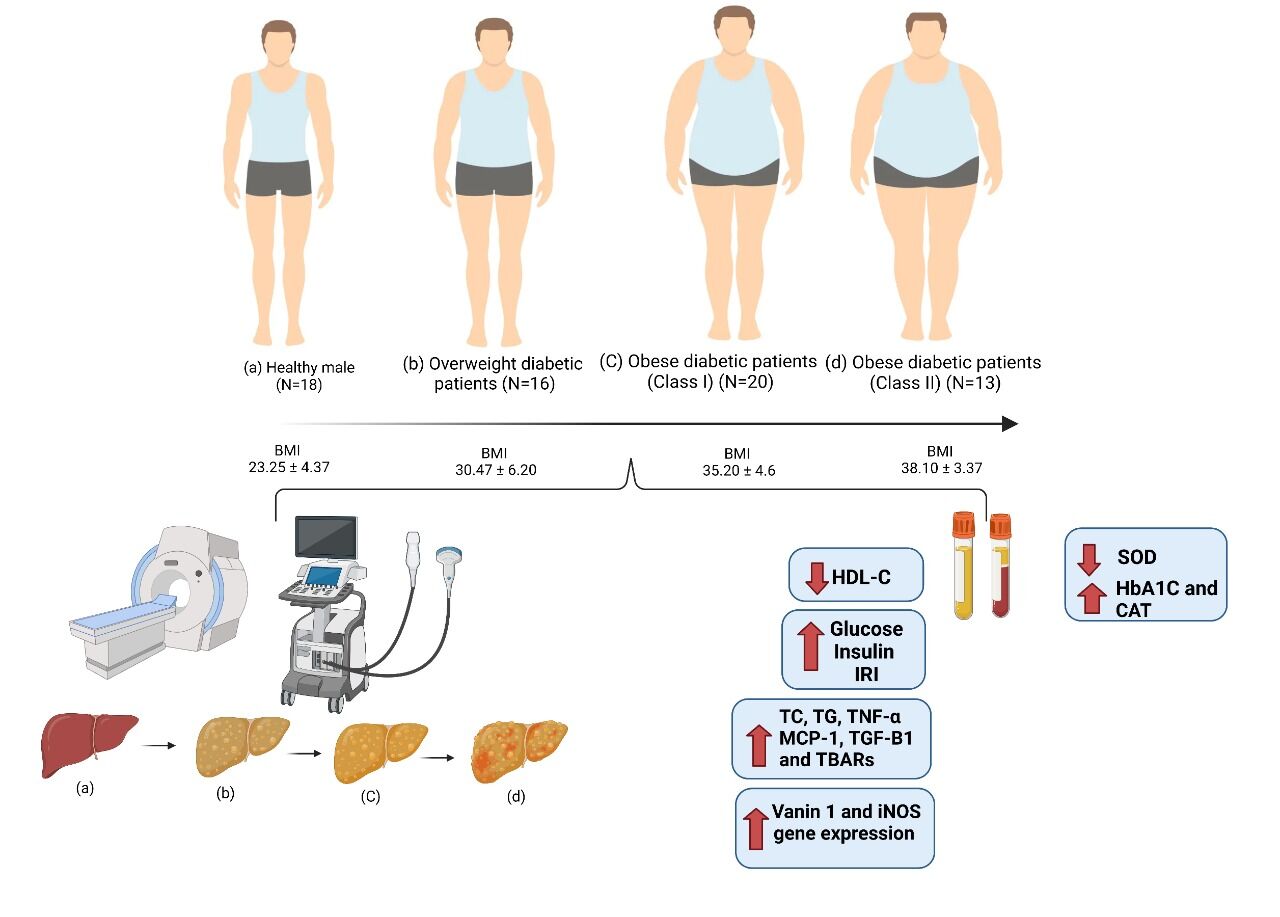
Methods: We enrolled 67 male subjects with an average age of 53.5 ± 5.0 years, divided into 4 groups according to the WHO guideline. We determined their plasma levels of glucose, insulin, IRI, HbA1c, TC, TG, HDL-C, TNF- α, MCP-1, TGF-β 1, SOD, CAT, and TBARs, as well as expression of the iNOS and Vanin1 genes.
Results: Overweight and obese class I and II diabetics had significantly higher levels of plasma glucose, insulin, HbA1c, TNF-α, MCP-1, TGF-β 1, CAT, and TBAR as well as iNOS and vanin-1 gene expression compared to healthy control individuals. In addition, as compared to healthy control individuals, overweight obese class I and II diabetics’ plasma HDL-C levels and blood SOD activity were significantly lower. In addition, ultrasound and computed tomography showed that the presence of a mild obscuring fatty liver with mild hepatic echogenicity appeared in overweight, class I and II obese diabetic patients.
Conclusion: These findings provide important information for understanding the correlation between Vanin 1 and glycemic, inflammatory, and redox factors in obese patients. Furthermore, US and CT analysis were performed to visualize the observed images of fatty liver due to obesity.
Keywords: overweight, BMI, obese diabetic patients, iNOS, vanin-1, MCP-1, US, CT
Graphical Abstract:
Introduction
Obesity and insulin resistance (IR) are the components of the metabolic syndrome which is strongly associated with oxidative stress.1 The most important problem in patients with metabolic syndrome is an increased cardiovascular risk. Oxidative stress is also involved in the pathogenesis of cardiovascular disease.2 It is worth mentioning that the metabolic syndrome is associated with an increased arterial stiffness and endothelial dysfunction. Perivascular adipose tissue was shown to take part in the pathogenesis of cardiovascular disease. It is also worth mentioning that there are metabolically healthy and metabolically unhealthy obese persons, but a metabolically healthy obesity can change into the metabolically unhealthy state.3
The establishment of IR is also associated with obesity.4 In contrast to patients with subcutaneous obesity, people with central obesity exhibit a higher rate of insulin resistance.5,6 According to some experts, IR is thought to be the primary factor for metabolic and nonmetabolic disorders.7 Also, Grundy et al8 reported that the elevated pancreatic insulin production results from peripheral tissue insulin resistance. Hyperinsulinemia provides normal blood glucose levels during this phase.10 Finally, insulin resistance may outweigh the ability of the pancreas to compensate, and blood glucose levels start to rise.9
In addition, elevated BMI shows a negative link with HDL-C as well as a positive correlation with TC, LDL-C, and TG levels.10,11 The link between BMI and lipoprotein concentrations, particularly LDL-C,14 has been found to be a substantial contributor to cardiovascular disease in obese individuals. Inflammatory adipokines such IL-6, TNF-α and MCP-1 are produced when macronutrient intake rises, and this results in chronic inflammation in obese people.12–16
Furthermore, an increase in free radical generation is linked to both diabetes mellitus and obesity.17 These free radicals can interact with proteins, lipids, DNA, and other biological elements, which would injure cells and cause mutations.18
It has been recognized that iNOS development and obesity are related to each other.19 According to several studies,20–22 patients with uncontrolled Type 2 diabetes had iNOS protein levels in skeletal muscle that were nearly four times higher than those of the control group.
Other proteins, such as vanin-1 vascular protein, are associated with obesity, diabetes and cardiovascular diseases.23 Vanin-1 functions as a pantherinae that catalyzes the degradation of pantetheine to pantothenic acid and releases cysteamine. Vanin-1 is linked to the membrane through a glycosylphosphatidylinositol (GPI).24,25 Cysteamine, a potent antioxidant, is widely produced in the blood, kidneys, and hepatocytes.26
Recently, Vanin 1 has also been studied in relation to ulcerative colitis, for instance drug-induced toxicity.27 DSS (dextran sulfate sodium) is one of the most used drugs, for induction of ulcerative colitis in experimental rats. It can lead to severe necrosis in the tissue of colon.27 In the current study, we examined the expression of vanin-1 in obese/diabetic patients and its relationship to glycemic, inflammatory, and redox factors.
Methods
Human Participants
We enrolled 67 participants from the AL-AHRAR Teaching Hospital in Egypt between September 2020 and April 2021 for this prospective non-randomized trial. The 67 male patients had a mean age of 53.5±5.0 years. They were categorized into the following 4 groups based on their BMI according to WHO:28 Group 1: control group, 18 healthy men with BMI < 25 kg/m2. Group 2 consisted of 16 overweight diabetic individuals with a BMI of 25 to 29.9 kg/m2. Group 3 comprised 20 class I obese diabetic patients (30.00–34.9 kg/m2). Group 4 consisted of 13 class II obese diabetic patients with a BMI between 35 and 39.9 kg/m2. The body mass indices of the participants were determined after a thorough assessment of their medical history, using the formula BMI = body weight kg/height (m2). When they were chosen for the study, none of the participants were following a specific diet.
Estimating fasting plasma glucose (FPG) and insulin levels for type 2 diabetes (DM) diagnosis.
Using the World Health Organization’s 199829 diagnostic criteria, DM and normal glucose metabolism were identified. FPG 7.0 mmol/L is the threshold for DM.
Criteria for Exclusion
Patients with cancer, serious infectious or inflammatory disorders, autoimmune diseases, and serious systemic diseases (liver, kidney, rheumatic, and cardiovascular diseases) were excluded from the study. Patients who had taken antibiotics, anti-inflammatory drugs, or corticosteroids were excluded.
Blood Sampling and Biochemical Analyses
Diagnosis of participants was carried out by Prof. Alaa Ramadan Mohamed Youssuf, MD. Cardiology, Consultant and Head of Cardiology Department, AL-AHRAR Teaching Hospital, Zagazig University, Egypt. All experimental procedures were carried out following the ethical standards under a protocol approved by the Ethics Committee of AL-AHRAR Teaching Hospital, Zagazig University, Egypt (HAH00019) and were executed conforming to the Guide for medical research involving human subjects that was initially adopted by the 18th assembly of the World Medical Association in Helsinki, Finland, in June 1964. Venous blood samples (after fasting overnight) were obtained from all participants, anticoagulated, and divided into two parts; the first part was used for the measurement of glycated hemoglobin (HbA1c) using ARCHITECT c 4000 analyzers (Abbott Diagnostics), and the second part was centrifugated and the plasma obtained was used for the colorimetrical determination of glucose, TC, TG and HDL-C.30–32 In addition, plasma insulin, TNF- α, MCP-1, TGF-β1, SOD, CAT, and TBARs were measured by MaxSignal® HTS DON ELISA Kits (Llantrisant, United Kingdom). Insulin resistance index (IRI) was measured according to the formula of Viktorinova et al12 IRI = insulin (mU/mL) x glucose (mM)/22.5.
qRT-PCR
Using the RNA-spinTM (Qiagen GmbH, Hilden, Germany), total RNA of plasma was extracted. As instructed by the manufacturer, cDNA was utilized for qPCR using SYBR Green PCR master mix (iNtRON Biotechnology, Korea). The reverse transcription kit was used to produce cDNA from 1 to 5 µg total RNA (Applied Biosystems, Foster City, CA).
The PCR reaction mixture contained 0.4 M of primers, 1.5 mM MgCl2, 200 µM dNTPs, 0.5 µM of sense and antisense primers, and 2.5 units of Taq DNA polymerase (Promega Corporation). The PCR reaction mixtures were heated for the necessary number of cycles for 45s each at 94°C, for 30s at the proper annealing temperatures, and for one minute and thirty seconds at 72°C. The extension step was then carried out at 72°C for 10 minutes. The housekeeping gene glyceraldehyde-3-phosphate dehydrogenase (GAPDH) mRNA was utilised to normalise the CYP mRNA concentration.33 Primer sequences of INOS and vanin-1 genes as well as GAPDH are illustrated in Table 1.
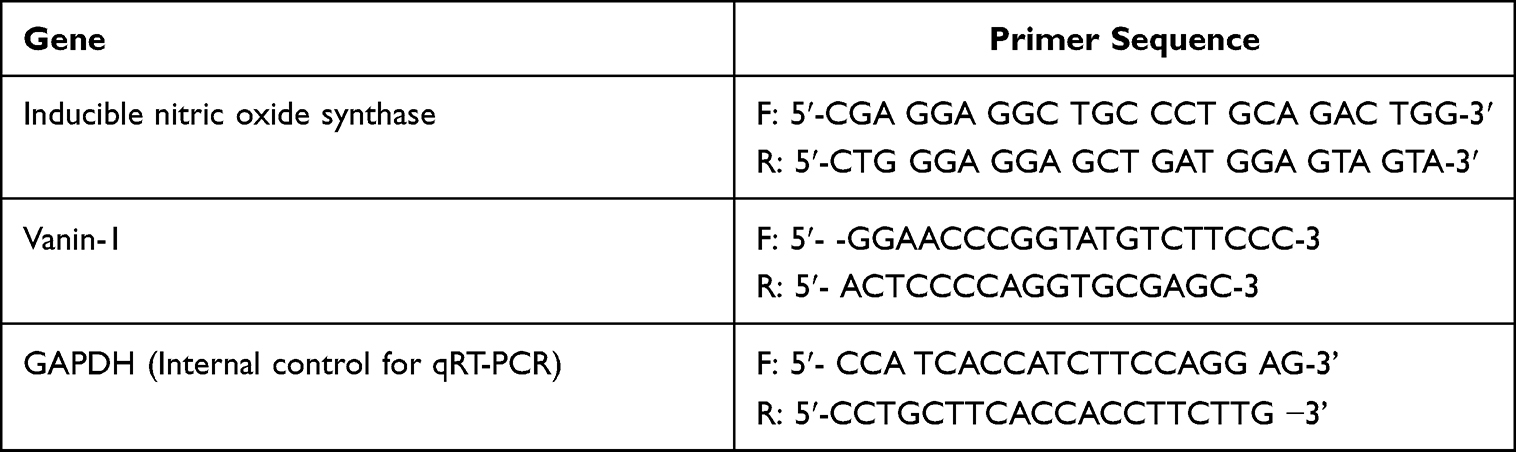 |
Table 1 Primers Used in Real-Time PCR |
Ultrasound Scanning Procedure
Using the US apparatus with 7 MHZ power linear transducer, the patients underwent an abdominal plain ultrasound procedure (Philips CV650). The patients’ stomachs were shaved to reduce imaging artefacts and to prevent vomiting and gas from the abdomen area during the US scan. Patients were not allowed to eat eight hours prior to the trial as part of this preparation. The probe was positioned longitudinally and transversely in the upper hypochondrium to investigate the liver. This made it possible to capture several longitudinal and transverse images.
Computed Tomography (CT)
Plain abdominal CT scans were performed in patients (Spiral, Toshiba, Activation 16, Tochigi, Japan) with a scan time of 0.48 s (partial), 0.75–3 s, as well as a row data memory size of 144 GB and a 75 GB image data memory size in the slice thickness with 0.5–5 mm. CT numbers were taken in liver and spleen at three different locations, excluding blood arteries and heterogeneous parts. CT imaging was used to assess the fatty liver of overweight and obese diabetic patients.
Statistical Analysis
Data were expressed as means ± SD. ANOVA with Spearman’s rank correction (ρ) was used to evaluate all data using the SPSS/20 program. The significant differences between the two groups of overweight, class I and II obese diabetic patients, and control participants were compared using a Student’s t-test. Data at (p < 0.05) are regarded as significant.
Results
Table 2 documents that the levels of BMI, glucose, insulin, IRI as well as glycated hemoglobin (HbA1c) among healthy males as well as diabetic overweight and obese diabetic patients. BMI values differ significantly (p < 0.05) between four groups. Glucose levels were significantly increased by 43.44%, 72.64%, and 96.49% in overweight as well as class I and II obese patients, respectively, in comparison to healthy controls (p < 0.05). In parallel, the levels of glucose, insulin, insulin resistance and glycated hemoglobin were increased in overweight and obese patients: Similarly, plasma insulin was significantly increased by 30.15%, 50.95%, and 82.66% in overweight as well as class I and II obese diabetic patients, respectively, as compared to the healthy group (p < 0.05). Changes in IRI were even more pronounced; its levels increased significantly by 68.18%, 134.41%, and 222.07% in obese and overweight class I and II patients, respectively, in comparison to healthy group (p < 0.05). Furthermore, HbA1c plasma levels were increased non-significantly by 6.43% overweight patients and significantly by 63.03%, and 70.13% in overweight as well as class I and II obese patients, respectively, in comparison to healthy group (p < 0.05).
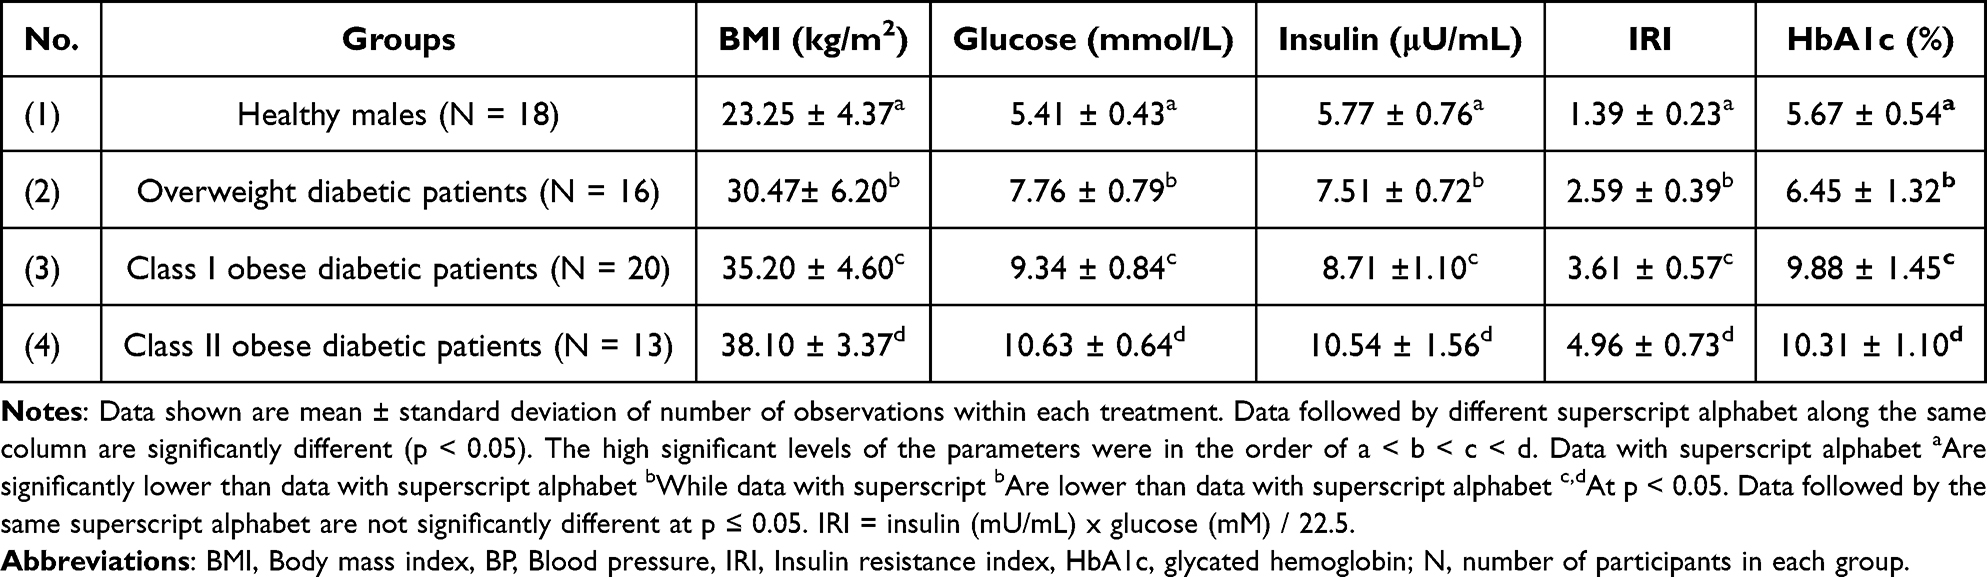 |
Table 2 BMI in Relation to Glucose, Insulin, IRI and HbA1c Among Healthy Persons and Overweight as Well as Class I and II Obese Diabetic Patients |
Plasma lipid parameters, such as TC, TG, and HDL-C among healthy males as well as diabetic overweight and obese diabetic patients are tabulated in Table 3. Plasma TC was increased significantly by 20.48%, 32.90%, and 42.94% in overweight, class I and II obese patients, respectively, in comparison to the healthy control group (p < 0.05). TG was significantly increased by 36.82%, 68.60%, and 83.0% in overweight as well as class I and II obese patients, respectively, compared to controls (p < 0.05). However, the plasma HDL-C levels decreased non-significantly by 10.94% in overweight patients, and significantly by 19.15% (p < 0.05) and 24.73% (p < 0.05) in class I and II obese patients in comparison with healthy control patients.
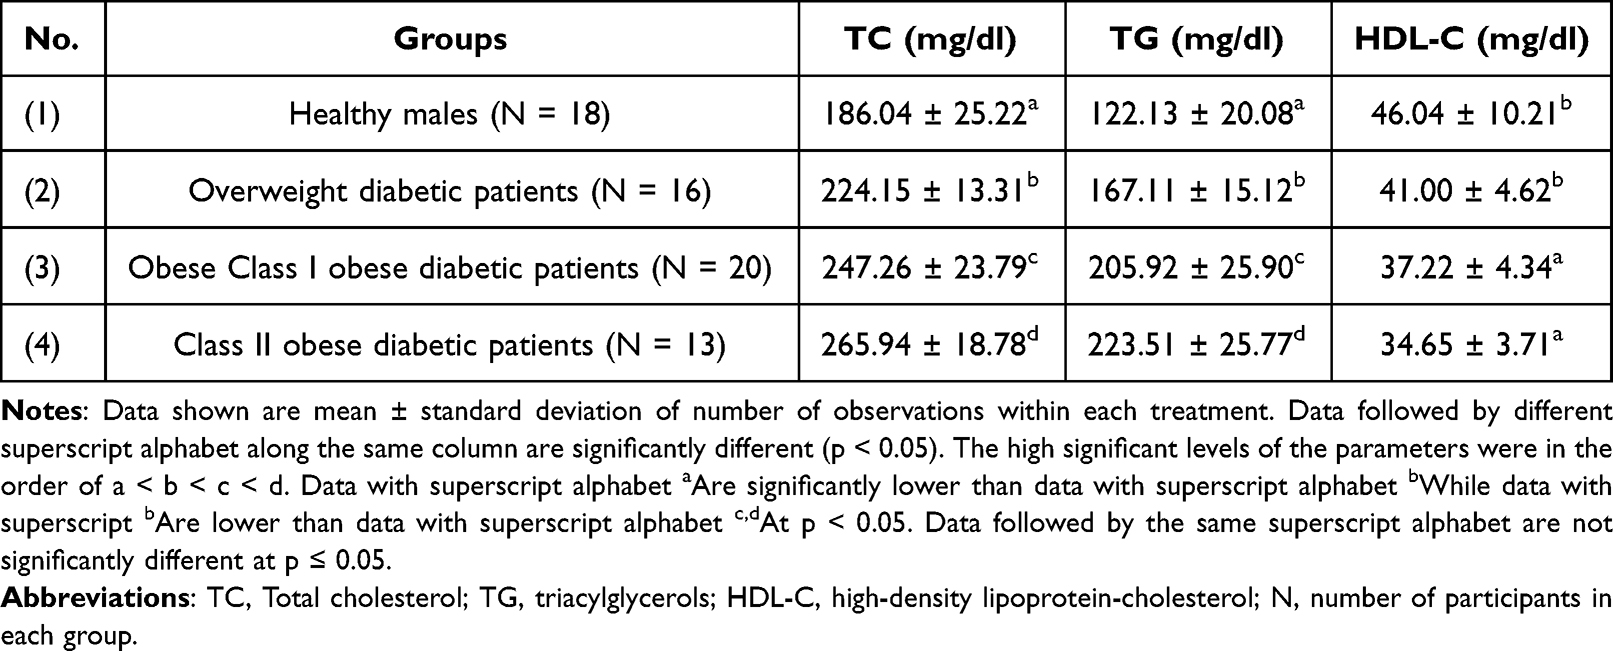 |
Table 3 Levels of TC, TG and HDL-C Among Healthy Persons, Overweight as Well as Obese Class I and II Diabetic Patients |
Table 4 shows the levels of inflammation markers, such as plasma TNF- α, MCP-1 and TGF-β1 among healthy males as well as overweight and obese diabetic patients. Values for TNF- α were increased by 24.50%, 70.54% and 116.08% in overweight patients, class I and II obese diabetic patients, respectively, as compared to the healthy group of males (p < 0.05). Similarly, plasma MCP-1 levels increased significantly by 14.42%, 33.59%, and 65.92% in overweight, class I and II obese diabetic patients, respectively, as compared to the control (p < 0.05). Finally, the level of plasma TGF-β1 was significantly increased by 16.09%, 38.53%, and 53.83% in overweight, class I and II obese diabetic patients, respectively, in comparison to the healthy group (p < 0.05).
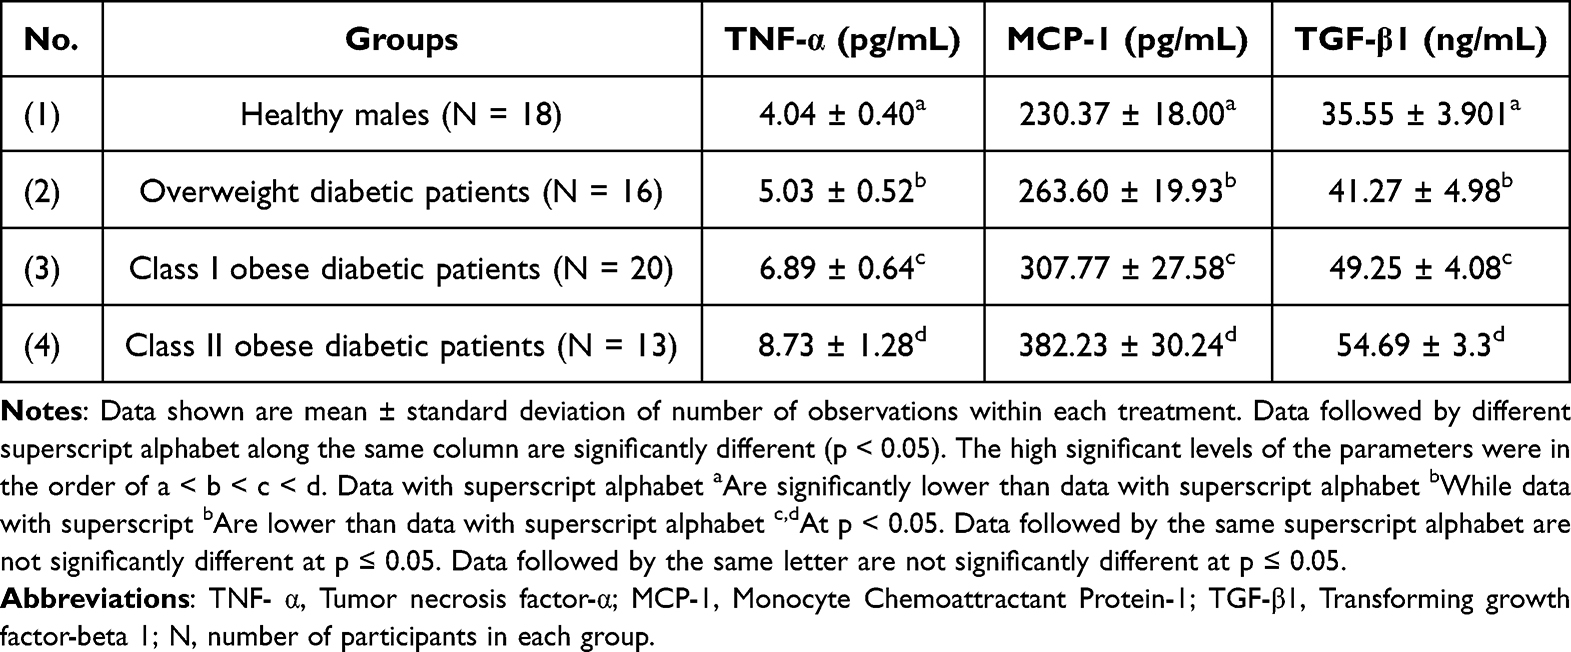 |
Table 4 Levels of Plasma TNF- α, MCP-1 and TGF-β1 in Healthy Persons and Overweight as Well as Obese Class I and II Diabetic Patients |
The present study also interested in the antioxidative capacity of the patients. Table 5 shows blood SOD and CAT as well as plasma TBARs levels among healthy males as well as overweight and obese diabetic patients. Blood SOD activity decreased significantly by 13.20%, 24.27% and 32.03% in overweight patients, obese diabetic patients of class I and II, respectively, in comparison to the healthy control group (p < 0.05). Blood CAT activity was significantly increased by 51.05%, 66.63%, and 87.67% in overweight as well as class I and II obese diabetic patients in comparison with the control group (p < 0.001). Similarly, plasma TBARs levels were increased significantly (p < 0.05) by 61.11%, 106.94%, and 186.11% in overweight, class I and II obese diabetic patients, respectively, compared to the control group.
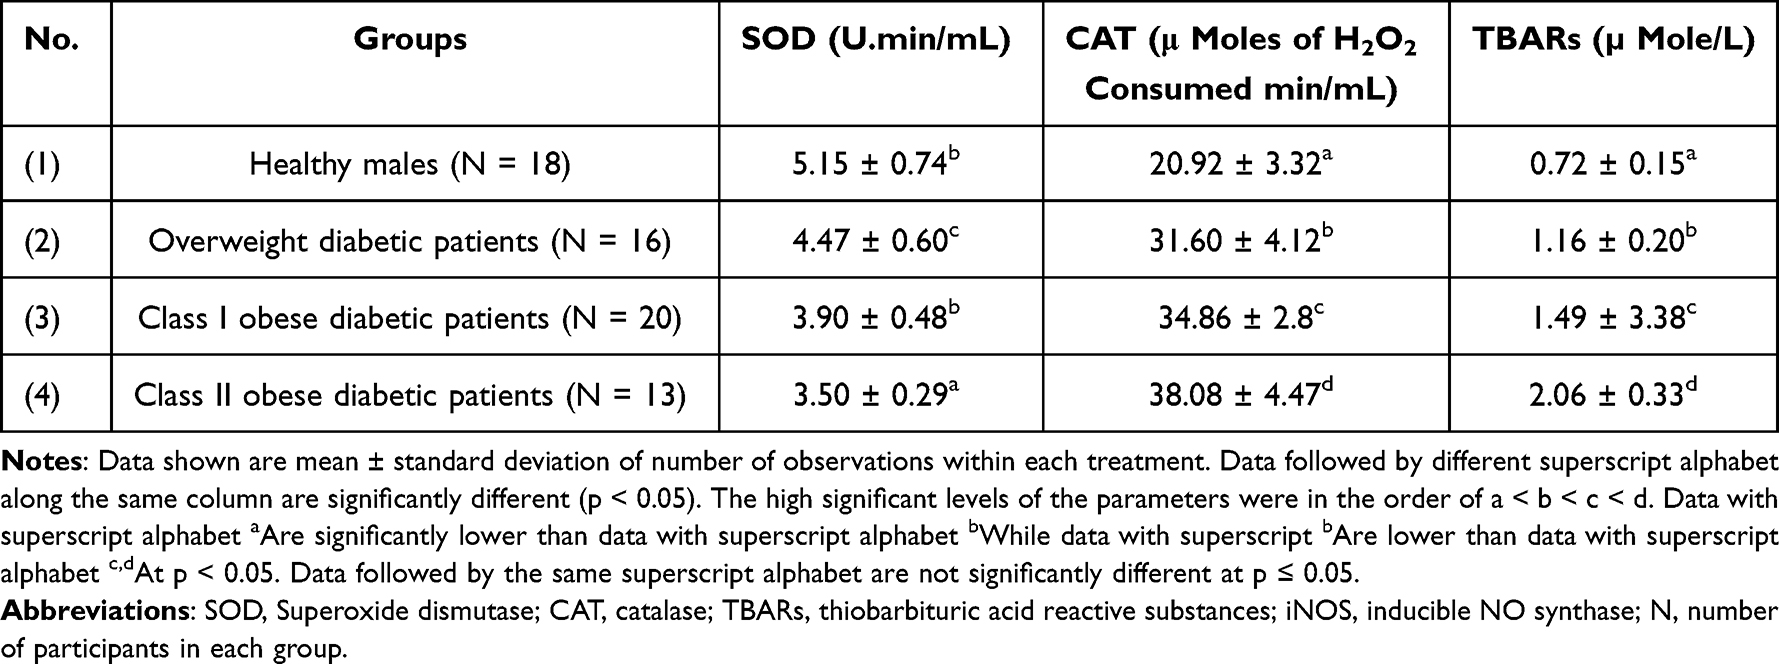 |
Table 5 Levels of Blood SOD and CAT as Well as Plasma TBARs Among Healthy Persons and Overweight as Well as Class I and II Obese Diabetic Patients |
In another set of analyses, the present study was interested in the expression levels of iNOS and vanin-1 gene in plasma cells. Figures 1 and 2 show gene expression of iNOS and vanin-1 among healthy males as well as overweight and obese patients. Plasma iNOS gene expression (Figure 1) was significantly increased by 38.37%, 105.81%, and 227.90% in overweight, class I and II obese patients, respectively, in comparison to healthy controls (p < 0.05). However, the levels of vanin-1 gene expression were even more pronounced: they increased by 30.52%, 218.94%, and 458.95% in overweight, class I and II obese patients, respectively, compared to the control group (P < 0.05).
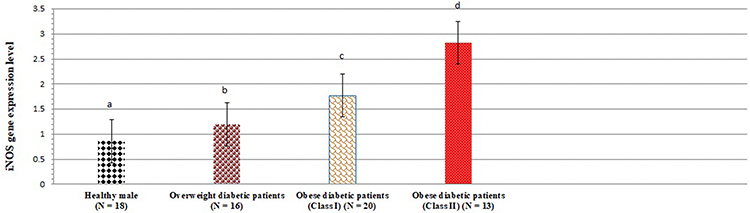 |
Figure 1 iNOS gene expression levels among healthy persons and overweight as well as class I and II obese diabetic patients. Data shown are mean ± standard deviation of number of observations within each treatment. Data followed by different superscript alphabet along the same column are significantly different (p < 0.05). The high significant levels of the parameters were in the order of a < b < c < d. Data with superscript alphabet “a” are significantly lower than data with superscript alphabet “b” while data with superscript “b” are lower than data with superscript alphabet “c and d” at p < 0.05. Data followed by the same superscript alphabet are not significantly different at p ≤ 0.05. Abbreviation: N, number of participants in each group. |
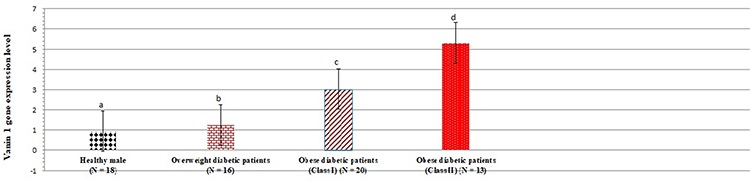 |
Figure 2 Vanin-1 gene expression levels among healthy persons and overweight as well as class I and II obese diabetic patients. Data shown are mean ± standard deviation of number of observations within each treatment. Data followed by different superscript alphabet along the same column are significantly different (p < 0.05). The high significant levels of the parameters were in the order of a < b < c < d. Data with superscript alphabet “a” are significantly lower than data with superscript alphabet “b” while data with superscript “b” are lower than data with superscript alphabet “c and d” at p < 0.05. Data followed by the same superscript alphabet are not significantly different at p ≤ 0.05. N= number of participants in each group. |
A correlation analysis between the level of gene expression of vanin-1 and all other variables (studied in Tables 2–5) is documented in Table 6. Significant correlations are apparent in class I and II obese diabetic patients. Furthermore, levels of vanin-1 gene expression are also correlated with iNOS gene expression (r = 0.192, 0.247 and 0.329) and inversely correlated with HDL-C level, and SOD activity (r = −0.265, −0.118 and −0.123; r = −0.031, −0.090 and −0.613), respectively, in overweight patients, and obese diabetic class I & II patients.
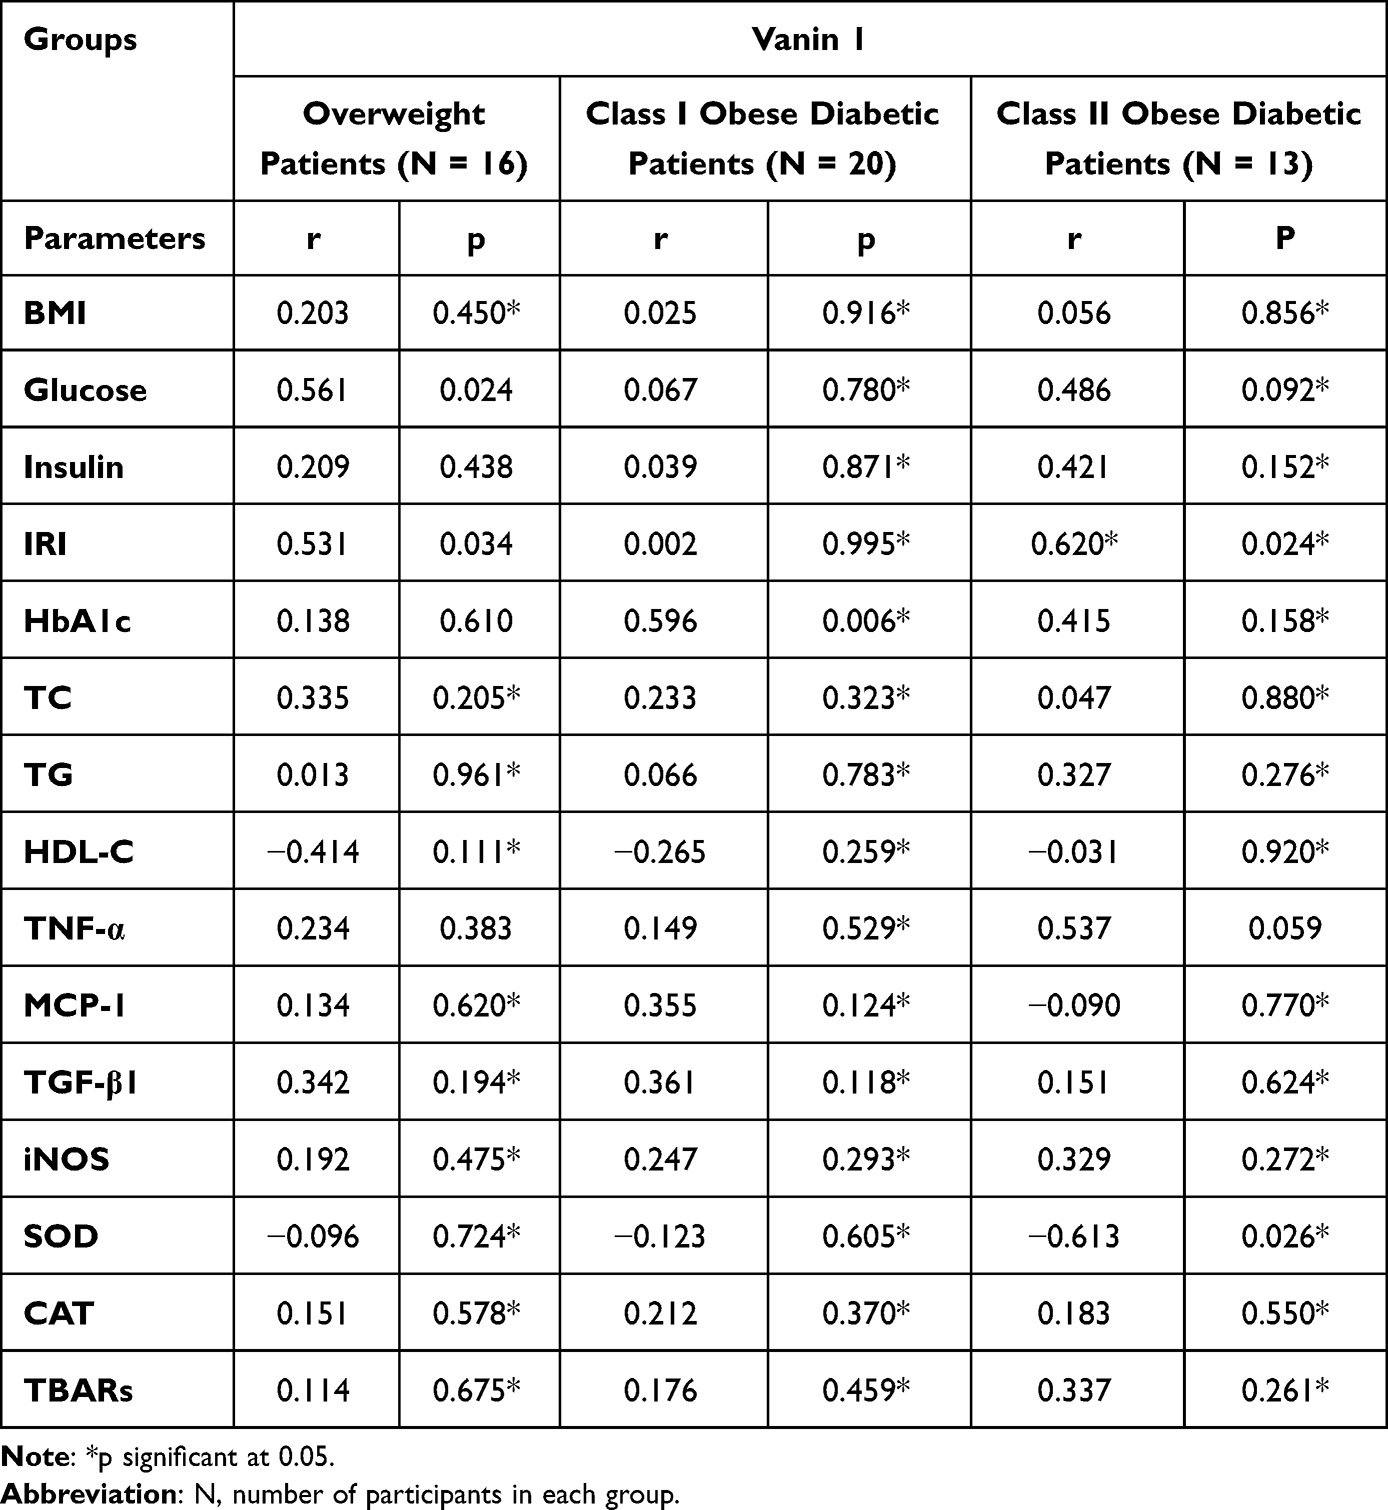 |
Table 6 Correlation Between the Expression of Vanin 1 and Glucose Homeostasis Indices, HbA1c, Lipid Profile, Inflammatory Mediators, and Oxidative Stress Biomarkers in Healthy Persons and Overweight as Well as Class I and II Obese Diabetic Patients |
In addition to the assessment of biochemical markers, the present study examined the liver of patients by Ultrasound scanning (US) and Unenhanced CT (CT). A normal echo pattern of hepatic parenchyma in healthy males is provided in Figure 3A. US of overweight diabetic patients, showed diffusely hepatic echogenicity but portal and diaphragmatic echogenicity are still appreciable (Figure 3B). In class I obese diabetic patients, the US revealed fatty liver with mild hepatic echogenicity (Figure 3C). In addition, US examination of class II obese diabetic patients revealed a fatty liver with an echogenic liver that obscured the echogenic walls of portal venous branches (Figure 3D).
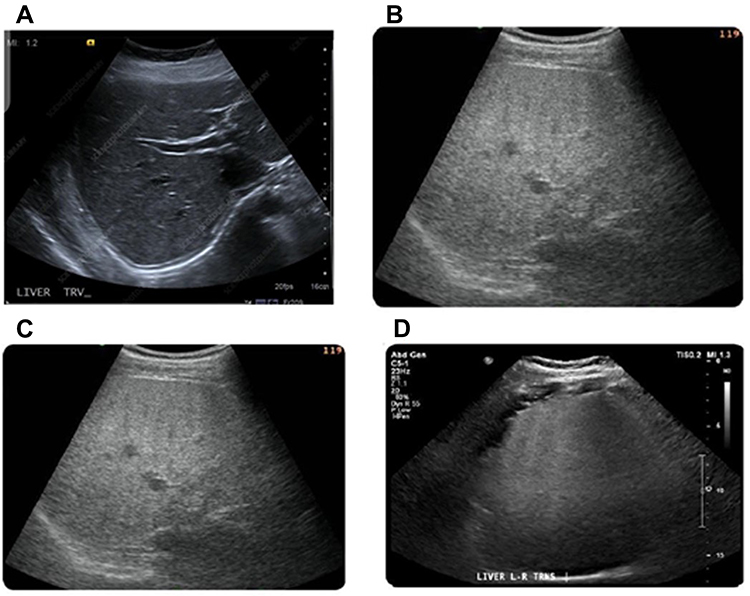 |
Figure 3 Ultrasound (US) imaging of liver in healthy persons and overweight as well as class I and II obese patients. Normal liver contrast with white asterisks demarcating normal hepatic parenchyma for comparison at same depth (A). US of overweight diabetic patients showed the presence of fatty liver with increased liver echogenicity (B). Also, fatty liver with mild hepatic echogenicity obscuring was apparent in class I obese diabetic patients (C). In addition, US liver examination of class II obese diabetic patients showed a marked fatty liver with echogenic liver obscuring the echogenic walls of portal venous branches (D). |
In a last set of examinations, the present study was investigated the liver of the patients by unenhanced CT examination of the healthy controls showed a normal hepatic parenchyma (Figure 4A).
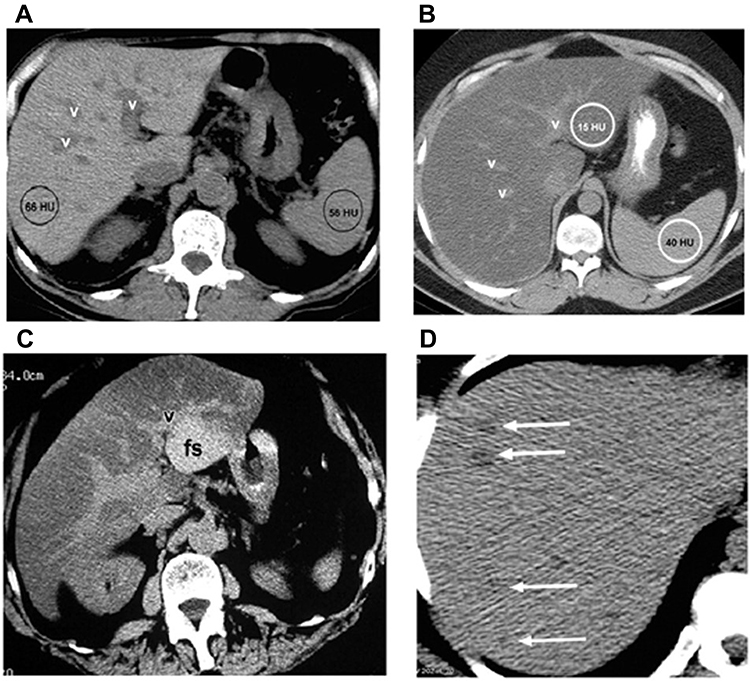 |
Figure 4 CT scan of liver in healthy persons and overweight diabetic as well as class I and II obese patients. Normal appearance of the liver at unenhanced CT (A). CT of overweight diabetic patients showed diffuse fat accumulation in the liver (B). Also, Focal fat accumulation in the liver at CT in class I obese diabetic patients (C). In addition, CT liver examination of class II obese diabetic patients showed multifocal fat accumulation in the liver at CT (D). Abbreviations: v, Vessel; HU, Hounsfield units; fs, Focal Sparing. |
However, in overweight diabetic patients, the CT showed a diffuse fat accumulation in the liver. In overweight diabetic patients, a liver attenuation (15 HU) is clearly seen. Compared to the liver, the portal vein vessels (v) appear to be hyperattenuating (Figure 4B).
At CT, a focal fat buildup in liver can be observed. In class I obese patients, an axial contrast-enhanced image taken even during the portal venous phase shows hypoattenuating zones of focused fat accumulation next to falciform and venous muscles, as well as in the porta hepatis, without any indication of a mass effect (Figure 4C).
Both US and CT data show that extensive fat deposition occurs with localized sparing. At comparable levels, a longitudinal US image (a) and an axial unenhanced CT image (b) show significant echogenicity and hypoattenuation, indicating a distributed fat deposition in the liver. Focal sparing (fs) is a shaped area with comparative hypoechogenicity in one direction and hyperattenuating in the other. In class I obese diabetic individuals, the focal fatty pseudolesion has no mass effect on the surrounding vessel (Figure 4D).
Discussion
Obesity can be regarded as a chronic health condition.34 It is characterized by a high BMI that is correlated with elevated levels of glucose, insulin, and insulin resistance index (IRI). Obesity relates to fatty liver, hypertension, hypercholesterolemia, hypertriglyceridemia and an increased risk of death from cardiovascular disease.35–37
The present study confirmed that increased levels of glucose, insulin, and IRI are associated with obese patients with type 2 diabetes. Early intervention strategies such as a healthy diet and physical activity should focus on the senior population to avoid obesity, and type 2 diabetes.38,39
Vanin-1 controls the availability of pantothenic acid40 and CoA metabolism41 and is crucial for the liver’s lipid metabolism and taurine synthesis (Figure 5). Pantherinae catalyses the degradation of pantetheine to pantothenic acid and releases cysteamine. Pantothenate kinases phosphorylate vitamin B5 to 4-phosphopantothenate during the synthesis of CoA; this reaction is regarded as the rate-limiting step.42,43 Phosphopantothenate-cysteine ligase produces 4-phosphopantetheine by combining cysteine with phosphopantothenate, giving the CoA molecule the catalytic thiol group, it needs to bind lipids. PPAT converts 4-phosphopantetheine to 3-dephospho-CoA, which is then transformed to CoA by DPCK in a series of phosphorylation cycles.44 Through the production of cysteamine and the prevention-free radical-induced damage of islet β-cells and other pancreatic tissues, vanin-1 activity influences glucose, insulin, and IRI levels and regulates the progression of DM.45,46 At this condition, vanin-1 expression is induced upon fasting47 and it could be a sign of increased PPAR- α activation.48
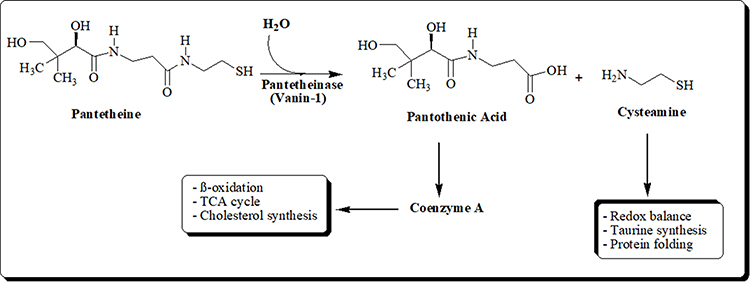 |
Figure 5 Schematic diagram of the hydrolysis of Pantetheine. |
The present results showed a direct relationship between overweight and obesity with an enhanced expression of the genes for vanin-1 and iNOS, and increased levels of glucose, insulin, as well as IRI. Vanin-1 has become one of the best known PPARα regulated genes.49–51
PPARγ is expressed in adipocytes to control lipid storage and adipocyte development as well as enhance IR. Furthermore, PPARγ agonists increase adiponectin expression, which reduces liver glucose output by activating AMPK,52 and therefore can help to improve vanin-1-induced insulin improvement.53 Furthermore, upregulation of vanin-1 mRNA related with PPAR has been seen in diabetics and is directly linked to HbA1c and BMI.54
On the other hand, it was discovered that vanin-1 mRNA was elevated in liver steatosis,55 that it occurs before lipid buildup and that, in the fatty liver model, it is mediated differently by different kinds of free fatty acids.56 The present study suggests that vanin-1 is highly expressed in class I and II of overweight and obese patients compared to healthy males and was positively related to BMI and IRI.
The relationship between HbA1c, glucose, insulin, and IRI in obese diabetic patients has been mentioned in many previous studies.57–59 A positive association was reported between HbA1c and glucose and the TC and TG, as well as a negative relation between HbA1c and HDL-C in obese patients.60,61
Type 2 diabetes risk has been linked to low HDL-C and high TC & TG levels.62 The present findings showed that type 2 DM patients, who were overweight or obese had higher levels of TC and TG, as well as vanin-1 mRNA expression.
Vanin-1 has a significant impact on PPARα activation which has been related to elevated expression of fatty acid utilization genes and triglyceride particles breakdown by lipoprotein lipase (LPL). Furthermore, it has been associated with fatty acid transport proteins. In addition, activation of acyl CoA oxidase proceed with peroxisomal and mitochondrial β-oxidation.62 Apolipoprotein A1,63 the main component of HDL-C, and the ATP-binding transporter A164 are expressed more frequently, which contributes to the reverse cholesterol transport system and aids in HDL-C synthesis in humans.
The relationship between inflammation and increased oxidative stress and insulin resistance in obese diabetic patients has been reported in numerous studies.65 The present study showed a significant elevation in plasma MCP-1, IL-6, TNF-α, and TGF-β1 among overweight and obese diabetic patients.66 The cytokines too stimulate macrophages and monocytes to create reactive oxygen and nitrogen, an elevation in their concentration might be cause of increased oxidative stress. Given how vanin-1 is hyperactivated in response to inflammatory and oxidative stress,67,68 the present study suggests the overexpression of vanin-1 in overweight and obese diabetic patients induced by oxidative stress. As discussed before, the endogenous antioxidant cysteamine is produced by vanin-1-mediated catalysis. Also, Naquet et al69 have reported a significant decrease in the liver CoA level in obese rats. The present study suggests that the overexpression of vanin-1 in overweight and obese diabetic patients could be the recycling of pantothenic acid and the formation of cysteamine as a potent antioxidant agent (Figure 5). In a model of peripheral inflammation, cysteamine has also shown strong anti-inflammatory effect.70 The present observation showed that vanin-1 overexpression is in line with other studies that proved its protection correlated with reduction of apoptosis and inflammation.71–73
The present results demonstrate an excess in blood CAT and TBARs, in addition to a low in blood SOD among overweight and obese diabetic patients. Furthermore, the present results found a positive relationship between BMI and TBARs and CAT, as well as a negative association between BMI and blood levels.
MDA and ROS levels were significantly elevated in high BMI patients.74 One significant effect is the modification of the endogenous GSH pool by gamma-glutamylcysteine synthetase,75 which affects the redox status and consequently cell fate in response to oxidative stress damage.76 Among overweight and obese diabetic patients, elevated CAT activities point to the presence of oxidative stress.77–80 Most peroxisomes include the tetrameric protein CAT. It facilitates the transformation of hydrogen peroxide into water and hydrogen.80 The increase in CAT could be a compensating strategy for the higher levels of hydrogen peroxide levels. The present findings are consistent with Rindler et al who showed a substantial increase in CAT in fat mice.81 Indeed, overexpression of CAT is beneficial in preventing oxidative damage.72
Rats’ white adipose tissue, which contains iNOS, may be a source of NO generation. We have proven that BMI and vanin-1 gene expression are positively correlated.82 Furthermore, the present results showed a direct correlation between vanin-1 and iNOS gene expression. Furthermore, we have suggested that vanin-1 overexpression among overweight and obese diabetic patients may be induced by iNOS expression.83 The correlation between vanin 1 and chronic inflammation is now well understood because of the enzyme’s capacity to generate cysteamine.84 Vanin 1 also inhibits the expression of the iNOS gene and regulates metabolic pathways in part through the PPAR-α and PPAR-γ.84
Additionally, the correlation between iNOS expression and IRI was investigated in many reports.85–87 T2D exhibited four times the amount of iNOS expression as normal matched controls.88
Furthermore, the present findings are consistent with those of Lien et al,89 Juan et al,90 and Batra et al91 regarding the elevation of iNOS expression and TNF-α resulted in increased lipolysis in this tissue. The present study suggests that a direct correlation between vanin-1 and iNOS expression, inflammatory mediators, and antioxidant enzymes may be due to its role in the production of coenzyme A and cysteamine (Figure 5).
Our study suggests that a direct correlation between vanin-1 and iNOS expression and provides a logical reason to explain the obtained results as follows: in patients who are obese, adipocytes produce fatty acids in tissues in the periphery that express iNOS and TNF-α by preventing lipolysis, vanin-1 helps to maintain normal fatty acid levels. Also, vanin-1 involved in production of Coenzyme A which plays important role in TCA cycle and production of energy. Additionally, vanin-1 contributes to the synthesis of the antioxidant cysteamine, which inhibits hepatic acetyl-CoA carboxylase, hence triggering hepatic fatty acid oxidation.
Conclusion
In the present report, the changes in vanin-1 gene expression in obese/diabetic patients may be related to changes in glycemic, inflammatory, and redox factors. The present study suggests that in obese patients, adipocytes produce fatty acids in tissues in the periphery that express iNOS and TNF-α thus preventing lipolysis. Vanin-1 gene expression in obese/diabetic patients may be related to the elevation of glycemic, inflammatory, and redox parameters and has not been previously documented, and this study may be the first of its kind. More studies are in progress to determine the relationship between vanin-1 and cholesterol biosynthesis and TCA regulating factors.
Abbreviations
BMI, Body mass index; BP, Blood pressure; IRI, Insulin resistance index; HbA1c, glycated hemoglobin; TC, total cholesterol; TG, triacylglycerols; HDL-C, high-density lipoprotein-cholesterol; TNF- α, tumor necrosis factor-α; MCP-1, Monocyte Chemoattractant Protein-1; TGF-β1, Transforming growth factor-beta 1; SOD, superoxide dismutase; CAT, catalase; TBARs, thiobarbituric acid reactive substances; iNOS, inducible NO synthase.
Informed Consent Statement
Written informed consent was obtained from all the participants.
Consent for Publication
Consent for publication was received from all the authors.
Author Contributions
All authors made a significant contribution to the work reported, whether that is in the conception, study design, execution, acquisition of data, analysis and interpretation, or in all these areas; took part in drafting, revising or critically reviewing the article; gave final approval of the version to be published; have agreed on the journal to which the article has been submitted; and agree to be accountable for all aspects of the work.
Funding
This research did not receive any specific grant from funding agencies in the public, commercial, or not-for-profit sectors.
Disclosure
All authors report no conflicts of interest relevant to this article.
References
1. Hall JE, Do Carmo JM, Da Silva AA, Wang Z, Hall ME. Obesity, kidney dysfunction and hypertension: mechanistic links. Nat Rev Nephrol. 2019;15:367–385. doi:10.1038/s41581-019-0145-4
2. Hall JE, Mouton AJ, da Silva AA, et al. Obesity, kidney dysfunction, and inflammation: interactions in hypertension. Cardiovasc Res. 2021;117:1859–1876. doi:10.1093/cvr/cvaa336
3. Starzak M, Stanek A, Jakubiak GK, Cholewka A, Cieślar G. Arterial stiffness assessment by pulse wave velocity in patients with metabolic syndrome and its components: is it a useful tool in clinical practice? Int J Environ Res Public Health. 2022;19:10368. doi:10.3390/ijerph191610368
4. Smith DM, Taylor W, Whitworth MK, Roberts S, Sibley C, Lavender T. The feasibility phase of a community antenatal lifestyle program [The Lifestyle Course (TLC)] for women with a body mass index (BMI) <30 kg / m (2.). Midwifery. 2015;31(2):280–287. doi:10.1016/j.midw.2014.10.002
5. Hou L, Jiang F, Huang B, et al. Dihydromyricetin ameliorates inflammation-induced insulin resistance via phospholipase C-CaMKK-AMPK signal pathway. Oxid Med Cell Longev. 2021;2021:8542809. doi:10.1155/2021/8542809
6. Hayashi T, Boyko EJ, McNeely MJ, Leonetti DL, Kahn SE, Fujimoto WY. Visceral adiposity, not the abdominal subcutaneous fat area, is associated with an increase in future insulin resistance in Japanese Americans. Diabetes. 2008;57(5):1269–1275. doi:10.2337/db07-1378
7. Tulloch-Reid MK, Hanson RL, Sebring NG, Reynolds JC, Premkumar A, Genovese J. Both subcutaneous and visceral adipose tissue correlate highly with insulin resistance in African Americans. Obes Res Res. 2004;12(8):1352–1359. doi:10.1038/oby.2004.170
8. Grundy SM. Metabolic syndrome update. Trends Cardiovasc Med. 2016;26(4):364–373. doi:10.1016/j.tcm.2015.10.004
9. Alwahsh SM, Dwyer BJ, Forbes S, Thiel DH, Lewis PJ, Ramadori G. Insulin production and resistance in different models of diet-induced obesity and metabolic syndrome. Int J Mol Sci. 2017;18(2):285. doi:10.3390/ijms18020285
10. Rodríguez-Correa E, González-Pérez I, Clavel-Pérez PI, Contreras-Vargas Y, Carvajal K. Biochemical and nutritional overview of diet-induced metabolic syndrome models in rats: what is the best choice? Nutr Diabetes. 2020;10(1):24. doi:10.1038/s41387-020-0127-4
11. Kwon Y, Kim JH, Ha EK, et al. Serum YKL-40 levels are associated with the atherogenic index of plasma in children. Mediators Inflamm. 2020;2020:8713908. doi:10.1155/2020/8713908
12. Viktorinova A, Malickova D, Svitekova K, Choudhury S, Krizko M. Low-density lipoprotein cholesterol-to-apolipoprotein B ratio as a potential indicator of LDL particle size and plasma atherogenicity in type 2 diabetes. Diabetes Res Clin Pract. 2021;176:108858. doi:10.1016/j.diabres.2021.108858
13. Kaneva AM, Potolitsyna NN, Bojko ER. Usefulness of the LDL-C/apoB ratio in the overall evaluation of atherogenicity of lipid profile. Arch Physiol Biochem. 2017;123(1):16–22. doi:10.1080/13813455.2016.1195411
14. Ellulu MS, Patimah I, Khaza’ai H, Rahmat A, Abed Y. Obesity and inflammation: the linking mechanism and the complications. Arch Med Sci. 2017;13(4):851. doi:10.5114/aoms.2016.58928
15. Bassuk SS, Rifai N, Ridker PM. High-sensitivity C-reactive protein: clinical importance. Curr Probl Cardiol. 2004;29(8):439–443.
16. Stępień M, Stępień A, Wlazeł RN, Paradowski M, Banach M, Rysz J. Obesity indices and inflammatory markers in obese non-diabetic normo-and hypertensive patients: a comparative pilot study. Lipids Health Dis. 2014;13(1):29–35. doi:10.1186/1476-511X-13-29
17. Agusti A, Morla M, Sauleda J, Saus C, Busquets X. NF-kappaB activation and iNOS upregulation in skeletal muscle of patients with COPD and low body weight. Thorax. 2004;59:483–487. doi:10.1136/thx.2003.017640
18. Rother KI. Diabetes treatment-bridging the divide. N Engl J Med. 2007;356(15):1499–1501. doi:10.1056/NEJMp078030
19. Elgizawy HA, Ali AA, Hussein MA. Resveratrol: isolation, and its nanostructured lipid carriers, inhibits cell proliferation, induces cell apoptosis in certain human cell lines carcinoma and exerts protective effect against paraquat-induced hepatotoxicity. J Med Food. 2021;24(1):89–100. doi:10.1089/jmf.2019.0286
20. Hussein MA. Synthesis of some novel triazoloquinazolines and triazinoquinazolines and their evaluation for anti-inflammatory activity. Med Chem Res. 2012;21(8):1876–1886. doi:10.1007/s00044-011-9707-0
21. Abdel Maksoud HA, Elharrif MG, Mahfouz MK, Omnia MA, Abdullah MH, Eltabey ME. Biochemical study on occupational inhalation of benzene vapours in petrol station. Resp Med Case Rep. 2019;27:1–4. doi:10.1016/j.rmcr.2019.100836
22. El Gizawy HA, Abo-Salem HM, Ali AA, Hussein MA. Phenolic profiling and therapeutic potential of certain isolated compounds from parkia roxburghii against AChE activity as well as GABAAα5, GSK-3β, and p38α MAP-kinase genes. ACS Omega. 2021;6(31):20492–20511. doi:10.1021/acsomega.1c02340
23. Yasukawa T, Tokunaga E, Ota H, Sugita H, Martyn JA, Kaneki M. S-nitrosylation-dependent inactivation of Akt/protein kinase B in insulin resistance. J Biol Chem. 2005;280:7511–7518. doi:10.1074/jbc.M411871200
24. Yamashita N, Yashiro M, Ogawa H, et al. Metabolic pathway catalyzed by vanin-1 pantetheinase plays a suppressive role in influenza virus replication in human alveolar epithelial A549 cells. Biochem Biophys Res Commun. 2017;489(4):466–471. doi:10.1016/j.bbrc.2017.05.172
25. Chen S, Zhang W, Sun C, et al. Systemic nanoparticle-mediated delivery of pantetheinase vanin-1 regulates lipolysis and adiposity in abdominal white adipose tissue. Adv Sci. 2021;8(12):e2101789. doi:10.1002/advs.202101789
26. Ferreira DW, Naquet P, Manautou JE. Influence of vanin-1 and catalytic products in liver during normal and oxidative stress conditions. Curr Med Chem. 2015;22(20):2407–2416. doi:10.2174/092986732220150722124307
27. Metwaly AM, Elmoghazy HM, Hussein MA, Abdel-Aziz A, Elmasry SA. CAPE improves vanin-1/AKT/miRNA-203 signaling pathways in DSS-induced ulcerative colitis. Biomed Res Ther. 2022;9(9):5313–5325. doi:10.15419/bmrat.v9i9.769
28. Baikpour M, Baikpour M, Hosseini M, Sarveazad A. Variations in levels of interleukins and adiponectin in normal and obese adults; a case-control study. JMP. 2017;2(2):56–62.
29. Puavilai G, Chanprasertyotin S, Sriphrapradaeng A. Diagnostic criteria for diabetes mellitus and other categories of glucose intolerance: 1997 criteria by the expert committee on the diagnosis and classification of diabetes mellitus (ADA), 1998 WHO consultation criteria, and 1985 WHO criteria. World Health Organization. Diabetes Res Clin Pract. 1999;44(1):21–26. doi:10.1016/s0168-8227(99)00008-x
30. Fossati P, Prencipe L. Serum triacylglycerols determined colorimetrically with an enzyme that produces hydrogen peroxide. Clin Chem. 1982;1:2077–2080. doi:10.1093/clinchem/28.10.2077
31. Allain CC, Poon LS, Chan CS, Richmond W, Fu PC. Enzymatic determination of total serum cholesterol. Clin Chem. 1974;1974(4):470–475. doi:10.1093/clinchem/20.4.470
32. Burnstein M, Selvenick HR, Morfin R. Rapid method for isolation of lipoprotein from human serum with polyanions. J Lipid Res. 1970;11(11):583. doi:10.1016/S0022-2275(20)42943-8
33. Barber RD, Harmer DW, Coleman RA, Clark BJ. GAPDH as a housekeeping gene: analysis of GAPDH mRNA expression in a panel of 72 human tissues. Physiol Genomics. 2005;21(3):389–395. doi:10.1152/physiolgenomics.00025.2005
34. Bae JC, Cho NH, Suh S, et al. Cardiovascular disease incidence, mortality and case fatality related to diabetes and metabolic syndrome: a community-based prospective study (Ansung-Ansan cohort 2001–12). J Diabetes. 2015;7(6):791–799. doi:10.1111/1753-0407.12248
35. Sung KC, Ryu S, Cheong ES, et al. All cause and cardiovascular mortality among Koreans: effects of obesity and metabolic health. Am J Prev Med. 2015;49:62–71. doi:10.1016/j.amepre.2015.02.010
36. Oh CM, Park JH, Chung HS, et al. Effect of body shape on the development of cardiovascular disease in individuals with metabolically healthy obesity. Medicine. 2020;99(38):e22036. doi:10.1097/MD.0000000000022036
37. Tsatsoulis A, Paschou SA. Metabolically healthy obesity: criteria, epidemiology, controversies, and consequences. Curr Obes Rep. 2020;9(2):109–120. doi:10.1007/s13679-020-00375-0
38. Tobias DK, Pan A, Jackson CL, et al. Body-mass index and mortality among adults with incident type 2 diabetes. N Engl J Med. 2014;370(3):233–244. doi:10.1056/NEJMoa1304501
39. Santhanam P, Masannat Y. Body mass index, mortality, and the obesity paradox in type 2 diabetes mellitus: the effect of hypertension. South Med J. 2014;107(6):361. doi:10.14423/01.SMJ.0000450710.46174.e2
40. Moffit JS, Koza-Taylor PH, Holland RD, et al. Differential gene expression in mouse liver associated with the hepatoprotective effect of clofibrate. Toxicol Appl Pharmacol. 2007;222(2):169–179. doi:10.1016/j.taap.2007.04.008
41. González MC, Corton JC, Cattley RC, Herrera E, Bocos C. Peroxisome proliferator-activated receptor alpha (PPAR alpha) agonists down-regulate alpha2-macroglobulin expression by a PPAR alpha-dependent mechanism. Biochimie. 2009;91(8):1029–1035. doi:10.1016/j.biochi.2009.05.007
42. Chen X, Li M, Sun WP, et al. Agonist-induced down-regulation of hepatic glucocorticoid receptor via peroxisome proliferator-activated receptor in SD rats. Zhonghua Yi Xue Za Zhi. 2009;89(46):3276–3279.
43. Chen X, Li M, Sun W, et al. Peroxisome proliferator-activated receptor alpha agonist-induced down-regulation of hepatic glucocorticoid receptor expression in SD rats. Biochem Biophys Res Commun. 2008;368(4):865–870. doi:10.1016/j.bbrc.2008.01.152
44. Shimosaka T, Makarova KS, Koonin EV, Atomi H. Identification of dephospho-coenzyme A (dephospho-CoA) kinase in thermococcus kodakarensis and elucidation of the entire CoA biosynthesis pathway in archaea. mBio. 2019;10(4):e01146–19. doi:10.1128/mBio.01146-19
45. Roisin-Bouffay C, Castellano R, Valéro R, Chasson L, Galland F, Naquet P. Mouse vanin-1 is cytoprotective for islet beta cells and regulates the development of type 1 diabetes. Diabetologia. 2008;51(7):1192–1201. doi:10.1007/s00125-008-1017-9
46. Nitto T, Inoue T, Node K. Alternative spliced variants in the pantetheinase family of genes expressed in human neutrophils. Gene. 2008;426(1–2):57–64. doi:10.1016/j.gene.2008.08.019
47. Dammanahalli KJ, Stevens S, Terkeltaub R. Vanin-1 pantetheinase drives smooth muscle cell activation in post-arterial injury neointimal hyperplasia. PLoS One. 2012;7(6):e39106. doi:10.1371/journal.pone.0039106
48. Nitto T, Onodera K. Linkage between coenzyme a metabolism and inflammation: roles of pantetheinase. J Pharmacol Sci. 2013;123(1):1–8. doi:10.1254/jphs.13r01cp
49. Rommelaere S, Millet V, Gensollen T, et al. PPAR alpha regulates the production of serum vanin-1 by liver. FEBS Lett. 2013;587(22):3742–3748. doi:10.1016/j.febslet.2013.09.046
50. Van Diepen JA, Jansen PA, Ballak DB, et al. PPAR-alpha dependent regulation of vanin-1 mediates hepatic lipid metabolism. J Hepatol. 2014;61(2):366–372. doi:10.1016/j.jhep.2014.04.013
51. Martin PG, Guillou H, Lasserre F, et al. Novel aspects of PPAR-alpha-mediated regulation of lipid and xenobiotic metabolism revealed through a nutrigenomic study. Hepatology. 2007;45(3):767–777. doi:10.1002/hep.21510
52. Francis GA, Fayard E, Picard F, Auwerx J. Nuclear receptors and the control of metabolism. Annu Rev Physiol. 2003;65:261–311. doi:10.1146/annurev.physiol.65.092101.142528
53. Yu S, Viswakarma N, Batra SK, Samabasiva RM, Reddy JK. Identification of promethin and PGLP as two novel up-regulated genes in PPAR-gamma1-induced adipogenic mouse liver. Biochimie. 2004;86:743–761. doi:10.1016/j.biochi.2004.09.015
54. Abdel-Gawad SM, Ghorab MM, El-Sharief AMSh, El-Telbany FA, Abdel-Alla M. Design, synthesis, and antimicrobial activity of some new pyrazolo[3,4-d]pyrimidines. Heteroatom Chem. 2003;14:530–534. doi:10.1002/hc.10187
55. Lewis JR, Mohanty SR. Nonalcoholic fatty liver disease: a review and update. Dig Dis Sci. 2010;55:560–578. doi:10.1007/s10620-009-1081-0
56. Motomura W, Yoshizaki T, Takahashi N, et al. Analysis of vanin-1 upregulation and lipid accumulation in hepatocytes in response to a high-fat diet and free fatty acids. J Clin Biochem Nutr. 2012;51(3):163–169. doi:10.3164/jcbn.12-06
57. Hussein MA, Ismail NEM, Mohamed AH, Borik RM, Ali AA, Mosaad YO. Plasma phospholipids: a promising simple biochemical parameter to evaluate COVID-19 infection severity. Bioinform Biol Insights. 2021;15:1–14. doi:10.1177/11779322211055891
58. Boshra SA, Hussein MA. Cranberry extract as a supplemented food in treatment of oxidative stress and breast cancer induced by N-Methyl-N-Nitrosourea in female virgin rats. Int J Phytomedicine. 2016;8(2):217–227.
59. El-Gizawy HA, Hussein MA. Fatty acids profile, nutritional values, anti-diabetic and antioxidant activity of the fixed oil of malvaparviflora growing in Egypt. Int J Phytomedicine. 2015;7:219–230.
60. Gobba NAEK, Hussein A, El Sharawy DE, Hussein MA. The potential hazardous effect of exposure to iron dust in Egyptian smoking and nonsmoking welders. Arch Environ Occup Health. 2018;73(3):189–202. doi:10.1080/19338244.2017.1314930
61. Hu Y, Liu W, Chen Y, et al. Combined use of fasting plasma glucose and glycated hemoglobin A1c in the screening of diabetes and impaired glucose tolerance. Acta Diabetol. 2010;47(3):231–236. doi:10.1007/s00592-009-0143-2
62. Ley SH, Harris SB, Connelly PW. Association of apolipoprotein B with incident type 2 diabetes in an aboriginal Canadian population. Clin Chem. 2010;56(4):666–670. doi:10.1373/clinchem.2009.136994
63. Badman MK, Pissios P, Kennedy AR, Koukos G, Flier JS, Maratos-Flier E. Hepatic fibroblast growth factor 21 is regulated by PPAR-alpha and is a key mediator of hepatic lipid metabolism in ketotic states. Cell Metab. 2007;5(6):426–437. doi:10.1016/j.cmet.2007.05.002
64. Li Y, Wong K, Giles A, et al. Hepatic SIRT1 attenuates hepatic steatosis and controls energy balance in mice by inducing fibroblast growth factor 21. Gastroenterology. 2014;146(2):539–49.e7. doi:10.1053/j.gastro.2013.10.059
65. Kaskow BJ, Proffitt JM, Blangero J, Moses EK, Abraham LJ. Diverse biological activities of the vascular non-inflammatory molecules - the Vanin pantetheinases. Biochem Biophys Res Commun. 2012;417(2):653–658. doi:10.1016/j.bbrc.2011.11.099
66. Jansen PA, Kamsteeg M, Rodijk-Olthuis D, et al. Expression of the vanin gene family in normal and inflamed human skin: induction by proinflammatory cytokines. J Invest Dermatol. 2009;129(9):2167–2174. doi:10.1038/jid.2009.67
67. Lu H, Zhang A, Wen D, et al. Plasma vanin-1 as a novel biomarker of sepsis for trauma patients: a prospective multicenter cohort study. Infect Dis Ther. 2021;10(2):739–751. doi:10.1007/s40121-021-00414-w
68. Andrews GK. Regulation of metallothionein gene expression by oxidative stress and metal ions. Biochem Pharmacol. 2000;59(1):95–104. doi:10.1016/s0006-2952(99)00301-9
69. Naquet P, Pitari G, Duprè S, Galland F. Role of the Vnn1 pantetheinase in tissue tolerance to stress. Biochem Soc Trans. 2014;42(4):1094–1100. doi:10.1042/BST20140092
70. Salam OM. Modulation of inflammatory paw oedema by cysteamine in the rat. Pharmacol Res. 2002;45(4):275–284. doi:10.1006/phrs.2002.0955
71. Berruyer C, Martin FM, Castellano R, Macone A, Malergue F, Garrido-Urbani S. Vanin-1−/− mice exhibit a glutathione-mediated tissue resistance to oxidative stress. Mol Cell Biol. 2004;24:7214–7224. doi:10.1128/MCB.24.16.7214-7224.2004
72. Awad MA, Aldosari SR, Abid MR. Genetic alterations in oxidant and anti-oxidant enzymes in the vascular system. Front Cardiovasc Med. 2018;5:107. doi:10.3389/fcvm.2018.00107
73. Li H, Horke S, Förstermann U. Vascular oxidative stress, nitric oxide and atherosclerosis. Atherosclerosis. 2014;237(1):208–219. doi:10.1016/j.atherosclerosis.2014.09.001
74. Williams SM, Eleftheriadou A, Alam U, Cuthbertson DJ, Wilding JPH. Correction to cardiac autonomic neuropathy in obesity, metabolic syndrome and prediabetes: a narrative review. Diabetes Ther. 2019;10(6):2023. doi:10.1007/s13300-019-00705-z
75. Zhang B, Lo C, Shen L, et al. The role of vanin-1 and oxidative stress-related pathways in distinguishing acute and chronic pediatric ITP. Blood. 2011;117(17):4569–4579. doi:10.1182/blood-2010-09-304931
76. Elsalakawy WA, Ali MA, Hegazy MG, Farweez BA. Value of vanin-1 assessment in adult patients with primary immune thrombocytopenia. Platelets. 2014;25(2):86–92. doi:10.3109/09537104.2013.782484
77. Tinahones FJ, Murri-Pierri M, Garrido-Sánchez L, et al. Oxidative stress in severely obese persons is greater in those with insulin resistance. Obesity. 2009;17(2):240–246. doi:10.1038/oby.2008.536
78. Bausenwein J, Serke H, Eberle K, et al. Elevated levels of oxidized low-density lipoprotein and of catalase activity in follicular fluid of obese women. Mol Hum Reprod. 2010;16(2):117–124. doi:10.1093/molehr/gap078
79. Zhang R, Liu R, Zong W. Bisphenol S interacts with catalase and induces oxidative stress in mouse liver and renal cells. J Agric Food Chem. 2016;64(34):6630–6640. doi:10.1021/acs.jafc.6b02656
80. Ighodaro OM, Akinloy OA. First line defence antioxidants-superoxide dismutase (SOD), catalase (CAT) and glutathione peroxidase (GPX): their fundamental role in the entire antioxidant defence grid. Alexandria J Med. 2018;54:287–293. doi:10.1016/j.ajme.2017.09.001
81. Rindler PM, Plafker SM, Szweda LI, Kinter M. High dietary fat selectively increases catalase expression within cardiac mitochondria. J Biol Chem. 2013;288(3):1979–1990. doi:10.1074/jbc.M112.412890
82. Mehebik N, Jaubert AM, Sabourault D, Giudicelli Y, Ribière C. Leptin-induced nitric oxide production in white adipocytes is mediated through PKA and MAP kinase activation. Am J Physiol Cell Physiol. 2005;289(2):C379–87. doi:10.1152/ajpcell.00320.2004
83. Ribière C, Jaubert AM, Sabourault D, Lacasa D, Giudicelli Y. Insulin stimulates nitric oxide production in rat adipocytes. Biochem Biophys Res Commun. 2002;291(2):394–399. doi:10.1006/bbrc.2002.6444
84. Martin F, Penet MF, Malergue F, et al. Vanin-1(-/-) mice show decreased NSAID- and Schistosoma-induced intestinal inflammation associated with higher glutathione stores. J Clin Invest. 2004;113(4):591–597. doi:10.1172/JCI19557
85. Montes de Oca M, Torres SH, De Sanctis J, Mata A, Hernandez N, Talamo C. Skeletal muscle inflammation and nitric oxide in patients with COPD. Eur Respir J. 2005;26:390–397.
86. McConell GK, Bradley SJ, Stephens TJ, Canny BJ, Kingwell BA, Lee-Young RS. Skeletal muscle nNOS mu protein content is increased by exercise training in humans. Am J Physiol Regul Integr Comp Physiol. 2007;293:R821–R828.
87. Lu M, Li P, Pferdekamper J, et al. Inducible nitric oxide synthase deficiency in myeloid cells does not prevent diet-induced insulin resistance. Mol Endocrinol. 2010;24:1413–1422.
88. Torres SH, De Sanctis JB, Hernandez N, Finol HJ. Inflammation and nitric oxide production in skeletal muscle of type 2 diabetic patients. J Endocrinol. 2004;181:419–427.
89. Lien CC, Au LC, Tsai YL, Ho LT, Juan CC. Short-term regulation of tumor necrosis factor-alpha-induced lipolysis in 3T3-L1 adipocytes is mediated through the inducible nitric oxide synthase/nitric oxide-dependent pathway. Endocrinology. 2009;150(11):4892–4900. doi:10.1210/en.2009-0403
90. Juan CC, Lien CC, Chang CL, Huang YH, Ho LT. Involvement of iNOS and NO in TNF-alpha-downregulated resistin gene expression in 3T3-L1 adipocytes. Obesity. 2008;16(6):1219–1225. doi:10.1038/oby.2008.200
91. Batra J, Chatterjee R, Ghosh B. Inducible nitric oxide synthase (iNOS): role in asthma pathogenesis. Indian J Biochem Biophys. 2007;44(5):303–309.
 © 2022 The Author(s). This work is published and licensed by Dove Medical Press Limited. The full terms of this license are available at https://www.dovepress.com/terms.php and incorporate the Creative Commons Attribution - Non Commercial (unported, v3.0) License.
By accessing the work you hereby accept the Terms. Non-commercial uses of the work are permitted without any further permission from Dove Medical Press Limited, provided the work is properly attributed. For permission for commercial use of this work, please see paragraphs 4.2 and 5 of our Terms.
© 2022 The Author(s). This work is published and licensed by Dove Medical Press Limited. The full terms of this license are available at https://www.dovepress.com/terms.php and incorporate the Creative Commons Attribution - Non Commercial (unported, v3.0) License.
By accessing the work you hereby accept the Terms. Non-commercial uses of the work are permitted without any further permission from Dove Medical Press Limited, provided the work is properly attributed. For permission for commercial use of this work, please see paragraphs 4.2 and 5 of our Terms.